plant site 1 groundwater managment area …
TRANSCRIPT

Transmitted Via Overnight Courier
January 30, 2013
Mr. Richard Fisher U.S. Environmental Protection Agency 5 Post Office Square- Suite 100 Boston, Massachusetts 02109-3912
Re: GE-Pittsfield/Housatonic River Site Groundwater Management Area 1 (GECD310)
GE 159 Plastics Avenue Pittsfield, MA 01201 USA
Groundwater Quality Monitoring Interim Report for Fall 2012
Dear Mr. Fisher:
In accordance with GE's approved Baseline Monitoring Program Proposal for Plant Site 1 Groundwater Management Area (September 2000) and Plant Site 1 Groundwater Management Area Groundwater Quality Monitoring Interim Report for Spring 2008 (July 2008), enclosed is the Plant Site 1 Groundwater Management Area Groundwater Quality Monitoring Interim Report for Fall 2012. This report summarizes activities performed as part of the Plant Site 1 Groundwater Management Area (GMA 1) groundwater quality monitoring program during fall 2012, including the results of the latest groundwater sampling and analysis round at GMA 1. In addition, certain modifications to the spring 2013 interim monitoring program at GMA 1 are proposed to facilitate submittal of a Baseline Assessment Final Report and Long-Term Monitoring Proposal for GMA 1 following the next sampling event.
Please call me if you have any questions regarding this report.
Richard W. Gates Remediation Project Manager
Enclosure
cc: Dean Tagliaferro, EPA Tim Conway, EPA (cover letter only) Holly Inglis, EPA (CD-ROM) Rose Howell, EPA (CD-ROM) Robert Leitch, USACE (CD-ROM) Linda Palmieri, Weston (2 hard copies & CD-ROM) Eva Tor, MDEP (CD-ROM) Michael Gorski, MDEP (CD-ROM) John Ziegler, MDEP (2 hard copies & CD-ROM) Karen Pelto, MDEP (cover letter only) Nancy E. Harper, MA AG (cover letter only) Mayor Daniel L. Bianchi, City of Pittsfield Corydon Thurston, Executive Director,
PEDA (CD-ROM)
Corpvrute En,.ironmental Prc.•.;w.vns
Barbara Landau, Noble & Wickersham (CD-ROM) James Gagnon, O'Reilly, Talbot & Okun David Langseth, Gradient Corporation Rod McLaren, GE (cover letter only) James Nuss, ARCADIS James Bieke, Sidley Austin John Ciampa, SPECTRA Jack Yablonsky, Berkshire Gas Richard Nasman, Berkshire Gas (cover letter only) Ishwar Murarka, Ish, Inc. Public Information Repositories GE Internal Repositories

General Electric Company Pittsfield, Massachusetts
Plant Site 1 Groundwater Management Area Groundwater Quality Monitoring Interim Report for Fall 2012
January 2013

Plant Site 1 Groundwater Management Area Groundwater Quality Monitoring Interim Report for Fall 2012 (Fall 2012 GMA 1 Groundwater Quality Report) General Electric Company Pittsfield, Massachusetts
Prepared for:
General Electric Company
Pittsfield, Massachusetts
Prepared by:
ARCADIS of New York, Inc.
6723 Towpath Road
Syracuse
New York 13214-0066
Tel 315.446.9120
Fax 315.449.0017
Our Ref.:
B0010113.0003
Date:
January 30, 2013

G:\GE\GE_Pittsfield_CD_GMA_1\Reports and Presentations\Fall 2012 GW Qual Rpt\0221311324Rpt.doc i
Table of Contents
1. Introduction 1
1.1 General 1
1.2 Background Information 3
1.3 Format of Document 6
2. Field and Analytical Procedures 7
2.1 General 7
2.2 Monitoring Well Inspections and Repairs 7
2.3 Groundwater Elevation Monitoring 8
2.4 Groundwater Sampling and Analysis 8
3. Fall 2012 Groundwater Analytical Results 12
3.1 General 12
3.2 Groundwater Sample Results 12
3.2.1 VOC Results 12
3.2.2 SVOC Results 12
3.2.3 PCDD/PCDF Results 12
3.2.4 Inorganic Constituent Results 13
3.3 Summary of Investigations/Monitoring Performed by Others 13
3.3.1 PEDA Redevelopment Activities 13
3.3.2 Adjacent MCP Disposal Site Monitoring Results 16
4. Overall Assessment of Groundwater Analytical Results 17
4.1 General 17
4.2 Groundwater Quality Performance Standards 17
4.3 Groundwater Quality – Fall 2012 20
4.3.1 Fall 2012 Groundwater Results Relative to GW-2 Performance Standards 20
4.3.2 Fall 2012 Groundwater Results Relative to GW-3 Performance Standards 20
4.3.3 Fall 2012 Comparison to Upper Concentration Limits 21
4.4 Overall Assessment of Groundwater Analytical Results 21

G:\GE\GE_Pittsfield_CD_GMA_1\Reports and Presentations\Fall 2012 GW Qual Rpt\0221311324Rpt.doc ii
Table of Contents
5. Proposed Monitoring Program Modifications and Schedule of` Future Activities 23
5.1 General 23
5.2 Previously Scheduled Sampling Activities 23
5.3 Proposed Modifications to Interim Monitoring Program for Spring 2013 24
5.4 Field Activities Schedule 27
5.5 Reporting Schedule 27
Tables
1 Fall 2012 Interim Groundwater Quality Monitoring Wells
2 Monitoring Well Construction
3 Groundwater Elevation Data – Fall 2012 Monitoring Round
4 Field Parameter Measurements – Fall 2012
5 Comparison of Groundwater Analytical Results to MCP Method 1 GW-2 Standards
6 Comparison of Groundwater Analytical Results to MCP Method 1 GW-3 Standards
7 Comparison of Groundwater Analytical Results to MCP UCLs for Groundwater
8 Proposed Spring 2013 Interim Groundwater Quality Monitoring Program Sampling Activities
Figures
1 Groundwater Management Areas
2 Fall 2012 Groundwater Sampling Locations
3 Water Table Contour Map - Fall 2012
4 Proposed Spring 2013 Groundwater Quality Monitoring Program Activities

G:\GE\GE_Pittsfield_CD_GMA_1\Reports and Presentations\Fall 2012 GW Qual Rpt\0221311324Rpt.doc iii
Table of Contents
Appendices
A Summary of Fall 2012 Field Monitoring/Sampling Data
B Fall 2012 Groundwater Analytical Results
C Data Validation Report
D Historical Groundwater Data
E Monitoring Results for Adjacent MCP Disposal Site
F City of Pittsfield Drinking Water Quality Reports

G:\GE\GE_Pittsfield_CD_GMA_1\Reports and Presentations\Fall 2012 GW Qual Rpt\0221311324Rpt.doc 1
Fall 2012 GMA 1 Groundwater
Quality Report
General Electric Company Pittsfield, Massachusetts
1. Introduction
1.1 General
On October 27, 2000, a Consent Decree (CD) executed in 1999 by the General Electric
Company (GE), the United States Environmental Protection Agency (EPA), the
Massachusetts Department of Environmental Protection (MDEP), and several other
government agencies was entered by the United States District Court for the District of
Massachusetts. The CD governs (among other things) the performance of response
actions to address polychlorinated biphenyls (PCBs) and other hazardous constituents in
soil, sediment, and groundwater in several Removal Action Areas (RAAs) located in or near
Pittsfield, Massachusetts that collectively comprise the GE-Pittsfield/Housatonic River Site
(the Site).
For groundwater and non-aqueous-phase liquid (NAPL), the RAAs at and near the GE
Pittsfield facility have been divided into five separate Groundwater Management Areas
(GMAs), which are illustrated on Figure 1. These GMAs are described, together with the
Performance Standards established for the response actions at and related to them, in
Section 2.7 of the Statement of Work for Removal Actions Outside the River (SOW)
(Appendix E to the CD), with further details presented in Attachment H to the SOW
(Groundwater/NAPL Monitoring, Assessment, and Response Programs). This report
relates to the Plant Site 1 Groundwater Management Area, also known as and referred to
herein as GMA 1.
In September 2000, GE submitted a Baseline Monitoring Program Proposal for Plant Site 1
Groundwater Management Area (GMA 1 Baseline Monitoring Proposal). The GMA 1
Baseline Monitoring Proposal summarized the hydrogeologic information available at that
time for GMA 1 and proposed groundwater and NAPL monitoring activities (incorporating as
appropriate those activities that were in place at that time) for the baseline monitoring period
at this GMA. EPA provided conditional approval of the GMA 1 Baseline Monitoring
Proposal by letter of March 20, 2001. Thereafter, certain modifications were made to the
GMA 1 baseline monitoring program as a result of EPA approval conditions and/or findings
during field reconnaissance of the selected monitoring locations and, subsequently, during
implementation of the baseline monitoring program.
The baseline monitoring program, which was initiated in fall 2001, consisted of four semi-
annual groundwater quality sampling events followed by preparation and submittal of
reports summarizing the groundwater monitoring results and, as appropriate, proposal of
modifications to the monitoring program. The fourth baseline monitoring report for GMA 1,
entitled Plant Site 1 Groundwater Management Area Baseline Groundwater Quality Interim
Report for Spring 2003 (Spring 2003 GMA 1 Groundwater Quality Report), was submitted
to EPA on July 30, 2003. Section 6.1.3 of Attachment H to the SOW provides that if the

G:\GE\GE_Pittsfield_CD_GMA_1\Reports and Presentations\Fall 2012 GW Qual Rpt\0221311324Rpt.doc 2
Fall 2012 GMA 1 Groundwater
Quality Report
General Electric Company Pittsfield, Massachusetts
two-year “baseline” period ends prior to the completion of soil-related response actions at all
the RAAs in a GMA, GE may make a proposal to EPA to modify and/or extend the Baseline
Monitoring Program based on the results of the initial assessment and the estimated timing
of future response actions at the RAAs in the GMA. The approved GMA 1 Baseline
Monitoring Proposal also allows GE to propose a modification and/or extension of the
baseline monitoring program based on the results of the initial assessment and the
estimated timing of future response actions. The Spring 2003 GMA 1 Groundwater Quality
Report contained such a proposal to modify and extend baseline groundwater quality
monitoring activities at GMA 1 (under a program referred to as the interim monitoring
program) until such time as the soil-related Removal Actions at the GMA 1 RAAs are
completed and the specific components of a long-term groundwater quality monitoring
program are determined. EPA conditionally approved the Spring 2003 GMA 1 Groundwater
Quality Report by letter dated September 23, 2003. Under the approved interim monitoring
program, annual water quality sampling (alternating between the spring and fall seasons) at
selected GMA 1 wells began in spring 2004, following a limited sampling event in fall 2003
involving the collection of groundwater samples from six wells that did not yet have four
complete rounds of sampling as part of the baseline monitoring program. Since initiation of
the interim monitoring program, certain modifications have been made with EPA approval to
the wells included in the program, the sampling schedule, and the analytical parameters.
The monitoring wells sampled during a supplemental sampling event conducted in fall 2012
are shown on Figure 2.
As part of the interim groundwater quality monitoring program, GE is required to submit
reports after each groundwater sampling event to summarize the groundwater monitoring
results and related activities and, as appropriate, propose modifications to the monitoring
program. The results of the most recent round of interim groundwater sampling activities
performed at this GMA in spring 2012 were provided in GE’s July 2012 Plant Site 1
Groundwater Management Area Groundwater Quality Interim Report for Spring 2012 (Spring 2012 GMA 1 Groundwater Quality Report), which was conditionally approved by
EPA in a letter dated December 19, 2012.
GE performed sampling and analysis at select GMA 1 monitoring wells in fall 2012 in
accordance with proposals contained in the Spring 2012 GMA 1 Groundwater Quality
Report, as conditionally approved by EPA. Those activities included: semi-annual sampling
and analysis of one GMA 1 monitoring well to evaluate compliance with GW-2 criteria, and
supplemental sampling at two wells to evaluate previous exceedances or to supplement the
existing database for certain constituents.
The results of the interim groundwater sampling activities conducted in fall 2012 are
provided in this Plant Site 1 Groundwater Management Area Groundwater Quality
Monitoring Interim Report for Fall 2012 (Fall 2012 GMA 1 Groundwater Quality Report). As
requested by EPA in a March 29, 2007 letter conditionally approving the Plant Site 1

G:\GE\GE_Pittsfield_CD_GMA_1\Reports and Presentations\Fall 2012 GW Qual Rpt\0221311324Rpt.doc 3
Fall 2012 GMA 1 Groundwater
Quality Report
General Electric Company Pittsfield, Massachusetts
Groundwater Management Area Groundwater Quality Monitoring Interim Report for Fall 2006 (Fall 2006 GMA 1 Groundwater Quality Report), this report also contains groundwater
elevation data collected at GMA 1 during the fall semi-annual monitoring event performed in
October 2012 (both in data tables and plotted in groundwater elevation contour maps). GE
will continue to present detailed discussions of GE’s groundwater flow monitoring, including
information on groundwater elevations, flow direction, and seasonal trends, as well as
assessments of the presence and extent of NAPL at GMA 1 (including summaries of GE’s
NAPL recovery efforts), in the separate semi-annual reports submitted under GE’s NAPL
monitoring program. The most recent GMA 1 NAPL monitoring report (covering the Spring
2012 monitoring period) was submitted to EPA in August 2012, and the NAPL monitoring
report for the fall 2012 monitoring period will be submitted to EPA in February 2013.
1.2 Background Information
As discussed above, the CD and SOW provide for the performance of groundwater-related
monitoring and NAPL removal activities at a number of GMAs. Some of these GMAs,
including GMA 1, incorporate multiple RAAs to reflect the fact that groundwater may flow
between RAAs. GMA 1 encompasses 11 RAAs and occupies an area of approximately
215 acres (Figure 1). The RAAs within GMA 1 are:
RAA 1 - 40s Complex;
RAA 2 - 30s Complex;
RAA 3 - 20s Complex;
RAA 4 - East Street Area 2-South;
RAA 5 - East Street Area 2-North;
RAA 6 - East Street Area 1-North;
RAA 12 - Lyman Street Area;
RAA 13 - Newell Street Area II;
RAA 14 - Newell Street Area I;
RAA 17 - Silver Lake Area; and
RAA 18 - East Street Area 1-South.
GMA 1 contains a combination of GE-owned and non-GE-owned industrial areas,
residential properties, and recreational areas, including land formerly owned by GE that has
been, or will be, transferred to the Pittsfield Economic Development Authority (PEDA)
pursuant to the Definitive Economic Development Agreement (DEDA). GE has transferred
to PEDA properties in the former 20s Complex, former 30s Complex, former 40s Complex,
and former 19s Complex (a portion of East Street Area 2-North), as well as portions of

G:\GE\GE_Pittsfield_CD_GMA_1\Reports and Presentations\Fall 2012 GW Qual Rpt\0221311324Rpt.doc 4
Fall 2012 GMA 1 Groundwater
Quality Report
General Electric Company Pittsfield, Massachusetts
Woodlawn Avenue. The Housatonic River flows through the southern portion of this GMA,
while Silver Lake is located along the western boundary. Certain portions of this GMA
originally consisted of land associated with oxbows or low-lying areas of the Housatonic
River. Re-channelization and straightening of the Housatonic River in the early 1940s by
the City of Pittsfield and the United States Army Corps of Engineers (USACE) separated
several of these oxbows and low-lying areas from the active course of the river. These
oxbows and low-lying areas were subsequently filled with various materials from a variety of
sources, resulting in the current surface elevations and topography.
Groundwater flow patterns at GMA 1 generally reflect the topography of the site with flow
toward the Housatonic River, except where influenced by features such as Silver Lake, the
recharge pond, or by recovery systems which are pumped to induce hydraulic depressions
in their vicinity. Although variations occur in groundwater elevations at various wells or
portions of GMA 1, overall groundwater flow patterns have remained relatively stable for
several years. As shown on Figure 3, groundwater flow conditions observed during fall 2012
display the typical patterns observed at GMA 1.
As discussed in Section 1.1 above, the CD and the SOW provide for the performance of
groundwater-related Removal Actions at the GMAs, including the implementation of
groundwater monitoring, assessment, and recovery programs. In general, these programs
consist of a baseline monitoring program conducted over a period of at least two years to
establish existing groundwater conditions and a long-term monitoring program performed to
assess groundwater conditions over time and to verify the attainment of the Performance
Standards for groundwater. As set forth in the GMA 1 Baseline Monitoring Proposal and
Addendum, the baseline monitoring program at this GMA initially involved a total of 65
monitoring wells. Subsequent modifications to the program resulted in the addition of one
well (LSSC-08I) and replacement of five wells with substitute monitoring wells (ESA2S-52
for ES2-17, MW-3R for MW-3, GMA1-13 for 95-9, ESA1S-33 for ES1-8, and ES1-23R for
ES1-23). All of these wells were monitored for groundwater elevations on a quarterly basis
and sampled on a semi-annual basis for analysis of PCBs and/or certain other constituents
listed in Appendix IX of 40 CFR Part 264, plus three additional constituents -- benzidine, 2-
chloroethylvinyl ether, and 1,2-diphenyhydrazine (Appendix IX+3). The specific
groundwater quality parameters for each individual well were selected based on the
monitoring objectives of the well.
After the fourth baseline sampling event at most of the wells in GMA 1 in spring 2003, EPA
approved the implementation of the interim monitoring program until the completion of the
soil-related Removal Actions at the GMA 1 RAAs, at which time GE is to submit a final
report on the baseline program and propose a long-term monitoring program. In the Spring
2003 GMA 1 Groundwater Quality Report, GE described its proposed interim groundwater
quality monitoring program. Certain specific monitoring tasks were to be performed in fall
2003, and GE submitted its Fall 2003 GMA 1 Groundwater Quality Report providing the

G:\GE\GE_Pittsfield_CD_GMA_1\Reports and Presentations\Fall 2012 GW Qual Rpt\0221311324Rpt.doc 5
Fall 2012 GMA 1 Groundwater
Quality Report
General Electric Company Pittsfield, Massachusetts
results of those tasks. Beginning in spring 2004, as approved by EPA, the interim
groundwater quality monitoring program was to consist of annual sampling (alternating
between the spring and fall seasons) and analysis for select constituents at 22 GMA 1
wells. Locations selected for interim groundwater quality monitoring were wells
downgradient of known NAPL areas/recovery systems where no additional hydraulic
controls are in place, and/or those wells where analytical results from the baseline
monitoring rounds did not clearly indicate whether long-term monitoring would be
necessary. Supplemental sampling outside of that annual schedule, including additional
baseline characterization activities, has also been conducted at certain monitoring wells as
required by EPA.
Since the spring 2004 groundwater sampling event, GE has presented the results of each
sampling event in interim and supplemental groundwater quality monitoring reports and,
based on those results, has proposed and, following EPA approval, implemented
modifications to the interim program. A number of program modifications were made in
spring 2006, following revisions to the Massachusetts Contingency Plan (MCP) Method 1
groundwater standards that took effect on April 3, 2006. On February 14, 2008, additional
revisions to the MCP Method 1 groundwater standards took effect, and, as required by
Condition 4 of EPA’s April 8, 2008 conditional approval letter, the Spring 2008 GMA 1
Groundwater Quality Report discussed the revised standards, evaluated their implications
on the interim groundwater quality monitoring program, and proposed further modifications
to that program in response to those new standards.
At the present time, GE has completed the soil-related Removal Actions at all RAAs that
comprise GMA 1 with the exception of the Silver Lake Area, where the soil- and sediment-
related Removal Action is currently ongoing and is expected to be completed in the late
summer or fall of 2013. In its December 19, 2012 conditional approval letter for the Spring
2012 GMA 1 Groundwater Quality Report, EPA directed that, in anticipation of the soil and
sediment remediation actions at GMA 1 being substantially complete, GE should submit a
Baseline Assessment Final Report and Long-Term Monitoring Proposal following the next
sampling event in spring 2013. That submittal is discussed further in Section 5.5 below.
A separate non-GE-related disposal site, as designated under the MCP, is located on an
adjacent property near the northern edge of the Lyman Street Area. This disposal site is
the O’Connell Mobil Station site (MDEP Site No. 1-13347) (also referred to as the “East
Street Mobil Site”) at 730 East Street. GE understands this site is currently being
addressed by O’Connell Oil Associates, Inc. to satisfy the requirements of Massachusetts
General Laws Chapter 21E and the MCP. Available documentation indicates that soluble-
phase contaminants related to gasoline releases from the East Street Mobil Site may have
migrated onto GMA 1. GE is required to include available monitoring results from response
actions performed at this adjacent site in the groundwater monitoring reports for GMA 1, to
the extent that information is available to GE. To fulfill this requirement, GE conducted an

G:\GE\GE_Pittsfield_CD_GMA_1\Reports and Presentations\Fall 2012 GW Qual Rpt\0221311324Rpt.doc 6
Fall 2012 GMA 1 Groundwater
Quality Report
General Electric Company Pittsfield, Massachusetts
online MDEP file search in December 2012 to review any reports that have been submitted
regarding this site since submittal of the spring 2012 GMA 1 Groundwater Quality Report.
The results of that file search, including a summary of the report that was reviewed, is
provided in Section 3.3.2.
1.3 Format of Document
The remainder of this report is presented in four sections. Section 2 describes the
groundwater quality-related activities performed at GMA 1 in fall 2012. Section 3 presents
the analytical results obtained during the fall 2012 sampling event. Section 4 provides a
summary of the applicable groundwater quality Performance Standards identified in the CD
and SOW, and provides an assessment of the results of the fall 2012 activities, including a
comparison to those Performance Standards. Finally, Section 5 discusses a number of
proposed modifications to the GMA 1 interim groundwater quality monitoring program for
spring 2013, summarizes the schedule for future field and reporting activities related to
groundwater quality at GMA 1, and describes the forthcoming Baseline Assessment Final
Report and Long-Term Monitoring Proposal for GMA 1.

G:\GE\GE_Pittsfield_CD_GMA_1\Reports and Presentations\Fall 2012 GW Qual Rpt\0221311324Rpt.doc 7
Fall 2012 GMA 1 Groundwater
Quality Report
General Electric Company Pittsfield, Massachusetts
2. Field and Analytical Procedures
2.1 General
The activities conducted as part of the interim groundwater monitoring program during fall
2012, and summarized herein, primarily involved the measurement of groundwater levels
and the collection and analysis of groundwater samples at select monitoring wells within
GMA 1, as described in Table 1. In addition, GE performed well maintenance activities at
selected locations when such needs were identified. The construction details of the wells
that were sampled in fall 2012 are provided in Table 2 and the fall 2012 field sampling data
are presented in Appendix A.
This section discusses the field procedures used to measure site groundwater levels and
collect groundwater samples, as well as the methods used to analyze the groundwater
samples. All activities were performed in general accordance with GE’s approved Field
Sampling Plan/Quality Assurance Project Plan (FSP/QAPP).
2.2 Monitoring Well Inspections and Repairs
In fall 2012, monitoring well maintenance evaluations were performed at all wells sampled
during the interim groundwater sampling event and at all other wells included in the interim
groundwater quality monitoring program. Any minor maintenance needs (e.g., replacement
of bolts, locks, or well caps) were listed in the comments section of the groundwater
sampling field logs. Wells where major maintenance needs (e.g., adjustments made to
surface completion, modifications made to inner casing) were identified were flagged for
performance of a formal well inventory. The wells sampled in fall 2012 did not have any
major maintenance requirements or issues that would impact the collection of samples
during this round. The well maintenance activities conducted by GE in fall 2012 are
summarized in Table A-1 of Appendix A. As noted in that table, GE has addressed all
maintenance needs that were identified for the groundwater quality monitoring wells at
GMA 1.
It should also be noted that certain GMA 1 monitoring wells have recently been resurveyed,
including wells where adjustments or repairs were made to the well casings or to evaluate
anomalous monitoring results. GE has utilized the most up-to-date survey data available in
the well specifications provided in Table 2 and, for wells where casing adjustments were
made prior to the semi-annual monitoring event, in the calculations of groundwater
elevations listed in Table 3.

G:\GE\GE_Pittsfield_CD_GMA_1\Reports and Presentations\Fall 2012 GW Qual Rpt\0221311324Rpt.doc 8
Fall 2012 GMA 1 Groundwater
Quality Report
General Electric Company Pittsfield, Massachusetts
2.3 Groundwater Elevation Monitoring
GE conducted the fall 2012 semi-annual groundwater elevation monitoring round at GMA 1
from October 23 through October 25 2012. This activity involved the collection of
groundwater elevation data at the locations listed in Table 3. Groundwater levels and NAPL
thicknesses (where NAPL was present) were measured in accordance with procedures
specified in GE’s approved FSP/QAPP. The groundwater elevation data presented in
Table 3 from wells screened across or near the water table were used to prepare a
groundwater elevation contour map for fall 2012 (Figure 3). Consistent with prior data,
groundwater was found to generally flow toward the Housatonic River.
As required by EPA, GE also recorded Housatonic River flow data collected at the USGS
gauging station in Coltsville, Massachusetts during the groundwater elevation monitoring
and sampling events. The peak daily river flow data ranged from 228 to 262 cubic feet per
second (cfs) during the fall 2012 groundwater sampling period and from 86 to 265 cfs
during the groundwater elevation monitoring event. In addition, GE monitored river
elevations at the measuring points established at the Lyman Street and Newell Street
bridges during the sampling period to further assess potential changes in river conditions
during the sampling event. Although the flow data fluctuated by almost 200 cfs during the
groundwater elevation monitoring period in fall 2012, no atypical fluctuations in river
elevation were observed. River flow data were generally uniform during the sampling
event. The Housatonic River flow data and river elevation readings are included in
Appendix A.
2.4 Groundwater Sampling and Analysis
The fall 2012 groundwater sampling event was performed on October 30 through
November 1, 2012 at the 3 monitoring wells that were scheduled for semi-annual or
supplemental sampling in fall 2012.
In the Fall 2008 GMA 1 Groundwater Quality Report, GE proposed removing well GMA1-4
from the GW-2/PCB assessment sampling program because the average annual depth to
water at this well was deeper than the 15-foot criteria for GW-2 groundwater, and because
the GW-2 designation had been previously removed from this well, with EPA approval.
However, GE proposed that it would continue to measure water levels at well GMA1-4 as
part of the remaining semi-annual PCB sampling events and would collect a groundwater
sample for PCB analysis if a depth to water of 15 feet or less was observed and there was
an adequate quantity of water in the well to collect the required sample volume. This
proposal was approved by EPA. In fall 2012, the depth to groundwater at well GMA1-4 was
19.74 feet and, therefore, GE did not attempt to collect a sample.

G:\GE\GE_Pittsfield_CD_GMA_1\Reports and Presentations\Fall 2012 GW Qual Rpt\0221311324Rpt.doc 9
Fall 2012 GMA 1 Groundwater
Quality Report
General Electric Company Pittsfield, Massachusetts
The groundwater samples at GMA 1 were collected using the low-flow techniques specified
in the FSP/QAPP, with either a bladder or peristaltic pump. The sampling methods utilized
at each well are specified in Appendix A. Each monitoring well was purged utilizing low-
flow techniques until field parameters (including temperature, pH, specific conductivity,
oxidation-reduction potential, dissolved oxygen, and turbidity) stabilized prior to sample
collection. Field parameters were measured in combination with the sampling activities at
the monitoring wells. The stabilized field parameter measurements presented in Table 4
are summarized below and the field sampling data are provided in Appendix A.
Parameter Units Range of Stabilized Readings
Turbidity Nephelometric turbidity units (NTU) 5.0 to 73.0
pH pH units 6.44 to 8.56
Specific Conductivity Millisiemens per centimeter 0.327 – 1.110
Oxidation-Reduction Potential
Millivolts 51.30 – 129.60
Dissolved Oxygen Milligrams per liter 4.0 – 8.4
Temperature Degrees Celsius 11.24 – 16.92
As shown above and in Table 4, one of the groundwater samples extracted from the
monitoring wells in this sampling event had turbidity levels greater than the target level of 50
NTU at the time the well was sampled. Well E2SC-23 went dry during purging (explained
further below), and the turbidity value of 73 NTU was obtained on the following day when
staff returned to extract samples. The turbidity readings at the other two monitoring
locations stabilized below 10 NTU. There results indicate that the sampling and
measurement procedures utilized during this sampling event were effective in obtaining
representative groundwater samples with low turbidity where evidence of recharge was
present.
The water level drawdown during purging and sampling stabilized at two of the three wells
sampled during fall 2012: one well (ESA1S-72R) stabilized within the 0.3-foot displacement
goal established in the FSP/QAPP and the other well (ESA1S-31R) stabilized following 0.88
foot of drawdown. Field staff purged at a steady rate for an additional 40 minutes at this
location while the other water quality parameters stabilized, with no additional change in
displacement. The third well (E2SC-23) continued to drawdown despite field staff attempts
to establish the point of recharge by pumping at a minimum rate, then increasing and
decreasing the flow over several intervals. During these intervals the well went dry. Field
staff returned the following day after recharge had occurred to collect samples and a final
set of water quality parameters.

G:\GE\GE_Pittsfield_CD_GMA_1\Reports and Presentations\Fall 2012 GW Qual Rpt\0221311324Rpt.doc 10
Fall 2012 GMA 1 Groundwater
Quality Report
General Electric Company Pittsfield, Massachusetts
The stabilized pH range for this sampling event was from 6.44 to 8.56 which is within the
acceptable range of 4.5 to 9.0 noted in Condition 1 of EPA’s April 8, 2008 letter to GE
providing conditional approval of the Plant Site 1 Groundwater Management Area
Groundwater Quality Monitoring Interim Report for Fall 2007. These results indicate that no
additional evaluation or data qualification for pH-sensitive parameter groups is necessary at
any of the fall 2012 sampling locations.
The collected groundwater samples were submitted to SGS Environmental Services, Inc. of
Wilmington, North Carolina (SGS) for laboratory analysis. Analytes were selected based on
the interim monitoring program requirements listed in Table 1, including:
Polychlorinated dibenzo-p-dioxins and polychlorinated dibenzofurans (PCDDs/PCDFs),
and lead: well E2SC-23;
Volatile organic compounds (VOCs) and semi-volatile organic compounds (SVOCs):
well ESA1S-31R; and
SVOCs: well ESA1S-72R.
These samples were submitted for analysis of the constituents listed below using the
following EPA methods:
Constituent EPA Method
VOCs 8260B
SVOCs 8270C
PCDDs/PCDFs 8290
Lead 6000/7000
Groundwater samples collected from well ESA1S-72R are routinely analyzed during the
interim monitoring program for VOCs, primarily to evaluate compliance with the GW-2
standards. Through spring 2012, samples from this well submitted for analysis of the VOCs
listed in GE’s FSP/QAPP were also analyzed for five select compounds listed as SVOCs in
the FSP/QAPP (1,2-dichlorobenzene, 1,3-dichlorobenzene, 1,4-dichlorobenzene, 1,2,4-
trichlorobenzene, and naphthalene) using EPA Method 8260B in accordance with a letter
from GE to EPA dated September 28, 2001. However, EPA’s May 14, 2012 letter
conditionally approving the Revised LNAPL Volatilization Assessment Work Plan for
Groundwater Management Area 1 – East Street Area 1 required GE to conduct two
sampling events at ESA1S-72R incorporating the full SVOC analyte list. That analysis was
initiated in fall 2012 (with the second round scheduled for spring 2013).

G:\GE\GE_Pittsfield_CD_GMA_1\Reports and Presentations\Fall 2012 GW Qual Rpt\0221311324Rpt.doc 11
Fall 2012 GMA 1 Groundwater
Quality Report
General Electric Company Pittsfield, Massachusetts
Following receipt of the analytical data from the laboratory, the preliminary results were
reviewed for completeness and compared to the MCP Method 1 GW-2 and GW-3
standards (where applicable), and to the MCP Upper Concentration Limits (UCLs) for
groundwater. The preliminary analytical results were presented in the next monthly report
on overall activities at the GE-Pittsfield/Housatonic River Site.
The data were validated in accordance with the FSP/QAPP and the validated results
(presented in Appendix B) were utilized in the preparation of this report. As discussed in
the validation report provided as Appendix C, 99.9% of the fall 2012 groundwater quality
data are considered to be useable, which is greater than the minimum required usability of
90% as specified in the FSP/QAPP. The SVOC, PCDD/PCDF, and lead sample results
were found to be 100% usable, while the VOC sample results were found to be 99.9%
usable. The only rejected data was the 2-chloroethylvinylether sample result from well
ESA1S-31R, where the data were rejected due to MS/MSD recovery deviations. A
duplicate sample collected and analyzed from this well provided a usable result for this
constituent (no 2-chloroethylvinylether was detected). The validated analytical results are
summarized in Section 3 and discussed in Section 4 below.

G:\GE\GE_Pittsfield_CD_GMA_1\Reports and Presentations\Fall 2012 GW Qual Rpt\0221311324Rpt.doc 12
Fall 2012 GMA 1 Groundwater
Quality Report
General Electric Company Pittsfield, Massachusetts
3. Fall 2012 Groundwater Analytical Results
3.1 General
A description of the fall 2012 groundwater analytical results is presented in this section.
The complete analytical data sets are summarized in Appendix B. Tables 5 and 6 provide a
comparison of the concentrations of all detected constituents with the currently applicable
groundwater quality Performance Standards established in the CD and SOW (and to the
5 ppm notification level for Total VOCs under the SOW for GW-2 wells located within 30
feet of a school or occupied residential structure and as a trigger level for the proposal of
interim response actions), while Table 7 compares the concentrations of detected
constituents with the UCLs for groundwater. An assessment of these results relative to
those groundwater quality Performance Standards and UCLs is provided in Section 4.
3.2 Groundwater Sample Results
The following paragraphs provide an overview of the fall 2012 analytical results from the
GMA 1 groundwater quality monitoring wells for each constituent group that was analyzed.
3.2.1 VOC Results
Groundwater samples (including a duplicate) from one monitoring well (ESA1S-31R) were
analyzed for VOCs during the fall 2012 sampling event. The VOC analytical results are
summarized in Table 5 and 7, and Table B-1 of Appendix B. Only two individual VOCs
were detected at this location: bromodichloromethane and chloroform. The total VOC
concentrations were 0.030 ppm and 0.027 in the duplicate samples from well ESA1S-31R.
As discussed further in Section 4, all detected VOC concentrations were below the
applicable Method 1 GW-2 standards.
3.2.2 SVOC Results
Groundwater samples were collected from monitoring wells ESA1S-31R and ESA1S-72R
and submitted for SVOC analysis. There were no SVOCs detected at either of the locations
sampled. The SVOC analytical results are summarized in Tables 5, 6, and 7, and Table B-
1 of Appendix B.
3.2.3 PCDD/PCDF Results
Groundwater samples from monitoring well E2SC-23 were collected for PCDD/PCDFs
analysis in fall 2012. The analytical results are summarized in Tables 6 and 7, and Table
B-1 of Appendix B. These results show that seven PCDD compounds and eleven PCDF
compounds were detected at low levels. A total Toxicity Equivalent Quotient (TEQ)

G:\GE\GE_Pittsfield_CD_GMA_1\Reports and Presentations\Fall 2012 GW Qual Rpt\0221311324Rpt.doc 13
Fall 2012 GMA 1 Groundwater
Quality Report
General Electric Company Pittsfield, Massachusetts
concentration was calculated for the PCDD/PCDF compounds in each sample using the
Toxicity Equivalency Factors (TEFs) issued by the World Health Organization (WHO) in
December 1998. In calculating those TEQs, the concentrations of individual PCDD/PCDF
compounds that were not detected were represented as one-half of the detection limit for
those compounds. The total TEQ concentrations in duplicate samples collected from this
well (3.1x10⁻⁷ ppm and 1.7x10⁻⁷ ppm) were below the applicable MCP Performance
Standard (4x10⁻⁵ ppm).
3.2.4 Inorganic Constituent Results
Filtered groundwater samples were obtained at well E2SC-23 and submitted for analysis of
lead, which was the only inorganic constituent analyzed for in fall 2012. The lead analytical
results are summarized in Tables 6, 7, and Table B-1 of Appendix B. Lead was not detected
in the original sample from this well, but was detected in a duplicate sample at an estimated
level between the Instrument Detection Limit (IDL) and the Practical Quantitation Limit
(PQL). There were no exceedances of the applicable GW-3 Performance Standard.
3.3 Summary of Investigations/Monitoring Performed by Others
3.3.1 PEDA Redevelopment Activities
Since March 2008, PEDA has conducted various activities in the areas that were
transferred to PEDA, particularly the former 20s and 30s Complexes. These activities
included:
Abandonment of several subsurface utility lines;
Installation of new subsurface utility lines;
Excavation of large areas in the former 20s and 30s Complexes as part of the
construction of a water quality basin;
Subsequent emergency excavation of the forebay associated with the basin;
Excavation for construction of a new building in the former 30s Complex by Mountain
One Financial Partners;
Removal of appurtenant and other ground-covering surface features in connection with
the above projects;

G:\GE\GE_Pittsfield_CD_GMA_1\Reports and Presentations\Fall 2012 GW Qual Rpt\0221311324Rpt.doc 14
Fall 2012 GMA 1 Groundwater
Quality Report
General Electric Company Pittsfield, Massachusetts
General site grading and earthwork; and
Landscaping and fencing.
The activities that could potentially impact the groundwater quality monitoring program in
GMA 1 are described below.
During excavation of the southeastern portion of the water quality basin (in the former 30s
Complex) on May 28, 2009, oil-stained soils and potential NAPL were observed. Based
upon discussions with EPA, MDEP, and GE, a work plan was submitted and subsequent
NAPL investigations were completed. In addition, PEDA conducted soil characterization
activities within the limits of the water quality basin to demonstrate that the applicable
Performance Standards for surface soils were met following excavation of the basin. That
investigation, which was performed as the water quality basin was excavated between June
and October 2009, involved the collection and analysis of 28 soil samples for PCBs and ten
soil samples for certain other Appendix IX+3 constituents. The results of the PEDA
investigations were documented in the two reports listed below:
NAPL Investigation Report; Pittsfield Economic Development Authority; 30s Complex;
Pittsfield, MA 01201 (NAPL Investigation Report - O’Reilly, Talbot, & Okun Associates,
Inc., November 6, 2009); and
Data Evaluation Report; Pittsfield Economic Development Authority; 30s Complex
Water Quality Basin; Pittsfield, MA 01201 (Basin Characterization Report - O’Reilly,
Talbot, & Okun Associates, Inc., November 9, 2009).
On January 8, 2010, GE submitted a letter (20s and 30s Complex Addendum) to EPA
summarizing the current status of monitoring wells in the portions of the 20s and 30s
Complexes being re-developed by PEDA. That letter contained GE’s recommendations on
the need to modify specific wells, install replacement wells or, alternatively, remove selected
wells without replacement. That letter also contained a summary of investigations
conducted by PEDA as part of its prior re-development activities, particularly the
construction of a water quality basin in the 30s Complex and a summary of the information
presented in the two PEDA reports noted above. Those recommendations were
conditionally approved by EPA in a letter to GE dated April 6, 2010. The ensuing activities
conducted by GE (e.g., installation of well GMA1-29 and the sampling of that well, along
with wells RF-02, RF-03S/RF-03D) in spring 2010 were documented in the Spring 2010
GMA 1 Groundwater Quality Report.

G:\GE\GE_Pittsfield_CD_GMA_1\Reports and Presentations\Fall 2012 GW Qual Rpt\0221311324Rpt.doc 15
Fall 2012 GMA 1 Groundwater
Quality Report
General Electric Company Pittsfield, Massachusetts
Subsequently, GE installed a new monitoring well (GMA1-31) in the former 30s Complex
within 30 feet of the footprint of the proposed Mountain One building; and GE sampled that
well along with well GMA1-29 in spring 2011 to determine whether there were any
exceedances of the Method 1 GW-2 standards in that area. The results were reported in
the Spring 2011 GMA 1 Groundwater Quality Report; they showed no exceedances of the
GW-2 standards. In addition, during the summer and fall of 2011, PEDA conducted
excavation activities for the construction of the Mountain One building and provided various
submittals related to that project to the MDEP under the Grant of Environmental Restriction
and Easement (ERE) for the former 30s Complex.1
In its November 21, 2011 conditional approval letter for the Spring 2011 GMA 1
Groundwater Quality Report, EPA directed GE to continue to monitor well GMA1-31 in the
interim groundwater program to evaluate the potential for vapor intrusion at the Mountain
One building, or, alternatively, to coordinate with PEDA and/or EPA to provide design and
installation documentation for the vapor barrier installed in the Mountain One building. In
response to that directive, GE contacted PEDA and obtained information concerning the
vapor barrier that was installed during construction of the Mountain One Building. That
design documentation was provided as Appendix E to the Fall 2011 GMA1 Groundwater
Quality Report, and, based on that information, GE concluded that additional sampling of
well GMA1-31 is not necessary and proposed to continue to sample nearby wells RF-02,
RF-03S/RF-03D, and GMA1-29 as part of the GMA 1 interim monitoring program. EPA
conditionally approved that continued sampling in letter to GE dated April 17, 2012. As
required by that letter, GE will maintain well GMA1-31 and will utilize this well as a
groundwater elevation monitoring point in the GMA 1 NAPL monitoring program. In
addition, EPA’s conditional approval letter noted that if NAPL or a GW-2 exceedance is
detected at either well GMA1-29 or GMA1-31, GE may be required to conduct indoor air
monitoring or sub-slab soil gas monitoring at the MountainOne building in order to confirm
the efficacy of the vapor intrusion mitigation measures that have been installed there.
GE will continue to seek information from PEDA concerning its activities, will use any such
information to assess the potential impact of observations from PEDA’s redevelopment
activities on GMA 1, and will provide updates in future groundwater quality monitoring
reports, as necessary.
1 Those submittals are listed in a letter from GE to EPA, dated September 13, 2011, reporting on the annual ERE inspection of the former 30s Complex in August 2011.

G:\GE\GE_Pittsfield_CD_GMA_1\Reports and Presentations\Fall 2012 GW Qual Rpt\0221311324Rpt.doc 16
Fall 2012 GMA 1 Groundwater
Quality Report
General Electric Company Pittsfield, Massachusetts
3.3.2 Adjacent MCP Disposal Site Monitoring Results
As mentioned above in Section 1.2, the O’Connell East Street Mobil Station site (MDEP
Site No. 1-13347, also referred to as the “East Street Mobil Site”) is located on adjacent
property near the northern edge of the Lyman Street Area. GE understands that this site is
currently being addressed by O’Connell Oil Associates, Inc. to satisfy the requirements of
Massachusetts General Laws Chapter 21-E and the MCP. Available documentation
indicates that soluble-phase contaminants related to gasoline releases from the East Street
Mobil Site have been documented upgradient of this portion of GMA 1.
GE is required to include available monitoring results from response actions performed at
this adjacent site in the groundwater monitoring reports for GMA 1, to the extent that
information is available to GE. To fulfill this requirement, GE conducted an online search of
MDEP’s files on December 11, 2012 to review any reports that have been placed on file
with the MDEP regarding this site since the prior file search was conducted and reported in
the Spring 2012 GMA 1 Groundwater Quality Report.
One document pertaining to groundwater investigations and response actions at the East
Street Mobil Site has been added to the MDEP files since the Spring 2012 file search. That
document is titled:
ROS Status Report; March - September 2012; O’Connell Mobil Station (ECS, October
4, 2012).
The report describes the effectiveness of the oxygen sparging system activated at the site
on September 11, 2006 and provides results of the groundwater sampling event conducted
in August 2012. The report text is provided in Appendix E, along with a site map, pertinent
monitoring results from the August 2012 sampling event, and a historical data summary.
A total of 13 monitoring wells were sampled during the August 2012 sampling event. Each
sample was analyzed for VPH, two of the samples were also analyzed for extractable
petroleum hydrocarbons (EPH), and select samples were analyzed for dissolved iron,
nitrates, and sulfate. The results of that sampling are also included in Appendix E. No
MCP Method 1 GW-2 or GW-3 standards were exceeded in any of the August 2012
groundwater sample results that were presented in the October 4, 2012 report.
GE will continue to review and assess the results from the East Street Mobil Site and
downgradient areas within GMA 1 and will provide updates in future groundwater quality
monitoring reports.

G:\GE\GE_Pittsfield_CD_GMA_1\Reports and Presentations\Fall 2012 GW Qual Rpt\0221311324Rpt.doc 17
Fall 2012 GMA 1 Groundwater
Quality Report
General Electric Company Pittsfield, Massachusetts
4. Overall Assessment of Groundwater Analytical Results
4.1 General
The information presented herein is based on the laboratory results obtained during the fall
2012 groundwater sampling event, supplemented with historical groundwater analytical
data when applicable.
4.2 Groundwater Quality Performance Standards
The Performance Standards applicable to response actions for groundwater at GMA 1 are
set forth in Section 2.7 and Attachment H (Section 4.1) of the SOW. In general, the
Performance Standards for groundwater quality are based on the groundwater classification
categories designated in the MCP. The MCP identifies three potential groundwater
categories that may be applicable to a given site. One of these, GW-1 groundwater, applies
to groundwater that is a current or potential source of potable drinking water. None of the
groundwater at any of the GMAs at the Site is classified as GW-1. However, the remaining
MCP groundwater categories are applicable to GMA 1 and are described below:
GW-2 groundwater is defined as groundwater that is a potential source of vapors to the
indoor air of buildings. Groundwater is classified as GW-2 if it is located within 30 feet
of an existing occupied building and has an average annual depth to groundwater of 15
feet or less. Under the MCP, certain constituents present within GW-2 groundwater
represent a potential source of vapors to the indoor air of the overlying occupied
structures.
GW-3 groundwater is defined as groundwater that discharges to surface water. By
MCP definition, all groundwater at a site is classified as GW-3 since it is considered to
be ultimately discharged to surface water. It should be noted that some groundwater
within GMA 1 does not in fact discharge directly to surface water because of the
operation of numerous groundwater pumping systems. Water extracted from these
systems is transferred to an on-site treatment plant for processing prior to discharge.
Nevertheless, in accordance with the CD and SOW, all groundwater at GMA 1 is
considered as GW-3.
The CD and the SOW allow for the establishment of standards for GW-2 and GW-3
groundwater at the GMAs through use of one of three methods, as generally described in
the MCP. The first, known as Method 1, consists of the application of pre-established
numerical “Method 1” standards set forth in the MCP for both GW-2 and GW-3 groundwater
(310 CMR 40.0974). These “default” standards have been developed to be conservative
and will serve as the initial basis for evaluating groundwater at GMA 1. The current MCP
Method 1 GW-2 and GW-3 standards for the constituents detected during the fall 2012

G:\GE\GE_Pittsfield_CD_GMA_1\Reports and Presentations\Fall 2012 GW Qual Rpt\0221311324Rpt.doc 18
Fall 2012 GMA 1 Groundwater
Quality Report
General Electric Company Pittsfield, Massachusetts
sampling event are listed in Tables 5 and 6, respectively. (In the event of any discrepancy
between the standards listed in these tables and those published in the MCP, the latter will
be controlling.) For constituents for which Method 1 standards do not exist, the MCP
provides procedures, known as Method 2, for developing such standards (Method 2
standards) for both GW-2 (310 CMR 40.0983(2)) and GW-3 (310 CMR 40.0983(4))
groundwater. For such constituents that are detected in groundwater during the baseline
monitoring program, Attachment H to the SOW states that in the Baseline Monitoring
Program Final Report, GE must propose to develop Method 2 standards using the MCP
procedures or alternate procedures approved by EPA, or provide a rationale for why such
standards need not be developed. For constituents whose concentrations exceed the
applicable Method 1 (or Method 2) standards, GE may develop and propose to EPA
alternative GW-2 and/or GW-3 standards based on a site-specific risk assessment. This
procedure is known as Method 3 in the MCP. Upon EPA approval, these alternative risk-
based GW-2 and/or GW-3 standards may be used in lieu of the Method 1 (or Method 2)
standards. Of course, whichever method is used to establish such groundwater standards,
GW-2 standards will be applied to GW-2 groundwater and GW-3 standards will be applied
to GW-3 groundwater.
In its July 30, 2008 conditional approval letter related to the Groundwater Management
Area 2 Long-Term Monitoring Program Addendum to Monitoring Event Evaluation Report
for Fall 2007, EPA specified that the low-range guidance values developed in that report for
cobalt and copper should represent the Method 2 GW-3 standards for these metals at all of
the GE Pittsfield GMAs. Although no samples were collected for analysis of these
constituents in fall 2012, GE will continue to utilize those standards in any future evaluations
of cobalt or copper in GMA 1 groundwater.
It should also be noted that prior GMA 1 reports listed the GW-3 standard for PCDD/PCDF
total TEQ concentrations as 1x10⁻⁷ ppm and the UCL as 1x10⁻⁶ ppm. However, in a review
of the MCP conducted during the preparation of this report, GE observed that the actual
Method 1 GW-3 standard for TEQ concentrations is 4x10⁻⁵ ppm and the actual UCL for
TEQ concentrations is 4x10⁻⁴ ppm. As such, discussions of the PCDD/PCDF
concentrations contained in this report, including GE’s determination on whether additional
supplemental sampling is necessary, are based on comparisons to the correct standards.
Based on consideration of the above points, the specific groundwater quality Performance
Standards for GMA 1 consist of the following:
1. At monitoring wells designated as compliance points to assess GW-2 groundwater (i.e.,
groundwater located at an average depth of 15 feet or less from the ground surface and
within 30 feet of an existing occupied building), groundwater quality shall achieve any of
the following:

G:\GE\GE_Pittsfield_CD_GMA_1\Reports and Presentations\Fall 2012 GW Qual Rpt\0221311324Rpt.doc 19
Fall 2012 GMA 1 Groundwater
Quality Report
General Electric Company Pittsfield, Massachusetts
a) the Method 1 GW-2 groundwater standards set forth in the MCP (or, for
constituents for which no such standards exist, Method 2 GW-2 standards once
developed, unless GE provides and EPA approves a rationale for not developing
such Method 2 standards);
b) alternative risk-based GW-2 standards developed by GE and approved by EPA as
protective against unacceptable risks due to volatilization and transport of volatile
chemicals from groundwater to the indoor air of nearby occupied buildings; or
c) a condition, based on a demonstration approved by EPA, in which constituents in
the groundwater do not pose an unacceptable risk to occupants of nearby occupied
buildings via volatilization and transport to the indoor air of such buildings.2
2. Groundwater quality shall ultimately achieve the following standards at the perimeter
monitoring wells designated as compliance points for GW-3 standards:
a) the Method 1 GW-3 groundwater standards set forth in the MCP (or, for
constituents for which no such standards exist, Method 2 GW-3 standards once
developed, unless GE provides and EPA approves a rationale for not developing
such Method 2 standards); or
b) alternative risk-based GW-3 standards proposed by GE and approved by EPA as
protective against unacceptable risks in surface water due to potential migration of
constituents in groundwater.
These Performance Standards are to be applied to the results of the individual monitoring
wells included in the monitoring program. Several monitoring wells have been designated
as the compliance points for attainment of the Performance Standards identified above.
These wells were initially identified in the GMA 1 Baseline Monitoring Proposal (although
certain modifications were made subsequent to submittal of that proposal as a result of EPA
approval conditions, findings during field reconnaissance of the selected wells, or
replacement of certain wells during the course of the baseline monitoring program). As
described above in Section 2.3, only selected wells were sampled in fall 2012.
2 In addition to these Performance Standards, the SOW provides that, if a total VOC concentration of 5 ppm or greater is found in a GW-2 well located within 30 feet of a school or occupied residential structure, GE must notify EPA within 72 hours and subsequently propose interim response actions.

G:\GE\GE_Pittsfield_CD_GMA_1\Reports and Presentations\Fall 2012 GW Qual Rpt\0221311324Rpt.doc 20
Fall 2012 GMA 1 Groundwater
Quality Report
General Electric Company Pittsfield, Massachusetts
4.3 Groundwater Quality – Fall 2012
For the purpose of generally assessing current groundwater quality conditions, the
analytical results from the fall 2012 groundwater sampling event were compared to the
applicable groundwater Performance Standards for GMA 1. These Performance Standards
are described in Section 4.2 above, and are currently based (on a well-specific basis) on
the MCP Method 1 or 2 GW-2 and/or GW-3 standards. The following subsections discuss
the fall 2012 groundwater analytical results in relation to these Performance Standards, as
well as in relation to the MCP UCLs for groundwater. In support of those discussions,
Tables 5 and 6 provide a comparison of the concentrations of detected constituents with the
currently applicable GW-2 and GW-3 standards, respectively, while Table 7 presents a
comparison of the concentrations of detected constituents with the groundwater UCLs.
4.3.1 Fall 2012 Groundwater Results Relative to GW-2 Performance Standards
As part of the fall 2012 program, groundwater samples were collected from two wells
(ESA1S-31R and ESA1S-72R) designated as GW-2 monitoring locations (well ESA1S-72R
is designated as a GW-2/GW-3 well) and analyzed for VOCs and/or SVOCs.
The fall 2012 groundwater analytical results for all detected constituents subject to MCP
Method 1 GW-2 standards and a comparison of those results to the applicable MCP
Method 1 GW-2 Standards are presented in Table 5. As shown in Table 5, none of the fall
2012 sample concentrations from either of the GW-2 monitoring wells was above its
corresponding GW-2 Performance Standard and neither well exhibited total VOC
concentrations above 5 ppm (the level specified in the SOW as a notification level for GW-2
wells located within 30 feet of a school or occupied residential structure and as a trigger
level for the proposal of interim response actions– see footnote 3 above). These results are
consistent with the available results from prior sampling events.
4.3.2 Fall 2012 Groundwater Results Relative to GW-3 Performance Standards
Groundwater samples designated for GW-3 monitoring were collected from two monitoring
wells (E2SC-23 and ESA1S-72R) during the fall 2012 interim sampling event. Table 6
presents the fall 2012 groundwater analytical results for all constituents detected in these
monitoring wells and compares those results to the applicable MCP Method 1 or 2 GW-3
standards. Although that table provides a comparison of the fall 2012 results from both
GW-3 monitoring wells that were sampled in fall 2012, only well E2SC-23 (i.e., a
downgradient GW-3 perimeter well, as identified in Table 1) has been designated as a
compliance point for the GW-3 standards. Monitoring well ESA1S-72R is identified as a
GW-3 general/source area sentinel well, as well as a GW-2 monitoring location (see
Table 1).

G:\GE\GE_Pittsfield_CD_GMA_1\Reports and Presentations\Fall 2012 GW Qual Rpt\0221311324Rpt.doc 21
Fall 2012 GMA 1 Groundwater
Quality Report
General Electric Company Pittsfield, Massachusetts
The comparisons set forth in Table 6 show that none of the constituents detected was
found at a level above its applicable MCP Method 1 GW-3 standard in fall 2012.
4.3.3 Fall 2012 Comparison to Upper Concentration Limits
The fall 2012 analytical results for all three wells sampled were compared not only to
applicable MCP Method 1 GW-2 and GW-3 standards, but also to the UCLs for
groundwater specified in the MCP (310 CMR 40.0996(7)). As shown in Table 7, none of
the groundwater samples collected in fall 2012 contained constituent concentrations greater
than any of the listed UCLs for groundwater.
4.4 Overall Assessment of Groundwater Analytical Results
A graph illustrating historical total VOC concentrations at well ESA1S-31R (the only well
sampled and analyzed for VOCs in fall 2012) is presented in Appendix D. Appendix D also
contains graphs of historical concentrations of individual constituents that approached or
exceeded the applicable MCP Method 1 GW-2 or GW-3 standards or UCLs during any of
the prior baseline/interim monitoring program sampling events at GMA 1 at wells that were
sampled and analyzed for those constituents in fall 2012 (i.e., historical lead and
PCDD/PCDF TEQ concentrations at well E2SC-23). A review of the total VOC
concentration graph for ESA1S-31R as well as the historical data, indicates that the VOC
concentration at this location is somewhat higher in fall 2012 compared to spring 2012.
This was only the second round of VOC sampling performed at this location, however. The
total VOC concentration increased from 0.011 ppm in spring 2012 to 0.030 ppm in fall 2012.
The constituents detected at this well in fall 2012 (bromodichloromethane and chloroform)
are typical byproducts of drinking water chlorination and are found in the City of Pittsfield
drinking water (as shown by the City’s Annual Drinking Water Reports for 2011 and 2010
provided in Appendix F). Therefore, the fall 2012 results at well ESA1S-31R may be
attributable to water from a municipal line supplying the adjacent residence on East Street.
As seen on the graph of PCDD/PCDF total TEQ concentrations at well E2SC-23 in
Appendix D, the fall 2012 TEQ concentration is significantly less than the maximum levels
observed at this location in fall 2002. For the six samples collected at this well over time, all
concentrations have been below the applicable GW-3 standard.
The historical concentration graph for dissolved lead at well E2SC-23 provided in Appendix
D shows that the GW-3 standard was only exceeded during a single sampling event at this
well (spring 2003) and lead was only detected during one other occasion (the current fall
2012 sampling event, in only one of two duplicate samples, at an estimated level). The fall
2012 sample was less than 50% of the MCP GW-3 Standard for lead. GE nonetheless
proposes to conduct a supplemental round of dissolved lead analysis at this well in spring

G:\GE\GE_Pittsfield_CD_GMA_1\Reports and Presentations\Fall 2012 GW Qual Rpt\0221311324Rpt.doc 22
Fall 2012 GMA 1 Groundwater
Quality Report
General Electric Company Pittsfield, Massachusetts
2013 for provide data to further evaluate whether long-term monitoring is necessary for this
constituent at this location (see Section 5.2).
The SOW requires that interim response actions be proposed for baseline sampling results
which exceed Method 1 GW-3 standards at downgradient perimeter monitoring wells, in
which: (a) such an exceedance had not previously been detected, or (b) there was a
previous exceedance of the Method 1 GW-3 standard and the groundwater concentration is
greater than or equal to 100 times the GW-3 standard (if the exceedance was not
previously addressed). These interim response actions may include: (1) further
assessment activities, such as re-sampling, increasing the sampling frequency to quarterly,
additional well installation, and/or continuing the baseline monitoring program; (2) active
response actions; and/or (3) the conduct of a site-specific risk evaluation and proposal of
alternative risk-based GW-3 Performance Standards. Although prior exceedances of
certain standards have been noted at wells sampled in fall 2012, no such exceedances
were recorded in fall 2012. Therefore, no response actions are necessary at this time.

G:\GE\GE_Pittsfield_CD_GMA_1\Reports and Presentations\Fall 2012 GW Qual Rpt\0221311324Rpt.doc 23
Fall 2012 GMA 1 Groundwater
Quality Report
General Electric Company Pittsfield, Massachusetts
5. Proposed Monitoring Program Modifications and Schedule of` Future Activities
5.1 General
In spring 2004, GE initiated the interim groundwater quality monitoring program to be
conducted until completion of the soil-related Removal Actions at the RAAs that comprise
GMA 1. The interim monitoring program is designed to obtain additional data from locations
where it is not yet clear whether the initial baseline groundwater quality results indicate that
the well may require future monitoring in a long-term monitoring program. As previously
noted in Section 1.2, GE has completed the soil-related Removal Actions at all the RAAs
that comprise GMA 1 except for the Silver Lake Area (which is expected to be completed in
2013). EPA indicated in its December 19, 2012 conditional approval letter for the Spring
2012 GMA 1 Groundwater Quality Report that, in anticipation of the substantial completion
of the soil and sediment remediation actions at GMA 1, GE should submit a Baseline
Assessment Final Report and Long-Term Monitoring Proposal for GMA 1 following the next
sampling event in spring 2013.
Since only limited interim sampling activities were scheduled for spring 2013 (most of the
wells in the interim monitoring program were not scheduled to be sampled until fall 2013),
GE has reviewed the recent results of its groundwater-related activities conducted at GMA
1, including the groundwater analytical data from the fall 2012 interim sampling event for
locations where an additional round of data would be useful in determining whether long-
term monitoring may be necessary. The results of that evaluation and resulting proposed
supplemental sampling activities for spring 2013 are discussed in Section 5.3 below. This
section also summarizes the schedule for that monitoring event and associated reporting
activities, including the submission of a Baseline Assessment Final Report and Long-Term
Monitoring Proposal following that event. The proposed analyses at each monitoring well to
be included in the proposed spring 2013 supplemental sampling event are summarized in
Table 8.
5.2 Previously Scheduled Sampling Activities
Due to the annual alternation between spring and fall sampling events during the interim
monitoring program, only limited sampling activities were planned for spring 2013. Those
activities are discussed below.
In its April 13, 2011 letter to GE conditionally approving the Fall 2010 GMA 1 Groundwater
Quality Report, EPA required GE to conduct sample wells A-7RR and F-1 for PCB analysis
during spring sampling rounds until potential increasing trends at these wells exhibited
during the spring monitoring rounds are evaluated. Sampling at well F-1 was discontinued,
with EPA approval, following the spring 2011 sampling event. GE once again collected and

G:\GE\GE_Pittsfield_CD_GMA_1\Reports and Presentations\Fall 2012 GW Qual Rpt\0221311324Rpt.doc 24
Fall 2012 GMA 1 Groundwater
Quality Report
General Electric Company Pittsfield, Massachusetts
analyzed PCB samples from well A7-RR during spring 2012 and will collect another sample
in spring 2013. The need for continued spring sampling at this location will be discussed in
the upcoming long-term monitoring proposal.
In its April 17, 2012 letter to GE conditionally approving the Fall 2011 GMA 1 Groundwater
Quality Report, EPA required GE to sample and analyze well 31R for VOCs and SVOCs for
a minimum of four semi-annual monitoring rounds, starting with the Spring 2012 sampling
round, to demonstrate compliance with GW-2 criteria. The spring 2013 sampling event will
represent the third of the four required sampling rounds.
In its May 14, 2012 letter to GE providing conditional approval of the Revised LNAPL
Volatilization Assessment Work Plan for Groundwater Management Area 1 – East Street Area 1, EPA required GE to analyze samples from well ESA1S-72R for the entire SVOC
analyte list, rather than the select five analytes typically added to the VOC analyses, during
the next two sampling events. Since that requirement was received after completion of the
spring 2012 sampling event and the next scheduled interim sampling round at this well was
in fall 2013, GE proposed to conduct a supplemental sampling round at well ESA1S-72R in
fall 2012 to obtain SVOC data that can be utilized in the LNAPL volatilization assessment
that has been initiated in that area. That sampling was performed in fall 2012 and no
SVOCs were detected. As shown in Table 8, GE proposes to collect the second required
round of samples for SVOC analysis at this well in spring 2013.
Well GMA1-4 has been sampled for PCBs for on three occasions (previous sampling was
performed in spring 2009, spring 2011, and fall 2011). As discussed in Section 2.4,
groundwater at this well was over 19 feet below grade in fall 2012 and the well was not
sampled. Historically, groundwater at well GMA1-4 has most often been deeper than 15
feet below grade and the well therefore does not appear to be appropriate as a GW-2
monitoring well; however, GE will continue to evaluate the groundwater elevation at this well
in spring 2013 and will sample the well if groundwater is present at a depth of less than 15
feet below grade.
5.3 Proposed Modifications to Interim Monitoring Program for Spring 2013
GE has previously presented evaluations of the sampling results from GMA 1 and proposed
to retain certain wells for selected analyses in the interim monitoring program to provide
additional data to assist in the determination of whether long-term monitoring would be
necessary. Generally speaking, wells that contained constituent concentrations near the
values of the future Performance Standards (i.e., average concentrations ranging from
greater than 50% of an applicable MCP Method 1 Standard to slightly above the standard)
were retained for interim monitoring. In addition, selected wells/analyses were added to the
interim monitoring program, regardless of constituent concentrations relative to standards,
based on their location in areas of interest (e.g., adjacent to known source areas and

G:\GE\GE_Pittsfield_CD_GMA_1\Reports and Presentations\Fall 2012 GW Qual Rpt\0221311324Rpt.doc 25
Fall 2012 GMA 1 Groundwater
Quality Report
General Electric Company Pittsfield, Massachusetts
upgradient from occupied buildings), or if constituent concentrations exhibited an increasing
trend during the course of baseline monitoring. Groundwater quality monitoring was
proposed to be discontinued at locations where constituent concentrations were well below
the applicable MCP Method 1 Standards and at locations where concentrations consistently
exceeded the standards, as it was apparent that such locations either would not or would
be included in a long-term monitoring program.
GE has reviewed the analytical data collected during the interim monitoring program and
determined that existing database will be sufficient to determine long-term monitoring
needs. However, as discussed below, certain locations were identified where an additional
sampling round prior to proposal of a long-term monitoring program would be beneficial.
In the Spring 2008 GMA 1 Groundwater Quality Report, GE re-evaluated the existing
groundwater quality data at GMA 1 and identified several locations that should be added to
or removed from the interim monitoring program, based on revisions to the MCP that
became effective on February 14, 2008 and other criteria. Well ESA2S-52 was added to
the interim monitoring program for PCB analysis based on the identification of a potential
increasing trend in the baseline groundwater quality data from this location. Although the
results of subsequent annual sampling events did not indicate the presence of a trend, an
anomalously high PCB concentration recorded in fall 2011 (0.0396 ppm) was greater than
the GW-3 standard for PCBs (0.01 ppm). The PCB concentration in spring 2012 decreased
to a more historically representative level in spring 2012 (0.0019 ppm). To further evaluate
the anomalous fall 2011 result prior to proposal of a long-term monitoring program, GE
proposes to collect an additional sample for PCB analysis from this well in spring 2013.
In its April 17, 2012 letter to GE conditionally approving the Fall 2011 GMA 1 Groundwater
Quality Report, EPA required GE to conduct a supplemental sampling round at wells E2SC-
23 and E2SC-24 for VOCs, SVOCs, PCDDs/PCDFs, filtered inorganic compounds
(physiologically available cyanide [PAC] and metals), and dioxins/furans in spring 2012 (in
addition to the scheduled filtered PCB analyses at these wells) and to propose the sampling
frequency and analyte list for the remainder of the interim monitoring program. GE
conducted the required additional sampling and provided the results in the Spring 2012
GMA 1 Groundwater Quality Report. As discussed in Section 4.4 of that report, the GW-3
Standard for lead was exceeded during a single sampling event at well E2SC-23. (While
that report also stated that the GW-3 Standard for PCDD/PCDF total TEQs was exceeded
at this location, that statement was based on comparison to an incorrect standard and thus
was erroneous.) Although those results appeared to be anomalous, GE proposed to
continue to analyze samples from this well for these constituents in fall 2012 in addition to
the ongoing PCB analyses performed on an annual basis, alternating between spring and
fall seasons. In addition, GE proposed to conduct a supplemental round of sampling and
analysis for PCDDs/PCDFs and dissolved lead at well E2SC-23 in fall 2012 to further
evaluate the prior GW-3 exceedances of these constituents at this location and assess the

G:\GE\GE_Pittsfield_CD_GMA_1\Reports and Presentations\Fall 2012 GW Qual Rpt\0221311324Rpt.doc 26
Fall 2012 GMA 1 Groundwater
Quality Report
General Electric Company Pittsfield, Massachusetts
need for a continued increased sampling frequency. That sampling was conducted in fall
2012 and discussed herein. At well E2SC-24, PAC was detected at a concentration slightly
greater than 50% of the GW-3 standard in spring 2012. Based on this result in combination
with similar concentrations of total cyanide recorded earlier in the baseline monitoring
program, GE proposed to analyze filtered samples from this well for PAC during future
interim sampling events. That sampling was proposed to take place under the current
annual alternating spring/fall schedule, with the next sampling event to be conducted in fall
2013. However, in accordance with EPA’s requirement that GE submit a long-term
monitoring proposal after the spring 2013 sampling event, the final baseline/interim
sampling event will be conducted in spring 2013. As such, GE proposes to conduct an
additional dissolved lead and PAC analyses at wells E2SC-23 and E2SC-24, respectively,
during the upcoming spring 2013 sampling event in lieu of the event that had been
scheduled for fall 2013. No additional PCDD/PCDF analysis is proposed at well E2SC-23,
as all historical data for this constituent are well below the correct GW-3 standard.
The spring 2012 sampling event was the fourth of four required rounds conducted in
accordance with EPA’s October 18, 2010 conditional approval letter for GE’s Spring 2010
GMA 1 Groundwater Quality Report to establish baseline conditions at GW-3 wells GMA1-
24R, GMA1-30, and HR-G3-MW-2. Statistical summaries of the analytical results from
these wells were provided in Appendix D of the Spring 2012 GMA 1 Groundwater Quality
Report. As summarized in that report, none of the maximum concentrations of any
constituents detected in these three wells exceeded any of the GW-3 Standards. The only
constituent concentration recorded that approached an applicable Performance Standard
was lead at wells GMA1-30 (estimated at 0.0069 ppm in spring 2011) and HR-G3-MW-2
(estimated at 0.00757 ppm in fall 2010). Although these were the only detections of lead at
each location, the concentrations were sufficient to result in overall average concentrations
of greater than 50% of the GW-3 Standard of 0.01 ppm for lead. Therefore, GE proposed
that these two wells continue to be sampled and analyzed for dissolved lead during future
interim sampling events. As with wells E2SC-23 and E2SC-24 (discussed above), GE
proposes to conduct an additional dissolved lead analyses at wells GMA1-30 and HR-G3-
MW-2 in spring 2013, instead of the sampling previously scheduled for fall 2013.
A summary of the proposed spring 2013 sampling activities at GMA 1 is provided in Table
8, and the locations where sampling is to be conducted, as proposed herein, are illustrated
on Figure 4. Additional details on the sampling and reporting schedule at GMA 1 are
provided below.

G:\GE\GE_Pittsfield_CD_GMA_1\Reports and Presentations\Fall 2012 GW Qual Rpt\0221311324Rpt.doc 27
Fall 2012 GMA 1 Groundwater
Quality Report
General Electric Company Pittsfield, Massachusetts
5.4 Field Activities Schedule
GE will conduct the spring 2013 groundwater sampling event at GMA 1 in April 2013, in
conjunction with groundwater sampling activities that will be performed at the other GMAs.
As shown in Table 8, that sampling event will include sampling at nine monitoring wells,
including conditional sampling at well GMA1-4, if the depth to groundwater is 15 feet or less.
The spring 2013 semi-annual groundwater elevation and NAPL monitoring event will also
be conducted in April 2013 at all wells included in the GMA 1 NAPL monitoring program.
Results from that monitoring event will be incorporated into the next groundwater quality
monitoring report for GMA 1, as applicable. GE will also continue to conduct well
repairs/maintenance on an ongoing basis, if any other activities found to be necessary
during the course of routine monitoring activities at GMA 1.
Prior to performance of these activities, GE will provide EPA with 7 days advance notice to
allow the assignment of field oversight personnel.
5.5 Reporting Schedule
GE will continue to provide the results of preliminary groundwater analytical data in its
monthly reports on overall activities at the GE-Pittsfield/Housatonic River Site.
As required by EPA, GE will submit a Baseline Assessment Final Report and Long-Term
Monitoring Proposal (referred to hereafter simply as the Long-Term Monitoring Proposal) in
lieu of a Spring 2013 Interim Groundwater Quality Report for GMA 1. In the GMA 1
Baseline Monitoring Proposal, GE proposed to submit a final report and long-term
monitoring proposal to EPA within 75 days following completion of the baseline monitoring
program at GMA 1, defined by receipt and validation of the analytical data from the final
sampling event. Since GE is conducting a sampling event in spring 2013 and will
incorporate the results of that sampling round in the GMA 1 Long-Term Monitoring
Proposal, GE proposes that the submittal schedule be modified to accommodate these
activities, along with EPAs requirement that a technical meeting be held between GE and
EPA to discuss long-term monitoring requirements 60 days prior to submittal of the GMA 1
Long-Term Monitoring Proposal. Specifically, GE proposes to submit the GMA 1 Long-
Term Monitoring Proposal to EPA within 120 days following the receipt and validation of the
final laboratory data packages from the spring 2013 sampling event. This proposed
schedule will allow time for GE to review the upcoming results and historical data and
identify a general approach to the long-term monitoring program prior to its meeting with
EPA, while leaving sufficient time after the meeting to address and incorporate into the
GMA 1 Long-Term Monitoring Proposal any issues discussed during the meeting.

G:\GE\GE_Pittsfield_CD_GMA_1\Reports and Presentations\Fall 2012 GW Qual Rpt\0221311324Rpt.doc 28
Fall 2012 GMA 1 Groundwater
Quality Report
General Electric Company Pittsfield, Massachusetts
The GMA 1 Long-Term Monitoring Proposal will present the final, validated spring 2013
sampling results, including a summary of groundwater-related activities conducted at GMA
1 between January 2013 and June 2013 (including any additional sampling/monitoring
results reported by others at the adjacent East Street Mobil Site and in the PEDA
development areas, to the extent that such information is available to GE), and a brief
discussion of the results. In addition, that report will provide an assessment of the overall
baseline monitoring data set for GMA 1. This assessment will include:
An update of the current understanding of hydrogeologic conditions and the extent of
contamination, including a statistical assessment of the “baseline” data and other
historical data, if appropriate, and a comparison to the Performance Standards;
An evaluation of the spatial distribution of constituents within GMA 1 and the actual
migration or potential for migration of such constituents outside the GMA, including an
evaluation of groundwater travel time to any receptor (e.g., surface water
body/building);
Identification of the presence or potential presence of previously unidentified sources of
groundwater contamination;
An assessment of the adequacy of the selected monitoring locations;
A re-assessment of the constituents, locations, and frequencies to be subject to future
monitoring;
Identification of areas where the GW-2 Performance Standards apply in addition to the
GW-3 Performance Standards;
Identification of the specific wells to be used to measure compliance with the GW-2 and
GW-3 Performance Standards;
An evaluation of variations in groundwater quality from event to event to identify and
assess sampling data variability and potential causes for the variability, including
seasonal influences;
An evaluation of the need for follow-up investigations, assessments, and/or interim
response actions;
A discussion of the relationship between the GMA 1 groundwater quality and NAPL
monitoring programs; and

G:\GE\GE_Pittsfield_CD_GMA_1\Reports and Presentations\Fall 2012 GW Qual Rpt\0221311324Rpt.doc 29
Fall 2012 GMA 1 Groundwater
Quality Report
General Electric Company Pittsfield, Massachusetts
A statement of the basis for GE’s proposal to EPA for approval of a long-term
monitoring program and/or additional actions.
Finally, that report will propose a long-term groundwater quality monitoring program for
GMA 1, including:
The specific areas subject to the monitoring along with the supporting rationale;
The sentinel and perimeter monitoring locations, along with the supporting rationale;
The schedule for plan implementation, including reporting;
The frequency of future monitoring events;
The constituents to be subject to analysis;
Descriptions of statistical techniques to be employed;
Proposal for any additional investigations, assessments, and/or interim response
actions, including any proposal for risk-based alternative GW-2 or GW-3 Performance
Standards; and
An outline of a typical Monitoring Event Evaluation Report.
The GMA 1 Long-Term Monitoring Proposal will address groundwater quality at monitoring
wells that have been sampled during the GMA 1 baseline and interim monitoring programs.
Although certain components of the GMA 1 NAPL monitoring program (i.e., groundwater
elevation data) have been and will continue to be incorporated into the GMA 1 groundwater
quality reports, GE anticipates that during the implementation of the long-term groundwater
quality monitoring program, all NAPL monitoring, recovery, and reporting requirements
related to GMA 1 will continue to be addressed separately under the GMA 1 NAPL
monitoring program to the extent practical. At some point in the future, GE may propose to
combine the two programs, if the activities being conducted support such a merge (e.g., if
groundwater quality Performance Standards are met at all or most locations and the scope
of long-term monitoring is limited to sentinel sampling downgradient of remaining NAPL
areas).

Tables

Table 1
E2SC-23 GW-3 Perimeter (Downgradient) PCDD/PCDF, Lead Supplemental sampling conducted in Fall 2012 as proposed by GE.
ESA1S-31R GW-2 Sentinel VOC, SVOCSecond of four rounds of semi-annual sampling required by EPA performed in Fall 2012 to demonstrate compliance with GW-2 criteria.
ESA1S-72R GW-2 Sentinel/GW-3 General/Source Area Sentinel SVOC Supplemental sampling conducted in Fall 2012 as proposed by GE.
NOTES:
1.
2. All analyses for lead were performed on filtered samples only.
Fall 2012 Interim Groundwater Quality Monitoring Wells
RAA 4 - EAST STREET AREA 2-SOUTH
RAA 18 - EAST STREET AREA 1 SOUTH
Groundwater Quality Monitoring Interim Report For Fall 2012Plant Site 1 Groundwater Management AreaGeneral Electric Company - Pittsfield, Massachusetts
Well Number Monitoring Well Usage Analysis (1,2) Comments
PCB analyses were also scheduled to be conducted at well GMA1-4 to evaluate compliance with the MCP GW-2 standard if depth to groundwater is less than 15 feet and if an adequate volume of water is present in the well at the time of sampling. Since the depth to water in fall 2012 was greater than 15 feet, no sample was collected.
G:\GE\GE_Pittsfield_CD_GMA_1\Reports and Presentations\Fall 2012 GW Qual Rpt\0221311324Tbl1_8.xlsx Page 1 of 1 1/30/2013

Monitoring Well Construction
Well Number Survey CoordinatesWell
Diameter
Ground Surface
Elevation
Measuring Point
Elevation
Depth to Top of Screen
Screen Length
Top of Screen
Elevation
Base of Screen
ElevationNorthing Easting (inches) (feet AMSL) (feet AMSL) (feet BGS) (feet) (feet AMSL) (feet AMSL)
RAA 4 - East Street Area 2-South
E2SC-23 533344.44 133132.75 2 990.10 992.07 9.0 10.0 981.1 971.1RAA 18 - East Street Area 1-South
ESA1S-31R 534143.90 134059.50 2 1,000.46 1,000.23 5.5 10.0 995.0 985.0
ESA1S-72R 534196.10 134234.60 4 1,001.11 1,000.75 3.9 10.0 997.2 987.2
NOTES:
1.
2. feet AMSL: Feet above mean sea level
3. feet BGS: Feet below ground surface
4. Northing and Easting coordinates are based on the North American Datum of 1927, Massachusetts Mainland Zone.
Table 2
Groundwater Quality Monitoring Interim Report For Fall 2012Plant Site 1 Groundwater Management AreaGeneral Electric Company - Pittsfield, Massachusetts
The listed wells were utilized during Fall 2012 for interim groundwater quality sampling.
G:\GE\GE_Pittsfield_CD_GMA_1\Reports and Presentations\Fall 2012 GW Qual Rpt\0221311324Tbl2_4.xlsx - Table2 Page 1 of 1 1/30/2013

Table 3Groundwater Elevation Data - Fall 2012 Monitoring Round
40s Complex (RAA 1)
95-17 10/24/2012 983.46
30s Complex (RAA 2)
ES2-19 10/24/2012 993.49
GMA1-3 10/24/2012 983.52
GMA1-12 10/24/2012 977.70
GMA1-29 10/24/2012 976.91
GMA1-31 10/24/2012 976.52
RF-02 10/24/2012 976.32
RF-03S 10/24/2012 975.86
RF-03D 10/24/2012 976.99
RF-16R 10/24/2012 976.36
20s Complex (RAA 3)
CC-R 10/24/2012 977.51
EE 10/24/2012 977.72
GG 10/24/2012 981.19
II 10/24/2012 977.63
JJ 10/24/2012 977.56
LL-R 10/24/2012 980.57
O-RR 10/24/2012 983.75
PEDA20-MW-2 10/24/2012 977.25
QQ-R 10/24/2012 977.77
U 10/24/2012 977.01
Y 10/24/2012 977.32
Silver Lake Area (RAA 17)
SLGW-1S 10/24/2012 975.95
SLGW-5S 10/24/2012 979.12
SLGW-6S 10/24/2012 981.66
East Street Area 2-North (RAA 5)
05-N 10/24/2012 984.74
09-N 10/24/2012 983.09
11-N 10/24/2012 979.27
14-N 10/24/2012 987.06
16-N 10/24/2012 977.27
17-N 10/24/2012 978.45
17A 10/24/2012 1,016.46
19-N 10/24/2012 979.17
20-N 10/24/2012 980.23
23-N 10/24/2012 979.40
24-N 10/24/2012 979.25
95-20 10/24/2012 996.63
Groundwater Quality Monitoring Interim Report For Fall 2012Plant Site 1 Groundwater Management AreaGeneral Electric Company - Pittsfield, Massachusetts
Well NameGroundwater Elevation
(Feet AMSL)Date
G:\GE\GE_Pittsfield_CD_GMA_1\Reports and Presentations\Fall 2012 GW Qual Rpt\0221311324Tbl3.xlsx
Page 1 of 7
1/30/2013

Table 3Groundwater Elevation Data - Fall 2012 Monitoring Round
Groundwater Quality Monitoring Interim Report For Fall 2012Plant Site 1 Groundwater Management AreaGeneral Electric Company - Pittsfield, Massachusetts
Well NameGroundwater Elevation
(Feet AMSL)Date
East Street Area 2-North (RAA 5) (continued)
A7-RR 10/24/2012 1,014.46
ES1-05 10/24/2012 981.72
ES1-10 10/24/2012 1,018.90
ES1-18 10/24/2012 1,043.52
ES1-20 10/24/2012 985.56
ES1-27R 10/24/2012 1,015.04
F-1 10/24/2012 1,020.96
GMA1-4 10/24/2012 991.67
East Street Area 2-South (RAA 4)
13 10/25/2012 972.95
14 10/25/2012 973.12
16R 10/25/2012 973.51
18R 10/25/2012 972.17
19R 10/25/2012 972.30
95-01R 10/25/2012 972.79
95-25 10/25/2012 974.19
3-6C-EB-14R 10/25/2012 972.46
3-6C-EB-22 10/25/2012 972.45
3-6C-EB-25 10/25/2012 972.83
3-6C-EB-28 10/25/2012 972.77
ES2-05 10/24/2012 973.20
ES2-18 10/24/2012 972.76
GMA1-15 10/24/2012 972.58
GMA1-16 10/24/2012 973.71
GMA1-19 10/24/2012 972.18
GMA1-20R 10/24/2012 972.06
GMA1-21 10/24/2012 972.10
GMA1-22 10/24/2012 972.75
GMA1-23R 10/24/2012 972.42
GMA1-24R 10/24/2012 972.18
GMA1-30 10/24/2012 971.80
HR-J1-MW-1 10/24/2012 971.86
HR-J1-MW-2 10/24/2012 972.87
HR-J1-MW-3 10/24/2012 972.41
01R 10/24/2012 972.06
02 10/24/2012 978.62
05 10/24/2012 976.24
09R 10/24/2012 975.52
10 10/24/2012 972.87
25R 10/24/2012 973.88
G:\GE\GE_Pittsfield_CD_GMA_1\Reports and Presentations\Fall 2012 GW Qual Rpt\0221311324Tbl3.xlsx
Page 2 of 7
1/30/2013

Table 3Groundwater Elevation Data - Fall 2012 Monitoring Round
Groundwater Quality Monitoring Interim Report For Fall 2012Plant Site 1 Groundwater Management AreaGeneral Electric Company - Pittsfield, Massachusetts
Well NameGroundwater Elevation
(Feet AMSL)Date
East Street Area 2-South (RAA 4) (continued)
26RR 10/24/2012 976.06
34 10/24/2012 973.63
35 10/24/2012 973.72
36 10/24/2012 973.33
37 10/24/2012 972.51
38 10/24/2012 974.47
95-07R 10/24/2012 974.20
ES2-10 10/24/2012 976.27
GMA1-14 10/24/2012 976.31
GMA1-17E 10/24/2012 977.22
GMA1-17W 10/25/2012 975.72
M-R 10/24/2012 976.76
28 10/24/2012 972.25
29 10/24/2012 971.74
30 10/24/2012 975.09
32 10/24/2012 976.63
42 10/24/2012 973.65
43 10/24/2012 976.04
44 10/24/2012 974.47
47 10/24/2012 972.74
48 10/24/2012 972.41
49R 10/24/2012 972.76
49RR 10/24/2012 972.25
55 10/24/2012 972.46
57 10/24/2012 975.75
58 10/24/2012 972.53
59 10/24/2012 971.42
GMA1-13 10/24/2012 972.90
P3 10/24/2012 982.63
TMP-1 10/24/2012 973.05
50 10/24/2012 974.65
51 10/24/2012 972.94
52 10/24/2012 972.76
64 10/24/2012 971.97
64R 10/25/2012 976.68
64S 10/25/2012 964.83
64S-Caisson 10/25/2012 973.88
64V 10/25/2012 966.31
64X(N) 10/25/2012 972.33
G:\GE\GE_Pittsfield_CD_GMA_1\Reports and Presentations\Fall 2012 GW Qual Rpt\0221311324Tbl3.xlsx
Page 3 of 7
1/30/2013

Table 3Groundwater Elevation Data - Fall 2012 Monitoring Round
Groundwater Quality Monitoring Interim Report For Fall 2012Plant Site 1 Groundwater Management AreaGeneral Electric Company - Pittsfield, Massachusetts
Well NameGroundwater Elevation
(Feet AMSL)Date
East Street Area 2-South (RAA 4) (continued)
64X(S) 10/25/2012 965.99
64X(W) 10/25/2012 966.07
95-04RR 10/24/2012 973.46
95-05 10/24/2012 973.20
ES2-02AR 10/24/2012 972.07
ES2-06R 10/24/2012 971.91
ES2-11 10/24/2012 973.13
ES2-14 10/24/2012 972.86
ES2-15R 10/24/2012 973.04
ES2-16 10/24/2012 973.25
ES2-17R 10/24/2012 972.90
HR-G1-MW-1 10/24/2012 971.79
HR-G1-MW-2 10/24/2012 972.06
HR-G1-MW-3 10/24/2012 971.72
HR-G2-MW-1 10/24/2012 971.78
HR-G2-MW-2 10/24/2012 973.17
HR-G2-MW-3 10/24/2012 972.09
HR-G2-RW-1 10/24/2012 968.32
HR-G3-MW-1 10/24/2012 972.04
HR-G3-MW-2 10/24/2012 972.12
HR-G3-RW-1 10/24/2012 971.13
53 10/24/2012 972.51
54 10/24/2012 972.14
E2SC-03I 10/24/2012 972.31
E2SC-06 10/24/2012 979.29
E2SC-17 10/24/2012 973.23
E2SC-21R 10/24/2012 973.58
E2SC-23 10/24/2012 973.34
E2SC-24 10/24/2012 972.25
ESA2S-PZ1 10/24/2012 972.48
ESA2S-PZ2 10/24/2012 972.43
ESA2S-PZ3 10/24/2012 972.36
ESA2S-PZ4 10/24/2012 972.34
ESA2S-PZ5 10/24/2012 972.28
ESA2S-PZ6 10/24/2012 972.42
ESA2S-PZ7 10/24/2012 972.54
ES2-08 10/24/2012 972.52
HR-C-RW-1 10/24/2012 969.75
PZ-1S 10/24/2012 972.27
PZ-6S 10/24/2012 971.91
G:\GE\GE_Pittsfield_CD_GMA_1\Reports and Presentations\Fall 2012 GW Qual Rpt\0221311324Tbl3.xlsx
Page 4 of 7
1/30/2013

Table 3Groundwater Elevation Data - Fall 2012 Monitoring Round
Groundwater Quality Monitoring Interim Report For Fall 2012Plant Site 1 Groundwater Management AreaGeneral Electric Company - Pittsfield, Massachusetts
Well NameGroundwater Elevation
(Feet AMSL)Date
East Street Area 2-South (RAA 4) (continued)
RW-1(S) 10/25/2012 967.21
RW-1(X) 10/25/2012 965.57
RW-2(X) 10/25/2012 969.73
RW-3(X) 10/25/2012 971.18
RW-4 10/25/2012 967.22
East Street Area 1-North (RAA 6)
ESA1N-25 10/23/2012 994.54
60R 10/23/2012 993.40
105 10/23/2012 995.79
106 10/23/2012 995.56
107 10/23/2012 996.39
108A 10/23/2012 997.61
109A 10/23/2012 996.93
118 10/23/2012 997.29
128 10/23/2012 994.81
131R 10/23/2012 995.29
140 10/23/2012 993.49
ES1-08 10/23/2012 994.83
North Caisson 10/23/2012 985.94
East Street Area 1-South (RAA 18)
ESA1S-31R 10/23/2012 992.08
ESA1S-33 10/23/2012 995.32
ESA1S-34 10/23/2012 993.92
ESA1S-35 10/23/2012 994.27
ESA1S-37R 10/23/2012 979.54
ESA1S-45 10/23/2012 994.28
ESA1S-46 10/23/2012 993.30
ESA1S-72 10/23/2012 994.03
ESA1S-72R 10/23/2012 994.70
ESA1S-75 10/23/2012 994.13
ESA1S-76 10/23/2012 993.53
ESA1S-78 10/23/2012 994.57
ESA1S-80 10/23/2012 985.69
ESA1S-139R 10/23/2012 977.06
ES1-13R 10/23/2012 993.72
ES1-23R 10/23/2012 986.76
GMA1-6 10/23/2012 992.41
GMA1-7 10/23/2012 974.11
GMA1-18 10/23/2012 991.71
South Caisson 10/25/2012 986.59
G:\GE\GE_Pittsfield_CD_GMA_1\Reports and Presentations\Fall 2012 GW Qual Rpt\0221311324Tbl3.xlsx
Page 5 of 7
1/30/2013

Table 3Groundwater Elevation Data - Fall 2012 Monitoring Round
Groundwater Quality Monitoring Interim Report For Fall 2012Plant Site 1 Groundwater Management AreaGeneral Electric Company - Pittsfield, Massachusetts
Well NameGroundwater Elevation
(Feet AMSL)Date
Lyman Street Area (RAA 12)
B-2 10/23/2012 970.59
GMA1-5 10/23/2012 970.53
LS-12 10/23/2012 970.91
LS-13 10/23/2012 972.93
LS-30 10/23/2012 972.02
LS-31 10/23/2012 996.55
LS-34 10/23/2012 971.37
LS-43R 10/23/2012 971.13
LS-44 10/23/2012 970.82
LSSC-07 10/23/2012 971.51
LSSC-16I 10/23/2012 971.57
LSSC-16S 10/23/2012 971.47
LSSC-32 10/23/2012 971.17
LSSC-33 10/23/2012 971.10
MW-3R 10/23/2012 972.97
MW-4R 10/23/2012 970.23
MW-6R 10/23/2012 973.33
RW-1(R) 10/25/2012 967.32
RW-2 10/25/2012 968.77
RW-3 10/25/2012 970.07
E-04 10/23/2012 972.35
EPA-01 10/23/2012 970.68
LS-21 10/23/2012 967.65
LS-24 10/23/2012 967.85
LS-38S 10/23/2012 970.82
LS-38 10/23/2012 970.88
LSSC-06 10/23/2012 970.88
LSSC-08I 10/23/2012 970.75
LSSC-08S 10/23/2012 970.56
LSSC-09 10/23/2012 972.08
LSSC-18 10/23/2012 972.17
LSSC-34I 10/23/2012 970.87
LSSC-34S 10/23/2012 970.88
Newell Street Area I (RAA 14)
FW-16R 10/23/2012 972.54
IA-9R 10/23/2012 972.74
MM-1 10/23/2012 975.66
G:\GE\GE_Pittsfield_CD_GMA_1\Reports and Presentations\Fall 2012 GW Qual Rpt\0221311324Tbl3.xlsx
Page 6 of 7
1/30/2013

Table 3Groundwater Elevation Data - Fall 2012 Monitoring Round
Groundwater Quality Monitoring Interim Report For Fall 2012Plant Site 1 Groundwater Management AreaGeneral Electric Company - Pittsfield, Massachusetts
Well NameGroundwater Elevation
(Feet AMSL)Date
Newell Street Area II (RAA 13)
GMA1-8 10/23/2012 971.57
GMA1-9 10/23/2012 972.16
GMA1-25 10/23/2012 974.61
GMA1-26 10/23/2012 972.57
GMA1-27 10/23/2012 973.31
GMA1-28 10/23/2012 972.28
MW-1D 10/23/2012 972.96
MW-1S 10/23/2012 972.34
N2SC-01I 10/23/2012 972.64
N2SC-01I(R) 10/25/2012 968.74
N2SC-02 10/23/2012 971.85
N2SC-03I 10/23/2012 972.08
N2SC-03I(R) 10/25/2012 972.11
N2SC-07 10/23/2012 971.74
N2SC-07S 10/23/2012 971.85
N2SC-08 10/23/2012 974.24
N2SC-09I 10/23/2012 977.31
N2SC-09S 10/23/2012 972.19
N2SC-13I 10/23/2012 972.47
N2SC-14 10/25/2012 972.31
N2SC-16 10/23/2012 971.91
NS-9R 10/23/2012 972.07
NS-10 10/23/2012 973.09
NS-20 10/23/2012 977.89
NS-30 10/23/2012 975.39
NS-32 10/23/2012 974.57
NS-37 10/23/2012 971.68
Notes:
1. AMSL - Above Mean Sea Level
2. Groundwater elevation data was collected on the listed date as part of the fall 2012 monitoring event.
3. Only data from applicable water table monitoring wells are utilized in the preparation of the fall 2012 groundwater elevation contour map.
G:\GE\GE_Pittsfield_CD_GMA_1\Reports and Presentations\Fall 2012 GW Qual Rpt\0221311324Tbl3.xlsx
Page 7 of 7
1/30/2013

RAA 4 - EAST STREET AREA 2-SOUTH
E2SC-23 73 11.24 8.56 0.794 51.30 4.00
RAA 18 - EAST STREET AREA 1-SOUTH
ESA1S-31R 8 13.75 7.03 0.327 127.00 8.40
ESA1S-72R 5 16.92 6.44 1.110 129.60 6.66
NOTES:
1.
2.
3.
4.
5.
6. mg/L - Milligrams per liter (ppm)
Dissolved Oxygen (mg/L)
Measurements collected during fall 2012 groundwater sampling event.
Well parameters were generally monitored continuously during purging by low-flow techniques. Final stabilized parameter readings are presented.
NTU - Nephelometric Turbidity Units
mS/cm - Millisiemens per centimeter
mV - Millivolts
Table 4
Groundwater Quality Monitoring Interim Report For Fall 2012Plant Site 1 Groundwater Management AreaGeneral Electric Company - Pittsfield, Massachusetts
Well IDTurbidity
(NTU)Temperature
(Degrees Celsius)pH
(Standard Units)
Specific Conductivity
(mS/cm)
Oxidation-Reduction Potential
(mV)
Field Parameter Measurements - Fall 2012
G:\GE\GE_Pittsfield_CD_GMA_1\Reports and Presentations\Fall 2012 GW Qual Rpt\0221311324Tbl2_4.xlsx - Table4 Page 1 of 1 1/30/2013

Table 5Comparison of Groundwater Analytical Results to MCP Method 1 GW-2 Standards
Groundwater Quality Monitoring Interim Report for Fall 2012Plant Site 1 Groundwater Management AreaGeneral Electric Company - Pittsfield, Massachusetts(Results are presented in parts per million, ppm)
Site ID:Sample ID: Method 1 GW-2 ESA1S-31R ESA1S-72R
Parameter Date Collected: Standards 10/31/12 10/31/12Volatile OrganicsBromodichloromethane 0.006 0.0021 [0.0020] NAChloroform 0.05 0.028 [0.025] NATotal VOCs 5 0.030 [0.027] NASemivolatile OrganicsNone Detected -- -- --
NOTES:1.
2.
3.4.5.6.7.
East St. Area 1 - South
Samples were collected by ARCADIS and submitted to SGS Environmental Services, Inc. for analysis of volatiles and semivolatiles.Samples have been validated as per Field Sampling Plan/Quality Assurance Project Plan (FSP/QAPP), General Electric Company, Pittsfield, Massachusetts, ARCADIS (approved March 15, 2007 and re-submitted March 30, 2007).NA - Not Analyzed.Field duplicate sample results are presented in brackets.Only those constituents detected in one or more samples are summarized.-- Indicates that all constituents for the parameter group were not detected.Total VOC concentrations are being compaired to the notification level in the SOW of 5 ppm, as there is no GW-2 standard for Total VOCs.
G:\GE\GE_Pittsfield_CD_GMA_1\Reports and Presentations\Fall 2012 GW Qual Rpt\0221311324Tbls567_AppxB.xlsx - Table 5 Page 1 of 1 1/30/2013

Table 6Comparison of Groundwater Analytical Results to MCP Method 1 GW-3 Standards
Groundwater Quality Monitoring Interim Report for Fall 2012Plant Site 1 Groundwater Management Area General Electric Company - Pittsfield, Massachusetts(Results are presented in parts per million, ppm)
Site ID: Method 1 East St. Area 1 - South East St. Area 2 - SouthSample ID: GW-3 ESA1S-72R E2SC-23
Parameter Date Collected: Standards 10/31/12 11/01/12
Semivolatile OrganicsNone Detected -- -- NAFurans2,3,7,8-TCDF Not Listed NA 3.00E-07 J [1.80E-07 J]TCDFs (total) Not Listed NA 1.40E-06 [1.30E-06 QI]1,2,3,7,8-PeCDF Not Listed NA 5.30E-08 J [8.20E-08 J]2,3,4,7,8-PeCDF Not Listed NA 2.20E-07 J [1.10E-07 J]PeCDFs (total) Not Listed NA 1.80E-06 J [1.10E-06 J]1,2,3,4,7,8-HxCDF Not Listed NA 8.50E-07 J [4.50E-07 J]1,2,3,6,7,8-HxCDF Not Listed NA 2.90E-07 J [1.60E-07 J]2,3,4,6,7,8-HxCDF Not Listed NA 2.00E-07 J [1.10E-07 J]HxCDFs (total) Not Listed NA 3.10E-06 J [1.60E-06 J]1,2,3,4,6,7,8-HpCDF Not Listed NA 7.10E-07 J [3.90E-07 J]1,2,3,4,7,8,9-HpCDF Not Listed NA 4.50E-07 J [2.30E-07 J]HpCDFs (total) Not Listed NA 2.20E-06 J [1.10E-06 J]OCDF Not Listed NA 1.80E-06 J [9.20E-07 J]DioxinsTCDDs (total) Not Listed NA 6.10E-08 J [3.20E-08 J]PeCDDs (total) Not Listed NA 2.00E-07 J [9.40E-08 J]1,2,3,4,7,8-HxCDD Not Listed NA 2.30E-08 J [1.50E-08 J]1,2,3,6,7,8-HxCDD Not Listed NA 4.10E-08 J [ND(2.00E-08) J]1,2,3,7,8,9-HxCDD Not Listed NA 2.80E-08 J [1.50E-08 J]HxCDDs (total) Not Listed NA 4.60E-07 J [2.70E-07 J]1,2,3,4,6,7,8-HpCDD Not Listed NA 3.00E-07 J [1.60E-07 J]HpCDDs (total) Not Listed NA 5.70E-07 J [3.00E-07 J]OCDD Not Listed NA 2.80E-06 J [1.70E-06 J]Total TEQs (1998 WHO TEFs) 0.00004 NA 3.10E-07 [1.70E-07]Inorganics-FilteredLead 0.01 NA ND(0.0100) J [0.00647 J]
NOTES:
1.2.
3.4.5.
6.7.8.
Samples were collected by ARCADIS and submitted to SGS Environmental Services, Inc. for analysis of Appendix IX+3 constituents.Samples have been validated as per Field Sampling Plan/Quality Assurance Project Plan (FSP/QAPP), General Electric Company, Pittsfield, Massachusetts, ARCADIS (approved March 15, 2007 and re-submitted March 30, 2007).NA - Not Analyzed.ND - Analyte was not detected. The number in parentheses is the associated detection limit.Total 2,3,7,8-TCDD toxicity equivalents (TEQs) were calculated using Toxicity Equivalency Factors (TEFs) derived by the World Health Organization (WHO) and published by Van den Berg et al. in Environmental Health Perspectives 106(2), December 1998.Field duplicate sample results are presented in brackets.-- Indicates that all constituents for the parameter group were not detected.Shading indicates that value exceeds the GW-3 standard.
Data Qualifiers:
Organics (semivolatiles, dioxin/furans)J - Indicates that the associated numerical value is an estimated concentration.I - Polychlorinated Diphenyl Ether (PCDPE) Interference.Q - Indicates the presence of quantitative interferences.
InorganicsJ - Indicates that the associated numerical value is an estimated concentration.
G:\GE\GE_Pittsfield_CD_GMA_1\Reports and Presentations\Fall 2012 GW Qual Rpt\0221311324Tbls567_AppxB.xlsx - Table 6 Page 1 of 1 1/30/2013

Table 7Comparison of Groundwater Analytical Results to MCP UCLs for Groundwater
Groundwater Quality Monitoring Interim Report for Fall 2012Plant Site 1 Groundwater Management Area General Electric Company - Pittsfield, Massachusetts(Results are presented in parts per million, ppm)
Site ID: East St. Area 2 - SouthSample ID: MCP UCL ESA1S-31R ESA1S-72R E2SC-23
Paramete Date Collected: for GroundWater 10/31/12 10/31/12 11/01/12
Volatile OrganicsBromodichloromethane 100 0.0021 [0.0020] NA NAChloroform 100 0.028 [0.025] NA NASemivolatile OrganicsNone Detected -- -- -- NAFurans2,3,7,8-TCDF Not Listed NA NA 3.00E-07 J [1.80E-07 J]TCDFs (total) Not Listed NA NA 1.40E-06 [1.30E-06 QI]1,2,3,7,8-PeCDF Not Listed NA NA 5.30E-08 J [8.20E-08 J]2,3,4,7,8-PeCDF Not Listed NA NA 2.20E-07 J [1.10E-07 J]PeCDFs (total) Not Listed NA NA 1.80E-06 J [1.10E-06 J]1,2,3,4,7,8-HxCDF Not Listed NA NA 8.50E-07 J [4.50E-07 J]1,2,3,6,7,8-HxCDF Not Listed NA NA 2.90E-07 J [1.60E-07 J]1,2,3,7,8,9-HxCDF Not Listed NA NA ND(3.50E-08) J [ND(2.90E-08)]2,3,4,6,7,8-HxCDF Not Listed NA NA 2.00E-07 J [1.10E-07 J]HxCDFs (total) Not Listed NA NA 3.10E-06 J [1.60E-06 J]1,2,3,4,6,7,8-HpCDF Not Listed NA NA 7.10E-07 J [3.90E-07 J]1,2,3,4,7,8,9-HpCDF Not Listed NA NA 4.50E-07 J [2.30E-07 J]HpCDFs (total) Not Listed NA NA 2.20E-06 J [1.10E-06 J]OCDF Not Listed NA NA 1.80E-06 J [9.20E-07 J]Dioxins2,3,7,8-TCDD Not Listed NA NA ND(7.00E-09) J [ND(5.80E-09)]TCDDs (total) Not Listed NA NA 6.10E-08 J [3.20E-08 J]1,2,3,7,8-PeCDD Not Listed NA NA ND(1.30E-08) J [ND(6.50E-09) J]PeCDDs (total) Not Listed NA NA 2.00E-07 J [9.40E-08 J]1,2,3,4,7,8-HxCDD Not Listed NA NA 2.30E-08 J [1.50E-08 J]1,2,3,6,7,8-HxCDD Not Listed NA NA 4.10E-08 J [ND(2.00E-08) J]1,2,3,7,8,9-HxCDD Not Listed NA NA 2.80E-08 J [1.50E-08 J]HxCDDs (total) Not Listed NA NA 4.60E-07 J [2.70E-07 J]1,2,3,4,6,7,8-HpCDD Not Listed NA NA 3.00E-07 J [1.60E-07 J]HpCDDs (total) Not Listed NA NA 5.70E-07 J [3.00E-07 J]OCDD Not Listed NA NA 2.80E-06 J [1.70E-06 J]Total TEQs (1998 WHO TEFs) 0.0004 NA NA 3.10E-07 [1.70E-07]Inorganics-FilteredLead 0.15 NA NA ND(0.0100) J [0.00647 J]
NOTES:
1.2.
3.4.5.
6.7.
East St. Area 1 - South
Samples were collected by ARCADIS and submitted to SGS Environmental Services, Inc. for analysis of Appendix IX+3 constituents.Samples have been validated as per Field Sampling Plan/Quality Assurance Project Plan (FSP/QAPP), General Electric Company, Pittsfield, Massachusetts, ARCADIS (approved March 15, 2007 and re-submitted March 30, 2007).NA - Not Analyzed.ND - Analyte was not detected. The number in parentheses is the associated detection limit.Total 2,3,7,8-TCDD toxicity equivalents (TEQs) were calculated using Toxicity Equivalency Factors (TEFs) derived by the World Health Organization (WHO) and published by Van den Berg et al. in Environmental Health Perspectives 106(2), December 1998.Field duplicate sample results are presented in brackets.-- Indicates that all constituents for the parameter group were not detected.
Data Qualifiers:
Organics (volatiles, semivolatiles, dioxin/furans)J - Indicates that the associated numerical value is an estimated concentration.I - Polychlorinated Diphenyl Ether (PCDPE) interference.Q - Indicates the presence of quantitative interferences.
InorganicsJ - Indicates that the associated numerical value is an estimated concentration.
G:\GE\GE_Pittsfield_CD_GMA_1\Reports and Presentations\Fall 2012 GW Qual Rpt\0221311324Tbls567_AppxB.xlsx - Table 7 Page 1 of 1 1/30/2013

Proposed Spring 2013 Interim Groundwater Quality Monitoring Program Sampling Activities
GW-3 Perimeter (Downgradient) Lead
Supplemental sampling and analysis for lead proposed to be conducted in spring 2013 to further assess prior GW-3 exceedances of this constituent.
GW-3 Perimeter (Downgradient) PACSupplemental sampling and analysis for PAC proposed to be conducted in spring 2013 to further assess prior PAC and total cyanide concentrations slightly below (i.e., greater than 50%) of GW-3 Standard.
GW-3 General/Source Area Sentinel PCBSupplemental PCB sampling proposed to be conducted in spring 2013 tofurther assess anomalous GW-3 exceedance of this constituent in fall 2011.
GW-3 Perimeter (Downgradient) Lead
Average lead concentration is slightly below GW-3 Standard (i.e., greater than 50 %). Supplemental sampling for lead proposed to be conducted in spring 2013 to further assess anomalous lead concentration from spring 2003
GW-3 Perimeter (Downgradient) Lead
Average lead concentration is slightly below GW-3 Standard (i.e., greater than 50 %). Supplemental sampling for lead proposed to be conducted in spring 2013 to further assess.
GW-2 Sentinel PCBAdditional spring sampling and analysis for filtered PCBs required by EPA will resume in spring 2013.
GW-2 Sentinel (Conditional) PCB
PCB analyses to be conducted on a semi-annual basis to evaluate compliance with MCP GW-2 standard if depth to groundwater is less than 15 feet and if an adequate volume of water is present in the well at the time of sampling.
GW-2 Sentinel VOC, SVOCContinued semi-annual sampling to be performed at this location in spring 2013 to demonstrate compliance with GW-2 criteria.
GW-2 Sentinel/GW-3 General/Source Area Sentinel SVOCSupplemental SVOC sampling proposed to be conducted in spring 2013 to obtain additional data for full SVOC list (instead of five select SVOCs).
NOTE:
1.
Table 8
Groundwater Quality Monitoring Interim Report For Fall 2012Plant Site 1 Groundwater Management AreaGeneral Electric Company - Pittsfield, Massachusetts
RAA 4 - EAST STREET AREA 2-SOUTH
Well Number Monitoring Well Usage Basis for Inclusion or Exclusion/CommentsAnalysis (See Note 1)
RAA 5 - EAST STREET AREA 2-NORTH
RAA 18 - EAST STREET AREA 1 SOUTH
All analyses for PCBs, PAC (physiologically available cyanide), and lead will be performed on filtered samples only.
ESA1S-31R
ESA1S-72R
A7-RR
GMA1-4
E2SC-24
ESA2S-52
E2SC-23
GMA1-30
HR-G3-MW-2
G:\GE\GE_Pittsfield_CD_GMA_1\Reports and Presentations\Fall 2012 GW Qual Rpt\0221311324Tbl1_8.xlsx Page 1 of 1 1/30/2013

Figures

GMA 1 (PLANT SITE 1)
!GMA2! !GMA3! !GMA4! !GMA5! W//41
-a an RAAI-401COII'ID ---_,__ .... - S1llm- 2-11111'111 RM ll-f1.UI' !mEET ND _. 11M 8-EAST IIIlEr NU. ,__.,.
RM 12-4.WNI S1llm'- ('ICWQIIIC FCIUfO. OGQift I. D ,MiD Q
- I;HQfll. IIIlEr NU. I RAA t4-I'EE.l. IWET NlD. I RAA 17-11.\G ~ dEJtt lltM 18--£\IT 8JJUf NtEA 1~
~TEll CN.'I)
GilA :J.fi!NIT 1m 2
CMA s-F'liiMER OlGIOIB IIMJ
Pm'fiiTT -- liWIIIP!IIID ~"Jl1"&--
1. ==: r.,~~-:o~'f!'",U~~. PR11MXD ltv BERM. arx:'INC COIIPMC\'; Ale aAS.AID A -.a Di- P.C. CDGIIU:!DI I'IMS.
2. IGT IlL Pll'f!ltM. II'AIIJAD-
II. ---ftJMITI.W:-~
' - ·--
GROUNDWATER MANAGEMENT AREAS
~ARCADIS 1

- ---·
INI!ND:
-----1-D ~ll.la$ , .... .. __ ,
- 1m: R'AlllftE
-+ -·llal. -D ... AraMitY CAl--· M:JNE PmF~NC -.u. • EX1IIIT elf Oi.uJD -
0 GW-2SiillliEL/ COIII'IIAHCZIGL
¢ GW-:S PERIMr:ID 1ELL
0 CIIOAI/DJIU IlEA &llli!L EL (cw-:1)
• FAIL :1012--~-
2. NOT lt.L PMYBCIIL FEAn.B .....
3. 111! IIUIJMY • WPIDCMAE.
4. M1. IIGIIftRHO lEU. IDCAnaHI II£ APPACIOIIU 1!.
GMA1
FALL 2012 GROUNDWATER SAMPLING LOCATIONS
~ARCADIS 2

9
7
2
9
7
2
9
7
4
1
0
3
0
1
0
4
0
9
8
8
9
8
6
984
982
9
8
0
9
7
8
9
7
6
9
8
0
990
992
994
1
0
1
8 1
0
2
0
1
0
2
2
1
0
2
4 1
0
2
6
1
0
2
8
1
0
3
0
1
0
3
2
1
0
3
4 1
0
3
6
1
0
3
8
1
0
4
0
996
998
1000
1002
1004
1006
1008
1
0
4
2
1
0
4
2
1
0
3
8
1
0
3
6
1
0
3
4
1
0
3
2
1
0
2
0
1
0
2
8
1
0
2
6
1
0
2
4
1
0
2
2
1
0
1
0
1
0
1
8
1
0
1
6
1
0
1
4
1
0
1
2
1
0
0
0
1
0
0
8
1
0
0
6
1
0
0
4
1
0
0
2
9
9
0
9
9
8
9
9
6
9
9
4
9
9
2
990
970
1
0
1
0
1030
970
9
8
0
9
9
0
1
0
0
0
9
7
4
9
7
6
976
9
7
4
9
7
2
970
9
8
0
970
970
970
970
1012
1014
1016
1010
9
8
2
984
986
988
9
7
8
9
7
0
1020
9
7
0
IM
AG
ES
:X
RE
FS
:
20136X
03
20136X
DL
20136X
11
PR
OJE
CT
NA
ME
: ----
CIT
Y:
Syracuse G
RO
UP
: E
nvC
AD
D
B: D
.W
odarczyk, P
.LIS
TE
R, A
.S
chilling LD
: A
.S
chilling, R
. B
AS
SE
TT
P
IC
: P
.K
eaney P
M: C
.A
verill T
M: N
.S
mith LY
R: O
N=
*;O
FF
=*R
EF
*
G:\G
E\E
NV
CA
D\S
YR
AC
US
E\A
CT
\N
\B
0010113\0002\00004\D
WG
\G
MA
1\20136W
01.D
WG
LA
YO
UT
: 3
S
AV
ED
: 1/30/2013 1:00 P
M A
CA
DV
ER
: 18.1S
(LM
S T
EC
H) P
AG
ES
ET
UP
: ---- P
LO
TS
TY
LE
TA
BLE
: P
LT
FU
LL.C
TB
P
LO
TT
ED
: 1/30/2013 4:34 P
M B
Y: S
CH
ILLIN
G, A
DA
M
WATER TABLE CONTOUR MAP
FALL 2012
GENERAL ELECTRIC COMPANY
PITTSFIELD, MASSACHUSETTS
GMA1 GROUNDWATER MONITORING
PROGRAM
FIGURE
3

- ---·
INI!ND:
-----1-D ~ll.la$ , .... .. __ ,
- 1m: R'AlllftE
-+ -·llal. -D ... AraMitY CAl--· M:JNE PmF~NC -.u. • EX1IIIT elf Oi.uJD -
0 GW-2SiillliEL/ COIII'IIAHCZIGL
¢ GW-:S PERIMr:ID 1ELL
0 CIIOAI/DJIU IlEA &llli!L EL (cw-:1)
• lEU. fltiOIIOIED 11) IE IMPLED IN 8fiiN9 -~
GMA1
PROPOSED SPRING 2013 GROUNDWATER QUALITY
MONITORING PROGRAM ACTIVITIES
~ARCADIS 4

Appendices

Appendix A
Summary of Fall 2012
Field Monitoring/Sampling Data

Tables

Table A-1Monitoring Well Inventory Summary - Fall 2012
Groundwater Quality Monitoring Interim Report for Fall 2012Plant Site 1 Groundwater Management Area General Electric Company - Pittsfield, Massachusetts
Fall 2012 Current Depth Fall 2012 Depth to
Well to Bottom(1)Bottom Difference
Name (ft BMP) (ft)
30s Complex
GMA1-29 10/24/2012 20.86 20.80 0.06 0 0.00 0.00 0 0.00
RF-02 10/24/2012 17.95 19.44 -1.49 Surveyed on 6/8/2012 0 0.00 0.00 0 0.00
RF-03S 10/24/2012 15.69 15.20 0.49 0.00 0 0.00 0.00 0 0.00
RF-03D 10/24/2012 35.13 34.70 0.43 0.00 0 0.00 0.00 0 0.00
East Street Area 2-South #N/A #N/A #N/A #N/A #N/A #N/A #N/A #N/A #N/A
52 10/24/2012 27.36 27.35 0.01 0.00 0 0.00 0.00 0 0.00
64 10/24/2012 21.85 21.14 0.71 Needs 3 Washers Add 3 washers 0.00 0.00 10/25/2012 Added washers
E2SC-23 10/24/2012 20.97 21.15 -0.18 0.00 0 0.00 0.00 0 0.00
E2SC-24 10/24/2012 20.90 21.61 -0.71 0.00 0 0.00 0.00 0 0.00
3-6C-EB-14R 10/25/2012 18.94 20.20 -1.26 Surveyed on 6/8/2012 0.00 0.00 0 0.00
ES2-02AR 10/24/2012 16.21 17.94 -1.73 Surveyed on 6/8/2012 0.00 0 0.00
GMA1-24R 10/24/2012 19.02 20.28 -1.26 Surveyed on 6/8/2012 0.00 0.00 0 0.00
GMA1-30 10/24/2012 19.29 20.29 -1.00 0 Re-survey 0.00 0 0.00
HR-G3-MW-2 10/24/2012 15.06 14.84 0.22 Needs New Lock 0 Add lock 10/29/2012 Replaced lock
East Street Area 2-North #N/A #N/A #N/A #N/A 0 0.00 0.00 0 0.00
A7-RR 10/24/2012 11.53 11.97 -0.44 0.00 0 0.00 0.00 0 0.00
F-1 10/24/2012 18.82 19.46 -0.64 0 0.00 0.00 0 0.00
GMA1-4 10/24/2012 19.91 20.02 -0.11 0.00 0 0.00 0.00 0 0.00
East Street Area 1-South #N/A #N/A #N/A 0.00 0 0.00 0.00 0 0.00
ESA1S-31R 10/23/2012 15.27 14.86 0.41 0.00 0 0.00 0.00 0 0.00
ESA1S-72R 10/23/2012 13.55 12.92 0.63 0.00 0 0.00 0.00 0 0.00
ES1-13R 10/23/2012 13.38 13.90 -0.52 0.00 0 0.00 0.00 0 0.00
GMA1-6 10/23/2012 14.71 15.15 -0.44 0.00 0 0.00 0.00 0 0.00
Lyman Street Area #N/A #N/A #N/A #N/A 0 0.00 0.00 0 0.00
LSSC-08S 10/23/2012 14.47 14.93 -0.46 0 0.00 0.00 0 0.00
LSSC-16S 10/23/2012 14.83 14.50 0.33 Needs New J-Plug 0 Replace J-plug 0.00 10/25/2012 Replaced J-plug and lock.
LSSC-18 10/23/2012 22.53 23.20 -0.67 0 0.00 0.00 0 0.00
Notes
1. As-built depth based on original well construction details.
2. ft BLS - Feet Below Land Surface
Date(s) of Inventory
Date(s) of Completed
Maintenance
Inner Casing Maintenance (Modify Riser,
Replace J-Plug, Re-survey)
General Maintenance (Replace bolts/lock,
Label well ID, Clean/Repair seal/lid)
Outer Casing/Manhole w/ Bolts, Cover, Seal &
Road box
Completed Maintenance for Fall 2012
Fall 2012Measured Depth
(ft BMP)
Areas Identified for Follow-up in fall/winter 2012-2013
Fall 2012 Comments Noted During Inventory
G:\GE\GE_Pittsfield_CD_GMA_1\Reports and Presentations\Fall 2012 GW Qual Rpt\0221311324AppxA_TA1.xlsxTableA1
Page 1 of 1 1/30/2013

Table A-2
East Branch Housatonic River at Coltsville, MA River Discharge Data
Groundwater Quality Monitoring Interim Report For Fall 2012
Plant Site 1 Groundwater Management Area
General Electric Company - Pittsfield Massachusetts
DateMaximum
Discharge (cfs)10/23/2012 107 Fall 2012 Groundwater Elevation Monitoring Event
10/24/2012 86 Fall 2012 Groundwater Elevation Monitoring Event
10/25/2012 265 Fall 2012 Groundwater Elevation Monitoring Event
10/31/2012 262 Groundwater Samples Collected
11/1/2012 228 Groundwater Samples Collected
NOTES:
1.
2.
3. 4. Location: Lat 42°28'10", long 73°11'49", Berkshire County, Hydrologic Unit 01100005, on right bank 250 ft
downstream from Hubbard Avenue Bridge at Coltsville, 1.2 mi upstream from Unkamet Brook, and 2 mi northeast of Pittsfield.
Housatonic River discharge data obtained from the USGS Real-Time Water Data for Massachusetts Web Interface.
Data collected over 15 minute intervals, Daily maximum discharge values are presented.
The Fall 2012 groundwater elevation monitoring event at GMA 1 was conducted on October 23-25, 2012. The Fall 2012 groundwater sampling event at GMA 1 was conducted on October 31 , 2012 and November 1, 2012.
Comments
G:\GE\GE_Pittsfield_CD_GMA_1\Reports and Presentations\Fall 2012 GW Qual Rpt\0221311324AppxA_TA2_A3.xlsx - TableA2
Page 1 of 1
1/30/2013

Table A-3
Housatonic River Elevation at Lyman and Newell Street Bridges
Groundwater Quality Monitoring Interim Report For Fall 2012
Plant Site 1 Groundwater Management Area
General Electric Company - Pittsfield Massachusetts
Lyman St Bridge Newell St BridgeGMA 2 Foot
BridgeRiver Elevation
(ft AMSL)River Elevation
(ft AMSL)River Elevation
(ft AMSL)10/23/2012 970.17 971.49 972.97
10/24/2012 970.32 971.59 973.10
10/25/2012 970.34 971.53 973.04
10/30/2012 971.33 N/A N/A
10/31/2012 N/A 972.18 N/A
11/1/2012 N/A N/A N/A
NOTES:
1.
2.
3.
4. N/A: Data not available.
Date Comments
The Fall 2012 groundwater monitoring event at GMA 1 was conducted on October 23-25, 2012. The Fall 2012 groundwater sampling event at GMA 1 was conducted on October 31 , 2012 and November 1, 2012.
River elevation data was collected in the vicinity of the groundwater sampling locations on the dates presented above.
River elevation data from the closest monitoring rounds conducted before and after the groundwater monitoring and sampling dates is also provided above
Fall 2012 Groundwater Elevation Monitoring Event
Fall 2012 Groundwater Elevation Monitoring Event
Groundwater Samples Collected
Fall 2012 Groundwater Elevation Monitoring Event
Groundwater Samples Collected
G:\GE\GE_Pittsfield_CD_GMA_1\Reports and Presentations\Fall 2012 GW Qual Rpt\0221311324AppxA_TA2_A3.xlsx - TableA3
Page 1 of 1
1/30/2013

Groundwater Sampling Logs

I/ /.5
GROUNDWATER SAMPLING LOG
r::-z '' c· 2 ,., Well No. 1=. ,...) - .:':>
Key No. f" · 3 71 PID Background (ppm) --------
Well Heads pace (ppm)---------
WELL INFORMATION
Reference Point Marked? 1 Y) N
Height of Reference Point _'44~~'-· {~---Well Diameter___,,.:Z:-.... ~<.:.·;:1-')_
Screen Interval Depth -:..I /._---::-'2""1'-:. ,.,-Water Table Depth ( f ,"(i
Well Depth ) / / 'l Length of Water Column 2 o 7 5 Volume of Water In Well • ¥('8)i
Intake Depth of Pump/Tubing _...;:1_1.._.,_,, L=--
Reference Point ldentifica!ion:
TIC: Top of Inner (PVC) Casing
TOC: Top of Outer (Protective) Casing
GradeJBGS: Ground Surface
Redevelop? v® Additional well maintenance needed?
EVACUATION INFORMATION i/)3tJ
Meas. From~rz:d<_ Meas. From -T) C. Meas. From J I ( Meas. From ·T I C
Meas. From~~-,-/ (
(W yes, describe below)
Required
( )
(
(
<X
(
(/(
Analytical Parameters;
VOCs (Standard List)
vocs (Expanded Ust)
svocs PCBs (Unfi~ered)
PCBs (Filtered)
Metalsllnorganlcs (Unfiltered)
Metalsllnorganlcs (Filtered)
Total Cyanide (Unfiltered)
Total Cyanide (Filtered)
PAC Cyanide (Filtered)
PCDDs/PCDFs
Pesticides/Herbicides
Natural Attenuation
11. Pump Start Time _;_/_, iL;::.·'-r:;;:-:7_ Pump Stop Time /:1/0 Evacuation Method: Bailer ( Bladder Pump k}
PAGEl_o, z-
Collected
( )
(
(
(
<X, ( )
( )
(~)
Volume of Water Removed"'-' (e~~ Minutes of Pumping ~7,# . _......_ Peristaltic Pump Vl'J r- Subm~ible Pump ( ) Other/Specify ( )
Pump Type: LV C D , :Xl mph· Prt~ Did Well Go Dry? Y Samples collected by same method as evacuation? Y N pecify)
~ckt... Water Quality Meter Type(s) I Serial Numbers: ~SL /} ;/)6 z s -78 #3
uA.cY a 00 p II v b•I"Lt' t.tA , 11 tP Pump Total Water Temp. pH Sp.Cond. Turbidity 00 ORP
Time Rate Gallons Level {Celsius) {mS/cm) (NTU) {mg/1) (mV)
{Umln.) Removed lftTIC) 13%]* [0.1 un~s]* [3%]* [10% or 1 NTU]* [1 0% or 0.1 mg/1}* _110 mvr
)()50 (/(J I\{, 7'1 ro ; ; o G ()0 \~.%5 ,) 2 .f.!l6f .SD 19. 'll 1/. .. 5 g-_, 7 :; '?SG.~3 eX/_ 2-'J --9 f/9- :5 ,;zo 6-c> ;g-:9)1 /!.::;- ? .. y(j '80z :<r 2.,/( ~·]?:_z_
112.5 "10 ~~, Yc;. I ttY ~ g3 S'c?st :2"/ z. 6Cj c;s.5·
/!30 ijt) IE'.. 9ft /l.,y ~-8; xc,::; 39 I •. g 7 5(Jc'j
1/35 L/0 /9'00 If. 1- 8~~s _8'(-,<f 3? 1~?2 -...., .7 J.c....,_.
/;~() Yd .._v IY:Cif. ;z.c) Ft-'13 ??e:;3 :21 I . ? ,-7. ~ !.(,<. ~ 22/j_ . · i ation criteria for each field arameter three consecut'1ve readin s collected at 3- to 5-rninute ·nte als ·s i ed · e The stab1l z p g 1 rv )1 1st 1n ach co lumn headin . 9 f)2k
OBSERVATIONS/SAMPLING METHOD DEVIATIONS
·I x
SAMPLE DESTINATION
laboratory: ~ $615 Delivered Via: ------------t..eSL...o~
Airbill#: ____________ _ FOld Sompll"' C.onll••'"' ~.,4 ~ f"

Well No. fZt5{!- aJ
WELL INFORMATION· See Page f
Pump Total
Time Rate Gallons (Umln.) Removed
1!'15 t.Jo 115(1 YO Irs 5 vu 1200 (./()
/)().5 Yo /J./0 YO /:{ 15 '/{;>
!2Z0 9()
12.25' a~o J J. 36 &5()
123--.5 &lC:lO I;:{ t;() ,:)(:f)
;(}c;s 7'u Jc;(so YO ld..55 (,It! 13(!0 1sd (\V \ 3ns ~)~ ~4!+1 /510 .:J- DPt- @
c '" :J. s- - -~tU~6""' _,A, ~.t\U-~
I'
Water Level
(ft TICJ
/9oCJ lf,ji_ Jtf.l<f 19.;7-/9t;.? 17~2. !9.2~
GROUNDWATER SAMPLING LOG
sttetGMA Name ......:G::;....<..,..;,.:.!J...:....,A:::-:-c---1 _,......,pr..-_.. :..._~ H_s_· ~-'~_lJ ___ _ Sampling Personnel -=K~L:.:...F...:..f':,-1 -.6.1:-..~.l:.c...C-------
Date ~~~P:....t.l_,_·, ).J.t., /-J.r_.2:.-.:--_____,,,---------Weather -+ll-""u.cu...lt"+-.{-__,_(-41; !C-"'.u=:!dJ,.H1_..w5"""'Z>'-"':L.____ ___ _
IJ (/
Temp. pH Sp.Cond. Turbidity DO ORP (Celalus) (mS/cm) (NTUI (mg/1) (mV)
{3%]' [0.1 units!' [3%}' [10% or 1 NTUJ' [10%or0.1 mg}l}' [10mVJ'
J2r 3 Cfcr0 3'C:2;' IV j, Y'.-s· Jo 12~8 1./Z ec; 1 )? \. 30 -7'/1 /.3 0 Z . . ., ~-~-::::; •.) ~c:·~ G i <' i 5" -16_7 /._).j 9G~} 8' t:i.s c /~I C/ --:::v -<1 12··9 9,5/ gc;,-:r 5 i.O'iJ: ·- /''··i' //.9 9' .. 35 ?~~ 7. ·Y /.. ( 2. -zr;;-,g
l Z,:J c; ;e:: 8&c; Lj 1.6·7- ?·, y ·- :::>,') ,.
19.. zS i 2c>S (f 2? f,2 /fe:: 3 3 /. iZ -S{_') t /
/f/. .S I 17. C) 9c'3 2. &CG Q c;! ~ '9<; ·-41-.. 9 JCJ. 'It //, 9 9, 3 -.; \~(5$( _?_ /, 1'1 -y' < .s .. ;t; 'tO Jlc-.3 Cfe'f6. K'3 f? .. 5 ~y C' .:J - i2.lj. /?Y'r j/, 3 o,;;q 7. S(f 3 / 5 (3l --7-7 ,., ;c;,,gJ 1/i/ 7.;') &G, s --3~ -?-g,o Jy(' 90 /1 Y' 0 7-/,f - f{5;? 'l ~7 c· -.J . - ~t,'j
I 9. q 1. It,, '(? <(', I i- ~C:- I t/ o(,/ -:5:?.2 I~ )f.,~\:: I; .. f~ 9--~ ~6.) /2) eSC, -j';~(j
~:*- ll r. 9, 1'-/ r·,;;. .• ") Q"(,c 6-=1-- ?; ~-'<> ;j _,. -y:{'/_
/~9~~ B"-tP- TN) (}~ -ibn£' Lt.H tl r1 ~A'K t)r1 sltli? ·-tn col .u.""
, f ,. I
St tuvull... ·J~.L/u \I. ;;(.: rz ·"n(· (! ~J_., '-1 -~ ·::: c'-/ [(./ ··'·"I ,; ... ......,, /
l'nlL_.e. ~.J?J Pt lDl)s/Pt. lnFs J 1 oad ~ '15/J.bsf) ~yJ) -~ ~ I , I
• The stabilization critena for each field parameter (three consecutive readings collected at 3· to 5-minute intervals) is listed in each column heading.
C \Ooeume-ntt 1nd Setfl"gt\KCORNWELL\Oe.ll;fop\GE Prtt.fleld'\l64711324AppliD-A!:IIID·2l'l'l PRgt 1 of 1

PAGE_loF~1
GROUNDWATER SAMPLING LOG
b 5"{\ l - .., , r Well No. ·-:1 - ,; j _·;~
Key No.
PID Background (ppm)
Well Headspace (ppm)
WELL INFORMATION
Reference Point Marked? y (!:!} Height of Reference Point
Well Diameter :2 i'
Screen Interval Depth S.--\';;. ')
Water Table Depth ().).:::, Well Depth (j -9 (·
Length of Water Column I ( ~"l ~ Volume of Water in Well ;} c~ ciJ
Intake Depth of Pump/Tubing j"2 .. l
Refenence Point Identification:
TIC: Top of Inner (PVC) Casing
TOC: Top of Outer (Protective) Casing
GradeJBGS: Ground Surface
Redevelop? Y G
Meas. From
Meas. From
Meas. From Meas. From
Meas. From
Additional well maintenance nHded? Y G EVACUATION INFORMATION ~
J!< Pump Start Time -~ \ 'LOO Pump Stop Time i S j S
Minutes of Pumping ") ( ?' Volume of Water Removed "' ?, .S ~-, '"' I
Did Well Go Dry? Y ® Water Quality Meter Type(s) I Serial Numbers:
Pump Total Water
Time Rate Gallons Level
!Umln.) Removed (ftTIC_l
l2~~ S') <~L/r-,JI - q ~"') .U,;..
\.)00 ---· tt.ob l')u5 ~. 't.o<J l~tO - C{,Og
t3 t '5 -- q -O'i \~'2-0 ~- q_o4 !) 25 -· '-\. \0 1>~0 ';:; - q,' \
Site/GMA Name
Sampling Personnel
Date
Weather
fvtd'--
\tC I\ C.
'T1,.
T \.<-
(W yes, describe below)
Required
<>() ( )
<X:::,> ( )
Analytical Parameters:
VOCs (Standard List)
VOCs (Expanded List)
SVOCs
PCBs (Unfittered)
PCBs (Filtered)
Metals/Jnorganlcs (Unfiltered)
Metalsllnorganlcs (Filtered)
Total Cyanide (Unfiltered)
Total Cyanide (Filtened)
PAC Cyanide (Filtered)
PCDDs/PCDFs
Pesticides/Herbicides
Natural Attenuation
Other (Specify)
Evacuation Method: Bailer ( Bladder Pump (\f
C~fv)l\ I
Collected
( )"\_) )
x> )
Peristaltic Pump ( ) Submersible Pump ( ) Other/Specify ( )
Pump Type: I Ot · '(" r "'-' ~ 1~.-i f ') Samples collected by same method as evacuation? ' y' · N (specify)
Temp. pH Sp.Cond. Turbidity DO ORP
(Celsius) (mS/cm) (NTU) (mg/1) (mV) [3%]• [0.1 units]• [3%]• I [10% or 1 NTUJ• [10% or 0.1 mgll]• [10 mVJ•
lY ~ 2-t.t ·l-1-U 0 3!2 ?o 8 'Gt g t{G 2 tq .. os f-08 0 ,)\'2 Y0 8 .s:x tf->1 {~
[U.O~ 7~oS 0-3i""?;> ')Q ' \.) i? bb lSq ')
ll-(.03> 7~0~ 0-3l5 7o 8 6° ' .Q l s ~ .0
ti..J~05- 7 .o?:> 0 -~ l] 2'-( ?].6£ \Lfi..2> \ ~ -'1 £ 7-00 (! 3, l<i L. t t;l {q u- "/ t q(q. 5
\'-> '\S 6 /i q 0 '>20 t7 9 (j- 00 \Lf7.\
\).~ Lf 7-0~ o,:,l.t \S 2 L1 Q . 0 \1-\G-l.f • The stabilizatiOn crilena for each field parameter (three consecuuve neadtngs collected at 3- to 5-mtnute intervals) is listed in each column heading.
OBSERVATIONSISAMPLINGMETHODDEVIATIONS \(\1\)Cj\ v::::~.-VC(fh (1 \0,!(itil Y\0 C>Cl.O f
hy:c;;.\ 0urJ' (\I.Jc v nr i OQci l?
SAMPLE DESTINATION
Laboratory:-------------''-'-~
Delivered Via:------------'-'"-"-"'" Airbill#: _____________ _ Field Sampling Coordinator: ,V 0/J.{ .!\ {! U ( \/ '-- C (. l
l

') -, PM:.E.::_. OF_::-·
GROUNDWATER SAMPLING LOG
wen No. _--J:;;E:.c..-_S_t_\_\_:.S_,; _---~_l_f_...__ __ _ Slte/GMA Name f ''-'· \ ':.\ 1\c-e ' l · ~ 6 u \\1 C::)N 1\\
WELL INFORMATION· See Page1
Pump Total Water
Time Rate Gallons La vel (Umln.) Removtd (ft TIC)
t-:z,--:>S c:;o.-. .. )Y'{.( -- '9 . l \ \:, L{O {S ml/""-::(\ - C( . i l I~Y5 - ci.,\\
\~So - 9.! l \:,~'7 - t:L l \
\ ~~(.)U ~ (~ . l i
\L-\05 - 4. l \
1'-!IU " :3-;-6qt{ q_ ( \ \'t\_1 o.l{f' e \ e'(-:;
S ampflng Personnel _ __.T"""--'\'c...-'_h.....;\_'\r:.._l'_ 1'-J..,._,_~C"-'-A--__,_,_( "--(,,_,\'-'~·_,_\.:.c.' ''-'-\-'-1 :=..'-• ..... r..._·i __
o~. --~-\~Cu•f~~~'~/,l_2~~~-~---------Wea~er ----~C~--~~~~~·_c;_+_,_5_-~--~--~5_G_'_· __________ _
Temp. pH Sp. Cond. Turbidity DO ORP
(Celsius) (mS/cm) (NTU) (mg/1) (mV) [3%1' [0.1 un~sl' [3%]' [10% or 1 NTUJ' [10% or 0.1 mgtl]' [10 mVl'
~~ 7 ( 7-0L 0-~J\ iL-\ <") 4 '6 c- \lis.:, ~~. 6~ 7 ~ <) ':::> 0 '3 )_2 ) 2- ~~-'ib IL\l.~ t 3,.(; 2 7. 0 l-{ 0.323 \ l ·~L !{- & 136 s t) -Sb 7;o) 0.?>2Lf l --s r> 4 C)
<S- o \ )5 0
l~.tJ.J l--0~ ci ~)25 \ (_) ~:. YL ( s L{_ (
\'~ .• , 2. ?~u!J 0-'?>'2~ 'i 9 . Lil 11.'~LS
\) .l~ [_,0~ 0-~~6 8 gJ'-iO \1'6-l.t
I "' -:::, ,( .. 7-0~ 0-'?>27 Ci} 8 .3~ \27-0
.s -\--~~te 5?.A.__ yYl 'f {e<.~ @ _) \'-\(0
• The stabilization cntena for each field parameter (three consecutive readings collected at 3- to S-m1nute 1ntervals) 1s listed m each column head1ng.
OBSERVATIONS/SAMPLING METHOD DE~V_~(,)N:i::::,..._
\ -
PAge 1 of 1

' ) PAGE ___:_ OF ,.S;_
GROUNDWATER SAMPLING LOG
Well No. _--!;:E:....:· S.,=--_A_\_',_· _7.:__J_,.;_~-'----KeyNo. ______________ ~-----------
PID Background (ppm) --------------
Well Headspac:e (ppm) -----------
WELL INFORMATION
Reference Point Marked?
Meas. From -----Height of Reference Point_~~-
Well Diameter -:::--'Jt:-:-'-' -:-::'~· Screen Interval Depth "> S · I~ "). Meas. From _-.::'-l,._L..,.· __
Water Table Depth I) . 'f h Meas. From _]..._·..,_; ..,.L __ Well Depth I ;'$ • ! Meas. From -11--'l'--'. c....=-· _
Length of Water Column ' "9. 0 .a,... 7. 1 -z .. Volume ot Water In Well a \ ~~- c;, <t I
Intake Depth ot Pumpffubing ~ \ 0 t 1 Meas From ___ 1_\.;._C. __
Reference Point Identification:
TIC: Top ot Inner (PVC) Casing
TOC: Top of Outer (Protective) Casing
Grade/BGS: Ground Surface
Redevelop? Y fJ
Required
( )
( )
( .>(_> ( )
Sample Time _-;-'-! 7o-:Sh"_·_c.:::·':-) --,:::;-:::--r.,-
sample 10 --"t'-,; _-:~A...:.·· _\."";:'-· .• _·_7..;_;;;2;;.....:.(....:.~--Duplicate 10 --.,.-----,.,.---..,....,....
MS/MSD I:" sA\~· 7 J \<-.. • M.~ Spm Sample 10 t; J f\ i 5 ·· 7 .! 6- M .:. '()
Anal:ili!;il Pa!]meters; Collected
VOCs (Standard List) ( )
VOCs (Expanded Ust) ( )
SVOCs <(> PCBs (Unfinered) ( )
PCBs (Filtered)
Metalsllnorganics (Unfiltered)
Metals/lnorganics (Filtered)
Total Cyanide (Unfiltered)
Total Cyanide (Filtered)
PAC Cyanide (Filtered)
PCDDslf>CDFs
Additional well maintenance needed? (if yes. describe below) PesticidesiHerbieides
EVACUATION INFORMATION ~ \S l..jS ~ Pump Start Time --=~::..:,~'-
Pump Stop Time ltk .?')1) Minutes of Pumping L:: S
Volume of Water Removed "'- \ '4 '{] ""' \ Did Well Go Dry? Y 0)
Natural Altenuation
Other (Specify)
Evacuation Method: Baller ( Bladder Pump 0 Peristaltic Pump ( ) Submersible Pump ( ) Other/Specify ( )
Pump Type: G G V \) c-td c.~'{"( N (specify)
WaterQualityMeterType(s)/SeriaiNumbers: YSI 59P HP.s l/A0-1 {YJ()()f::> 7Zzb,dt o/LJi.i{. ~~
Pump Total Water Temp. pH Sp.Cond. Turbidity DO ORP
Time ilte Gallons level (Celsius) (mS/em) (NTU) (mg/1) (mV)
min.) Removed (ftTIC) [3%]. (0.1 unnsJ• 13%]• 110% or 1 NTUl• [10% or0.1 mg/ll• 110 mVJ•
I bOO lCX..! ,w.J,•r<l - &.oct lS I(! ~t..> 6 7_j \_c<t7 h (,.'2,( 1'28-L
u~) o s - b. 10 IS. ! (, G. LIB \. ocl] b 6. ll l£ f;. 4 HID -· b. l () t '). { L.j 6 _Lf) l '0 ') g ') b ( ! Ito I H:.IC) '- 6 I\ \C) 12 b-tl~ \-lvO L.l C: .. · SLf \51-~ I
!t,'20 -· (;. l l \5. l 0 bJt 2 r- to"?:> 3 b- G I !LfG.Lf '()t s - G \2._ l ') .. l 0 G Y2 \-\)5 3 6 lj cr \'11.7
lb :>o - b t2 iL-\ _"to b.3~ \ -l 0( '2 6 57 { 3'1'. 5 ..:>
ib )? !/ b \2 tLL73 t- . 'il l,(CJ7 i-{ f; -G Lf ()3 2
• The stabilization criteria for each field parameter (three conseeut1ve readings collected at 3- to 5-minute intervals) is listed in each column head~ng.
OBSERVATIONS/SAMPLINGMETHODDEVIATIONS \Y\\\J[tt \JLX£}k· ', (lDcU· !'\Co ,~10h< 1k:>lD Od(')C
SAMPLE DESTINATION
Laboratory:------------<·..,·(~~"'--~ Delivered Via: __________ ---.~.a;.....:S"". ·...:
Airbill#: _____________ _
c c> 1· 'L
Field Sampling Coordinator: \ I (

WELL INFORMATION· See Page1
Time
/650
Pump
Rata (Umln.)
Total
Gallons
Removed
Water Level
1ft TIC\
GROUNDWATER SAMPLING LOG
Slte/GMA Name Gc~.- "lt:- _\i A ('eC\. \ ·- s·c" f\•) I G r·il\ ( Sampling Personnel ---L) "-< --'-M_,t.::;C·.:::.'-'f:.,.J-~-"-' 0!..7-+l _0:::::·~, ·__:;{:.::.c.:.:u:..!· r..::.1.::..':"-~..:..'-·'-:.:..i1.:....,_
D~e ------~~~C~;f_.~3~i~(....~r_~~--~--r--------weather __ _.:...C._:I_,v'-~::..'..!1...:C~r'-::..-~::.' --''--~----' _'i'-''::..~ w_.:_f'_· ----
Temp.
(Celsius)
13%1'
pH
[0.1 unHs]'
61!?
Sp. Cond.
(mS/cm)
{3%1'
I-ll 0
Turbidity DO
(NTU) (mgill I !10% or I NTUJ' ItO% oro. I mgJI!'
ORP (mV)
(tOmW
\J(( r G
• The stabilization critena for each field parameter (three consecutive readmgs collected at 3- to S·mmute Intervals) IS listed 1n each column headmg.
OBSERVATIONS/SAMPLING METHOD DEVIATIONS

Appendix B
Fall 2012 Groundwater
Analytical Results

Table B-1Fall 2012 Groundwater Analytical Results
Groundwater Quality Monitoring Interim Report for Fall 2012Plant Site 1 Groundwater Management AreaGeneral Electric Company - Pittsfield, Massachusetts(Results are presented in parts per million, ppm)
Site ID: East St. Area 2 - SouthSample ID: ESA1S-31R ESA1S-72R E2SC-23
Parameter Date Collected: 10/31/12 10/31/12 11/01/12Volatile Organics1,1,1,2-Tetrachloroethane ND(0.0010) [ND(0.0010)] NA NA1,1,1-Trichloroethane ND(0.0010) [ND(0.0010)] NA NA1,1,2,2-Tetrachloroethane ND(0.0010) [ND(0.0010)] NA NA1,1,2-Trichloroethane ND(0.0010) [ND(0.0010)] NA NA1,1-Dichloroethane ND(0.0010) [ND(0.0010)] NA NA1,1-Dichloroethene ND(0.0010) [ND(0.0010)] NA NA1,2,3-Trichloropropane ND(0.0010) [ND(0.0010)] NA NA1,2-Dibromo-3-chloropropane ND(0.0050) [ND(0.0050)] NA NA1,2-Dibromoethane ND(0.0010) [ND(0.0010)] NA NA1,2-Dichloroethane ND(0.0010) [ND(0.0010)] NA NA1,2-Dichloropropane ND(0.0010) [ND(0.0010)] NA NA1,4-Dioxane ND(0.10) J [ND(0.10) J] NA NA2-Butanone ND(0.025) [ND(0.025)] NA NA2-Chloro-1,3-butadiene ND(0.0010) [ND(0.0010)] NA NA2-Chloroethylvinylether R [ND(0.025)] NA NA2-Hexanone ND(0.0050) [ND(0.0050)] NA NA3-Chloropropene ND(0.0010) [ND(0.0010)] NA NA4-Methyl-2-pentanone ND(0.0050) [ND(0.0050)] NA NAAcetone ND(0.025) J [ND(0.025) J] NA NAAcetonitrile ND(0.020) [ND(0.020)] NA NAAcrolein ND(0.025) [ND(0.025)] NA NAAcrylonitrile ND(0.025) [ND(0.025)] NA NABenzene ND(0.0010) [ND(0.0010)] NA NABromodichloromethane 0.0021 [0.0020] NA NABromoform ND(0.0010) [ND(0.0010)] NA NABromomethane ND(0.0010) [ND(0.0010)] NA NACarbon Disulfide ND(0.0010) [ND(0.0010)] NA NACarbon Tetrachloride ND(0.0010) [ND(0.0010)] NA NAChlorobenzene ND(0.0010) [ND(0.0010)] NA NAChloroethane ND(0.0010) [ND(0.0010)] NA NAChloroform 0.028 [0.025] NA NAChloromethane ND(0.0010) [ND(0.0010)] NA NAcis-1,3-Dichloropropene ND(0.0010) [ND(0.0010)] NA NADibromochloromethane ND(0.0010) [ND(0.0010)] NA NADibromomethane ND(0.0010) [ND(0.0010)] NA NADichlorodifluoromethane ND(0.0050) [ND(0.0050)] NA NAEthyl Methacrylate ND(0.0010) [ND(0.0010)] NA NAEthylbenzene ND(0.0010) [ND(0.0010)] NA NAIodomethane ND(0.0010) [ND(0.0010)] NA NAIsobutanol ND(0.050) J [ND(0.050) J] NA NAMethacrylonitrile ND(0.010) [ND(0.010)] NA NAMethyl Methacrylate ND(0.0010) [ND(0.0010)] NA NAMethylene Chloride ND(0.0050) [ND(0.0050)] NA NAPropionitrile ND(0.020) [ND(0.020)] NA NAStyrene ND(0.0010) [ND(0.0010)] NA NATetrachloroethene ND(0.0010) [ND(0.0010)] NA NAToluene ND(0.0010) [ND(0.0010)] NA NAtrans-1,2-Dichloroethene ND(0.0010) [ND(0.0010)] NA NAtrans-1,3-Dichloropropene ND(0.0010) [ND(0.0010)] NA NAtrans-1,4-Dichloro-2-butene ND(0.0050) [ND(0.0050)] NA NATrichloroethene ND(0.0010) [ND(0.0010)] NA NATrichlorofluoromethane ND(0.0010) [ND(0.0010)] NA NAVinyl Acetate ND(0.0020) [ND(0.0020)] NA NAVinyl Chloride ND(0.0010) [ND(0.0010)] NA NAXylenes (total) ND(0.0020) [ND(0.0020)] NA NATotal VOCs 0.030 [0.027] NA NA
East St. Area 1 - South
G:\GE\GE_Pittsfield_CD_GMA_1\Reports and Presentations\Fall 2012 GW Qual Rpt\0221311324Tbls567_AppxB.xlsx - B-1 Page 1 of 4 1/30/2013

Table B-1Fall 2012 Groundwater Analytical Results
Groundwater Quality Monitoring Interim Report for Fall 2012Plant Site 1 Groundwater Management AreaGeneral Electric Company - Pittsfield, Massachusetts(Results are presented in parts per million, ppm)
Site ID: East St. Area 2 - SouthSample ID: ESA1S-31R ESA1S-72R E2SC-23
Parameter Date Collected: 10/31/12 10/31/12 11/01/12
East St. Area 1 - South
Semivolatile Organics1,2,4,5-Tetrachlorobenzene ND(0.0051) [ND(0.0051)] ND(0.0055) NA1,2,4-Trichlorobenzene ND(0.0051) [ND(0.0051)] ND(0.0055) NA1,2-Dichlorobenzene ND(0.0051) [ND(0.0051)] ND(0.0055) NA1,3,5-Trinitrobenzene ND(0.025) [ND(0.025)] ND(0.028) NA1,3-Dichlorobenzene ND(0.0051) [ND(0.0051)] ND(0.0055) NA1,3-Dinitrobenzene ND(0.0051) [ND(0.0051)] ND(0.0055) NA1,4-Dichlorobenzene ND(0.0051) [ND(0.0051)] ND(0.0055) NA1,4-Naphthoquinone ND(0.0051) [ND(0.0051)] ND(0.0055) NA1-Naphthylamine ND(0.025) [ND(0.025)] ND(0.028) NA2,3,4,6-Tetrachlorophenol ND(0.0051) [ND(0.0051)] ND(0.0055) NA2,4,5-Trichlorophenol ND(0.0051) [ND(0.0051)] ND(0.0055) NA2,4,6-Trichlorophenol ND(0.0051) [ND(0.0051)] ND(0.0055) NA2,4-Dichlorophenol ND(0.0051) [ND(0.0051)] ND(0.0055) NA2,4-Dimethylphenol ND(0.0051) [ND(0.0051)] ND(0.0055) NA2,4-Dinitrophenol ND(0.025) [ND(0.025)] ND(0.028) NA2,4-Dinitrotoluene ND(0.0051) [ND(0.0051)] ND(0.0055) NA2,6-Dichlorophenol ND(0.0051) [ND(0.0051)] ND(0.0055) NA2,6-Dinitrotoluene ND(0.0051) [ND(0.0051)] ND(0.0055) NA2-Acetylaminofluorene ND(0.010) [ND(0.010)] ND(0.011) NA2-Chloronaphthalene ND(0.0051) [ND(0.0051)] ND(0.0055) NA2-Chlorophenol ND(0.0051) [ND(0.0051)] ND(0.0055) NA2-Methylnaphthalene ND(0.0051) [ND(0.0051)] ND(0.0055) NA2-Methylphenol ND(0.0051) [ND(0.0051)] ND(0.0055) NA2-Naphthylamine ND(0.025) [ND(0.025)] ND(0.028) NA2-Nitroaniline ND(0.0051) [ND(0.0051)] ND(0.0055) NA2-Nitrophenol ND(0.0051) [ND(0.0051)] ND(0.0055) NA2-Picoline ND(0.0051) [ND(0.0051)] ND(0.0055) NA3&4-Methylphenol ND(0.0051) [ND(0.0051)] ND(0.0055) NA3,3'-Dichlorobenzidine ND(0.010) [ND(0.010)] ND(0.011) NA3,3'-Dimethylbenzidine ND(0.025) [ND(0.025)] ND(0.028) NA3-Methylcholanthrene ND(0.010) [ND(0.010)] ND(0.011) NA3-Nitroaniline ND(0.025) [ND(0.025)] ND(0.028) NA4,6-Dinitro-2-methylphenol ND(0.025) [ND(0.025)] ND(0.028) NA4-Aminobiphenyl ND(0.0051) [ND(0.0051)] ND(0.0055) NA4-Bromophenyl-phenylether ND(0.0051) [ND(0.0051)] ND(0.0055) NA4-Chloro-3-Methylphenol ND(0.0051) [ND(0.0051)] ND(0.0055) NA4-Chloroaniline ND(0.025) [ND(0.025)] ND(0.028) NA4-Chlorobenzilate ND(0.0051) [ND(0.0051)] ND(0.0055) NA4-Chlorophenyl-phenylether ND(0.0051) [ND(0.0051)] ND(0.0055) NA4-Nitroaniline ND(0.025) [ND(0.025)] ND(0.028) NA4-Nitrophenol ND(0.025) [ND(0.025)] ND(0.028) NA4-Nitroquinoline-1-oxide ND(0.025) [ND(0.025)] ND(0.028) NA4-Phenylenediamine ND(0.010) [ND(0.010)] ND(0.011) NA5-Nitro-o-toluidine ND(0.0051) [ND(0.0051)] ND(0.0055) NA7,12-Dimethylbenz(a)anthracene ND(0.0051) [ND(0.0051)] ND(0.0055) NAa,a'-Dimethylphenethylamine ND(0.025) [ND(0.025)] ND(0.028) NAAcenaphthene ND(0.0051) [ND(0.0051)] ND(0.0055) NAAcenaphthylene ND(0.0051) [ND(0.0051)] ND(0.0055) NAAcetophenone ND(0.0051) [ND(0.0051)] ND(0.0055) NAAniline ND(0.0051) [ND(0.0051)] ND(0.0055) NAAnthracene ND(0.0051) [ND(0.0051)] ND(0.0055) NAAramite ND(0.0051) [ND(0.0051)] ND(0.0055) NAAzobenzene ND(0.0051) [ND(0.0051)] ND(0.0055) NABenzidine ND(0.010) [ND(0.010)] ND(0.011) NABenzo(a)anthracene ND(0.0051) [ND(0.0051)] ND(0.0055) NABenzo(a)pyrene ND(0.0051) [ND(0.0051)] ND(0.0055) NABenzo(b)fluoranthene ND(0.0051) [ND(0.0051)] ND(0.0055) NABenzo(g,h,i)perylene ND(0.0051) [ND(0.0051)] ND(0.0055) NABenzo(k)fluoranthene ND(0.0051) [ND(0.0051)] ND(0.0055) NA
G:\GE\GE_Pittsfield_CD_GMA_1\Reports and Presentations\Fall 2012 GW Qual Rpt\0221311324Tbls567_AppxB.xlsx - B-1 Page 2 of 4 1/30/2013

Table B-1Fall 2012 Groundwater Analytical Results
Groundwater Quality Monitoring Interim Report for Fall 2012Plant Site 1 Groundwater Management AreaGeneral Electric Company - Pittsfield, Massachusetts(Results are presented in parts per million, ppm)
Site ID: East St. Area 2 - SouthSample ID: ESA1S-31R ESA1S-72R E2SC-23
Parameter Date Collected: 10/31/12 10/31/12 11/01/12
East St. Area 1 - South
Semivolatile Organics (continued)Benzyl Alcohol ND(0.010) [ND(0.010)] ND(0.011) NAbis(2-Chloroethoxy)methane ND(0.0051) [ND(0.0051)] ND(0.0055) NAbis(2-Chloroethyl)ether ND(0.0051) [ND(0.0051)] ND(0.0055) NAbis(2-Chloroisopropyl)ether ND(0.0051) [ND(0.0051)] ND(0.0055) NAbis(2-Ethylhexyl)phthalate ND(0.0051) [ND(0.0051)] ND(0.0055) NAButylbenzylphthalate ND(0.0051) [ND(0.0051)] ND(0.0055) NAChrysene ND(0.0051) [ND(0.0051)] ND(0.0055) NADiallate ND(0.0051) [ND(0.0051)] ND(0.0055) NADibenzo(a,h)anthracene ND(0.0051) [ND(0.0051)] ND(0.0055) NADibenzofuran ND(0.0051) [ND(0.0051)] ND(0.0055) NADiethylphthalate ND(0.0051) [ND(0.0051)] ND(0.0055) NADimethylphthalate ND(0.0051) [ND(0.0051)] ND(0.0055) NADi-n-Butylphthalate ND(0.0051) [ND(0.0051)] ND(0.0055) NADi-n-Octylphthalate ND(0.0051) [ND(0.0051)] ND(0.0055) NADiphenylamine ND(0.0051) [ND(0.0051)] ND(0.0055) NAEthyl Methanesulfonate ND(0.0051) [ND(0.0051)] ND(0.0055) NAFluoranthene ND(0.0051) [ND(0.0051)] ND(0.0055) NAFluorene ND(0.0051) [ND(0.0051)] ND(0.0055) NAHexachlorobenzene ND(0.0051) [ND(0.0051)] ND(0.0055) NAHexachlorobutadiene ND(0.0051) [ND(0.0051)] ND(0.0055) NAHexachlorocyclopentadiene ND(0.010) [ND(0.010)] ND(0.011) NAHexachloroethane ND(0.0051) [ND(0.0051)] ND(0.0055) NAHexachlorophene ND(0.0051) J [ND(0.0051) J] ND(0.0055) J NAHexachloropropene ND(0.010) [ND(0.010)] ND(0.011) NAIndeno(1,2,3-cd)pyrene ND(0.0051) [ND(0.0051)] ND(0.0055) NAIsodrin ND(0.0051) [ND(0.0051)] ND(0.0055) NAIsophorone ND(0.0051) [ND(0.0051)] ND(0.0055) NAIsosafrole ND(0.0051) [ND(0.0051)] ND(0.0055) NAMethapyrilene ND(0.0051) [ND(0.0051)] ND(0.0055) NAMethyl Methanesulfonate ND(0.0051) [ND(0.0051)] ND(0.0055) NANaphthalene ND(0.0051) [ND(0.0051)] ND(0.0055) NANitrobenzene ND(0.0051) [ND(0.0051)] ND(0.0055) NAN-Nitrosodiethylamine ND(0.0051) [ND(0.0051)] ND(0.0055) NAN-Nitrosodimethylamine ND(0.0051) [ND(0.0051)] ND(0.0055) NAN-Nitroso-di-n-butylamine ND(0.0051) [ND(0.0051)] ND(0.0055) NAN-Nitroso-di-n-propylamine ND(0.0051) [ND(0.0051)] ND(0.0055) NAN-Nitrosomethylethylamine ND(0.0051) [ND(0.0051)] ND(0.0055) NAN-Nitrosomorpholine ND(0.0051) [ND(0.0051)] ND(0.0055) NAN-Nitrosopiperidine ND(0.0051) [ND(0.0051)] ND(0.0055) NAN-Nitrosopyrrolidine ND(0.0051) [ND(0.0051)] ND(0.0055) NAo,o,o-Triethylphosphorothioate ND(0.0051) [ND(0.0051)] ND(0.0055) NAo-Toluidine ND(0.0051) [ND(0.0051)] ND(0.0055) NAp-Dimethylaminoazobenzene ND(0.0051) [ND(0.0051)] ND(0.0055) NAPentachlorobenzene ND(0.0051) [ND(0.0051)] ND(0.0055) NAPentachloroethane ND(0.0051) [ND(0.0051)] ND(0.0055) NAPentachloronitrobenzene ND(0.0051) [ND(0.0051)] ND(0.0055) NAPentachlorophenol ND(0.025) [ND(0.025)] ND(0.028) NAPhenacetin ND(0.0051) [ND(0.0051)] ND(0.0055) NAPhenanthrene ND(0.0051) [ND(0.0051)] ND(0.0055) NAPhenol ND(0.0051) [ND(0.0051)] ND(0.0055) NAPronamide ND(0.0051) [ND(0.0051)] ND(0.0055) NAPyrene ND(0.0051) [ND(0.0051)] ND(0.0055) NAPyridine ND(0.0051) [ND(0.0051)] ND(0.0055) NA
G:\GE\GE_Pittsfield_CD_GMA_1\Reports and Presentations\Fall 2012 GW Qual Rpt\0221311324Tbls567_AppxB.xlsx - B-1 Page 3 of 4 1/30/2013

Table B-1Fall 2012 Groundwater Analytical Results
Groundwater Quality Monitoring Interim Report for Fall 2012Plant Site 1 Groundwater Management AreaGeneral Electric Company - Pittsfield, Massachusetts(Results are presented in parts per million, ppm)
Site ID: East St. Area 2 - SouthSample ID: ESA1S-31R ESA1S-72R E2SC-23
Parameter Date Collected: 10/31/12 10/31/12 11/01/12
East St. Area 1 - South
Semivolatile Organics (continued)Safrole ND(0.0051) [ND(0.0051)] ND(0.0055) NAThionazin ND(0.010) [ND(0.010)] ND(0.011) NAFurans2,3,7,8-TCDF NA NA 3.00E-07 J [1.80E-07 J]TCDFs (total) NA NA 1.40E-06 [1.30E-06 QI]1,2,3,7,8-PeCDF NA NA 5.30E-08 J [8.20E-08 J]2,3,4,7,8-PeCDF NA NA 2.20E-07 J [1.10E-07 J]PeCDFs (total) NA NA 1.80E-06 J [1.10E-06 J]1,2,3,4,7,8-HxCDF NA NA 8.50E-07 J [4.50E-07 J]1,2,3,6,7,8-HxCDF NA NA 2.90E-07 J [1.60E-07 J]1,2,3,7,8,9-HxCDF NA NA ND(3.50E-08) J [ND(2.90E-08)]2,3,4,6,7,8-HxCDF NA NA 2.00E-07 J [1.10E-07 J]HxCDFs (total) NA NA 3.10E-06 J [1.60E-06 J]1,2,3,4,6,7,8-HpCDF NA NA 7.10E-07 J [3.90E-07 J]1,2,3,4,7,8,9-HpCDF NA NA 4.50E-07 J [2.30E-07 J]HpCDFs (total) NA NA 2.20E-06 J [1.10E-06 J]OCDF NA NA 1.80E-06 J [9.20E-07 J]Dioxins2,3,7,8-TCDD NA NA ND(7.00E-09) J [ND(5.80E-09)]TCDDs (total) NA NA 6.10E-08 J [3.20E-08 J]1,2,3,7,8-PeCDD NA NA ND(1.30E-08) J [ND(6.50E-09) J]PeCDDs (total) NA NA 2.00E-07 J [9.40E-08 J]1,2,3,4,7,8-HxCDD NA NA 2.30E-08 J [1.50E-08 J]1,2,3,6,7,8-HxCDD NA NA 4.10E-08 J [ND(2.00E-08) J]1,2,3,7,8,9-HxCDD NA NA 2.80E-08 J [1.50E-08 J]HxCDDs (total) NA NA 4.60E-07 J [2.70E-07 J]1,2,3,4,6,7,8-HpCDD NA NA 3.00E-07 J [1.60E-07 J]HpCDDs (total) NA NA 5.70E-07 J [3.00E-07 J]OCDD NA NA 2.80E-06 J [1.70E-06 J]Total TEQs (1998 WHO TEFs) NA NA 3.10E-07 [1.70E-07]Inorganics-FilteredLead NA NA ND(0.0100) J [0.00647 J]
NOTES:
1.2.
3.4.5.
6.
Samples were collected by ARCADIS and submitted to SGS Environmental Services, Inc. for analysis of Appendix IX+3 constituents.Samples have been validated as per Field Sampling Plan/Quality Assurance Project Plan (FSP/QAPP), General Electric Company, Pittsfield, Massachusetts, ARCADIS (approved March 15, 2007 and re-submitted March 30, 2007).NA - Not Analyzed.ND - Analyte was not detected. The number in parentheses is the associated detection limit.Total 2,3,7,8-TCDD toxicity equivalents (TEQs) were calculated using Toxicity Equivalency Factors (TEFs) derived by the World Health Organization (WHO) and published by Van den Berg et al. in Environmental Health Perspectives 106(2), December 1998.Field duplicate sample results are presented in brackets.
Data Qualifiers:
Organics (volatiles, semivolatiles, dioxin/furans)J - Indicates that the associated numerical value is an estimated concentration.R - Data was rejected due to a deficiency in the data generation processI - Polychlorinated Diphenyl Ether (PCDPE) Interference.Q - Indicates the presence of quantitative interferences.
InorganicsB - Indicates an estimated value between the instrument detection limit (IDL) and practical quantitation limit (PQL). J - Indicates that the associated numerical value is an estimated concentration.
G:\GE\GE_Pittsfield_CD_GMA_1\Reports and Presentations\Fall 2012 GW Qual Rpt\0221311324Tbls567_AppxB.xlsx - B-1 Page 4 of 4 1/30/2013

Appendix C
Data Validation Report

Page 1 of 7
G:\GE\GE_Pittsfield_CD_GMA_1\Reports and Presentations\Fall 2012 GW Qual Rpt\0221311324AppxC.doc
Appendix C Groundwater Sampling Data Validation Report Groundwater Management Area 1 – Fall 2012 General Electric Company Pittsfield, Massachusetts
1.0 General
This attachment summarizes the data validation review performed on behalf of the General Electric Company
(GE) for groundwater samples collected in October and November 2012 as part of groundwater sampling
activities conducted at Groundwater Management Area 1, located at the General Electric
Company/Housatonic River Site in Pittsfield, Massachusetts. The samples were analyzed for various
constituents listed in Appendix IX of 40 CFR Part 264, plus three additional constituents -- benzidine, 2-
chloroethyl vinyl ether, and 1,2-diphenylhydrazine (hereafter referred to as Appendix IX+3) by SGS
Environmental Services, Inc. of Wilmington, North Carolina. Data validation was performed for four volatile
organic compound (VOC) samples, four semi-volatile organic compound (SVOC) samples, three metal
samples, and three polychlorinated dibenzo-p-dioxin (PCDD)/polychlorinated dibenzofuran (PCDF) samples.
2.0 Data Evaluation Procedures
This attachment outlines the applicable quality control criteria utilized during the data review process and any
deviations from those criteria. The data review was conducted in accordance with the following documents:
Field Sampling Plan/Quality Assurance Project Plan (FSP/QAPP), General Electric Company,
Pittsfield, Massachusetts, ARCADIS BBL (submitted by GE on March 30, 2007 and approved by EPA
on June 13, 2007);
Region I Laboratory Data Validation Functional Guidelines for Evaluating Inorganics Analyses, USEPA Region I (June 13, 1988) (Modified February 1989);
Region I Laboratory Data Validation Functional Guidelines for Evaluating Organics Analyses, USEPA
Region I (Draft, December 1996); and
National Functional Guidelines for Dioxin/Furan Data Validation, USEPA (Draft, January 1996).
The data were validated to either a Tier I or Tier II level, as described below. Any deviations from the
applicable quality control criteria utilized during the data review process are identified below. A tabulated
summary of the Tier I/Tier II data review is presented in Table C-1. Each sample subject to evaluation is listed
in Table C-1 to document that data review was performed. Samples that required data qualification are listed
separately.
The following data qualifiers were used in this data evaluation:
J The compound was positively identified, but the associated numerical value is an estimated
concentration. This qualifier is used when the data evaluation procedure identifies a deficiency
in the data generation process. This qualifier is also used when a compound is detected at an
estimated concentration less than the corresponding practical quantitation limit (PQL).

Page 2 of 7
G:\GE\GE_Pittsfield_CD_GMA_1\Reports and Presentations\Fall 2012 GW Qual Rpt\0221311324AppxC.doc
U The compound was analyzed for, but was not detected. The sample quantitation limit is
presented. Non-detect sample results are presented as ND(PQL) within this report for
consistency with documents previously prepared for investigations conducted at the GE-
Pittsfield/Housatonic River Site.
UJ The compound was not detected above the reported sample quantitation limit. However, the
reported limit is estimated and may or may not represent the actual level of quantitation. Non-
detect sample results that required qualification are presented as ND(PQL) J within this report
for consistency with documents previously prepared for investigations conducted at the GE-
Pittsfield/Housatonic River Site.
R Indicates that the previously reported detection limit or sample result has been rejected due to a
major deficiency in the data generation procedure. The data should not be used for any
qualitative or quantitative purpose.
3.0 Data Validation Procedures
Section 7.5 of the FSP/QAPP states that analytical data will be validated to a Tier I level following the
procedures presented in the Region I Tiered Organic and Inorganic Data Validation Guidelines (EPA
guidelines). The Tier I review consisted of a completeness evidence audit, as outlined in the EPA Region I
CSF Completeness Evidence Audit Program (EPA Region I, July 31, 1991), to ensure that laboratory data and
documentation were present. In the event data packages were determined to be incomplete, the missing
information was requested from the laboratory. Upon completion of the Tier I review, the data packages
complied with the EPA Region I Tier I data completeness requirements.
The Tier II data review consisted of a review of data package summary forms for identification of quality
assurance/quality control (QA/QC) deviations and qualification of the data according to the Region I Data
Validation Functional Guidelines. Additionally, field duplicates were examined for relative percent difference
(RPD) compliance with the criteria specified in the FSP/QAPP.
A tabulated summary of the samples subject to Tier I and Tier II data review is presented in the following table.
Summary of Samples Subjected to Tier I and Tier II Data Validation
Parameter Tier I Only Tier I &Tier II
Total Samples Duplicates Blanks Samples Duplicates Blanks
VOCs 0 0 0 1 1 2 4
SVOCs 0 0 0 2 1 1 4
Metals 0 0 0 1 1 1 3
PCDDs/PCDFs 0 0 0 1 1 1 3
Total 0 0 0 5 4 5 14

Page 3 of 7
G:\GE\GE_Pittsfield_CD_GMA_1\Reports and Presentations\Fall 2012 GW Qual Rpt\0221311324AppxC.doc
When qualification of the sample data was required, the sample results associated with a QA/QC parameter
deviation were qualified in accordance with the procedures outlined in EPA Region I data validation guidance
documents. When the data validation process identified several quality control deficiencies, the cumulative
effect of the various deficiencies was employed in assigning the final data qualifier. A summary of the QA/QC
parameter deviations that resulted in data qualification is presented in Section 4 below.
4.0 Summary of QA/QC Parameter Deviations Requiring Data Qualification
This section provides a summary of the deviations from the applicable QA/QC criteria that resulted in
qualification of results.
The initial calibration criterion for organic analyses requires that the average relative response factor (RRF)
has a value greater than 0.05. Sample results were qualified as estimated (J) when this criterion was not
achieved. The compounds that did not achieve the initial calibration criterion and the number of samples
qualified are presented in the following table.
Compounds Qualified Due to Initial Calibration Deviations (RRF)
Analysis Compound Number of
Affected Samples Qualification
VOCs 1,4-Dioxane 4 J
Isobutanol 4 J
SVOCs Hexachlorophene 4 J
The continuing calibration criterion requires that the percent difference (%D) between the initial calibration
RRF and the continuing calibration RRF for PCBs be less than 15% and VOCs/SVOCs be less than 25%.
Sample data for detect and non-detect compounds with %D values that exceeded the continuing calibration
criteria were qualified as estimated (J). A summary of the compound that exceeded the continuing calibration
criterion and the number of samples qualified due to those deviations are presented in the following table.
Compound Qualified Due to Continuing Calibration of %D Values
Analysis Compound Number of
Affected Samples Qualification
VOCs Acetone 4 J
Contract required detection limit (CRDL) standards were analyzed to evaluate instrument performance at low-
level concentrations that are near the analytical method PQL. These standards are required to have
recoveries between 80% and 120% to verify that the analytical instrumentation was properly calibrated. When
CRDL standard recoveries were outside these control limits, the affected samples with detected results at or
near the PQL concentration (i.e., less than three times the PQL) were qualified as estimated (J). The analyte
that did not meet CRDL criteria and the number of samples qualified due to those deviations are presented in
the following table.

Page 4 of 7
G:\GE\GE_Pittsfield_CD_GMA_1\Reports and Presentations\Fall 2012 GW Qual Rpt\0221311324AppxC.doc
Analyte Qualified Due to CRDL Standard Recovery Deviations
Analysis Analyte Number of
Affected Samples Qualification
Inorganics Lead 3 J
Matrix spike/matrix spike duplicate (MS/MSD) sample analysis recovery criteria for organics require that the
MS/MSD recovery must be within the laboratory-generated QC control limits specified on the MS reporting
form. Organic sample results with MS/MSD recoveries less than 10% were qualified as rejected (R). Sample
results with MS/MSD recoveries that were less than the laboratory-generated QC control limits and have
recoveries greater than 10% were qualified as estimated (J). The compounds that did not meet MS/MSD
recovery criteria and the number of samples qualified due to those deviations are presented in the following
table.
Compounds Qualified Due to MS/MSD Recovery Deviations
Analysis Compound/Analyte Number of Affected Samples
Qualification
VOCs 2-Chloroethylvinylether 1 R
PCDDs/PCDFs
1,2,3,4,6,7,8-HpCDF 1 J
1,2,3,4,7,8-HxCDF 1 J
1,2,3,6,7,8-HxCDF 1 J
OCDF 1 J
2,3,7,8-TCDF 1 J
OCDD 1 J
MS/MSD sample analysis recovery criteria for organics require that the RPD between the MS and MSD
recoveries be less than the laboratory-generated QC acceptance limits specified on the MS/MSD reporting
form. The compounds that exceeded the RPD limit and the number of samples qualified due to deviations are
presented in the following table.
Compounds Qualified Due to MS/MSD RPD Deviations
Analysis Compound Number of Affected Samples
Qualification
PCDDs/PCDFs 1,2,3,4,6,7,8-HpCDD 1 J
1,2,3,4,6,7,8-HpCDF 1 J
1,2,3,4,7,8-HxCDD 1 J
1,2,3,4,7,8-HxCDF 1 J
1,2,3,6,7,8-HxCDD 1 J
1,2,3,6,7,8-HxCDF 1 J
1,2,3,7,8,9-HxCDD 1 J
1,2,3,7,8,9-HxCDF 1 J
1,2,3,7,8-PeCDD 1 J

Page 5 of 7
G:\GE\GE_Pittsfield_CD_GMA_1\Reports and Presentations\Fall 2012 GW Qual Rpt\0221311324AppxC.doc
Compounds Qualified Due to MS/MSD RPD Deviations
Analysis Compound Number of Affected Samples
Qualification
1,2,3,7,8-PeCDF 1 J
2,3,4,6,7,8-HxCDF 1 J
2,3,4,7,8-PeCDF 1 J
2,3,7,8-TCDD 1 J
2,3,7,8-TCDF 1 J
OCDD 1 J
OCDF 1 J
Field duplicate samples were analyzed to evaluate the overall precision of laboratory and field procedures.
The RPD between field duplicate samples is required to be less than 30% for water sample values greater
than five times the PQL for organics. Sample results that exceeded these limits were qualified as estimated
(J). The compounds that did not meet field duplicate RPD requirements and the number of samples qualified
due to those deviations are presented in the following table.
Compounds Qualified Due to Field Duplicate Deviations
Analysis Analyte Number of
Affected Samples Qualification
PCDDs/PCDFs 1,2,3,4,6,7,8-HpCDD 2 J 1,2,3,4,6,7,8-HpCDF 2 J 1,2,3,4,7,8,9-HpCDF 2 J 1,2,3,4,7,8-HxCDF 2 J 1,2,3,6,7,8-HxCDF 2 J 1,2,3,7,8-PeCDF 2 J 2,3,4,6,7,8-HxCDF 2 J 2,3,4,7,8-PeCDF 2 J 2,3,7,8-TCDF 2 J HpCDDs (total) 2 J HpCDFs (total) 2 J HxCDDs (total) 2 J HxCDFs (total) 2 J OCDD 2 J OCDF 2 J PeCDDs (total) 2 J PeCDFs (total) 2 J TCDDs (total) 2 J

Page 6 of 7
G:\GE\GE_Pittsfield_CD_GMA_1\Reports and Presentations\Fall 2012 GW Qual Rpt\0221311324AppxC.doc
As specified in the PCDD/PCDF method, the ion abundance ratio in the sample must be within 15% of the
theoretical ion abundance ratio. Sample results associated with ion abundance ratio recoveries outside the
specified control limits were qualified as estimated (J). The PCDD/PCDF compounds that exhibited ion
abundance ratio recoveries greater than 15% are presented in the following table.
Compounds Qualified Due to Ion Ratio Deviations
Analysis Compound Number of
Affected Samples Qualification
PCDDs/PCDFs 1,2,3,6,7,8-HxCDD 1 J
1,2,3,7,8-PeCDD 2 J
5.0 Overall Data Usability
This section summarizes the analytical data in terms of its completeness and usability. Data completeness is
defined as the percentage of sample results that have been determined to be usable during the data validation
process. The percent usability calculation included analyses evaluated under both the Tier I/II data validation
reviews. The percent usability calculation also includes quality control samples (i.e., field/equipment blanks,
trip blanks, and field duplicates) to aid in the evaluation of data usability. Data usability is summarized in the
following table.
Data Usability
Parameter Percent Usability Rejected Data
VOCs 99.9 A total of one sample result was rejected due to MS/MSD recovery deviations.
SVOCs 100 None
PCDDs/PCDFs 100 None
Metals 100 None
The data package completeness, as determined from the Tier I data review, was used in combination with the
data quality deviations identified during the Tier II data review to determine overall data quality. As specified in
the FSP/QAPP, the overall precision, accuracy, representativeness, comparability, and completeness
(PARCC) parameters determined from the Tier I and Tier II data reviews were used as indicators of overall
data quality. These parameters were assessed through an evaluation of the results of the field and laboratory
QA/QC sample analyses to provide a measure of compliance of the analytical data with the Data Quality
Objectives (DQOs) specified in the FSP/QAPP. Therefore, the following sections present summaries of the
PARCC parameters assessment with regard to the DQOs specified in the FSP/QAPP.
5.1 Precision
Precision measures the reproducibility of measurements under a given set of conditions. Specifically, it is a
quantitative measure of the variability of a group of measurements compared to their average value. For this
investigation, precision was defined as the RPD between duplicate sample results. The duplicate samples
used to evaluate precision included field duplicates, MS/MSD samples, and LCS/LCSD samples. For this
analytical program, 2.1% of the data required qualification due to MS/MSD RPD deviations. None of the data
required qualification due to field duplicate RPD deviations or LCS/LCSD samples.

Page 7 of 7
G:\GE\GE_Pittsfield_CD_GMA_1\Reports and Presentations\Fall 2012 GW Qual Rpt\0221311324AppxC.doc
5.2 Accuracy
Accuracy measures the bias in an analytical system or the degree of agreement of a measurement with a
known reference value. For this investigation, accuracy was defined as the percent recovery of QA/QC
samples that were spiked with a known concentration of an analyte or compound of interest. The QA/QC
samples used to evaluate analytical accuracy included instrument calibration, internal standards, LCS/LCSDs,
MS/MSD samples, CRDL samples, and surrogate compound recoveries. For this analytical program, 2.1% of
the data required qualification due to instrument calibration deviations, 0.92% of the data required qualification
due to MS/MSD recovery deviations, and 0.4% of the data required qualification due to CRDL recovery
deviations. None of the data required qualification due to internal standard recovery deviations, LCS/LCSD
recovery deviations, or surrogate compound recovery deviations.
5.3 Representativeness
Representativeness expresses the degree to which sample data accurately and precisely represents a
characteristic of a population, parameter variations at a sampling point, or an environmental condition.
Representativeness is a qualitative parameter, which is most concerned with the proper design of the
sampling program. The representativeness criterion is best satisfied by making certain that sampling locations
are selected properly and a sufficient number of samples are collected. This parameter has been addressed
by collecting samples at locations specified in the EPA-approved work plans, and by following the procedures
for sample collection/analyses that were described in the FSP/QAPP. Additionally, the analytical program
used procedures consistent with EPA-approved analytical methodology. A QA/QC parameter that is an
indicator of the representativeness of a sample is holding time. Holding time criteria are established to
maintain the samples in a state that is representative of the in-situ field conditions before analysis. For this
analytical data set, none of the data required qualification due to holding time deviations.
5.4 Comparability
Comparability is a qualitative parameter expressing the confidence with which one data set can be compared
with another. This goal was achieved through the use of the standardized techniques for sample collection
and analysis presented in the FSP/QAPP. Specifically, all the groundwater samples collected in October and
November 2012 were analyzed by EPA SW-846 method 8260 for VOCs, 8270 for SVOCs, 8290 for
PCDDs/PCDFs, and 6000 for metals.
5.5 Completeness
Completeness is defined as the percentage of measurements that are judged to be valid or usable to meet the
prescribed DQOs. The completeness criterion is essentially the same for all data uses -- the generation of a
sufficient amount of valid data. The actual completeness of this analytical data set ranged from 99.9% to
100% for individual analytical parameters and had an overall usability of 99.9%, which is greater than the
minimum required usability of 90% as specified in the FSP/QAPP.

Plant Site 1 Groundwater Management Area 1
Sample Delivery
Group No.Sample ID Date Collected Matrix
Validation Level
Qualification Compound QA/QC Parameter Value Control Limits Qualified Result Notes
Metals31203566 GMA1-RB-103112 (Filtered) 10/31/2012 Water Tier II Yes Lead CRDL Standard %R 140.0% 80% to 120% ND(0.0100) J31203585 E2SC-23 (Filtered) 11/1/2012 Water Tier II Yes Lead CRDL Standard %R 140.0% 80% to 120% ND(0.0100) J31203585 GMA1-DUP-110112 (Filtered) 11/1/2012 Water Tier II Yes Lead CRDL Standard %R 140.0% 80% to 120% 0.00647 J Duplcate of E2SC-23 (Filtered)VOCs31203563 ESA1S-31R 10/31/2012 Water Tier II Yes 1,4-Dioxane ICAL RRF 0.009 >0.05 ND(0.10) J
2-Chloroethylvinylether MS/MSD %R 0.0%, 0.0% 17.0% to 200% RAcetone CCAL %D 26.6% <25% ND(0.025) JIsobutanol ICAL RRF 0.041 >0.05 ND(0.050) J
31203563 GMA1-DUP-103112 10/31/2012 Water Tier II Yes 1,4-Dioxane ICAL RRF 0.009 >0.05 ND(0.10) J Duplcate of ESA1S-31RAcetone CCAL %D 26.6% <25% ND(0.025) JIsobutanol ICAL RRF 0.041 >0.05 ND(0.050) J
31203563 Trip Blank 10/31/2012 Water Tier II Yes 1,4-Dioxane ICAL RRF 0.009 >0.05 ND(0.10) JAcetone CCAL %D 26.6% <25% ND(0.025) JIsobutanol ICAL RRF 0.041 >0.05 ND(0.050) J
31203566 GMA1-RB-103112 10/31/2012 Water Tier II Yes 1,4-Dioxane ICAL RRF 0.009 >0.05 ND(0.10) JAcetone CCAL %D 26.6% <25% ND(0.025) JIsobutanol ICAL RRF 0.041 >0.05 ND(0.050) J
SVOCs31203563 ESA1S-31R 10/31/2012 Water Tier II Yes Hexachlorophene ICAL RRF 0.026 >0.05 ND(0.0051) J31203563 ESA1S-72R 10/31/2012 Water Tier II Yes Hexachlorophene ICAL RRF 0.026 >0.05 ND(0.0055) J31203563 GMA1-DUP-103112 10/31/2012 Water Tier II Yes Hexachlorophene ICAL RRF 0.026 >0.05 ND(0.0051) J Duplcate of ESA1S-31R31203566 GMA1-RB-103112 10/31/2012 Water Tier II Yes Hexachlorophene ICAL RRF 0.026 >0.05 ND(0.0052) JPCDDs/PCDFs31203567 GMA1-RB-103113 10/31/2012 Water Tier II No31203586 E2SC-23 11/1/2012 Water Tier II Yes 1,2,3,4,6,7,8-HpCDD MS/MSD RPD 56.0% <20% 0.00000030 J
1,2,3,4,6,7,8-HpCDD Field Duplicate RPD (Water) 46.7% <30% 0.00000030 J1,2,3,4,6,7,8-HpCDF MSD %R 193.0% 70.0% to 130% 0.00000071 J1,2,3,4,6,7,8-HpCDF MS/MSD RPD 79.0% <20% 0.00000071 J1,2,3,4,6,7,8-HpCDF Field Duplicate RPD (Water) 45.1% <30% 0.00000071 J1,2,3,4,7,8,9-HpCDF Field Duplicate RPD (Water) 48.9% <30% 0.00000045 J1,2,3,4,7,8-HxCDD MS/MSD RPD 34.0% <20% 0.000000023 J 1,2,3,4,7,8-HxCDF MSD %R 222.0% 70.0% to 130% 0.00000085 J1,2,3,4,7,8-HxCDF MS/MSD RPD 78.0% <20% 0.00000085 J1,2,3,4,7,8-HxCDF Field Duplicate RPD (Water) 47.1% <30% 0.00000085 J1,2,3,6,7,8-HxCDD MS/MSD RPD 34.0% <20% 0.000000041 J1,2,3,6,7,8-HxCDF MSD %R 134.0% 70.0% to 130% 0.00000029 J1,2,3,6,7,8-HxCDF MS/MSD RPD 54.0% <20% 0.00000029 J1,2,3,6,7,8-HxCDF Field Duplicate RPD (Water) 44.8% <30% 0.00000029 J1,2,3,7,8,9-HxCDD MS/MSD RPD 33.0% <20% 0.000000028 J 1,2,3,7,8,9-HxCDF MS/MSD RPD 45.0% <20% ND(0.000000035) J1,2,3,7,8-PeCDD MS/MSD RPD 31.0% <20% ND(0.000000013) J1,2,3,7,8-PeCDD Ion Ratio 0.91 1.24 - 1.86 ND(0.000000013) J1,2,3,7,8-PeCDF MS/MSD RPD 51.0% <20% 0.000000053 J1,2,3,7,8-PeCDF Field Duplicate RPD (Water) 54.7% <30% 0.000000053 J2,3,4,6,7,8-HxCDF MS/MSD RPD 49.0% <20% 0.00000020 J2,3,4,6,7,8-HxCDF Field Duplicate RPD (Water) 45.0% <30% 0.00000020 J2,3,4,7,8-PeCDF MS/MSD RPD 50.0% <20% 0.00000022 J2,3,4,7,8-PeCDF Field Duplicate RPD (Water) 50.0% <30% 0.00000022 J2,3,7,8-TCDD MS/MSD RPD 27.0% <20% ND(0.0000000070) J2,3,7,8-TCDF MS/MSD %R 26.0%, 279% 70.0% to 130% 0.00000030 J2,3,7,8-TCDF MS/MSD RPD 110.0% <20% 0.00000030 J2,3,7,8-TCDF Field Duplicate RPD (Water) 40.0% <30% 0.00000030 JHpCDDs (total) Field Duplicate RPD (Water) 47.4% <30% 0.00000057 JHpCDFs (total) Field Duplicate RPD (Water) 50.0% <30% 0.0000022 JHxCDDs (total) Field Duplicate RPD (Water) 52.1% <30% 0.00000046 JHxCDFs (total) Field Duplicate RPD (Water) 48.4% <30% 0.0000031 JOCDD MS/MSD %R 65.0%, 249% 70.0% to 130% 0.0000028 JOCDD MS/MSD RPD 88.0% <20% 0.0000028 JOCDD Field Duplicate RPD (Water) 39.3% <30% 0.0000028 JOCDF MSD %R 230.0% 70.0% to 130% 0.0000018 JOCDF MS/MSD RPD 86.0% <20% 0.0000018 JOCDF Field Duplicate RPD (Water) 48.9% <30% 0.0000018 JPeCDDs (total) Field Duplicate RPD (Water) 72.1% <30% 0.00000020 J
Table C-1Analytical Data Validation Summary
Groundwater Quality Monitoring Interim Report for Fall 2012
General Electric Company - Pittsfield, Massachusetts(Results are presented in parts per million, ppm)
G:\GE\GE_Pittsfield_CD_GMA_1\Reports and Presentations\Fall 2012 GW Qual Rpt\0221311324AppxC_TblC1.xlsx Page 1 of 2 1/30/2013

Plant Site 1 Groundwater Management Area 1
Sample Delivery
Group No.Sample ID Date Collected Matrix
Validation Level
Qualification Compound QA/QC Parameter Value Control Limits Qualified Result Notes
Table C-1Analytical Data Validation Summary
Groundwater Quality Monitoring Interim Report for Fall 2012
General Electric Company - Pittsfield, Massachusetts(Results are presented in parts per million, ppm)
PCDDs/PCDFs (continued)31203586 E2SC-23 11/1/2012 Water Tier II Yes PeCDFs (total) Field Duplicate RPD (Water) 38.9% <30% 0.0000018 J
TCDDs (total) Field Duplicate RPD (Water) 62.4% <30% 0.000000061 J31203586 GMA1-DUP-110112 11/1/2012 Water Tier II Yes 1,2,3,4,6,7,8-HpCDD Field Duplicate RPD (Water) 46.7% <30% 0.00000016 J Duplcate of E2SC-23
1,2,3,4,6,7,8-HpCDF Field Duplicate RPD (Water) 45.1% <30% 0.00000039 J1,2,3,4,7,8,9-HpCDF Field Duplicate RPD (Water) 48.9% <30% 0.00000023 J1,2,3,4,7,8-HxCDF Field Duplicate RPD (Water) 47.1% <30% 0.00000045 J1,2,3,6,7,8-HxCDD Ion Ratio 1.45 1.05 - 1.43 ND(0.000000020) J1,2,3,6,7,8-HxCDF Field Duplicate RPD (Water) 44.8% <30% 0.00000016 J1,2,3,7,8-PeCDD Ion Ratio 0.14 1.24 - 1.86 ND(0.0000000065) J1,2,3,7,8-PeCDF Field Duplicate RPD (Water) 54.7% <30% 0.000000082 J2,3,4,6,7,8-HxCDF Field Duplicate RPD (Water) 45.0% <30% 0.00000011 J2,3,4,7,8-PeCDF Field Duplicate RPD (Water) 50.0% <30% 0.00000011 J2,3,7,8-TCDF Field Duplicate RPD (Water) 40.0% <30% 0.00000018 JHpCDDs (total) Field Duplicate RPD (Water) 47.4% <30% 0.00000030 JHpCDFs (total) Field Duplicate RPD (Water) 50.0% <30% 0.0000011 JHxCDDs (total) Field Duplicate RPD (Water) 52.1% <30% 0.00000027 JHxCDFs (total) Field Duplicate RPD (Water) 48.4% <30% 0.0000016 JOCDD Field Duplicate RPD (Water) 39.3% <30% 0.0000017 JOCDF Field Duplicate RPD (Water) 48.9% <30% 0.00000092 JPeCDDs (total) Field Duplicate RPD (Water) 72.1% <30% 0.000000094 JPeCDFs (total) Field Duplicate RPD (Water) 38.9% <30% 0.0000011 JTCDDs (total) Field Duplicate RPD (Water) 62.4% <30% 0.000000032 J
G:\GE\GE_Pittsfield_CD_GMA_1\Reports and Presentations\Fall 2012 GW Qual Rpt\0221311324AppxC_TblC1.xlsx Page 2 of 2 1/30/2013

Appendix D
Historical Groundwater Data

Statistical Summary Tables –
Wells Sampled in Fall 2012

Table D-1Historical Groundwater Analytical Results - Well E2SC-23
Groundwater Quality Monitoring Interim Report For Fall 2012Plant Site 1 Groundwater Management AreaGeneral Electric Company - Pittsfield, Massachusetts(Results are presented in parts per million, ppm)
Sample ID: Method 1 GW-2 Method 1 GW-3 MCP UCL E2SC-23 Detection Minimum Maximum Median Arithmetic Geometric StandardParameter Date Collected: Standards Standards for GroundWater 11/01/12 Frequency Detect Detect Value Average Mean DeviationFurans2,3,7,8-TCDF Not Listed Not Listed Not Listed 3.00E-07 J [1.80E-07 J] 3/6 1.0E-11 3.00E-07 3.25E-09 7.62E-08 3.57E-09 1.16E-07TCDFs (total) Not Listed Not Listed Not Listed 1.40E-06 [1.30E-06 QI] 4/6 2.2E-10 3.60E-06 1.05E-08 8.37E-07 2.26E-08 1.46E-061,2,3,7,8-PeCDF Not Listed Not Listed Not Listed 5.30E-08 J [8.20E-08 J] 3/6 7.4E-12 2.50E-07 1.37E-08 5.78E-08 4.20E-09 9.78E-082,3,4,7,8-PeCDF Not Listed Not Listed Not Listed 2.20E-07 J [1.10E-07 J] 4/6 2.7E-11 7.60E-07 1.40E-08 1.60E-07 7.19E-09 3.01E-07PeCDFs (total) Not Listed Not Listed Not Listed 1.80E-06 J [1.10E-06 J] 6/6 3.0E-10 8.10E-06 1.70E-08 1.61E-06 4.20E-08 3.24E-061,2,3,4,7,8-HxCDF Not Listed Not Listed Not Listed 8.50E-07 J [4.50E-07 J] 3/6 9.6E-11 2.60E-06 1.37E-08 5.46E-07 1.28E-08 1.04E-061,2,3,6,7,8-HxCDF Not Listed Not Listed Not Listed 2.90E-07 J [1.60E-07 J] 3/6 5.2E-11 1.00E-06 1.37E-08 2.10E-07 8.53E-09 3.97E-071,2,3,7,8,9-HxCDF Not Listed Not Listed Not Listed ND(3.50E-08) J [ND(2.90E-08)] 2/6 2.4E-11 4.40E-07 8.65E-09 8.08E-08 4.42E-09 1.76E-072,3,4,6,7,8-HxCDF Not Listed Not Listed Not Listed 2.00E-07 J [1.10E-07 J] 3/6 2.6E-11 8.70E-07 1.37E-08 1.76E-07 7.36E-09 3.45E-07HxCDFs (total) Not Listed Not Listed Not Listed 3.10E-06 J [1.60E-06 J] 5/6 3.4E-10 1.20E-05 1.30E-08 2.40E-06 3.38E-08 4.80E-061,2,3,4,6,7,8-HpCDF Not Listed Not Listed Not Listed 7.10E-07 J [3.90E-07 J] 3/6 6.8E-11 2.10E-06 1.39E-08 4.46E-07 1.20E-08 8.39E-071,2,3,4,7,8,9-HpCDF Not Listed Not Listed Not Listed 4.50E-07 J [2.30E-07 J] 3/6 5.1E-11 1.00E-06 1.37E-08 2.28E-07 9.68E-09 4.01E-07HpCDFs (total) Not Listed Not Listed Not Listed 2.20E-06 J [1.10E-06 J] 4/6 2.1E-10 5.90E-06 1.43E-08 1.27E-06 2.22E-08 2.37E-06OCDF Not Listed Not Listed Not Listed 1.80E-06 J [9.20E-07 J] 4/6 2.1E-10 4.60E-06 2.86E-08 1.01E-06 2.99E-08 1.84E-06DioxinsTCDDs (total) Not Listed Not Listed Not Listed 6.10E-08 J [3.20E-08 J] 3/6 1.8E-12 2.60E-07 3.25E-09 5.24E-08 2.30E-09 1.03E-07PeCDDs (total) Not Listed Not Listed Not Listed 2.00E-07 J [9.40E-08 J] 2/6 9.40E-08 5.60E-07 1.37E-08 1.23E-07 4.43E-09 2.22E-071,2,3,4,7,8-HxCDD Not Listed Not Listed Not Listed 2.30E-08 J [1.50E-08 J] 3/6 3.1E-12 8.70E-08 1.06E-08 2.26E-08 2.67E-09 3.33E-081,2,3,6,7,8-HxCDD Not Listed Not Listed Not Listed 4.10E-08 J [ND(2.00E-08) J] 3/6 5.2E-12 1.20E-07 1.41E-08 2.92E-08 3.24E-09 4.61E-081,2,3,7,8,9-HxCDD Not Listed Not Listed Not Listed 2.80E-08 J [1.50E-08 J] 3/6 3.5E-12 9.80E-08 1.21E-08 2.49E-08 2.87E-09 3.75E-08HxCDDs (total) Not Listed Not Listed Not Listed 4.60E-07 J [2.70E-07 J] 3/6 2.2E-11 1.50E-06 1.42E-08 3.17E-07 9.91E-09 5.98E-071,2,3,4,6,7,8-HpCDD Not Listed Not Listed Not Listed 3.00E-07 J [1.60E-07 J] 3/6 4.2E-11 7.80E-07 1.40E-08 1.73E-07 8.41E-09 3.11E-07HpCDDs (total) Not Listed Not Listed Not Listed 5.70E-07 J [3.00E-07 J] 3/6 7.8E-11 1.60E-06 1.42E-08 3.45E-07 1.37E-08 6.39E-07OCDD Not Listed Not Listed Not Listed 2.80E-06 J [1.70E-06 J] 3/6 3.2E-10 7.80E-06 3.00E-08 1.69E-06 5.15E-08 3.13E-06Total TEQs (1998 WHO TEFs) Not Listed 0.00004 0.0004 3.10E-07 [1.70E-07] 6/6 4.1E-11 1.00E-06 3.51E-08 2.19E-07 1.51E-08 3.94E-07Inorganics-FilteredLead Not Listed 0.01 0.15 ND(0.0100) J [0.00647 J] 2/6 0.00647 0.015 0.00375 0.00520 0.00366 0.00512
NOTES:
1. Samples were collected by ARCADIS between 2001 and 2012 and submitted SGS Environmental Services, Inc. for analysis.2. Samples have been validated as per GE's EPA-approved FSP/QAPP, General Electric Company, Pittsfield, Massachusetts.3. ND - Analyte was not detected. The number in parenthesis is the associated detection limit.4. NA - Not Analyzed 5. Field duplicate sample results are presented in brackets.
Data Qualifiers:Organics (volatiles, PCBs, semivolatiles, pesticides, herbicides, dioxin/furans)
J - Indicates that the associated numerical value is an estimated concentration.R - Data was rejected due to a deficiency in the data generation process.I - Polychlorinated Diphenyl Ether (PCDPE) Interference.Q - Indicates the presence of quantitative interferences.
G:\GE\GE_Pittsfield_CD_GMA_1\Reports and Presentations\Fall 2012 GW Qual Rpt\0221311324AppxD_TD1_D3.xlsxE2SC-23 Page 1 of 1 1/30/2013

Table D-2Historical Groundwater Analytical Results - Well ESA1S-31R
Groundwater Quality Monitoring Inteirm Report For Fall 2012Plant Site 1 Groundwater Management AreaGeneral Electric Company - Pittsfield, Massachusetts(Results are presented in parts per million, ppm)
Sample ID: Method 1 GW-2 Method 1 GW-3 MCP UCL ESA1S-31R Detection Minimum Maximum Median Arithmetic Geometric StandardParameter Date Collected: Standards Standards for GroundWater 10/31/12 Frequency Detect Detect Value Average Mean Deviation
Volatile OrganicsBromodichloromethane 0.006 50 100 0.0021 [0.0020] 1/2 0.002 0.0021 0.00130 0.00130 0.00102 0.00113Chloroform 0.05 20 100 0.028 [0.025] 2/2 0.011 0.028 0.0190 0.0190 0.0172 0.0113Total VOCs 5 Not Listed Not Listed 0.030 [0.027] 2/2 0.011 0.03 0.0200 0.0200 0.0179 0.0127Semivolatile OrganicsNone Detected ND ND ND None Detected 0/2 ND ND ND ND ND ND
NOTES:
1. Samples were collected by ARCADIS between 2008 and 2012 and submitted SGS Environmental Services, Inc. for analysis.2. Samples have been validated as per GE's EPA-approved FSP/QAPP, General Electric Company, Pittsfield, Massachusetts.3. ND Indicates that all constituents for the parameter group were not detected.4. NA - Not Analyzed 5. Field duplicate sample results are presented in brackets.6. Total VOCs are being compaired to the notification level in the SOW of 5 ppm, as there is no GW-2 standard for Total VOCs.
G:\GE\GE_Pittsfield_CD_GMA_1\Reports and Presentations\Fall 2012 GW Qual Rpt\0221311324AppxD_TD1_D3.xlsxESA1S-31R Page 1 of 1 1/30/2013

Table D-3Historical Groundwater Analytical Results - Well ESA1S-72R
Groundwater Quality Monitoring Interim Report For Fall 2012Plant Site 1 Groundwater Management AreaGeneral Electric Company - Pittsfield, Massachusetts(Results are presented in parts per million, ppm)
Sample ID: Method 1 GW-2 Method 1 GW-3 MCP UCL ESA1S-72R Detection Minimum Maximum Median Arithmetic Geometric StandardParameter Date Collected: Standards Standards for GroundWater 10/31/12 Frequency Detect Detect Value Average Mean DeviationSemivolatile Organics1,2,4-Trichlorobenzene 2 50 100 ND(0.0055) 0/9 ND ND 0.000500 0.00142 0.00104 0.001101,2-Dichlorobenzene 2 2 20 ND(0.0055) 0/9 ND ND 0.000500 0.00142 0.00104 0.001101,3-Dichlorobenzene 2 50 100 ND(0.0055) 0/9 ND ND 0.000500 0.00142 0.00104 0.001101,4-Dichlorobenzene 0.2 8 80 ND(0.0055) 0/9 ND ND 0.000500 0.00142 0.00104 0.00110Naphthalene 1 20 100 ND(0.0055) 0/9 ND ND 0.000500 0.00122 0.000372 0.00129Other SVOCs - None Detected ND ND ND None Detected 0/1 ND ND ND ND ND ND
NOTES
1. Samples were collected by ARCADIS between 2004 and 2012 and submitted SGS Environmental Services, Inc. for analysis.2. Samples have been validated as per GE's EPA-approved FSP/QAPP, General Electric Company, Pittsfield, Massachusetts.3. NA - Not Analyzed 4. ND Indicates that all constituents for the parameter group were not detected.
G:\GE\GE_Pittsfield_CD_GMA_1\Reports and Presentations\Fall 2012 GW Qual Rpt\0221311324AppxD_TD1_D3.xlsxESA1S-72R Page 1 of 1 1/30/2013

Total VOC Concentrations –
Selected Well Sampled
in Fall 2012

Appendix DWell ESA1S-31R Historical VOC Concentrations
Groundwater Management Area 1General Electric Company - Pittsfield, Massachusetts
G:\GE\GE_Pittsfield_CD_GMA_1\Reports and Presentations\Fall 2012 GW Qual Rpt\0221311324AppxD_VOC.xlsx - ESA1S-31R
Page 1 of 11/30/2013
0.011
0.030 [0.027]
0.00
0.01
0.02
0.03
0.04
0.05
0.06
0.07
0.08
0.09
0.10
Apr-12 Oct-12
VO
C C
on
cen
trat
ion
s (p
pm
)
Date of Sample
Notes:1. ND - Indicates constituent was not detected above the practical quantitation limit.2. For GW-2 wells located within 30 feet of a school or occupied residential structure, the SOW
specifies a notification level of 5 ppm. 3. Although the MCP GW-2 and GW-3 Standards are applicable to this well, there are no listed MCP
GW-2 or GW-3 standards or UCLs for total VOCs.4. Field Duplicate results are presented in brackets. Where duplicate samples were analyzed, the
average VOC concentration is illustrated.

PCDD/PCDF Total TEQ
Concentrations – Selected Well
Sampled in Fall 2012

Appendix DWell E2SC-23 PCDD/PCDF - TEQ Concentrations
Groundwater Management Area 1General Electric Company - Pittsfield, Massachusetts
G:\GE\GE_Pittsfield_CD_GMA_1\Reports and Presentations\Fall 2012 GW Qual Rpt\0221311324AppxD_TEQ.xlsx - E2SC-23 Page 1 of 1 1/30/2013
4.10E-11 4.00E-09
1.00E-06
5.20E-09
6.50E-08
3.10E-07 [1.70E-07]
0.00E+00
2.00E-07
4.00E-07
6.00E-07
8.00E-07
1.00E-06
1.20E-06
1.40E-06
Oct-01 Apr-02 Oct-02 Apr-03 Apr-12 Nov-12
PC
DD
/PC
DF
To
tal T
EQ
Co
nce
ntr
atio
ns
(199
8 W
HO
TE
Fs)
(p
pm
)
Date of Sample
Notes:1. A total Toxicity Equivalency Quotient (TEQ) was calculated for PCDD/PCDFcompounds using the Toxicity Equivalency Factors (TEFs) derived by
the World Health Organization (WHO) and published by Van den Berg et al. in Environmental Health Perspectives 106(2), December 1998. In calculating those TEQs, the concentrations of individual PCDD/PCDF compounds that were not detected were represented as one-half of the detection limit for those compounds.
2. GW-2 Standard is Not Applicable.3. MCP GW-3 Standard is 4.0x10⁻⁵ ppm .4. MCP UCL for Groundwater is 4.0x10⁻⁴ ppm.5. Field Duplicate results are presented in brackets. Where duplicate samples were analyzed, the average TEQ concentration is illustrated.

Dissolved Lead Concentrations –
Selected Well Sampled
in Fall 2012

Appendix DWell E2SC-23 Historical Dissolved (Filtered) Lead Concentrations
Groundwater Management Area 1General Electric Company - Pittsfield, Massachusetts
G:\GE\GE_Pittsfield_CD_GMA_1\Reports and Presentations\Fall 2012 GW Qual Rpt\0221311324AppxD_Pb.xlsx - E2SC-23
Page 1 of 11/30/2013
ND ND ND
0.015
ND J
ND J [0.00647 J]
0.000
0.005
0.010
0.015
0.020
0.025
0.030
0.035
0.040
0.045
0.050
Oct-01 Apr-02 Oct-02 Apr-03 Apr-12 Nov-12
Dis
solv
ed L
ead
Co
nce
ntr
atio
ns
(pp
m)
Date of Sample
Notes:1. ND - Indicates constituent was not detected above the practical quantitation limit. 2. GW-2 Standard is Not Applicable.3. MCP GW-3 Standard is 0.01 ppm (illustrated below)4. MCP UCL for Groundwater is 0.15 ppm.5. J - Indicates an estimated concentration.6. Field Duplicate results are presented in brackets. Where duplicate samples were analyzed, the average dissolved lead concentration is illustrated.

Appendix E
Monitoring Results for Adjacent MCP
Disposal Site


Mr. Richard Green October 4, 2012Massachusetts Department Project No. J13632.20Of Environmental Protection Document No. 41485436 Dwight StreetSpringfield, MA 01103
RE: ROS Status ReportMarch through September 2012O’Connell Mobil Station730 East StreetPittsfield, MassachusettsRTN 1-13347
Dear Mr. Green:
On behalf of O’Connell Oil Associates, Inc. (O’Connell), Environmental Compliance Services, Inc.(ECS) has prepared a Remedy Operation Status (ROS) Status Report for the 730 East Street in Pittsfield,Massachusetts (the Site). A Site Locus is included as Figure 1. A Site Plan with system features, soilborings, monitoring well locations, and groundwater contours is included as Figure 2. A plan depictingthe Disposal Site Area is provided as Figure 3.
The Potentially Responsible Party (PRP) and contact for the Site is:
O’Connell Oil Associates, Inc.545 Merrill RoadPittsfield, Massachusetts 01201Attn: Mr. James SobonPhone: (413) 586-6800
The name and address of the Licensed Site Professional (LSP) of record for this Disposal Site isprovided below. The transmittal form submitted in concert with this report is being submittedelectronically bearing the signature and stamp of the LSP listed below.
Virginia Irvine, LSP #9687Environmental Compliance Services, Inc.588 Silver StreetAgawam, MA 01001(413) 789-3530

Project No. J13632.20/ Document No. 41482Mr. Richard GreenMassDEPOctober 4, 2012
Page 2
1.0 SITE DESCRIPTION
The Site consists of 17,414 square feet of land and includes one building, currently utilized as a gasolineservice station and convenience store, located on the southwest corner of the intersection of East andLyman Streets in Pittsfield, Massachusetts. The Site is completely paved with the exception of a gravelparking area located south of the on-site building (Figure 2). Abutting properties are used forcommercial and residential purposes.
Soils encountered during the soil borings performed at the Site consisted of a dark brown to dark tan,fine to medium sand with lesser amounts of silt observed in some borings. Bedrock was notencountered at the Site during the Phase II Comprehensive Site Assessment (Phase II CSA) fieldactivities.
Groundwater is present at the Site at depths ranging from approximately 8 to 13 feet below grade (fbg).Groundwater flow direction fluctuates from south to southwest toward the East Branch of theHousatonic River located approximately 500 feet south of the Site. The average groundwater seepagevelocity was determined to be 0.24 feet per day.
The closest surface water is Silver Lake located approximately 250 feet north of the Site.
The Massachusetts Contingency Plan (MCP) soil categories applicable to the Site are S-2 and S-3.Adult's frequency of use on the Site is characterized as high since workers are at the Site for eight ormore hours per day on a continuing basis. Children’s frequency of use is characterized as low since theyare present at the Site only as infrequent visitors. Intensity of use is considered to be low since any Siteactivities are passive and do not have the potential to disturb soil. The impacted soil is considered to be“potentially accessible” from 0 to 15 feet fbg.
Potential receptors at the Site include: construction workers, which may be involved in future re-working or excavation of the Site; environmental consultants; adults who work at the Site; and/orcustomers at the convenience store/filling station.
The MCP Method 1 groundwater categories applicable to the Site are GW-2 and GW-3 based on shallowdepth to water and discharge to surface water, respectively. GW-1 is not applicable because the Site isnot located in a Potential or Current Drinking Water Source Area.
Based upon current use of the Site, the soil standards applicable to the Site are S-2/GW-2, S-2/GW-3, S-3/GW-2, and S-3/GW-3. Since no use restriction has been placed on the property, residential exposurescenarios exists under potential future use, and therefore soil categories S-1/GW-2 and S-1/GW-3 arealso applicable to the Site for future use.
Current strategy for remediating soil and groundwater on the southeastern portion of the Site is theoperation of a biosparge system and monitoring for monitored natural attenuation (MNA) parameters asa future viable remedial alternative. Current strategy for remediating soil and groundwater on thenorthwestern portion of the Site is MNA.

Project No. J13632.20/ Document No. 41482Mr. Richard GreenMassDEPOctober 4, 2012
Page 3
2.0 SITE HISTORY
The Site property has been used as a retail gasoline station since at least 1968 and was used as anautomobile service station from approximately 1968 through 1986. During an investigation conductedfor a previous waste oil underground storage tank (UST) release on the Site (RTN 1-10847),concentrations of volatile petroleum hydrocarbons (VPH) and volatile organic compounds (VOCs) ingroundwater collected from wells located upgradient of the former waste oil UST exceeded theapplicable reportable concentrations (RCs). The Massachusetts Department of Environmental Protection(MassDEP) assigned RTN 1-13347 to the new reportable condition. ECS submitted a ReleaseNotification Form (RNF) to the MassDEP on March 10, 2000.
Two areas of historic soil and groundwater contamination have been identified at the Site. The first areais on the southeastern side of the Site property in an area which includes historic and current USTsystems for the storage of gasoline and diesel fuel and the dispenser island for diesel fuel. The source ofcontamination in this area is due to unknown historic releases of petroleum from these UST systems oractivities related to the dispensing of petroleum products. The second area of soil and groundwatercontamination is located on the northwestern side of the Site property where a limited area ofcontaminated soil has been identified along with limited downgradient groundwater impact. The sourceof contamination on the northwestern portion of the Site is unknown but may represent releases ofpetroleum from the previous operation of an automobile service station and gasoline filling station from1968 to 1986, prior to the purchase of the Site by O’Connell.
Phase I Initial Site Investigation (Phase I) activities were conducted at the Site in 2001. The datacollected during the Phase I indicated that a release or releases of gasoline to groundwater had occurredat the Site resulting in concentrations of VPH in groundwater exceeding the RCs. Low levels ofextractable petroleum hydrocarbons (EPH), and targeted polyaromatic hydrocarbon (PAH) analytes weredetected in the groundwater samples collected from monitoring wells ECS-2, ECS-3, ECS-4, and ECS-5;however, the concentrations detected did not exceed applicable RCGW-2 standards. The source ofgasoline constituents in soil and groundwater appears to be the historical gasoline storage area in theeastern portion of the Site and the pump island in the northern portion of the Site. A Tier ClassificationSubmittal was prepared for the Site and submitted concurrent with the Phase I Report. The Site wasclassified as Tier II.
A Phase II CSA and Phase III Remedial Action Plan (RAP) were completed for the Site by ECS inMarch 2003. Information obtained during Phase II investigations indicated that there were two potentialsource areas on the Site: the northwestern corner and the southeastern corner. Soil collected from adepth of 10 to 12 fbg in boring SB-2 on the northwestern corner of the Site property exceeded the S-1soil standards in combination with GW-2 and GW-3 groundwater categories but not the applicable S-3soil standards for C5-C8 Aliphatics and C9-C10 Aromatic VPH carbon fractions. Groundwater collectedfrom well ECS-3, located in the southeastern portion of the Site, downgradient of the current gasolineand diesel USTs exceeded both the GW-2 and GW-3 standards for the C9-C10 aromatic VPH carbonfraction. The current USTs, installed in 1984, are believed to be in the location of former USTs, whichwere installed in 1966 and removed in 1984. The Phase II determined that the average depth togroundwater is less than 15 feet; therefore, groundwater is a potential source of vapors to indoor air. Inthe past groundwater from monitoring wells located within 30 feet of the building (primarily ECS-2 andECS-6) have had concentrations of VPH above GW-2 standards. Soil gas samples were collected on

Project No. J13632.20/ Document No. 41482Mr. Richard GreenMassDEPOctober 4, 2012
Page 4
February 11, 2003 as part of the Phase II from locations adjacent to the on-site building beneath paving(SG-1 through SG-4). No concentrations of total volatile organic vapors (TOVs) were detected abovethe detection limit of the photoionization detector (PID). Based on this data, it appears that it is unlikelythat vapors from impacted groundwater will impact the indoor air of the on-site building.
Based on the results of the March 2003 Phase III RAP screening and analysis, the remedial actionalternatives selected for the Site were the excavation and replacement of impacted soils (with dewateringif necessary), in conjunction with the implementation of an MNA program for the soil contamination onthe northwestern corner of the Site and an MNA program for groundwater on the southeastern portionof the Site downgradient of the former and current diesel and gasoline USTs. A Phase IV RemedyImplementation Plan (RIP) detailing the implementation of the selected remediation alternatives wassubmitted in March 2004.
Based on groundwater analytical data collected in the fall of 2005, ECS determined that the MNAprogram detailed in the initial Phase IV RIP would not be sufficient to reduce dissolved-phase petroleumhydrocarbon concentrations in the southeastern portion of the Site, downgradient of the historic andcurrent UST systems. Therefore, ECS submitted Phase III RAP and Phase IV RIP Addendums inAugust 2006, which presented a comprehensive plan for the implementation of an additional remedialalternative, biosparging for contamination in the southeastern portion of the Site with MNA as a futureremedial option. On September 6 and 7, 2006 ECS personnel installed the trench system, laid ¼-inchdiameter clear polyethylene tubing from the oxygen sparge wells to the area of the system enclosure,backfilled, compacted, and sealed the trench system, and configured the wellheads and connections.The manifold was installed on September 8, 2006. The biosparge system was activated on September11, 2006 with all ten oxygen sparge legs in operation. A Phase IV Final Inspection Report andCompletion Statement and a Phase IV As-Built Construction Report were submitted in September 2006to present modifications to the construction of the active remedial system and document that the systemhad been constructed in accordance with the construction plans and appropriate modifications to suchplans. An ROS Opinion was submitted to the MassDEP on March 7, 2007 approximately six monthsafter the biosparging system start-up..As specified in the March 2004 Phase IV RIP, subsurface investigations were performed in 2005 todelineate the horizontal and vertical extent of soil contamination in the northwestern portion of the Site.A soil-boring event conducted on May 19, 2005 was discussed in the Tier II Permit Extension Request(ECS, February 2006) and in the Phase III RAP Addendum (ECS, August 2006). The soil analyticalresults indicated that soil contamination is limited to a 12-foot area below the water table at a depthranging from 10 to 16 fbg. Due to the limited area of contamination and location below the water table,ECS determined through cost-benefit analysis that excavation was not a feasible remedial alternative forsoil contamination in the northwestern area of the Site thereby leaving the 2003 Phase III RAP and 2004Phase IV RIP remedial alternative of MNA as the only remedial strategy for the northwestern area.Evidence that the MNA remedial strategy is effective in the northwest area of the Site was presentedwithin the Revised ROS Opinion (ECS December 2007).
3.0 REMEDIAL SYSTEM DESCRIPTION
The oxygen sparge system was activated on September 11, 2006 with all ten sparge legs in operation.The operation of the sparge wells was modified prior to the February 2009 sampling event in an attemptto concentrate the oxygen to the area of most impact (wells ECS-2 and ECS-3). Based on the fact that

Project No. J13632.20/ Document No. 41482Mr. Richard GreenMassDEPOctober 4, 2012
Page 5
VPH concentrations in groundwater from ECS-13, which is a deeper screened well (16 to 18 feet), wereabove Method 1 standards during the August sampling event, the system was modified to include AS-6as a replacement for AS-7 in September 2009. A leak was detected at AS-5 and the sparge point wasshut-off following the December 23, 2009 site visit. The sparge point (AS-5) was repaired on June 29,2010 and put into operation on July 20, 2010. Two additional sparge points, AS-11 and AS-12, wereinstalled in July 2012.
During this reporting period (March 2012 to September 2012), ECS personnel conducted site visits tocomplete required system operation, monitoring, and maintenance (OMM) on April 5, April 19, May 3,May 17, May 31, June 14, June 26, July 3, July 19, August 1, August 15, August 20, August 30, andSeptember 5, 2012. System data is included in Table 1. Gauging and geochemical monitoring dataassociated with Site visits are provided in Table 2. Field notes are provided in Attachment I.
From March until August 2012, sparge wells AS-1, AS-7, AS-8, AS-9 and AS-10 were closed and spargewells AS-2, AS-3, AS-4, AS-5, and AS-6 were operational. In August 2012, AS-2 and AS-9 were takenoffline and replaced by AS-11 and AS-12. During this reporting period, oxygen flow rates measured tothe oxygen sparge wells were 4 cubic feet per hour (cfh) during active sparging. Pressures measured inthe oxygen sparge wells ranged from 3 pounds per square inch (psi) to 20 psi.
4.0 GROUNDWATER MONITORING PROGRAM AND RESULTS
As stated in the Phase IV Remedy Implementation Plan (RIP)(March 2004) and as revised in the PhaseIV RIP Addendum (August 2006), groundwater monitoring is to be performed on a semiannual basis atselect wells to evaluate the effectiveness of the remedial strategy in reducing dissolved-phase petroleumhydrocarbons to levels that pose No Significant Risk. The monitoring plan as written in the 2004 RIP isprovided as Table II in Attachment II. The revised sampling program, as recommended in the 2006 RIPAddendum and currently in place, is provided as Table II-A. Groundwater is gauged and sampled forVPH and monitored for natural attenuation (MNA) parameters at select monitoring wells locatedupgradient, in the vicinity of, and downgradient of the former source areas and existing remedial wellnetwork.
4.1 Groundwater Monitoring Methodologies
Sampling Dates: August 20 and 30, 2012Sample Method: Low flow samplingLaboratory Analysis: VPH and select wells for nitrate, sulfate, and dissolved
iron; EPH at ECS-2 and ECS-12Field Measurements: Temperature, specific conductivity, DO, pH and ORPLaboratory: Spectrum Analytical of Agawam, MassachusettsSampling points planned: 13Number of wells gauged: 15Number of wells sampled: 13Completeness: 100%Depth to Groundwater: 9.12 feet below grade at ECS-10 to 13.10 feet below
grade at ECS-5.
Project No. J13632.20/ Document No. 41482Mr. Richard GreenMassDEPOctober 4, 2012
Page 6
Wells sampled: ECS-1, ECS-2, ECS-3, ECS-5, ECS-6, ECS-11, ECS-12, and ECS-13 (August 20); ECS-4, ECS-7, ECS-8,ECS-9, and ECS-10 (August 30)
Comments: Duplicate sample collected at ECS-2
The sampling logs for the sampling event are included as Attachment III. The LaboratoryCertificates of Analysis are included as Attachment IV. A summary of historical groundwatergauging and geochemical values is presented in Table 2. A summary of historical groundwatersampling VPH results is presented in Table 3. EPH data is summarized on Table 4.
4.2 Groundwater Gauging Results
Figure 2 provides groundwater contours based upon gauging data collected on that date.Groundwater elevations calculated from this gauging data suggest that groundwater flow ispredominantly toward the west-southwest across the Site. There was a strong west componentto groundwater flow depicted during the August 2012 gauging event which may be the results ofthe lack of groundwater data from wells ECS-7, ECS-9 and ECS-10. Wells ECS-7 and ECS-9were not accessible on August 20, 2012. Previous groundwater contours including these wellshas not shown this west component.
4.3 Groundwater Sampling Results
All concentrations of VPH fractions and Target Analytes reported for the August 2012 sampleswere below Method 1 GW-2 and GW-3 Standards. EPH Fractions and Target Analytes reportedfor the samples collected at ECS-2 and ECS-12 were below Method 1 GW-2 and GW-3Standards. These data are summarized on Tables 3 and 4.
4.4 Evaluation of Groundwater Results for the Southeastern Plume
The remedial method in the Southeastern Site Area is oxygen sparging with secondary MNA.
4.4.1 VPH Concentrations and Groundwater Elevations
Charts 1 through 3 depict the total VPH Fractions and BTEX concentrations (as generalindicators of groundwater quality) and groundwater elevations at ECS-2, ECS-3, andECS-13 versus time from September 2005 through February 2012. Since the restart ofthe system in 2008, the concentrations of VPH fractions and BTEX have exhibited anoverall decreasing trend. A correlation analysis of groundwater elevation and TotalVPH Fractions concentrations at these three wells since the system was restarted (May2008) did not indicate a significant correlation between these data (ranging from -0.12 to0.20).
4.4.2 ASTM Evaluation of Plume Stability in the Biosparge Area
In order to characterize the dissolved contaminant plume, the natural log ofconcentrations of total VPH carbon fractions versus time was plotted for three wells(ECS-2, ECS-3, and ECS-13) on Chart 4. The linear regression analysis for the best fit

Project No. J13632.20/ Document No. 41482Mr. Richard GreenMassDEPOctober 4, 2012
Page 7
line for each well is depicted. A plume will become stable when the rate of gasolinecontamination mass removal through natural attenuation equals the mass of gasolinecontamination entering the plume. The plume will shrink when the rate of VPH carbonsfraction removal through natural attenuation is greater than the mass entering the plume.In all three wells concentrations of VPH in groundwater have remained stable,approaching zero since 2005.
Downgradient wells ECS-4, ECS-7, and ECS-8 were sampled on August 30, 2012 andanalysis of the samples did not detect VPH fractions or target analytes at concentrationabove the reportable detection limits (RDLs). Based upon this information the plumeappears to be stable or shrinking, providing primary evidence of attenuation ofpetroleum hydrocarbons as a result of the oxygen biosparge system.
4.4.3 Analysis of Oxygen Sparging
The dissolved oxygen concentrations are measured in the wells within the influence ofthe oxygen sparge system (ECS-2, ECS-3, ECS-12, and ECS-13) during OMM events.Dissolved oxygen concentrations at monitoring wells ECS-4 and ECS-8, located withinthe contaminant plume and downgradient of the sparge area are also measured toprovide data for this downgradient region of the aquifer.
Maximum DO Concentration Measured: 10.20 mg/L (ECS-13, August 1, 2012)Minimum DO Concentration Measured: 0.23 mg/L (ECS-12, August 20, 2012)Average DO Concentration: 3.80 mg/L
The lower concentrations of dissolved oxygen observed at ECS-2 may indicate that thissparge point is no longer effectively delivering oxygen to the aquifer in the area of ECS-2 and ECS-3. An additional sparge point (AS-12) was installed during this reportingperiod to provide additional oxygen to this region of the aquifer.
Concentrations of total VPH carbon fractions in groundwater from wells ECS-2, ECS-3,and ECS-13 were plotted against dissolved oxygen as a function of time in Charts 5through 7, respectively. The trend of the data collected from wells ECS-3 and ECS-13during groundwater monitoring events from September 2005 through August 2012generally indicates a slight inverse relationship between dissolved oxygen levels andtotal VPH concentrations (-0.36 and -0.32, respectively). At ECS-2, a slightly positivecorrelation between dissolved oxygen concentration and VPH fractions concentrationshas been observed since 2008 (0.27). The concentrations of VPH fractions havegenerally declined since 2008, but progress has been slower at ECS-2. At ECS-3 andECS-13, the injection of oxygen, which results in elevated concentrations of dissolvedoxygen in groundwater at the Site, appears to be contributing to the overall reduction ofdissolved phase hydrocarbon impact through aerobic biodegradation processes.Dissolved oxygen concentrations have been measured below 1 mg/L at ECS-2, whichmay be associated with the temporary shutdowns of the oxygen sparging system whenthe oxygen tanks are empty. More consistent oxygen supply and possibly the addition ofoxygen sparge points in this area of the aquifer may be beneficial to maintainingbacterial populations that degrade petroleum hydrocarbons
Project No. J13632.20/ Document No. 41482Mr. Richard GreenMassDEPOctober 4, 2012
Page 8
4.4.4 Discussion of Contaminant Isopleths
Figure 4 illustrates the VPH Fractions isopleths for the August 2012 data. As acomparison, Figure 5 provides VPH Fractions isopleths for the September 2005 data(prior to system startup). The plume geometry has changed slightly. The contaminantplume in February 2012 was centered about ECS-12, whereas the plume center inSeptember 2005 included ECS-2, ECS-3, and ECS-13.
4.5 Evaluation of Groundwater Results in the Northwestern Plume
The sole remedial method in the northwestern portion of the Site is MNA.
4.5.1 BTEX Concentrations and Groundwater Elevations
Charts 8 and 9 depict the total VPH Fractions and BTEX concentrations (as generalindicators of groundwater quality) and groundwater elevations at ECS-5 and ECS-6versus time from September 2005 through August2012. The concentrations of VPHfractions and BTEX reported in samples collected at wells ECS-5 have decreased orremained stable or declined slightly over the past four reporting periods. Theconcentrations of VPH fractions and BTEX at ECS-6 increased from February 2010 toMarch 2011 and have increased slightly during the past year and a half. A correlationanalysis of groundwater elevation and Total VPH Fractions concentrations at these twowells since September 2005 indicates a moderate positive correlation at ECS-5 (0.53),and an insignificant low positive correlation at ECS-6 (0.17).
4.5.2 ASTM Evaluation of Plume Stability in the Biosparge Area
In order to characterize the dissolved contaminant plume, the natural log ofconcentrations of total BTEX versus time was plotted for two wells (ECS-5 and ECS-6)on Chart 10. The linear regression analysis for the best fit line for each well is depicted.In both wells concentrations of BTEX in groundwater have approached zero since 2005
with a decreasing trend indicating a stable and shrinking plume.
4.5.3 Discussion of Contaminant Isopleths
Based upon this information and the absence of VPH analytes at monitoring well ECS-10 and ECS-9 during the most recent sampling event, the plume appears to be shrinking,providing primary evidence of attenuation of petroleum hydrocarbons. Figure 4illustrates the VPH Fractions isopleths for the August 2012 data. As a comparison,Figure 5 provides VPH Fractions isopleths for the September 2005 data. The plumegeometry has shrunk significantly during this period of time, decreasing in both size andmagnitude.

Project No. J13632.20/ Document No. 41482Mr. Richard GreenMassDEPOctober 4, 2012
Page 9
4.6 Evaluation of MNA
4.6.1 General Geochemical Parameters Discussion
Selected monitoring wells at the Site are gauged for depth to groundwater, andgeochemical monitoring, including temperature, pH, dissolved oxygen, and oxidationreduction potential, on an approximately semimonthly schedule, and during regularlyscheduled groundwater sampling events, where specific conductivity is also collected.Groundwater samples from selected wells are collected during each sampling event forgeochemical quantitative analysis of dissolved iron, nitrate, and sulfate. Geochemicaldata is presented in Table 2.
Samples were collected and analyzed for dissolved iron, nitrate, and sulfate from wellsECS-1 (upgradient well), ECS-2 (downgradient), ECS-3 (downgradient), ECS-6 (west ofbuilding), ECS-5 (upgradient of northwest plume), ECS-9 (downgradient), and ECS-12(upgradient/crossgradient of current USTs) during the August 2012 groundwatersampling event.
4.6.2 Evaluation of MNA in the Biosparge System Area
Dissolved Oxygen: Ranged from 0.23 mg/L at ECS-12 to 10.20 mg/L at ECS-13Nitrate: Not detected at ECS-2 (<0.200 mg/L); maximum concentration
10.3 mg/L at ECS-1Dissolved Iron: Not detected at ECS-1 (<0.0300 mg/L) to 15.90 mg/L at ECS-12Sulfate: Not detected at ECS-12 (<1.00 mg/L) to 42.2 mg/L at ECS-3
The concentrations of dissolved oxygen are discussed in Section 4.4.3 the discussion ofthe oxygen sparging system results.
Nitrate was present at detectable concentrations in groundwater samples collected atECS-3 and ECS-13 during this reporting period, which may indicate that the oxygensupplied by the remedial system is causing the microbial population to shift away fromanaerobic degradation processes in favor of aerobic degradation processes. The absenceof nitrate in groundwater at well ECS-2 implies that microbial processes involvinganaerobic nitrate reducing bacteria may still be occurring in groundwater at this area ofthe Site. A new sparge point (AS-12) was installed in the area of ECS-2 to increaseoxygen flow to this region of the aquifer.
Iron reduction is most likely not occurring in the area of ECS-1 due to the absence ofpetroleum hydrocarbons in this region of the aquifer. Dissolved iron concentrations ingroundwater exhibited a steadily decreasing trend at ECS-3 (located within the spargezone) over the past two years, suggesting that the microbial degradation processes arelikely not relying upon iron-reducing bacteria in the area of ECS-3 when oxygensparging is occurring and dissolved oxygen is available. Iron-reducing bacteria may beactive in the areas of ECS-2, where effectiveness of the sparge point was declining.

Project No. J13632.20/ Document No. 41482Mr. Richard GreenMassDEPOctober 4, 2012
Page 10
The presence of sulfate concentrations in groundwater at most monitoring wells withinthe sparge network suggests that microbial degradation of petroleum hydrocarbons isnot occurring via sulfate-reducing processes, excepting in the area of ECS-12, whereoxygen sparging had not occurred since June 2010. A replacement sparge point (AS-11)was installed near ECS-12 during this reporting period.
Total VPH Fractions concentrations, dissolved oxygen, dissolved iron, sulfate and nitrateconcentrations at ECS-1, ECS-11, ECS-12, ECS-2, and ECS-3 (August 2012) are plottedversus approximate distance from the source area on Chart 11. The chart demonstratesthat concentrations of VPH decline within the sparge network. Near ECS-12 whereactive sparging had been suspended since June 2010, sulfate-reducing and iron-reducingactivities are occurring resulting in lower concentrations of sulfate and higherconcentrations of dissolved iron. In the vicinity of ECS-3 where active sparging isoccurring, dissolved iron concentrations are lower and sulfate concentrations are higherbecause oxygen is available for aerobic degradation processes. Two new sparge pointswere installed and placed online in the vicinities of ECS-2 and ECS-12 during thisreporting period to increase the availability of oxygen in these areas of the aquifer.
4.6.3 Evaluation of MNA in the Northwest Plume
Northwest Plume
Dissolved Oxygen: Ranged from 0.32 mg/L at ECS-6 to 3.10 at ECS-5Nitrate: Not detected at ECS-9 (<0.100 mg/L); maximum concentration
0.35 mg/L at ECS-5Dissolved Iron: Ranged from 0.0326 mg/L at ECS-5 to 15.3 mg/L at ECS-9Sulfate: Ranged from 1.52 mg/L at ECS-9 to 31.9 at ECS-5
Concentrations of dissolved oxygen were measured to be less than 1 mg/L at ECS-6during this reporting period.
The low concentrations of nitrate in groundwater at wells ECS-6 and ECS-9 implies thatmicrobial processes involving anaerobic nitrate reducing bacteria may have occurred ingroundwater at these areas of the Site; however, the concentrations of nitrate in otherwells at the Site have historically been <5 mg/L. Nitrate concentrations may be naturallylow at the Site and not be related to nitrate-reducing activity.
The concentrations of dissolved iron at ECS-6 and ECS-9 have increased over the pastyear, suggesting that the microbial degradation processes have occurred via iron-reducing mechanisms.
Concentrations of sulfate were lower at downgradient well ECS-9 compared to ECS-5and ECS-6. The presence of sulfate concentrations in groundwater at monitoring wellslocated upgradient of and in center of the northwest plume suggests that microbialdegradation of petroleum hydrocarbons is not occurring via sulfate-reducing processesin these areas of the plume, but may be occurring in the downgradient region of theaquifer.

Project No. J13632.20/ Document No. 41482Mr. Richard GreenMassDEPOctober 4, 2012
Page 11
Total VPH Fractions concentrations, dissolved oxygen, dissolved iron, sulfate and nitrateconcentrations at ECS-5, ECS-6, ECS-10, and ECS-9 (August 2012) are plotted versusapproximate distance from the source area on Chart 12. The chart demonstrates thatconcentrations of VPH decline with distance from the source. Near ECS-9, nitrate-,sulfate-, and and iron-reducing activities are occurring resulting in lower concentrationsof nitrate and sulfate and higher concentrations of dissolved iron. Dissolved oxygenconcentrations decline in the vicinity of the source area, and remain below 1.0 mg/Ldowngradient of the source area.
5.0 ADDITIONAL FIELD ACTIVITIES
Two additional sparge wells, AS-11 and AS-12 were installed at the Site on July 12, 2012. Sparge pointAS-11 was installed near monitoring well ECS-12. Sparge well AS-12 was installed adjacent tomonitoring well ECS-2.
One soil gas point, SG-5, was installed inside the Site building approximately 10 feet (horizontally) frommonitoring well ECS-2.
Boring logs are provided as Attachment V detailing the field observations, screening data, and wellconstruction information.
ECS personnel were onsite on August 22, 2012 to connect AS-11 and AS-12 to the oxygen supplysystem. The oxygen system was temporarily shut down and the tubing was installed in a narrow trenchapproximately 2 feet below grade. The tubing connected to AS-2 was rerouted to AS-12. The tubingfor AS-9 was rerouted to AS-11. The oxygen supply system was then reopened and oxygen flow wasdirected to the two new wells. Field notes are provided as Attachment I detailing the installation of theoxygen supply lines.
6.0 DATA USABILITY AND REPRESENTATIVENESS
Groundwater samples collected during the August 2012 groundwater sampling event were analyzed forEPH and/or VPH according to the MassDEP Compendium of Analytical Methods (CAM) EPH and VPHMethods Rev. 1.1. Sampling was performed according to CAM, revisions which were effective July 1,2010.
Field precision was demonstrated by the use of a field duplicate groundwater sample collected frommonitoring well ECS-2 during the August 20, 2012 event and analyzed for VPH. The relative percentagedifferences (RPDs) for VPH Fractions and Target Analytes for the field duplicates were within the rangeof ±30%. The highest concentrations reported for each analyte will be utilized in future riskassessments; concentrations did not exceed Method 1 Standards applicable to the Site.
QAQC information for the samples collected during this reporting period is provided as Table 5.
Accuracy for VPH and EPH analysis was determined by the laboratory use of surrogate recoveries,which were all within the control limits of 70% to 130% and 40% to 140%, respectively. The laboratorydid note some nonconformances in the EPH analysis for the laboratory control samples. The

Project No. J13632.20/ Document No. 41482Mr. Richard GreenMassDEPOctober 4, 2012
Page 12
nonconformances are not expected to affect the usability of the data. The laboratory also noted that theReportable Detection Limits (RDLs) for the analysis of the samples collected at ECS-12, and theduplicate sample (collected at ECS-2) were elevated due to dilution of the samples, which was requiredso that the concentrations were with the instrument calibration range. The RDLs were below the Method1 Standards applicable to the Site, and so these data are retained for use in this and future reports.
To assure sample representativeness all sampling methods were in accordance with MassDEP and/orUSEPA groundwater sampling procedures as described in ECS sampling SOPs and documented insampling field notes. Sampling containers, preservation methods, and holding times met Methodrequirements. The groundwater samples were submitted to the laboratory on ice. The temperature ofthe groundwater samples collected on August 20, 2012 as measured immediately upon submittal to thelaboratory was 8.0°C, and the temperature of the groundwater samples collected on August 30, 2012 was-0.7°C, outside the USEPA recommended temperature range of 4°C ± 2°C. The samples collected onAugust 20, 2012 were submitted to the laboratory approximately two hours after the last sample wascollected at the Site. The samples were reported received on ice at the laboratory. The samples collectedon August 30, 2012 were submitted to the laboratory the morning after they were collected. The sampleswere reported to be received on ice and were not frozen. These samples are retained and will be used tosupport the conclusion of this and future reports.Groundwater samples were collected from select monitoring wells based on the planned samplingprogram submitted in the Phase IV RIP. These data are therefore considered sufficient to characterizegroundwater quality at the Site. A detailed history of seasonal groundwater concentrations at the Site hasbeen compiled.The completeness of the August 2012 groundwater sampling event was 100% meeting the DQO of 80%for all samples and 100% completeness for critical samples.
A review of the precision, accuracy, representativeness, completeness, comparability, and sensitivity(PARCCS) indicates that the data collected during this reporting period are of suitable quality to supportthe conclusions of this report and future reports.
7.0 WASTE MANAGEMENT
During this reporting period, no waste material was generated at or removed from the Site. Soil cuttingsgenerated during drilling were reused as backfill around the riser pipe of the sparge wells.
8.0 PUBLIC INVOLVEMENT
Notices of Environmental Sampling, as required by 310 CMR 40.1403(10), were sent to the owners ofproperties where groundwater sampling is routinely performed. The property owners were providedwith the analytical results, a summary table of the analytical data, and a copy of the Disposal Site Map.Proof of this notification is provided as Attachment VI.
9.0 ROS PERFORMANCE STANDARD
The following conditions have been achieved to maintain the Performance Standard for RemedyOperation Status:

Project No. J13632.20/ Document No. 41482Mr. Richard GreenMassDEPOctober 4, 2012
Page 13
A Phase IV RIP detailing the selected remedial action alternatives for the Site was submitted tothe MassDEP in March 2004. At the time the Phase IV was submitted, excavation andreplacement of impacted soil (with dewatering, if necessary), in conjunction with theimplementation of a MNA program, for the soil contamination on the northwestern corner of theSite and an MNA program for groundwater on the southeastern portion of the Site,downgradient of the former and current diesel and gasoline USTs, were the selected alternatives.Based on the groundwater analytical data collected in the fall of 2005, ECS determined that theMNA program detailed in the initial Phase IV RIP would not be sufficient to reduce dissolved-phase petroleum hydrocarbon concentrations in the southeastern portion of the Site. Therefore,ECS submitted Phase III RAP and Phase IV RIP Addendums in August 2006, which presented acomprehensive plan for the implementation of a biosparging system for contamination in thesoutheastern portion of the Site, with MNA as a future option. The system construction wasdetailed in the Phase IV Completion, As-Built, and Final Inspection Reports submitted to theDEP in September 2006. An ROS opinion was submitted on March 7, 2007. As specified in theMarch 2004 Phase IV RIP, subsurface investigations were performed in 2005 to delineate thehorizontal and vertical extent of soil contamination in the northwestern portion of the Site. Thesoil analytical results indicated that soil contamination is limited to a 12-foot area below thewater table at a depth ranging from 10 to 16 fbg. Due to the limited area of contamination andlocation below the water table, ECS determined through cost-benefit analysis that excavationwas not a feasible remedial alternative for soil contamination in the northwestern area of the Sitethereby leaving the 2003 Phase III RAP and 2004 Phase IV RIP remedial alternative of MNA asthe only remedial strategy for the northwestern area. Evidence that the MNA remedial strategy iseffective in the northwest area of the Site was first presented within the Revised ROS Opinion(ECS December 2007) and subsequent ROS Status reports;
The biosparge remedial system and monitoring program have been designed in accordance with310 CMR 40.0893(2)(b) in order to achieve a Permanent Solution. Data for the August 2012sampling event supports the conclusion that the plumes on-site are stable and/or shrinking, andthat natural attenuation processes are occurring on the Site that are reducing the concentrationsof petroleum hydrocarbons in groundwater over time. Given that concentrations of petroleumhydrocarbons have been declining and are below Method 1 Standards at wells located within thenorthwestern plume, sampling of these wells may be discontinued following the February 2013sampling event;
The source(s) of oil and hazardous materials (OHM) have been eliminated and/or controlled inaccordance with 310 CMR 40.0893(2)(d). Two areas of historic soil and groundwatercontamination have been identified at the Site.
o The first area is on the southeastern side of the Site property in an area, which includeshistoric and current UST systems for the storage of gasoline and diesel fuel and thedispenser island for diesel fuel. The source of contamination in this area is due tounknown historic releases of petroleum from these UST systems or activities related tothe dispensing of petroleum products. The operation of a biosparge system on thesoutheastern portion of the Site decreases concentrations of dissolved contaminants ingroundwater as documented in Table 3. Data collected during this reporting periodrelated to EPH concentrations in groundwater at the Site does not suggest that the diesel

Project No. J13632.20/ Document No. 41482Mr. Richard GreenMassDEPOctober 4, 2012
Page 14
UST or dispenser are continuing sources at the Site. Concentrations of dissolvedcontaminants increase when the biosparge system is not operating. The collection ofsamples at ECS-2, ECS-3, and ECS-12 for analysis of EPH will occur annually until aPermanent Solution is achieved at the Site. The groundwater sampling program TableII-A has been amended accordingly.
o The second area of soil and groundwater contamination is located on the northwesternside of the Site property where a limited area of contaminated soil has been identifiedalong with limited downgradient groundwater impact. The source of the contaminationon the northwestern portion of the Site is unknown but may represent releases ofpetroleum from the previous operation of an automobile service and gasoline fillingstation from 1966 to 1986. The implementation of MNA on the northwestern portion ofthe Site has produced data showing that the dissolved contaminant plume is stable andthat biodecay is occurring.
There are no Substantial Hazards at the Site: light non-aqueous phase liquid (LNAPL) has neverbeen detected in any monitoring wells; and, dissolved-phase concentrations of VPH and EPHconstituents are below Upper Concentration Limits;
Continued generally decreasing trends observed in on and off-Site wells located in, adjacent anddowngradient of the source area is indicative of the success and appropriateness of the currentremediation strategy and supports the validity of the Site’s current ROS designation;
In accordance with 310 CMR 40.0893(2)(c) the remedial system and monitoring program arebeing operated and maintained in accordance with the design criteria found in the 2006 Phase IVRIP Addendum Operation, Maintenance, and Monitoring Plan;
The following operation and maintenance activities will be conducted until a Permanent Solutionhas been achieved, as detailed in the Final Inspection Report (ECS, September 2006) andmodified in subsequent reports:
o Sparging has been adjusted to focus on the regions of the aquifer near ECS-2 and ECS-12;
o Since concentrations of the C9-C12 Aliphatic VPH fraction have exceeded the Method 1GW-2 standard, a soil gas point was be installed within the footprint of the southwestportion of the building to evaluate the potential for vapor intrusion into the building andto provide data for the closure assessment. The soil gas point will be sampled during thenext reporting period;
o More closely scheduled Site visits that were proposed in the July 2011 SupplementalROS Status report were tried during this reporting period in order to reduce the downtime between replacements of oxygen tanks. Optimally, oxygen tank replacement shouldoccur approximately once every two to three weeks based upon information gatheredsince July 2011. The OMM schedule may be amended to three times per month basedupon oxygen use and delivery schedule;

Project No. J13632.20/ Document No. 41482Mr. Richard GreenMassDEPOctober 4, 2012
Page 15
o The biosparging system will be monitored at least twice per month to optimize systemperformance. A planned shutdown of the system may occur in order to conductrebound monitoring;
o Groundwater gauging and geochemical monitoring will be conducted during OMMvisits; and
o Groundwater samples will be collected on a semiannual basis. The next groundwatersampling event is scheduled to occur in February 2013.
ECS will submit operation, maintenance, and monitoring reports on a semi-annual basis asdescribed in 310 CMR 40.0893 to maintain ROS. The next status report will be submitted on orbefore March 28, 2013.
If there are any questions regarding this submittal, please contact the undersigned at (413) 789-3530.
Sincerely,ENVIRONMENTAL COMPLIANCE SERVICES, INC.
Lori A. McCarthyProject Manager
Virginia A. Irvine, PG, LSPSenior Hydrogeologist
LAM/VAI/kabAttachments

FIGURES

#694
Coc Dealersh ip
ECS-9 \Sl
~
I I I I I I I I I I I I I I I I I I I I I I I I I I I I I I I I I I I I I I I I I I I I I I I I I I I I I I I I
ECS~1 0 \Sl : I I
~ I I I I I I I I I I I I I I I I I I
Paved
PaYed
I I I
#727 Rc~idcntial
E A S T S T R E E T
Hydrcn t R im Elev.=99.27
""' \ _1. --\ [~\ :____:: ______/::::::::~] ,: ~ ,\ \ •. 'f> ~,,~ @
I m~ I ~ ; ~ \ P~ps mps
tJ'' I
I -~~ \ \ ;-<>~ '~ s"i.:,1
ECS-~'\\ l \ ~ -- Paved
SG- 2 . SG-1-$- \ \ \ rm 1
Paved
SG- 3-ljf
\Sl ECS-6 96.7 1 96.34
4 .4
MW-3 \Sl (Dest )
ECS-7 \Sl
~
~==---;;-;;....;..;~;~....:..=....:..~r----;:~=--~' =~ r FUIII~.'\ 1 st:~ L1f\ l_a,oa_o u_sr _ ol ECS-11 \S)
@oraTn
SG-4
Doc
Hydrcu l Lift 8
' Bm
Boy Doc 1 ;-Co mpces ' ~
II r--- Fiul
[ 1 a,ooo usr 0 I
Hydrauli c ...__
Lift '-~"'"'til"n!..,.,_,F:_;;ilfl IO,U~ =
c::med1al Enclo:sun: ~c-t
I AS- 0
I Com~i:!~:s:o~ ~ ., ~iesePPump p dAS-~ 99
66-15 ECS-2"' AS 2 eve , .
~~ iZJ AS-11 84.73 AS-1 (\))~S-12 ECS-12
84.74 'o, (\)AS- 7
_'_j ~-~-! ) 1:"."'-~~~ \_ ®AS-3 AS14 ® AS- 8 I
Former 97 76 -1: UST Fuel Oil 84 56 s t )
ECS-4 \Sl
-::-: \ ~ -;)( vI EGS-3 \Sl '1:-:-~~ Gcc\oel eking Acea \S)ECS-1 3 ®AS
- 4 \Sl AS-50 ''[jfillM~ __ •-;.;.e,;.;st;,;.l __ ~
~ -- ~
Paved
ECS-8 ~
~
#737 N / F Kentucky Fried Chicken
ci' "'-l ,.. ·~ "'-l
-~~,. rn 1-mE
Ll!'hZLJ
1- 85.0~
i--85.15
85.25
85.35 85.45
~CS-15
# 7 46
Uscd Car Dealer
Former Service Station
j
~ lml--------------1
Legend -- - - -- Approximate Property Line ---ss --- Sanitary Sewer Line --- ,. --- St orm Sewer Line
w Water Line ___ ,o------ Natural Gas Line ---<£--- Overhead Electric Line
@ Manhole
[!]] Cotchbosin
Wat er Gale
+ Fire Hydrant
* Utilit y Pole
@ Soil Boring
• ~
®
~
ECS-1 97.53 97.1 6 85.55
Soil Gas Point
Monitoring Well
Air Sparge Well
Proposed Soil Boring
Well I.D.
Rim Elevat ion PVC Elevation Water Tab le Elevation
Flow Direction Indicator
Water Tab le Contour 90.0 ---- (Dashed where inferred)
General Notes:
All locations, dim ensions , and propert y lines depicted on this plan are approximate Th is p lan should nat be used for cons truction or land conveyance purposes. Hori zon tal, and vertical loca tions of wells, and selected site fealu res det erm ined through m easurements made by representatives of ECS.
Wa t er t able el evations ore based on an assumed benchmark of 99 .2 7 feet locat ed a t the hydrant r im.
Wat er t able elevations are based an measurements m ade on October 20, 20 12.
Water t able contours, and fl ow direct ions assume homogenous, isotropic aquifer conditions, and horizont al flow.
Fluctuat ions in the level o f the wat er table may occur due t o fac t ors not accoun t ed for at the time of measu rem ent
Water t able con tou rs are interpol a t ed bet ween data points, and inferred in other areas.
Wells ECS-7, 9, 10 and 13 were not used in t he generation o f these g roundwater contours
PRMCI
5B8 Silver Street • Agawam, MA 01001 Phone: 1-800-789-3530 Fax: 413-789-~776
www.ec!!lconflult.com
O'Connell Mobil Station 730 East Street - Route 9
Pittsfield, Massachusetts
IIII LJ-.:
Site Plan with Groundwater Contours (B/20/12) QIENT:
O'Connell Oil Associates, Inc. GRAPHIC SCALE·
0 30 15 15 30 I ~fZZlE9z:z:z:u:j I
CAOFU£~ F~ \Oota\prcJII!d~\13S32\DOC\~13S32r_d~rg
SA\o£0 B Y~ RSTARCOO
DRAM/ BY: OE~GNEO BY: CHECKED BY: APPROVED BY:
RAS LM LM VAl
SCALE: DATE: JOB NO.: FIGURE NO:
1" = 30' 9/28/ 12 13632 2

#694
Car Dealersh ip
ECS-9 ~
I o.o3nl
I I I I I I I I I I I I I I I I I I I I I I I I I I I I Paved
I I I I I I I I I I I I I I I I I I I I I I I I I I I I
ECS-10 ~ : I c::::EU I
I I PaYed
I I I I I I I I I I I I I I I I
MW-3 ~ (Dest)
ECS-7 ~
c::::EU
E A S T
ECS-4 ~ c::::EU MW-4 ~
(Dest)
ECS-8 ~
c::::EU
#727 Rc~idcntial
S T R E E T
Paved
rn
z <r:
:::s
>--<
......<
Grovel Parking
Car Dealership Grave l Parking Lot
Paved
#737 N / F Kentucky Fried Chicken
~ ECS-15 I~
#746
Uscd Cor Dealer
Former Servic e Station
Legend -- - - -- Approximate Property Line ---ss --- Sanitary Sewer Line --- ,. --- St orm Sewer Line
w Water Line ___ ,o---- Natural Gas Lin e
---<£--- Overhead Electric Line
@ Manhole
[!]] Cotchbosin
., Wat er Gate
+ Fire Hydrant
* Utilit y Pole
@ Soil Boring
ijr Soil Gas Point
~ Monitoring Well
® Air Sparge Well
~ Proposed Soil Boring
ECS-1 Well I.D.
General Notes:
All locations, dim ensions , and propert y lines dep icted on this plan are approximate Th is p lan should not be used for cons truction or land conveyance purposes.
5B8 Silver Street • Agawam, MA 01001 Phone: 1-800-789-3530 Fax: 413-789-~776
www.ec!!lconflult.com
PRMCT:
O'Connell Mobil Station 730 East Street - Route 9
Pittsfield, Massachusetts
(1TLE: Site Plan lith Total VPH Fraction lsopleths (mg/L) (B/2ll ll 30/12)
QIENT:
O'Connell Oil Associates, Inc. GRAPHIC SCALE·
0 30 15 15 30 I ~fZZlE9z:z:z:u:j I
CAOFU£~ F~ \Oota\prcJII!d~\13S32\DOC\~13S32r_dll'g
SA\o£0 B Y~ RSTARCOO
DRAM/ BY: DE~GNED BY: CHECKED BY: APPROVED BY:
RAS LM LM VAl
SCALE: DATE: JOB NO.: FIGURE NO:
1" = 30' 9/28/ 12 13632 4

#694
Car Dea lersh ip
#727 Residfmtial
E A S T S T R E E T
~ '""~ --\ Paved "' ~
I "\~-, \
~~cs-R~ ' ~
I I [ J --
R \ / ~~
~W-1 I c::::ED I
Paved
/ c:::I..ZDIX ' I I
I I I I I I I I I I I I I I I I I I I I I I I I I I I I
'/-2 -ill- SG 1-ffi.'
( ~= Pa'J / '/
,.. 0 r Filii 1sK 7 / Lift ' ' I a.ooo usr 0 ~5-1 1,~1 Bay Door lr.ConJP~5~ ' ~
17 , " ~~~~ Fillj / j,~y&aulic
' .<h ~ Lift / SG-3 -cp @ol6in 8
I I I
Paved I ' I ' 8,000 UST 0
I Hydraulic • / 1----~\. c_.'=='~===~F-'-'
J' w ~C\-6 -$ Sj! 4
/ ~- ) I
Lift I I \ F'ljll 1 ls.ooo ~! ~ 1
/ emedia l EnclcsurJ ~ - "-
I 11
I I I I I
I I I I I
/ ~~~ MW-3 ~ I (Dest)
l / --ECS-10 ~ I I I I c::::Em::J I 1 I I
I I I / Pawd
I I I I I I I I I I I
t / I / I 11 I I
I I I I I I
I I I I
I I I I
I I I I
ECS-7 ~
c:::ElD
c::::ED ECS-4 ~
MW-4 ~ __ (Dest)
---Paved
/ I ECS-J ~ I um,_,
z <"I:
~
>--...:l
#737 N / F Kentucky Fried Chicken
~ I~ I~
#746
Used Cor Dealer
For mer Service Station
Legend
-- - - -- Approximate Property Line ___ ,. --- Sanitary Sewer Line ---sw--- Storm Sewer Line
w Water U ne ---N<>--- Natural Gas Lin e ---oc--- Overhead Electric Line
@ Manho le
[]ffi Catch basin
"' Wa ter Gate
+ Fire Hydran t
coc Utility Pole
• Soil Gas Point
~ Monitoring Well
® Air Sparge Well
111111111111111111111111111 System Trenching
ECS-1 Well I.D.
c::=:::J VPH Concentration (mg / L)
--------- VPH Isopleth (mg / L)
ND Not Detected
NS Not Sampled
General Notes:
All loca tions, dimensions, and property lines depicted on this plan are approximate. This plan shou ld not be used for construction or land conveya nce purposes.
588 Silver Slreel • Agawam, MA. 01001 Phone: 1-800-789-3530 Fax: 413-789-2776
www.ecseonsult..eom
PROJ:CT:
O'Connell Mobil Station
nTLE:
730 East St re et-Rou t e 9 Pittsfield, Massachusett s
Site Plan with VPH I~opleth~ (9/B/05) CLIENT'
O'Connell Oil Associates, Inc. GRAPHIC SCAl£'
:JO 15 d 15 :JO I P9===--, ~zz:r==vzzz:A I
CAOFU: F: \Doto\frojecls\1~ 32\pWG\s1Jo6 32r .dwg SAV£0 8Y:RSTAROOO
DRAIM'I BY: DESI GNED BY: CHECKED BY: APPROVED BY:
RAS LM LM JN SCALE: OATE' JOB NO.: FIGURE NQ.,
1" = 3 0' 7 / 22/ 11 13632 5

TABLES

Monitoring
Well & PVC
Elevation (ft)
Monitoring
Date
Depth to
Water (ft)
Groundwater
Elevation (ft)pH (SU)
Specific
Conductivity
(µS/cm)
Dissolved
Oxygen
(mg/L)
Redox
(mV)
Nitrate
(mg/L)
Sulfate
(mg/L)
Dissolved Iron
(mg/L)
ECS-1* 11/8/99 NA NA NA NA NA NA NS NS NS97.19 12/19/02 NA NA NA NA NA NA NS NS NS97.02 9/8/05 11.78 85.24 5.06 750 4.91 549 4.48 26.2 0.015
1/25/06 8.49 88.53 7.31 108 2.71 68.0 2.16 23.4 3.904/11/06 11.38 85.64 7.04 926 4.00 10.0 4.45 27.6 <0.017/20/06 11.72 85.30 4.78 814 2.98 590 3.85 27.5 <0.01
10/10/06 12.21 84.81 NA NA NA NA NS NS NS1/25/07 11.34 85.68 7.65 620 4.87 33.0 3.70 25.9 <0.012/26/07 11.29 85.73 7.82 NM 2.67 182.6 NS NS NS4/24/07 9.89 87.13 NA NA NA NA NS NS NS10/4/07 12.74 84.28 7.45 743 4.49 88 3.81 27.3 <0.03003/11/08 9.82 87.20 7.37 708 4.06 160 3.35 25.9 <0.03005/1/08 11.5 85.52 7.56 822 5.37 33 3.79 27.8 <0.0300
11/24/08 11.61 85.41 7.51 836 1.93 -10 3.73 25.5 <0.03002/18/09 11.6 85.42 7.51 841 4.19 69 3.64 26.9 <0.0300
8/24/09 10.47 86.55 7.41 807 5.09 86 3.77 29.8 <0.0300
2/11/10 11.6 85.42 7.49 830 4.01 -10 3.42 27.7 <0.0300
9/9/10 12.61 84.41 7.66 757 0.63 212 3.38 27.0 <0.0300
3/28/11 NA NA NA NA NA NA NA NA NA
9/14/11 9.51 87.51 7.60 688 4.07 -18.2 3.30 29.8 0.0523
2/15/12 11.27 85.75 7.85 727 4.97 -30.2 3.23 25.1 <0.0300
8/20/12 12.07 84.95 7.46 665 3.64 -12.3 10.3 33.6 <0.0300
ECS-2** 11/8/99 NA NA NA NA NA NA NS NS NS97.76 12/19/02 NA NA NA NA NA NA NS NS NS97.60 9/8/05 12.44 85.16 5.94 975 0.48 -9.5 NS NS NS
11/1/05 10.65 86.95 6.89 1410 0.87 -65.9 NS NS NS1/25/06 10.16 87.44 6.84 781 1.52 -93.0 NS NS NS4/10/06 12.09 85.51 6.70 1,118 0.62 10.0 NS NS NS7/20/06 12.42 85.18 3.40 1,601 0.29 572 NS NS NS9/15/06 13.44 84.16 6.99 NM 3.88 -36.8 NS NS NS9/21/06 13.00 84.60 6.97 NM 11.68 237 NS NS NS10/6/06 12.84 84.76 6.97 NM 2.27 60.3 NS NS NS
10/10/06 12.92 84.68 NM 805 0.63 28.0 NS NS NS10/23/06 12.25 85.35 6.28 NM 0.80 NM NS NS NS11/7/06 12.21 85.39 6.67 NM 8.83 -60.8 NS NS NS
11/20/06 11.58 86.02 7.12 NM 8.94 161.7 NS NS NS12/4/06 12.06 85.54 7.19 NM 9.96 228.8 NS NS NS
12/18/06 12.54 85.06 6.20 NM 9.40 10.9 NS NS NS1/2/07 12.44 85.16 7.34 NM 8.68 -122.3 NS NS NS
1/15/07 11.94 85.66 7.41 NM 8.76 -133.6 NS NS NS1/25/07 12.06 85.54 7.10 838 1.84 6.0 NS NS NS1/29/07 12.21 85.39 7.07 NM 12.24 -98.9 NS NS NS2/12/07 12.74 84.86 7.34 NM 11.84 -6.2 NS NS NS2/26/07 12.01 85.59 7.28 NM 6.63 252.3 NS NS NS3/12/07 12.92 84.68 6.68 NM 14.60 32.2 NS NS NS3/26/07 11.91 85.69 6.67 NM 11.34 -66.9 NS NS NS4/10/07 11.26 86.34 7.09 NM 5.75 -1.8 NS NS NS4/24/07 10.39 87.21 4.94 1,015 0.60 -27.6 NS NS NS5/7/07 11.27 86.33 5.66 NM 11.98 32.9 NS NS NS
5/24/07 11.02 86.58 5.82 NM 10.45 45.7 NS NS NS6/4/07 12.13 85.47 5.52 NM *24.65 -8.6 NS NS NS
6/18/07 12.38 85.22 6.48 NM 15.23 -67.2 NS NS NS7/3/07 12.52 85.08 7.60 NM 15.09 37.0 NS NS NS
7/16/07 12.81 84.79 7.25 NM 15.37 58.0 NS NS NS8/1/07 12.95 84.65 6.61 NM 14.28 -57.4 NS NS NS
8/13/07 13.01 84.59 5.22 NM 15.20 -265.0 NS NS NS8/27/07 13.23 84.37 6.48 NM 19.17 -92.2 NS NS NS9/10/07 13.32 84.28 7.72 NM 12.07 -61.6 NS NS NS9/25/07 13.39 84.21 7.69 NM 7.23 -73.5 NS NS NS10/4/07 13.50 84.10 6.55 1436 1.34 -73.0 NS NS NS10/9/07 13.54 84.06 6.07 NM 1.97 -308.7 NS NS NS
10/22/07 13.29 84.31 6.81 NM 5.91 -51.9 NS NS NS11/5/07 13.13 84.47 7.41 NM 9.97 -24.2 NS NS NS
11/19/07 12.84 84.76 6.71 NM 4.31 -50.1 NS NS NS12/3/07 13.83 83.77 7.06 NM 9.75 -199.7 NS NS NS
12/17/07 12.94 84.66 7.06 NM 8.15 -111.5 NS NS NS1/2/08 12.42 85.18 6.46 NM 6.47 -139.1 NS NS NS
1/14/08 12.03 85.57 6.41 NM 7.01 -130.4 NS NS NS
TABLE 2GROUNDWATER GEOCHEMICAL MONITORING DATA
730 East Street, Pittsfield, MassachusettsO'Connell Oil Associates

Monitoring
Well & PVC
Elevation (ft)
Monitoring
Date
Depth to
Water (ft)
Groundwater
Elevation (ft)pH (SU)
Specific
Conductivity
(µS/cm)
Dissolved
Oxygen
(mg/L)
Redox
(mV)
Nitrate
(mg/L)
Sulfate
(mg/L)
Dissolved Iron
(mg/L)
TABLE 2GROUNDWATER GEOCHEMICAL MONITORING DATA
730 East Street, Pittsfield, MassachusettsO'Connell Oil Associates
ECS-2 1/29/08 12.41 85.19 6.36 NM 9.21 61.5 NS NS NS(continued) 2/11/08 12.23 85.37 NM NM NM NM NS NS NS
3/7/08 11.06 86.54 6.36 227 0.60 129.6 NS NS NS3/11/08 10.38 87.22 6.47 245 4.21 61 NS NS NS5/1/08 11.13 86.47 6.29 194 0.74 38 NS NS NS
5/27/08 10.95 86.65 NM NM NM NM NS NS NS6/4/08 12.28 85.32 5.21 NM 11.40 44.4 NS NS NS
6/17/08 12.08 85.52 6.27 NM 4.56 143.6 NS NS NS7/1/08 12.02 85.58 6.59 NM 8.22 60.3 NS NS NS7/9/08 NM 85.58 NM NM NM NM NS NS NS
7/14/08 12.43 85.17 6.60 NM 0.88 -82.9 NS NS NS7/30/08 11.62 85.98 6.54 NM 9.87 61.7 NS NS NS8/12/08 12.05 85.55 6.39 NM 1.80 5.4 NS NS NS8/20/08 11.68 85.92 NM NM NM NM NS NS NS8/26/08 12.48 85.12 6.43 NM 1.74 -18 NS NS NS9/9/08 11.56 86.04 6.25 NM 1.42 23.8 NS NS NS
9/22/08 12.60 85.00 6.34 NM 2.02 -95.4 NS NS NS10/17/08 12.71 84.89 6.32 NM 1.70 43.0 NS NS NS10/27/08 12.35 85.25 6.13 NM 0.74 42.8 NS NS NS11/11/08 12.00 85.60 6.27 NM 2.32 19.8 NS NS NS11/24/08 12.24 85.36 6.20 312 0.33 14.0 NS NS NS11/25/08 12.18 85.42 6.25 NM 3.14 76.1 NS NS NS12/11/08 11.85 85.75 6.65 NM 0.60 -42.1 NS NS NS12/23/08 11.18 86.42 6.50 NM 6.67 6.7 NS NS NS
1/6/09 11.09 86.51 6.61 NM 4.43 94.1 NS NS NS1/23/09 11.82 85.78 5.60 NM 26.36 113.1 NS NS NS2/3/09 12.15 85.45 6.16 NM 9.11 151.6 NS NS NS
2/18/09 12.23 85.37 6.54 239 2.91 143.0 NS NS NS2/24/09 12.30 85.30 6.18 NM 18.36 122.0 NS NS NS3/4/09 12.18 85.42 6.14 NM 22.40 237.7 NS NS NS
3/19/09 11.28 86.32 6.97 NM 19.11 15.0 NS NS NS4/9/09 11.30 86.30 5.86 NM 21.72 181.6 NS NS NS
4/23/09 11.69 85.91 6.57 NM 7.45 75.0 NS NS NS5/5/09 12.10 85.50 6.12 NM 9.21 64.9 NS NS NS
5/19/09 11.92 85.68 6.03 NM 1.31 123.0 NS NS NS6/11/09 12.50 85.10 6.15 660 1.06 -102.9 NS NS NS6/26/09 11.23 86.37 6.10 1210 1.09 110.3 NS NS NS7/6/09 11.45 86.15 5.98 467 3.30 78.6 NS NS NS
7/22/09 11.70 85.90 6.73 1459 3.86 -18.9 NS NS NS8/6/09 10.68 86.92 6.49 164 11.46 43.5 NS NS NS
8/24/09 11.07 86.53 6.11 850 9.61 51.0 NS NS NS9/10/09 11.60 86.00 6.38 770 3.08 119.6 NS NS NS9/23/09 12.00 85.60 6.50 909 5.51 -48.0 NS NS NS10/6/09 12.13 85.47 6.19 228 6.90 130.6 NS NS NS
10/13/09 12.15 85.45 6.65 577 4.65 25.0 NS NS NS10/23/09 12.31 85.29 6.45 207 16.27 86.4 NS NS NS11/5/09 11.62 85.98 6.57 318 6.26 54.1 NS NS NS
11/17/09 11.80 85.80 6.96 214 9.52 30.9 NS NS NS12/8/09 11.76 85.84 6.80 218 10.24 16.7 NS NS NS
12/23/09 11.96 85.64 7.01 159 6.29 -6.9 NS NS NS1/8/10 12.12 85.48 6.60 166 8.85 74.8 NS NS NS
1/20/10 12.23 85.37 7.01 259 10.48 54.0 NS NS NS2/3/10 11.93 85.67 6.75 NM 27.64 199.3 NS NS NS
2/11/10 12.76 84.84 5.94 204 9.19 94.0 NS NS NS2/18/10 12.38 85.22 6.75 NM 9.44 25.0 NS NS NS3/3/10 11.83 85.77 6.90 244 5.62 59.0 NS NS NS
3/17/10 11.07 86.53 6.81 664 4.28 47.5 NS NS NS4/15/10 11.29 86.31 6.49 985 8.12 65.7 NS NS NS4/28/10 11.80 85.80 6.68 NM 2.40 118.0 NS NS NS5/13/10 12.03 85.57 6.94 1,696 4.60 -83.1 NS NS NS5/27/10 12.30 85.30 6.51 NM 9.09 77.5 NS NS NS6/9/10 12.47 85.13 6.66 NM 1.18 -72.3 NS NS NS
6/24/10 12.54 85.06 6.84 NM 0.59 -80.4 NS NS NS7/9/10 12.88 84.72 4.60 NM 3.75 120.6 NS NS NS
7/20/10 12.92 84.68 7.07 NM 5.82 -377.0 NS NS NS8/5/10 12.95 84.65 6.84 NM 1.80 -31.4 NS NS NS
8/18/10 13.15 84.45 6.41 NM 2.19 -25.3 NS NS NS9/9/10 13.37 84.23 6.99 1,357 0.42 -66.0 NS NS NS
9/15/10 13.48 84.12 6.50 NM 1.11 -36.1 NS NS NS9/30/10 13.49 84.11 6.33 NM 2.82 185.6 NS NS NS10/5/10 12.80 84.80 6.90 1,716 0.30 -106.2 NS NS NS

Monitoring
Well & PVC
Elevation (ft)
Monitoring
Date
Depth to
Water (ft)
Groundwater
Elevation (ft)pH (SU)
Specific
Conductivity
(µS/cm)
Dissolved
Oxygen
(mg/L)
Redox
(mV)
Nitrate
(mg/L)
Sulfate
(mg/L)
Dissolved Iron
(mg/L)
TABLE 2GROUNDWATER GEOCHEMICAL MONITORING DATA
730 East Street, Pittsfield, MassachusettsO'Connell Oil Associates
ECS-2 10/21/10 12.55 85.05 6.78 NM 2.82 -72.8 NS NS NS(continued) 11/5/10 12.44 85.16 6.77 1,336 15.33 -5.5 NS NS NS
11/19/10 12.41 85.19 6.79 NM 3.00 -11.6 NS NS NS12/9/10 12.14 85.46 6.31 NM 1.81 -47.2 NS NS NS
12/22/10 12.02 85.58 6.25 1,586 1.70 -55.3 NS NS NS1/7/11 12.41 85.19 6.37 NM 6.18 -64.4 NS NS NS
1/19/11 12.74 84.86 6.89 NM 1.10 -105.2 NS NS NS2/4/11 NM NA NM NM NM NM NS NS NS
2/15/11 NM NA NM NM NM NM NS NS NS3/3/11 12.76 84.84 6.42 NM 11.90 232.5 NS NS NS
3/28/11 10.88 86.72 6.73 1,485 2.11 -78.1 NS NS NS4/7/11 10.99 86.61 7.23 NM 4.05 -85.9 NS NS NS
4/22/11 10.90 86.70 6.75 1,505 4.17 -80.6 NS NS NS5/7/11 10.98 86.62 8.22 1,418 1.00 -25.6 NS NS NS6/2/11 11.85 85.75 6.81 1,532 1.60 -38.0 NS NS NS
6/14/11 11.86 85.74 6.82 NM 0.52 -75.5 NS NS NS7/7/11 11.63 85.97 6.12 NM 1.24 -40.6 NS NS NS
7/25/11 12.24 85.36 6.80 NM 1.82 -95.3 NS NS NS8/15/11 12.60 85.00 6.91 NM 0.60 -104.6 NS NS NS8/26/11 12.04 85.56 7.08 1,175 0.30 -132.3 NS NS NS9/14/11 10.00 87.60 6.79 1,241 0.33 -100.6 <0.100 19.8 19.610/6/11 10.57 87.03 6.88 NM 0.50 -58.7 NS NS NS
10/20/11 11.18 86.42 6.95 NM 2.40 -99.8 NS NS NS11/3/11 11.35 86.25 6.69 1,331 2.59 -99.3 NS NS NS
11/17/11 11.57 86.03 6.71 NM 0.86 -69.0 NS NS NS12/7/11 11.57 86.03 6.87 861 4.15 225.3 NS NS NS
12/21/11 11.40 86.20 7.07 885 5.12 209.2 NS NS NS1/4/12 11.37 86.23 7.25 919 7.18 160.8 NS NS NS
1/17/12 11.78 85.82 7.27 1,008 7.80 243.8 NS NS NS2/1/12 11.37 86.23 7.23 1,272 7.36 259.5 NS NS NS
2/15/12 11.82 85.78 7.23 1,125 1.00 -65.0 <1.00 15.6 21.63/1/12 12.04 85.56 7.33 894 10.02 279.3 NS NS NS
3/15/12 11.64 85.96 7.11 1,049 2.28 291.3 NS NS NS4/5/12 12.15 85.45 6.96 NM 6.26 328.6 NS NS NS
4/19/12 12.46 85.14 7.60 NM 6.20 323.8 NS NS NS5/3/12 12.33 85.27 7.45 NM 1.47 242.2 NS NS NS
5/17/12 11.71 85.89 6.68 1,058 3.18 230.7 NS NS NS5/31/12 11.95 85.65 6.76 1,182 9.82 380.8 NS NS NS6/14/12 12.09 85.51 6.52 1,014 5.50 308.8 NS NS NS6/26/12 12.43 85.17 7.29 1,051 1.61 -40.0 NS NS NS7/3/12 12.68 84.92 6.62 NM 1.03 -169.0 NS NS NS
7/19/12 12.95 84.65 6.85 811 2.20 60.4 NS NS NS8/1/12 12.95 84.65 7.01 983 1.16 -87.7 NS NS NS
8/15/12 NM NA NM NM NM NM NS NS NS8/20/12 12.86 84.74 6.85 1,013 0.30 -100.8 <0.200 16.1 13.88/30/12 13.08 84.52 NM NM NM NM NS NS NS
ECS-3*(**)11/8/99 NA NA NA NA NA NA NS NS NS
97.95 12/19/02 NA NA NA NA NA NA NS NS NS97.76 9/8/05 12.65 85.11 5.64 1,418 0.87 -69.9 <1.0 <10.0 53.9
11/1/05 10.87 86.89 6.23 694 1.52 -0.4 NS NS NS1/25/06 NG NA NM NM NM NM NS NS NS4/11/06 12.34 85.42 6.69 2,070 0.36 -40.0 <0.100 <1.0 10.37/20/06 12.56 85.20 3.10 908 0.32 610 <0.500 27.5 14.49/15/06 13.61 84.15 6.89 NM 5.24 -57.3 NS NS NS9/21/06 13.24 84.52 7.19 NM 10.88 255 NS NS NS10/6/06 13.08 84.68 6.97 NM 3.19 8.2 NS NS NS
10/10/06 13.17 84.59 7.05 599 0.55 78.0 NS NS NS10/23/06 12.25 85.51 6.28 NM 2.18 NM NS NS NS11/7/06 12.45 85.31 6.60 NM 9.35 -68.8 NS NS NS
11/20/06 11.81 85.95 6.52 NM 10.34 177.8 NS NS NS12/4/06 12.31 85.45 7.24 NM 3.85 342.4 NS NS NS
12/18/06 12.77 84.99 6.27 NM 8.35 -31.9 NS NS NS1/2/07 12.64 85.12 7.19 NM 7.25 -209.7 NS NS NS
1/15/07 12.19 85.57 7.12 NM 7.39 -209.4 NS NS NS1/25/07 12.27 85.49 7.25 627 1.20 6.0 <0.5 28.4 5.981/29/07 12.47 85.29 7.18 NM 8.72 -125.6 NS NS NS2/12/07 12.96 84.80 7.55 NM 10.63 -89.0 NS NS NS2/26/07 NG-S NA NM NM NM NM NS NS NS3/12/07 NG-S NA NM NM NM NM NS NS NS3/26/07 12.13 85.63 6.72 NM 8.71 -80.60 NS NS NS

Monitoring
Well & PVC
Elevation (ft)
Monitoring
Date
Depth to
Water (ft)
Groundwater
Elevation (ft)pH (SU)
Specific
Conductivity
(µS/cm)
Dissolved
Oxygen
(mg/L)
Redox
(mV)
Nitrate
(mg/L)
Sulfate
(mg/L)
Dissolved Iron
(mg/L)
TABLE 2GROUNDWATER GEOCHEMICAL MONITORING DATA
730 East Street, Pittsfield, MassachusettsO'Connell Oil Associates
ECS-3 4/10/07 11.51 86.25 7.00 NM 14.93 -8.40 NS NS NS(continued) 4/24/07 10.62 87.14 6.70 819 1.43 -66.8 NS NS NS
5/7/07 11.52 86.24 5.24 NM 12.26 38.2 NS NS NS5/24/07 11.38 86.38 5.43 NM 9.37 49.2 NS NS NS6/4/07 12.4 85.36 5.72 NM 8.62 -16.7 NS NS NS
6/18/07 12.59 85.17 6.64 NM 12.59 -141.8 NS NS NS7/3/07 12.98 84.78 7.98 NM 15.82 37.7 NS NS NS
7/16/07 13.27 84.49 7.92 NM 15.98 56.4 NS NS NS8/1/07 13.18 84.58 6.78 NM 18.48 -76.9 NS NS NS
8/13/07 13.26 84.50 6.77 NM 2.18 -262.7 NS NS NS8/27/07 13.48 84.28 6.77 NM 11.05 -115.8 NS NS NS9/10/07 13.55 84.21 7.58 NM 9.23 -48.2 NS NS NS9/25/07 13.63 84.13 7.55 NM 7.23 -50.1 NS NS NS10/4/07 13.73 84.03 7.04 800 5.31 -99.0 <0.100 37.8 5.2110/9/07 13.77 83.99 6.47 NM 5.10 -329.9 NS NS NS
10/22/07 13.50 84.26 7.63 NM 4.38 -50.3 NS NS NS11/5/07 13.36 84.40 7.88 NM 7.21 -42.7 NS NS NS
11/19/07 13.09 84.67 7.52 NM 3.71 -48.5 NS NS NS12/3/07 13.04 84.72 7.21 NM 7.07 -127.1 NS NS NS
12/17/07 13.18 84.58 7.17 NM 7.01 -125.1 NS NS NS1/2/08 12.71 85.05 6.17 NM 5.21 41.4 NS NS NS
1/14/08 12.24 85.52 6.09 NM 5.02 40.1 NS NS NS1/29/08 12.64 85.12 7.12 NM 8.75 8.2 NS NS NS2/11/08 12.27 85.49 NM NM NM NM NS NS NS3/7/08 11.33 86.43 NM NM NM NM NS NS NS
3/11/08 10.68 87.08 7.12 932 2.97 -77 <0.5 27.1 2.085/1/08 11.41 86.35 6.56 1,810 1.45 1.0 <1.0 28.9 21.6
5/27/08 11.08 86.68 NM NM NM NM NS NS NS6/4/08 12.51 85.25 5.83 NM 2.11 100.1 NS NS NS
6/17/08 12.33 85.43 6.33 NM 2.85 -102.2 NS NS NS7/1/08 12.30 85.46 6.45 NM 0.95 -50.7 NS NS NS7/9/08 NM 85.46 NM NM NM NM NS NS NS
7/14/08 10.7 87.06 6.37 NM 1.68 -31.9 NS NS NS7/30/08 11.88 85.88 6.26 NM 2.68 -40.0 NS NS NS8/12/08 12.31 85.45 6.59 NM 6.81 -31.6 NS NS NS8/20/08 11.91 85.85 NM NM NM NM NS NS NS8/26/08 12.78 84.98 6.65 NM 1.78 -35.6 NS NS NS9/9/08 11.83 85.93 6.48 NM 5.38 -47.2 NS NS NS
9/22/08 12.86 84.90 6.46 NM 6.51 -105.1 NS NS NS10/17/08 12.98 84.78 6.62 NM 0.72 -39.8 NS NS NS10/27/08 12.6 85.16 6.42 NM 2.96 -7.5 NS NS NS11/11/08 12.29 85.47 6.59 NM 1.10 -36.1 NS NS NS11/24/08 12.51 85.25 6.53 1,265 0.31 -25.0 <0.100 22.5 13.611/25/08 12.44 85.32 6.55 NM 2.59 -70.9 NS NS NS12/11/08 12.13 85.63 6.75 NM 1.30 -13.6 NS NS NS3/19/09 11.55 86.21 6.54 NM 2.51 1.3 NS NS NS4/9/09 11.48 86.28 5.56 855 0.67 -6.2 0.78 29.8 25.6
4/23/09 11.89 85.87 6.34 1,479 1.43 86.6 NS NS NS5/5/09 12.37 85.39 6.34 NM 1.32 74.3 NS NS NS
5/19/09 12.21 85.55 6.29 1,864 2.57 37.1 NS NS NS6/11/09 12.76 85.00 6.46 1,617 0.87 -133.7 NS NS NS6/26/09 11.5 86.26 6.30 1,706 1.11 47.6 NS NS NS7/6/09 11.67 86.09 6.44 1,198 0.99 -52.6 NS NS NS
7/22/09 12.00 85.76 6.37 1,577 1.31 -19.7 NS NS NS8/6/09 10.91 86.85 6.62 1,142 1.04 -66.7 NS NS NS
8/24/09 11.34 86.42 6.41 1,660 0.44 -49.0 <1.00 10.8 27.09/10/09 11.83 85.93 6.51 1,846 0.50 5.6 NS NS NS9/23/09 12.29 85.47 6.60 1,314 10.79 -56.6 NS NS NS10/6/09 12.4 85.36 6.13 1,370 0.92 50.1 NS NS NS
10/13/09 12.43 85.33 6.68 1,147 3.90 -3.6 <0.100 2.76 17.410/23/09 12.62 85.14 6.85 453 1.92 -25.1 NS NS NS11/5/09 11.90 85.86 6.60 1,276 0.57 -14.2 NS NS NS
11/17/09 12.09 85.67 6.66 1,544 0.20 -10.1 NS NS NS12/8/09 11.97 85.79 6.55 1,335 1.46 -25.3 NS NS NS2/3/10 12.20 85.56 6.71 NM 12.16 -70.0 NS NS NS
2/11/10 12.43 85.33 6.59 1,299 0.43 -67.0 <0.100 <1.0 15.42/18/10 12.68 85.08 6.60 NM 9.44 25.0 NS NS NS3/3/10 12.11 85.65 6.56 1,532 1.61 -28.8 NS NS NS
3/17/10 11.34 86.42 6.39 752 17.45 58.5 NS NS NS4/15/10 11.52 86.24 6.66 792 1.11 49.7 NS NS NS4/28/10 12.03 85.73 6.60 NM 4.04 12.4 NS NS NS

Monitoring
Well & PVC
Elevation (ft)
Monitoring
Date
Depth to
Water (ft)
Groundwater
Elevation (ft)pH (SU)
Specific
Conductivity
(µS/cm)
Dissolved
Oxygen
(mg/L)
Redox
(mV)
Nitrate
(mg/L)
Sulfate
(mg/L)
Dissolved Iron
(mg/L)
TABLE 2GROUNDWATER GEOCHEMICAL MONITORING DATA
730 East Street, Pittsfield, MassachusettsO'Connell Oil Associates
ECS-3 5/13/10 12.3 85.46 6.48 1,474 4.36 -18.9 NS NS NS(continued) 5/27/10 12.53 85.23 6.66 NM 2.10 12.2 NS NS NS
6/9/10 12.73 85.03 6.40 NM 1.22 -29.0 NS NS NS6/24/10 12.95 84.81 6.69 NM 0.58 -42.2 NS NS NS7/9/10 13.12 84.64 6.14 NM 10.41 35.1 NS NS NS
7/20/10 13.18 84.58 7.01 NM 2.21 -348.4 NS NS NS8/5/10 13.21 84.55 7.15 NM 2.34 -24.0 NS NS NS
8/18/10 13.4 84.36 6.96 NM 1.37 -16.5 NS NS NS9/9/10 13.63 84.13 7.42 815 0.27 -61.0 <0.100 35.5 4.86
9/15/10 13.51 84.25 6.56 NM 1.27 -21.4 NS NS NS9/30/10 13.72 84.04 6.90 NM 6.70 198.9 NS NS NS10/5/10 13.03 84.73 7.00 744 1.32 6.4 NS NS NS
10/21/10 12.76 85.00 6.74 NM 1.06 -60.7 NS NS NS11/5/10 12.68 85.08 7.11 936 11.90 -34.5 NS NS NS
11/19/10 12.58 85.18 6.96 NM 1.73 -60.2 NS NS NS12/9/10 12.40 85.36 6.51 NM 0.81 -51.6 NS NS NS
12/22/10 12.27 85.49 6.54 784 1.64 -53.5 NS NS NS1/7/11 NM NA NM NM NM NM NS NS NS
1/19/11 NM NA NM NM NM NM NS NS NS2/4/11 NM NA NM NM NM NM NS NS NS
2/15/11 NM NA NM NM NM NM NS NS NS3/3/11 NM NA NM NM NM NM NS NS NS
3/28/11 11.15 86.61 7.19 778 7.18 -35.1 0.11 40.7 2.054/7/11 11.23 86.53 7.43 NM 5.01 -88.6 NS NS NS
4/22/11 11.15 86.61 7.10 1,181 0.83 -103.6 NS NS NS5/7/11 11.21 86.55 7.77 1,087 0.88 -34.0 NS NS NS6/2/11 12.11 85.65 6.64 1,364 2.73 -6.3 NS NS NS
6/14/11 12.12 85.64 6.53 NM 0.41 -40.6 NS NS NS7/7/11 11.91 85.85 6.07 NM 1.93 -69.6 NS NS NS
7/25/11 12.50 85.26 6.90 NM 0.88 -97.5 NS NS NS8/15/11 12.85 84.91 7.01 NM 0.28 -109.1 NS NS NS8/26/11 12.29 85.47 7.24 828 1.57 -126.5 NS NS NS9/14/11 10.24 87.52 6.91 730 0.41 -40.6 1.28 43.0 2.1110/6/11 10.80 86.96 7.41 NM 0.89 50.1 NS NS NS
10/20/11 11.42 86.34 6.96 NM 1.31 -98.7 NS NS NS11/3/11 11.60 86.16 7.00 1,044 1.09 -97.2 NS NS NS
11/17/11 11.82 85.94 6.73 NM 2.91 -42.1 NS NS NS12/7/11 11.82 85.94 7.37 722 4.23 251.6 NS NS NS
12/21/11 11.63 86.13 7.26 807 6.88 220.8 NS NS NS1/4/12 11.64 86.12 7.57 792 7.71 132.5 NS NS NS2/1/12 11.62 86.14 7.22 985 9.60 210.7 NS NS NS
2/15/12 12.09 85.67 7.46 742 0.77 -72.1 <0.100 27.2 2.773/1/12 12.28 85.48 7.86 814 10.58 242.8 NS NS NS
3/15/12 11.18 86.58 7.59 710 3.38 263.7 NS NS NS4/5/12 12.40 85.36 6.36 NM 8.27 302.2 NS NS NS
4/19/12 12.71 85.05 7.77 740 4.03 312.2 NS NS NS5/3/12 12.59 85.17 8.00 872 1.74 176.1 NS NS NS
5/17/12 11.95 85.81 7.33 853 5.58 237.0 NS NS NS5/31/12 12.21 85.55 7.22 702 8.79 321.3 NS NS NS6/14/12 12.35 85.41 7.02 681 8.11 301.3 NS NS NS6/26/12 12.70 85.06 7.48 639 1.20 -66.2 NS NS NS7/3/12 12.84 84.92 7.32 NM 0.65 -118.1 NS NS NS
7/19/12 13.20 84.56 7.01 643 1.26 -59.3 NS NS NS8/1/12 13.22 84.54 7.31 795 1.15 -114.7 NS NS NS
8/15/12 NM NM NM NM NM NM NS NS NS8/20/12 13.10 84.66 7.21 707 1.48 -80.3 3.80 42.2 1.048/30/12 13.33 84.43 NM NM NM NM NS NS NS
ECS-4** 11/8/99 NA NA NA NA NA NA NS NS NS97.06 12/19/02 NA NA NA NA NA NA NS NS NS96.75 9/8/05 11.94 84.81 NM NM NM NM NS NS NS
1/25/06 NG NA NM NM NM NM NS NS NS4/10/06 11.51 85.24 NM NM NM NM NS NS NS7/20/06 11.96 84.79 5.67 1,013 246 932 NS NS NS9/15/06 DRY NA NM NM NM NM NS NS NS9/21/06 DRY NA NM NM NM NM NS NS NS10/6/06 12.36 84.39 NM NM NM NM NS NS NS
10/10/06 12.43 84.32 NS NS NS NS NS NS NS10/23/06 11.75 85.00 5.94 NM 2.51 NM NS NS NS11/7/06 11.72 85.03 6.54 NM 10.47 -42.90 NS NS NS
11/20/06 11.08 85.67 7.01 NM 10.25 166.30 NS NS NS

Monitoring
Well & PVC
Elevation (ft)
Monitoring
Date
Depth to
Water (ft)
Groundwater
Elevation (ft)pH (SU)
Specific
Conductivity
(µS/cm)
Dissolved
Oxygen
(mg/L)
Redox
(mV)
Nitrate
(mg/L)
Sulfate
(mg/L)
Dissolved Iron
(mg/L)
TABLE 2GROUNDWATER GEOCHEMICAL MONITORING DATA
730 East Street, Pittsfield, MassachusettsO'Connell Oil Associates
ECS-4 12/4/06 DRY NA NM NM NM NM NS NS NS(continued) 12/18/06 DRY NA NM NM NM NM NS NS NS
1/2/07 11.93 84.82 6.78 NM 10.48 -36.50 NS NS NS1/15/07 11.41 85.34 6.95 NM 10.82 -86.90 NS NS NS1/25/07 11.55 85.20 NS NM NS NS NS NS NS1/29/07 11.72 85.03 6.95 NM 12.86 -35.2 NS NS NS2/12/07 12.23 84.52 NM NM NM NM NS NS NS2/26/07 NG NA NM NM NM NM NS NS NS3/12/07 12.42 84.33 NM NM NM NM NS NS NS3/26/07 11.39 85.36 5.87 NM 13.76 179.60 NS NS NS4/10/07 10.46 86.29 6.75 NM 12.17 64.50 NS NS NS4/24/07 9.88 86.87 5.83 891 4.95 202 NS NS NS5/7/07 11.79 84.96 6.42 NM 5.34 136 NS NS NS
5/24/07 11.65 85.10 6.23 NM 4.21 150 NS NS NS6/4/07 11.63 85.12 5.72 NM 9.72 38 NS NS NS
6/18/07 11.81 84.94 6.53 NM 12.81 123 NS NS NS7/3/07 12.25 84.50 7.65 NM 7.17 87 NS NS NS
7/16/07 12.31 84.44 7.41 NM 7.23 83 NS NS NS8/1/07 12.47 84.28 6.58 NM 20.52 101 NS NS NS
8/13/07 12.53 84.22 6.40 NM 6.61 265 NS NS NS8/27/07 12.61 84.14 6.59 NM 9.21 -89 NS NS NS9/10/07 DRY 96.75 NM NM NM NM NS NS NS9/25/07 DRY 96.75 NM NM NM NM NS NS NS10/4/07 DRY 96.75 NM NM NM NM NS NS NS10/9/07 DRY 96.75 NM NM NM NM NS NS NS
10/22/07 DRY 96.75 NM NM NM NM NS NS NS11/5/07 12.62 84.13 NM NM NM NM NS NS NS
11/19/07 12.31 84.44 NM NM NM NM NS NS NS12/3/07 12.31 84.44 NM NM NM NM NS NS NS
12/17/07 NG NG NM NM NM NM NS NS NS1/2/08 DRY 96.75 NM NM NM NM NS NS NS
1/14/08 DRY 96.75 NM NM NM NM NS NS NS1/29/08 DRY 96.75 NM NM NM NM NS NS NS2/11/08 DRY 96.75 NM NM NM NM NS NS NS3/7/08 10.55 86.20 6.72 827 4.20 72.8 NS NS NS
3/11/08 9.93 86.82 6.78 887 9.81 92 NS NS NS5/1/08 10.71 86.04 6.64 984 1.21 46 NS NS NS
5/27/08 11.32 85.43 NM NM NM NM NS NS NS6/4/08 11.65 85.10 6.03 NM 1.16 12.3 NS NS NS
6/17/08 11.88 84.87 6.61 NM 1.96 88.4 NS NS NS7/1/08 11.73 85.02 6.63 NM 2.12 99.7 NS NS NS7/9/08 NM 85.02 NM NM NM NM NS NS NS
7/14/08 12.08 84.67 6.45 NM 1.93 84 NS NS NS7/30/08 11.16 85.59 6.20 NM 4.24 112 NS NS NS8/12/08 11.65 85.10 6.55 NM 5.18 66.6 NS NS NS8/20/08 11.38 85.37 NM NM NM NM NS NS NS8/26/08 11.97 84.78 6.58 NM 3.12 -21 NS NS NS9/9/08 11.13 85.62 6.51 NM 4.37 47.6 NS NS NS
9/22/08 12.04 84.71 6.41 NM 4.65 208.8 NS NS NS10/17/08 12.31 84.44 6.46 NM 3.60 59.8 NS NS NS10/27/08 11.94 84.81 6.61 NM 4.80 30.2 NS NS NS11/11/08 11.54 85.21 6.51 NM 0.90 26.9 NS NS NS11/24/08 11.77 84.98 6.62 918 0.71 -12.0 NS NS NS11/25/08 11.68 85.07 6.48 NM 1.96 30.5 NS NS NS12/11/08 12.6 84.15 6.71 NM 1.38 134.3 NS NS NS12/23/08 10.7 86.05 6.66 NM 0.40 75.7 NS NS NS
3/4/09 11.62 85.13 6.51 NM 5.62 173.9 NS NS NS3/19/09 10.82 85.93 6.81 NM 8.00 36.0 NS NS NS4/9/09 10.72 86.03 6.21 821 2.58 288.4 NS NS NS
4/23/09 10.8 85.95 6.79 893 1.86 72.2 NS NS NS5/5/09 11.9 84.85 6.58 NM 0.88 217.0 NS NS NS
5/19/09 11.7 85.05 6.50 881 1.83 117.8 NS NS NS6/26/09 10.74 86.01 6.56 1011 1.91 176.3 NS NS NS7/6/09 10.96 85.79 6.61 816 1.50 107.4 NS NS NS
7/22/09 11.47 85.28 6.47 787 1.22 143.5 NS NS NS8/6/09 10.19 86.56 6.39 717 4.55 204.8 NS NS NS
9/10/09 11.11 85.64 6.69 727 1.27 75.6 NS NS NS9/23/09 11.55 85.20 6.58 797 6.08 -47.0 NS NS NS10/6/09 11.26 85.49 6.05 767 3.46 63.7 NS NS NS
10/13/09 11.69 85.06 6.66 799 3.13 10.6 <0.100 2.76 17.410/23/09 11.9 84.85 6.47 812 1.63 2.3 NS NS NS

Monitoring
Well & PVC
Elevation (ft)
Monitoring
Date
Depth to
Water (ft)
Groundwater
Elevation (ft)pH (SU)
Specific
Conductivity
(µS/cm)
Dissolved
Oxygen
(mg/L)
Redox
(mV)
Nitrate
(mg/L)
Sulfate
(mg/L)
Dissolved Iron
(mg/L)
TABLE 2GROUNDWATER GEOCHEMICAL MONITORING DATA
730 East Street, Pittsfield, MassachusettsO'Connell Oil Associates
ECS-4 11/5/09 11.12 85.63 6.62 812 1.31 65.5 NS NS NS(continued) 11/17/09 11.09 85.66 6.92 841 1.86 85.3 NS NS NS
12/8/09 11.24 85.51 7.08 861 6.05 3.4 NS NS NS12/23/09 11.47 85.28 6.88 703 2.11 49.8 NS NS NS
1/8/10 11.73 85.02 6.89 798 3.31 84.8 NS NS NS1/20/10 12.00 84.75 6.83 720 5.06 67.5 NS NS NS2/18/10 11.90 84.85 7.00 NM 4.95 12.1 NS NS NS3/3/10 11.91 84.84 6.72 1014 4.01 1.9 NS NS NS
3/17/10 10.57 86.18 NM NM NM NM NS NS NS4/15/10 10.54 86.21 6.70 690 1.35 54.0 NS NS NS4/28/10 12.10 84.65 6.53 NM 2.45 8.4 NS NS NS5/13/10 11.57 85.18 6.50 819 6.01 61.8 NS NS NS5/27/10 11.80 84.95 6.57 NM 2.17 26.4 NS NS NS6/9/10 11.99 84.76 6.31 NM 1.41 5.6 NS NS NS
6/24/10 12.10 84.65 6.52 NM 1.87 20.1 NS NS NS7/9/10 12.40 84.35 5.02 NM 7.08 337.3 NS NS NS
7/20/10 12.44 84.31 6.88 NM 8.70 -246.0 NS NS NS8/5/10 12.48 84.27 7.04 NM 1.20 41.8 NS NS NS
8/18/10 12.66 84.09 6.48 NM 8.08 39.9 NS NS NS9/9/10 DRY NA NM NM NM NM NS NS NS
9/15/10 DRY NA NM NM NM NM NS NS NS9/30/10 DRY NA NM NM NM NM NS NS NS10/5/10 12.29 84.46 6.66 80 5.21 152.9 NS NS NS
10/21/10 12.00 84.75 6.83 NM 3.24 82.4 NS NS NS11/5/10 11.94 84.81 6.90 806 11.43 13.8 NS NS NS
11/19/10 11.35 85.40 6.87 NM 1.86 243.6 NS NS NS12/9/10 NM NM NM NM NM NM NS NS NS
12/22/10 11.52 85.23 6.17 843 4.81 24.7 NS NS NS1/7/11 11.92 84.83 6.59 NM 11.01 5.8 NS NS NS
1/19/11 12.22 84.53 6.81 NM 6.82 -9.0 NS NS NS2/4/11 NM NA NM NM NM NM NS NS NS
2/15/11 NM NA NM NM NM NM NS NS NS3/3/11 NM NA NM NM NM NM NS NS NS
3/28/11 10.38 86.37 6.76 0.826 5.81 136.1 NS NS NS4/7/11 10.48 86.27 6.91 NM 6.36 -39.1 NS NS NS
4/22/11 10.40 86.35 6.70 0.863 0.48 -12.7 NS NS NS5/7/11 10.50 86.25 7.95 0.902 1.70 2.2 NS NS NS6/2/11 11.38 85.37 6.66 0.869 2.70 18.8 NS NS NS
6/14/11 11.39 85.36 6.63 NM 3.11 107.1 NS NS NS7/7/11 11.17 85.58 6.03 NM 1.70 11.9 NS NS NS
7/25/11 11.75 85.00 6.65 NM 5.31 -8.7 NS NS NS8/15/11 11.99 84.76 6.64 NM 1.62 -29.5 NS NS NS8/26/11 11.43 85.32 6.69 0.839 2.53 36.5 NS NS NS9/14/11 9.41 87.34 NM NM NM NM NS NS NS10/6/11 9.96 86.79 6.76 NM 2.97 138.6 NS NS NS
10/20/11 10.56 86.19 6.72 NM 1.26 60.1 NS NS NS11/3/11 10.73 86.02 6.92 940 2.19 -51.0 NS NS NS
11/17/11 10.96 85.79 6.93 NM 1.14 62.3 NS NS NS12/7/11 10.94 85.81 6.98 794 3.42 241.3 NS NS NS
12/21/11 10.77 85.98 7.22 763 4.35 194.6 NS NS NS1/17/12 11.17 85.58 7.36 764 7.33 157.5 NS NS NS2/1/12 10.76 85.99 7.31 924 8.97 248.3 NS NS NS
2/15/12 11.22 85.53 NM NM NM NM NS NS NS3/1/12 11.42 85.33 7.58 795 9.47 313.6 NS NS NS
3/15/12 11.00 85.75 7.37 749 6.47 272.2 NS NS NS4/5/12 11.54 85.21 6.81 NM 7.34 284.9 NS NS NS
4/19/12 11.84 84.91 6.58 809 6.75 290.8 NS NS NS5/3/12 11.72 85.03 7.34 771 2.10 165.1 NS NS NS
5/17/12 11.08 85.67 6.65 794 5.28 265.7 NS NS NS5/31/12 11.34 85.41 6.15 851 6.15 367.0 NS NS NS6/14/12 11.48 85.27 6.12 849 6.12 285.9 NS NS NS6/26/12 11.83 84.92 6.93 5 3.28 -12.2 NS NS NS7/3/12 12.00 84.75 6.63 NM 2.32 9.3 NS NS NS
7/19/12 12.35 84.40 6.77 753 1.93 -9.8 NS NS NS8/1/12 12.35 84.40 6.73 963 6.73 -80.1 NS NS NS
8/15/12 NM NM NM NM NM NM NS NS NS8/20/12 12.24 84.51 NM NM NM NM NS NS NS8/30/12 12.47 84.28 NM NM NM NM NS NS NS

Monitoring
Well & PVC
Elevation (ft)
Monitoring
Date
Depth to
Water (ft)
Groundwater
Elevation (ft)pH (SU)
Specific
Conductivity
(µS/cm)
Dissolved
Oxygen
(mg/L)
Redox
(mV)
Nitrate
(mg/L)
Sulfate
(mg/L)
Dissolved Iron
(mg/L)
TABLE 2GROUNDWATER GEOCHEMICAL MONITORING DATA
730 East Street, Pittsfield, MassachusettsO'Connell Oil Associates
ECS-5 11/8/99 NA NA NA NA NA NA NS NS NS97.73 12/19/02 NA NA NA NA NA NA NS NS NS97.56 9/8/05 12.44 85.12 5.12 893 1.47 484 NS NS NS
1/25/06 10.22 87.34 7.31 830 1.67 6.0 NS NS NS4/11/06 11.15 86.41 6.81 910 2.61 18.0 NS NS NS7/20/06 12.48 85.08 4.93 803 2.63 559 NS NS NS
10/10/06 12.98 84.58 NM NM NM NM NS NS NS1/25/07 12.14 85.42 NM NM NM NM NS NS NS2/26/07 12.11 85.45 8.06 NM 2.21 193.8 NS NS NS4/24/07 10.43 87.13 NA NA NA NA NS NS NS10/4/07 13.57 82.77 7.30 813 3.98 82.0 NS NS NS3/7/08 11.20 85.14 6.94 726 3.34 90.6 NS NS NS
3/11/08 10.54 85.80 7.10 834 1.52 105 NS NS NS5/1/08 11.27 85.07 NA NA NA NA NS NS NS
11/24/08 12.38 83.96 NA NA NA NA NS NS NS10/21/10 12.58 83.76 6.39 818 1.45 39.9 NS NS NS12/22/10 12.12 84.22 6.82 822 2.18 -24.8 NS NS NS3/28/11 11.04 85.30 7.49 751 1.84 -9.1 NS NS NS9/14/11 10.17 86.17 7.49 709 1.32 -53.6 2.40 27.4 0.2332/15/12 12.00 84.34 6.25 715 2.77 -30.7 2.52 24.1 0.07778/20/12 13.03 83.31 7.41 716 3.10 -35.3 0.350 31.9 0.0326
ECS-6 2/13/03 NA NA NA NA NA NA NS NS NS96.58 9/8/05 11.34 85.00 4.97 972 0.43 258 NS NS NS96.34 11/1/05 9.57 86.77 6.67 893 1.22 26.8 NS NS NS
1/25/06 9.10 87.24 6.90 907 0.60 -99.0 NS NS NS4/10/06 11.05 85.29 7.15 1,146 0.47 64.0 NS NS NS7/20/06 11.40 84.94 4.11 907 0.17 561 NS NS NS
10/10/06 11.89 84.45 NM 657 0.84 86.4 NS NS NS1/25/07 10.99 85.35 7.12 802 1.91 49.0 NS NS NS4/24/07 9.35 86.99 6.71 885 0.26 -10.4 NS NS NS10/4/07 12.46 83.88 6.87 947 1.20 -4.0 NS NS NS3/7/08 10.05 86.29 6.16 1,721 1.18 68.4 NS NS NS
3/11/08 10.44 85.90 6.04 1,408 0.35 83.0 22.8 252 30.65/1/08 10.16 86.18 6.57 880 0.72 24.0 <2.0 100 5.70
11/24/08 11.26 85.08 6.85 398 0.12 -40.0 0.14 38.5 5.292/18/09 11.25 85.09 7.34 93 0.53 -24.0 0.13 24.8 2.128/24/09 10.06 86.28 7.14 293 0.39 -38.0 0.26 29.8 1.152/11/10 11.18 85.16 6.28 205 0.21 19.0 <0.100 22.8 2.189/9/10 12.36 83.98 7.41 1,037 0.43 -4.0 <0.100 29.2 0.132
3/28/11 9.91 86.43 6.61 1,301 0.62 7.9 0.970 48.0 2.859/14/11 9.04 87.30 6.67 819 1.06 19.6 0.350 28.4 0.5342/15/12 10.82 85.52 5.61 835 0.68 -14.9 <0.200 23.4 2.068/20/12 11.85 84.49 6.86 881 0.32 -61.1 0.242 24.7 3.81
ECS-7 2/13/03 NA NA NA NA NA NA NS NS NS95.97 9/8/05 9.75 85.79 5.55 1,398 1.20 243 NS NS NS95.54 1/25/06 9.05 86.49 6.85 925 0.35 16.0 NS NS NS
4/10/06 9.90 85.64 6.44 1,490 0.79 180 NS NS NS7/20/06 9.78 85.76 NM NM NM NM NS NS NS
10/10/06 9.96 85.58 NM NM NM NM NS NS NS1/25/07 9.70 85.84 NM NM NM NM NS NS NS4/24/07 9.47 86.07 NM NM NM NM NS NS NS10/4/07 10.41 85.13 6.58 1,089 0.39 9 NS NS NS3/7/08 14.79 80.75 6.63 962 2.62 60.2 NS NS NS5/1/08 9.62 85.92 NM NM NM NM NS NS NS
11/24/08 10.79 84.75 NM NM NM NM NS NS NS9/14/11 8.71 86.83 NM NM NM NM NS NS NS2/15/12 9.17 86.37 NM NM NM NM NS NS NS8/30/12 9.26 86.28 6.49 1,564 0.44 -70.5 NS NS NS

Monitoring
Well & PVC
Elevation (ft)
Monitoring
Date
Depth to
Water (ft)
Groundwater
Elevation (ft)pH (SU)
Specific
Conductivity
(µS/cm)
Dissolved
Oxygen
(mg/L)
Redox
(mV)
Nitrate
(mg/L)
Sulfate
(mg/L)
Dissolved Iron
(mg/L)
TABLE 2GROUNDWATER GEOCHEMICAL MONITORING DATA
730 East Street, Pittsfield, MassachusettsO'Connell Oil Associates
ECS-8** 2/13/03 NA NA NA NA NA NA NS NS NS95.72 9/8/05 10.35 85.08 4.74 1,534 1.20 469 <0.100 52.6 18.395.43 1/25/06 NG NA NM NM NM NM NS NS NS
4/11/06 9.98 85.45 6.51 193 0.16 4.0 <0.100 59.2 1.647/20/06 10.28 85.15 NM NM NM NM NS NS NS9/15/06 11.29 84.14 6.62 NM 10.17 -2.8 NS NS NS9/21/06 10.31 85.12 6.75 NM 7.85 123 NS NS NS10/6/06 11.75 83.68 7.63 NM 1.23 27.0 NS NS NS
10/10/06 10.81 84.62 NM NM NM NM NS NS NS10/23/06 NG NA NM NM NM NM NS NS NS11/7/06 10.09 85.34 6.33 NM 7.43 -34.7 NS NS NS
11/20/06 9.47 85.96 6.82 NM 3.53 78.6 NS NS NS12/4/06 9.92 85.51 7.92 NM 10.70 179.5 NS NS NS
12/18/06 11.42 84.01 6.18 NM 7.30 27.2 NS NS NS1/2/07 10.33 85.10 6.69 NM 7.64 -98.5 NS NS NS
1/15/07 9.87 85.56 6.82 NM 7.33 -109.6 NS NS NS1/25/07 9.91 85.52 NM NM NM NM NS NS NS1/29/07 10.08 85.35 7.13 NM 13.11 -79.2 NS NS NS2/12/07 11.62 83.81 6.93 NM 10.22 14.4 NS NS NS2/26/07 10.35 85.08 7.31 NM 6.41 246.7 NS NS NS3/12/07 10.22 85.21 7.14 NM 8.63 62.7 NS NS NS3/26/07 9.84 85.59 7.15 NM 9.40 39.7 NS NS NS4/10/07 9.16 86.27 7.06 NM 11.61 60.4 NS NS NS4/24/07 8.19 87.24 6.40 1,075 8.84 222.6 NS NS NS5/7/07 9.00 86.43 5.01 NM 11.69 90.8 NS NS NS
5/24/07 9.83 85.60 5.47 NM 10.14 108.2 NS NS NS6/4/07 9.08 86.35 5.13 NM 8.03 43.6 NS NS NS
6/18/07 10.18 85.25 6.28 NM 13.65 -14.7 NS NS NS7/3/07 10.62 84.81 7.36 NM 7.44 90.8 NS NS NS
7/16/07 11.89 83.54 7.14 NM 7.54 104.7 NS NS NS8/1/07 10.83 84.60 6.45 NM 7.61 71.8 NS NS NS
8/13/07 10.92 84.51 5.71 NM 3.10 -283.4 NS NS NS8/27/07 11.17 84.26 6.27 NM 7.42 -13.8 NS NS NS9/10/07 11.26 84.18 7.30 NM 9.71 -14.5 NS NS NS9/25/07 11.35 84.08 7.28 NM 7.10 -17.1 NS NS NS10/4/07 11.45 83.98 6.41 1,580 0.54 96.0 NS NS NS10/9/07 11.48 83.95 6.16 NM 2.85 -301.2 NS NS NS
10/22/07 11.22 84.21 7.04 NM 4.01 -22.5 NS NS NS11/5/07 11.05 84.38 7.08 NM 3.01 39.9 NS NS NS
11/19/07 10.79 84.64 7.03 NM 3.85 -25.2 NS NS NS12/3/07 9.74 85.69 7.01 NM 2.98 38.4 NS NS NS
12/17/07 NG NG NM NM NM NM NS NS NS1/2/08 NG NG NM NM NM NM NS NS NS
1/14/08 NG NG NM NM NM NM NS NS NS1/29/08 10.31 85.12 6.42 NM 4.51 73.0 NS NS NS2/11/08 NG NG NM NM NM NM NS NS NS3/11/08 NG NG NM NM NM NM NS NS NS3/24/08 8.56 86.87 6.33 1078 2.37 46 3.34 70.6 <0.03005/1/08 9.02 86.41 6.64 1451 0.50 27 NS NS NS
5/27/08 9.59 85.84 NM NM NM NM NS NS NS6/4/08 10.07 85.36 6.00 NM 1.06 -5 NS NS NS
6/17/08 9.82 85.61 6.46 NM 1.87 49.5 NS NS NS7/1/08 9.72 85.71 6.49 NM 1.43 5.7 NS NS NS7/9/08 NM 85.71 NM NM NM NM NS NS NS
7/14/08 10.23 85.20 6.32 NM 1.84 50.1 NS NS NS7/30/08 9.51 85.92 6.00 NM 2.77 57 NS NS NS8/12/08 9.81 85.62 6.30 NM 2.02 15.6 NS NS NS8/20/08 9.47 85.96 NM NM NM NM NS NS NS8/26/08 10.02 85.41 6.32 NM 2.00 9.4 NS NS NS9/9/08 8.89 86.54 6.22 NM 1.95 23.7 NS NS NS
9/22/08 10.42 85.01 6.37 NM 2.04 11.7 NS NS NS10/17/08 10.65 84.78 6.59 NM 1.34 13.2 NS NS NS

Monitoring
Well & PVC
Elevation (ft)
Monitoring
Date
Depth to
Water (ft)
Groundwater
Elevation (ft)pH (SU)
Specific
Conductivity
(µS/cm)
Dissolved
Oxygen
(mg/L)
Redox
(mV)
Nitrate
(mg/L)
Sulfate
(mg/L)
Dissolved Iron
(mg/L)
TABLE 2GROUNDWATER GEOCHEMICAL MONITORING DATA
730 East Street, Pittsfield, MassachusettsO'Connell Oil Associates
ECS-8 10/27/08 10.30 85.13 6.36 NM 1.14 11.7 NS NS NS(continued) 11/11/08 10.99 84.44 6.21 NM 0.92 26.0 NS NS NS
11/24/08 10.12 85.31 6.60 1640 0.36 7.0 NS NS NS11/25/08 11.12 84.31 6.39 NM 3.72 -26.6 NS NS NS12/11/08 9.60 85.83 6.56 NM 2.44 9.0 NS NS NS12/23/08 9.04 86.39 6.53 NM 2.26 13.9 NS NS NS3/19/09 9.00 86.43 6.49 NM 1.91 32.9 NS NS NS4/9/09 9.02 86.41 5.68 NM 0.67 205.9 NS NS NS5/5/09 9.80 85.63 6.41 NM 1.50 152.6 NS NS NS
5/19/09 9.69 85.74 6.37 NM 1.77 96.2 NS NS NS6/11/09 10.30 85.13 6.34 1440 1.07 28.6 NS NS NS6/26/09 11.27 84.16 6.41 1568 1.43 90.1 NS NS NS7/6/09 9.30 86.13 6.24 816 0.46 82.6 NS NS NS
7/22/09 9.47 85.96 6.35 1,407 2.43 71.4 NS NS NS8/6/09 8.51 86.92 6.41 1,340 1.70 86.8 NS NS NS
8/24/09 8.98 86.45 6.46 1,700 0.37 13.0 NS NS NS9/10/09 9.48 85.95 6.53 1,327 0.95 62.9 NS NS NS9/23/09 9.93 85.50 6.54 1,457 10.06 26.4 NS NS NS10/6/09 9.87 85.56 6.01 683 0.49 73.8 NS NS NS
10/13/09 10.05 85.38 6.39 1,199 3.66 59.0 NS NS NS10/23/09 10.10 85.33 6.43 1,756 1.79 1.4 NS NS NS11/5/09 9.26 86.17 6.39 1,452 0.70 47.8 NS NS NS
11/17/09 9.53 85.90 6.55 1,403 0.25 70.4 NS NS NS12/8/09 12.28 83.15 6.81 1,352 2.61 -5.9 NS NS NS3/17/10 8.76 86.67 6.48 2,322 6.49 114.0 NS NS NS4/15/10 8.80 86.63 6.74 994 4.21 99.4 NS NS NS5/13/10 9.84 85.59 6.24 1,589 6.37 50.4 NS NS NS5/27/10 10.10 85.33 6.51 NM 5.60 9.6 NS NS NS6/9/10 9.78 85.65 6.16 NM 1.63 -14.0 NS NS NS
6/24/10 10.20 85.23 6.33 NM 0.73 39.2 NS NS NS7/9/10 10.71 84.72 5.15 NM 6.10 395.2 NS NS NS
7/20/10 10.77 84.66 6.62 NM 0.92 -117.0 NS NS NS8/5/10 10.79 84.64 6.67 NM 0.69 10.3 NS NS NS
8/18/10 11.05 84.38 6.23 NM 2.30 117.6 NS NS NS9/9/10 11.29 84.14 6.56 774 0.26 53.0 NS NS NS
9/15/10 11.38 84.05 6.20 NM 1.81 106.1 NS NS NS9/30/10 NM NM NM NM NM NM NS NS NS10/5/10 NM NM NM NM NM NM NS NS NS
10/21/10 NM NM NM NM NM NM NS NS NS11/5/10 NM NM NM NM NM NM NS NS NS
11/19/10 9.30 86.13 6.84 NM 1.31 204.9 NS NS NS12/9/10 9.81 85.62 6.04 NM 0.75 -20.8 NS NS NS
12/22/10 NM NM NM NM NM NM NS NS NS1/7/11 10.27 85.16 6.30 NM 7.56 -36.9 NS NS NS
1/19/11 NM NM NM NM NM NM NS NS NS2/4/11 NM NA NM NM NM NM NS NS NS
2/15/11 NM NA NM NM NM NM NS NS NS3/3/11 NM NA NM NM NM NM NS NS NS
3/28/11 8.80 86.63 6.63 1.827 1.17 33.5 NS NS NS4/7/11 8.86 86.57 6.96 NM 4.21 -35.8 NS NS NS
4/22/11 8.60 86.83 6.47 1.816 0.26 -13.4 NS NS NS5/7/11 8.65 86.78 7.70 1.768 0.95 -3.2 NS NS NS6/2/11 9.51 85.92 6.48 1.690 3.00 22.9 NS NS NS
6/14/11 NM NM NM NM NM NM NS NS NS7/7/11 9.33 86.10 6.00 NM 1.32 15.3 NS NS NS
7/25/11 9.87 85.56 6.50 NM 1.58 -10.0 NS NS NS8/15/11 NM NM NM NM NM NM NS NS NS8/26/11 9.80 85.63 6.64 1.426 0.35 -59.6 NS NS NS9/14/11 7.89 87.54 NM NM NM NM NS NS NS10/6/11 8.35 87.08 6.75 NM 1.20 39.3 NS NS NS
10/20/11 NM NM NM NM NM NM NS NS NS11/3/11 NM NM NM NM NM NM NS NS NS

Monitoring
Well & PVC
Elevation (ft)
Monitoring
Date
Depth to
Water (ft)
Groundwater
Elevation (ft)pH (SU)
Specific
Conductivity
(µS/cm)
Dissolved
Oxygen
(mg/L)
Redox
(mV)
Nitrate
(mg/L)
Sulfate
(mg/L)
Dissolved Iron
(mg/L)
TABLE 2GROUNDWATER GEOCHEMICAL MONITORING DATA
730 East Street, Pittsfield, MassachusettsO'Connell Oil Associates
ECS-8 11/17/11 NM NM NM NM NM NM NS NS NS(continued) 12/7/11 NM NM NM NM NM NM NS NS NS
12/21/11 9.06 86.37 6.74 1,460 4.23 228.4 NS NS NS1/4/12 9.06 86.37 7.07 1,360 7.46 193.6 NS NS NS2/1/12 NM NM NM NM NM NM NS NS NS
2/15/12 9.56 85.87 NM NM NM NM NS NS NS3/1/12 NM NM NM NM NM NM NS NS NS
3/15/12 9.08 86.35 6.96 1,535 2.01 290.3 NS NS NS4/5/12 9.74 85.69 6.54 NM 3.22 264.6 NS NS NS
4/19/12 10.05 85.38 6.81 1,708 5.41 329.2 NS NS NS5/3/12 NM NM NM NM NM NM NS NS NS
5/17/12 9.25 86.18 6.64 1,551 3.38 257.0 NS NS NS5/31/12 7.53 87.90 6.35 1,758 3.44 320.2 NS NS NS6/14/12 9.67 85.76 6.40 1,520 5.19 322.4 NS NS NS6/26/12 10.01 85.42 6.94 1,236 1.70 -2.6 NS NS NS7/3/12 10.19 85.24 6.63 NM 2.55 -22.7 NS NS NS
7/19/12 10.58 84.85 6.60 1,474 0.74 -21.4 NS NS NS8/1/12 10.60 84.83 6.49 1,862 0.62 -20.2 NS NS NS
8/15/12 NM NM NM NM NM NM NS NS NS8/20/12 10.49 84.94 NM NM NM NM NS NS NS8/30/12 10.77 84.66 6.34 2050 0.34 -25.5 NS NS NS
ECS-9* 2/13/03 NA NA NA NA NA NA NS NS NS95.22 9/19/05 10.91 84.08 6.22 1,047 4.69 -46.8 <0.100 <1.0 11.594.99 1/25/06 8.38 86.61 6.32 944 0.80 -89.0 <0.100 7.27 9.75
4/11/06 10.33 84.66 6.52 157 0.60 -13.0 <0.100 <1.0 0.9457/20/06 10.72 84.27 3.02 1,136 0.30 445 <0.100 <1.0 10.8
10/10/06 11.12 83.87 NA NA NA NA NS NS NS1/25/07 10.31 84.68 6.64 995 1.42 -2 <0.5 <5.0 10.64/24/07 8.57 86.42 6.40 1,609 0.58 -2.6 NS NS NS10/4/07 11.79 83.20 6.69 1,478 1.11 -94.0 <0.100 8.05 47.13/7/08 9.22 85.77 6.57 1,195 2.80 36.5 NS NS NS
3/11/08 8.63 86.36 6.75 1,217 0.32 12.0 <0.100 36.2 6.765/1/08 9.47 85.52 6.77 1,730 0.52 46.0 <1.0 61.3 0.40
11/24/08 10.6 84.39 6.81 1,146 0.21 -31.0 <0.100 <1.0 10.82/18/09 10.62 84.37 6.77 1,060 0.46 -29.0 <0.100 1.05 8.648/24/09 9.33 85.66 6.68 1,560 0.39 -8.0 <0.100 26.20 11.62/11/10 10.49 84.50 6.43 1,600 0.40 -27.0 <0.100 5.32 9.459/9/10 11.64 83.35 6.76 744 0.29 -16.0 <0.100 <1.0 10.8
3/28/11 9.28 85.71 7.06 1,147 6.39 31.5 0.100 9.72 0.7849/14/11 8.41 86.58 6.67 1,622 0.30 83.2 0.280 58.8 0.2242/15/12 10.23 84.76 7.16 1,542 1.64 -9.6 0.250 6.75 3.468/20/12 NM NM NM NM NM NM NS NS NS8/30/12 11.35 83.64 6.27 1,155 0.40 -24.1 <0.100 1.52 15.30
ECS-10 2/13/03 NA NA NA NA NA NA NS NS NS95.90 9/8/05 9.59 86.16 4.40 1,624 0.93 601 NS NS NS95.75 1/25/06 8.57 87.18 6.96 1,850 0.37 23.0 NS NS NS
4/10/06 9.52 86.23 6.60 234 0.35 180 NS NS NS7/20/06 9.42 86.33 NM NM NM NM NS NS NS
10/10/06 9.64 86.11 NM NM NM NM NS NS NS1/25/07 9.31 86.44 NM NM NM NM NS NS NS4/24/07 8.53 87.22 NM NM NM NM NS NS NS10/4/07 10.18 85.57 6.60 1,570 0.36 15.0 NS NS NS3/7/08 8.01 87.74 6.70 1,473 0.46 62.2 NS NS NS
3/11/08 5.74 90.01 6.58 930 0.51 82.0 3.84 27.2 1.205/1/08 8.87 86.88 6.93 1,650 0.57 47.0 13.3 45.2 <0.0300
11/24/08 9.4 86.35 6.74 1,800 0.28 -30.0 <0.100 23.0 7.982/18/09 9.62 86.13 6.85 1,670 0.59 42.0 <0.100 28.2 1.908/24/09 8.75 87.00 6.20 314 0.37 56.0 0.12 2.67 3.002/11/10 9.34 86.41 6.22 1,660 0.49 37.0 <0.100 8.79 1.659/9/10 9.55 86.20 6.77 792 0.29 -39.0 <0.100 2.18 15.6
3/28/11 8.70 87.05 6.78 664 0.59 15.1 0.420 6.41 1.489/14/11 8.15 87.60 NM NM NM NM NS NS NS2/15/12 NM NM NM NM NM NM NS NS NS8/20/12 8.99 86.76 NM NM NM NM NS NS NS8/30/12 9.12 86.63 6.65 1,179 0.38 -87.2 NS NS NS

Monitoring
Well & PVC
Elevation (ft)
Monitoring
Date
Depth to
Water (ft)
Groundwater
Elevation (ft)pH (SU)
Specific
Conductivity
(µS/cm)
Dissolved
Oxygen
(mg/L)
Redox
(mV)
Nitrate
(mg/L)
Sulfate
(mg/L)
Dissolved Iron
(mg/L)
TABLE 2GROUNDWATER GEOCHEMICAL MONITORING DATA
730 East Street, Pittsfield, MassachusettsO'Connell Oil Associates
ECS-11** 1/25/06 9.28 87.42 6.42 1,033 0.70 -74.0 <0.100 25.2 10.496.70 4/10/06 10.94 85.76 6.92 1,103 0.67 -5.0 NS NS NS
7/20/06 11.31 85.39 4.75 1,024 0.25 503 NS NS NS9/15/06 12.31 84.39 7.00 NM 8.92 -49.9 NS NS NS9/21/06 11.89 84.81 6.95 NM 10.01 266 NS NS NS10/6/06 11.74 84.96 8.10 NM 2.48 -41.5 NS NS NS
10/10/06 11.81 84.89 NM 649 0.63 71.4 NS NS NS10/23/06 11.20 85.50 6.12 NM 1.60 NM NS NS NS11/7/06 10.74 85.96 6.76 NM 10.43 -51.4 NS NS NS
11/20/06 10.49 86.21 7.56 NM 8.52 -11.5 NS NS NS12/4/06 10.93 85.77 7.46 NM 12.59 232.5 NS NS NS
12/18/06 11.40 85.30 6.44 NM 8.36 -8.5 NS NS NS1/2/07 11.34 85.36 7.69 NM 8.39 -127.5 NS NS NS
1/15/07 10.89 85.81 7.34 NM 8.16 -133.4 NS NS NS1/25/07 10.98 85.72 7.03 849 1.58 4.0 NS NS NS1/29/07 11.11 85.59 7.43 NM 8.73 -105.0 NS NS NS2/12/07 11.54 85.16 7.22 NM 10.69 -48.6 NS NS NS2/26/07 11.14 85.56 7.14 NM 4.89 NM NS NS NS3/12/07 11.91 84.79 7.07 NM 9.85 42.4 NS NS NS3/26/07 10.86 85.84 7.29 NM 10.23 -38.8 NS NS NS4/10/07 10.2 86.50 7.25 NM 12.52 66.7 NS NS NS4/24/07 9.35 87.35 5.70 1,163 0.30 149.2 NS NS NS5/7/07 10.18 86.52 5.37 NM 12.55 59.1 NS NS NS
5/24/07 10.98 85.72 5.82 NM 11.23 58.6 NS NS NS6/4/07 11.05 85.65 6.63 NM 6.17 210.1 NS NS NS
6/18/07 11.28 85.42 6.72 NM 9.23 10.2 NS NS NS7/3/07 11.65 85.05 7.85 NM 15.90 81.5 NS NS NS
7/16/07 12.92 83.78 7.03 NM 13.29 98.3 NS NS NS8/1/07 11.87 84.83 6.94 NM 9.42 -0.6 NS NS NS
8/13/07 11.97 84.73 6.27 NM 1.21 -319.1 NS NS NS8/27/07 12.2 84.50 6.65 NM 8.97 -51.7 NS NS NS9/10/07 12.29 84.41 7.28 NM 5.81 -41.1 NS NS NS9/25/07 12.36 84.34 7.26 NM 5.23 -42.3 NS NS NS10/4/07 12.47 84.23 6.64 1,176 1.07 -11.0 NS NS NS10/9/07 12.52 84.18 6.91 NM 5.33 -306.3 NS NS NS
10/22/07 12.26 84.44 7.91 NM 4.20 -64.1 NS NS NS11/5/07 12.10 84.60 7.56 NM 2.80 -15.1 NS NS NS
11/19/07 11.82 84.88 7.82 NM 4.07 -69.7 NS NS NS12/3/07 12.79 83.91 7.31 NM 2.68 -98.1 NS NS NS
12/17/07 11.93 84.77 7.03 NM 2.97 -91.5 NS NS NS1/2/08 11.40 85.30 6.61 NM 4.95 -96.2 NS NS NS
1/14/08 11.01 85.69 6.60 NM 4.52 -65.7 NS NS NS1/29/08 11.34 85.36 7.11 NM 5.47 20.9 NS NS NS2/11/08 11.19 85.51 NM NM NM NM NS NS NS3/7/08 9.84 86.86 6.86 1,999 0.16 70.7 NS NS NS
3/11/08 9.36 87.34 6.88 1,601 0.86 -25.0 NS NS NS5/1/08 10.28 86.42 7.04 1,471 0.52 12.0 NS NS NS
5/27/08 10.63 86.07 NM NM NM NM NS NS NS6/4/08 11.01 85.69 6.48 NM 0.29 -28.7 NS NS NS
6/17/08 11.03 85.67 7.22 NM 2.17 -37.3 NS NS NS7/1/08 10.55 86.15 7.29 NM 0.90 -32.4 NS NS NS7/9/08 NM 86.15 NM NM NM NM NS NS NS
7/14/08 11.84 84.86 6.81 NM 1.70 19.0 NS NS NS7/30/08 10.58 86.12 6.55 NM 1.98 -17.8 NS NS NS8/12/08 10.58 86.12 6.86 NM 0.86 112.4 NS NS NS8/20/08 11.02 85.68 NM NM NM NM NS NS NS8/26/08 10.81 85.89 6.90 NM 1.93 -11.2 NS NS NS9/9/08 10.74 85.96 6.69 NM 0.72 118.2 NS NS NS
9/22/08 11.57 85.13 6.60 NM 0.57 7.9 NS NS NS10/17/08 11.1 85.60 7.04 NM 0.71 -2.9 NS NS NS10/27/08 10.8 85.90 6.80 NM 1.50 -11.6 NS NS NS11/11/08 10.99 85.71 6.62 NM 1.01 -34.7 NS NS NS

Monitoring
Well & PVC
Elevation (ft)
Monitoring
Date
Depth to
Water (ft)
Groundwater
Elevation (ft)pH (SU)
Specific
Conductivity
(µS/cm)
Dissolved
Oxygen
(mg/L)
Redox
(mV)
Nitrate
(mg/L)
Sulfate
(mg/L)
Dissolved Iron
(mg/L)
TABLE 2GROUNDWATER GEOCHEMICAL MONITORING DATA
730 East Street, Pittsfield, MassachusettsO'Connell Oil Associates
ECS-11 11/24/08 11.21 85.49 7.01 1,540 0.16 -34.0 NS NS NS(continued) 11/25/08 11.12 85.58 6.68 NM 0.94 -161.0 NS NS NS
12/11/08 10.88 85.82 7.06 NM 0.61 -18.0 NS NS NS12/23/08 9.67 87.03 6.60 NM 1.04 -33.7 NS NS NS
1/6/09 9.87 86.83 6.47 NM 0.71 28.9 NS NS NS1/23/09 10.55 86.15 6.66 NM 2.88 48.1 NS NS NS2/18/09 11.25 85.45 7.03 1,501 0.65 11.0 NS NS NS3/4/09 10.72 85.98 6.83 NM 1.17 187.8 NS NS NS
3/19/09 9.94 86.76 6.94 NM 0.44 -17.4 NS NS NS4/9/09 9.87 86.83 7.40 NM 0.29 91.7 NS NS NS
4/23/09 9.87 86.83 6.95 NM 1.00 39.4 NS NS NS5/5/09 10.62 86.08 6.94 NM 0.90 66.5 NS NS NS
5/19/09 10.55 86.15 6.79 NM 1.21 20.9 NS NS NS6/11/09 10.86 85.84 6.77 NM 0.61 -10.1 NS NS NS6/26/09 11.17 85.53 6.60 NM 0.88 38.9 NS NS NS7/6/09 10.44 86.26 6.70 1,198 0.30 -25.8 NS NS NS
7/22/09 10.75 85.95 6.70 1,223 4.62 28.5 NS NS NS8/6/09 9.38 87.32 6.82 1,290 0.75 -69.9 NS NS NS
8/24/09 10.08 86.62 6.85 1,273 0.41 -22.0 NS NS NS9/10/09 10.57 86.13 7.21 1,151 0.57 -22.7 NS NS NS9/23/09 10.56 86.14 7.13 1,226 11.20 -77.7 NS NS NS10/6/09 10.75 85.95 6.64 1,214 0.71 16.9 NS NS NS
10/13/09 11.20 85.50 7.15 1,039 3.17 12.6 NS NS NS10/23/09 10.85 85.85 6.91 1,285 2.19 -59.3 NS NS NS11/5/09 10.48 86.22 6.91 1,312 1.15 -58.9 NS NS NS
11/17/09 10.44 86.26 7.01 1,254 3.15 -27.3 NS NS NS12/8/09 10.33 86.37 6.99 1,280 0.47 -36.1 NS NS NS
12/23/09 10.55 86.15 7.21 1,002 1.30 58.3 NS NS NS1/8/10 10.70 86.00 7.04 1,077 0.88 28.2 NS NS NS
1/20/10 11.36 85.34 7.11 1,095 1.41 -19.8 NS NS NS2/3/10 11.03 85.67 6.77 NM 10.84 -58.9 NS NS NS
2/11/10 11.26 85.44 7.01 1,290 0.47 -39.0 NS NS NS2/18/10 11.68 85.02 6.95 NM 0.84 14.4 NS NS NS3/3/10 10.99 85.71 6.96 1,331 2.84 -2.7 NS NS NS
3/17/10 10.19 86.51 7.00 1,204 1.64 -39.6 NS NS NS4/15/10 9.86 86.84 6.95 1,009 1.04 -38.6 NS NS NS4/28/10 10.34 86.36 6.82 NM 3.80 24.2 NS NS NS5/13/10 11.08 85.62 6.81 1,119 4.78 36.9 NS NS NS5/27/10 11.3 85.40 6.99 NM 1.11 -42.6 NS NS NS6/9/10 10.95 85.75 6.49 NM 0.97 8.9 NS NS NS
6/24/10 11.34 85.36 6.50 NM 0.59 33.9 NS NS NS7/9/10 11.93 84.77 6.38 NM 6.59 37.7 NS NS NS
7/20/10 11.26 85.44 7.10 NM 0.58 -291.1 NS NS NS8/5/10 12.02 84.68 6.68 NM 1.14 22.1 NS NS NS
8/18/10 11.4 85.30 6.86 NM 2.41 39.4 NS NS NS9/9/10 12.48 84.22 7.19 1,100 0.48 6.0 NS NS NS
9/15/10 12.56 84.14 6.91 NM 2.01 12.6 NS NS NS9/30/10 12.59 84.11 6.69 NM 3.19 190.7 NS NS NS10/5/10 11.90 84.80 6.93 1,101 0.83 60.0 NS NS NS
10/21/10 11.02 85.68 7.01 NM 1.60 -20.0 NS NS NS11/5/10 11.53 85.17 6.98 NM 9.50 19.9 NS NS NS
11/19/10 10.90 85.80 6.96 NM 3.64 39.4 NS NS NS12/9/10 10.80 85.90 6.42 NM 1.05 -16.5 NS NS NS
12/22/10 10.59 86.11 6.61 1,263 1.28 -39.8 NS NS NS1/7/11 11.49 85.21 6.48 NM 7.56 -36.9 NS NS NS
1/19/11 NM NA NM NM NM NM NS NS NS2/4/11 NM NA NM NM NM NM NS NS NS
2/15/11 NM NA NM NM NM NM NS NS NS3/3/11 11.86 84.84 6.24 NM 9.32 215.3 NS NS NS
3/28/11 9.94 86.76 7.14 1.395 1.24 -71.9 NS NS NS4/7/11 10.08 86.62 7.29 NM 3.06 -66.1 NS NS NS
4/22/11 10.00 86.70 6.94 1.261 1.38 -61.1 NS NS NS

Monitoring
Well & PVC
Elevation (ft)
Monitoring
Date
Depth to
Water (ft)
Groundwater
Elevation (ft)pH (SU)
Specific
Conductivity
(µS/cm)
Dissolved
Oxygen
(mg/L)
Redox
(mV)
Nitrate
(mg/L)
Sulfate
(mg/L)
Dissolved Iron
(mg/L)
TABLE 2GROUNDWATER GEOCHEMICAL MONITORING DATA
730 East Street, Pittsfield, MassachusettsO'Connell Oil Associates
ECS-11 5/7/11 10.05 86.65 6.17 0.015 2.39 126.3 NS NS NS(continued) 6/2/11 10.92 85.78 6.90 1.333 2.73 -4.0 NS NS NS
6/14/11 10.95 85.75 7.20 NM 0.27 -87.1 NS NS NS7/7/11 10.72 85.98 6.10 NM 0.76 -20.4 NS NS NS
7/25/11 11.29 85.41 6.73 NM 0.36 -32.1 NS NS NS8/15/11 11.66 85.04 6.96 NM 0.26 -47.0 NS NS NS8/26/11 11.12 85.58 7.02 1.255 0.04 -92.2 NS NS NS9/14/11 9.11 87.59 6.96 1,235 0.29 -103.1 NS NS NS10/6/11 9.65 87.05 7.05 NM 0.68 -58.0 NS NS NS
10/20/11 10.27 86.43 6.92 NM 0.87 -85.3 NS NS NS11/3/11 10.44 86.26 6.70 1,405 0.60 -71.0 NS NS NS
11/17/11 10.65 86.05 6.67 NM 0.72 -32.0 NS NS NS12/7/11 10.65 86.05 7.24 1,100 2.38 260.6 NS NS NS
12/21/11 10.46 86.24 7.48 1,064 4.27 224.2 NS NS NS1/4/12 10.45 86.25 7.55 1,077 9.37 58.8 NS NS NS
1/17/12 10.88 85.82 7.04 2,594 5.21 287.8 NS NS NS2/1/12 10.45 86.25 7.04 1,574 5.57 209.1 NS NS NS
2/15/12 10.89 85.81 7.59 2,786 0.77 -56.5 NS NS NS3/1/12 11.08 85.62 7.50 1,552 6.22 300.6 NS NS NS
3/15/12 10.73 85.97 7.32 1,287 3.12 280.3 NS NS NS4/5/12 11.2 85.50 7.12 NM 5.66 321.5 NS NS NS
4/19/12 11.52 85.18 7.60 1,199 5.26 322.2 NS NS NS5/3/12 11.32 85.38 7.77 1,129 1.87 252.5 NS NS NS
5/17/12 10.72 85.98 7.20 1,120 4.47 238.8 NS NS NS5/31/12 10.95 85.75 6.54 1,092 4.92 320.7 NS NS NS6/14/12 11.08 85.62 6.38 1,086 5.07 412.7 NS NS NS6/28/12 11.42 85.28 7.17 1,027 0.98 -21.7 NS NS NS7/3/12 11.57 85.13 7.21 NM 0.48 -67.8 NS NS NS
7/19/12 11.95 84.75 6.98 966 0.85 -20.4 NS NS NS8/1/12 11.95 84.75 6.90 1,178 0.68 -50.8 NS NS NS
8/20/12 11.86 84.84 6.94 1,022 0.23 -41.6 NS NS NS8/30/12 12.07 84.63 6.27 1,155 0.40 -24.1 NS NS NS
ECS-12*(**)1/25/06 8.64 87.51 6.44 1,207 0.53 -117 NS NS NS
96.15 4/10/06 10.60 85.55 6.65 1,436 0.42 14.0 NS NS NS7/20/06 10.95 85.20 4.19 1,419 0.12 506 15.5 <5.0 15.59/15/06 11.92 84.23 6.60 NM 8.11 -47.5 NS NS NS9/21/06 11.53 84.62 6.67 NM 9.63 283 NS NS NS10/6/06 11.35 84.80 7.68 NM 1.24 -22.7 NS NS NS
10/10/06 11.42 84.73 6.58 1,291 0.48 -23.3 NS NS NS10/23/06 10.79 85.36 5.91 NM 1.46 NM NS NS NS11/7/06 10.74 85.41 6.65 NM 5.74 -69.8 NS NS NS
11/20/06 10.15 86.00 6.94 NM 8.77 72.5 NS NS NS12/4/06 10.58 85.57 7.32 NM 12.13 199.4 NS NS NS
12/18/06 11.04 85.11 6.20 NM 7.52 -3.8 NS NS NS1/2/07 10.96 85.19 7.29 NM 8.41 -120.8 NS NS NS
1/15/07 10.56 85.59 7.02 NM 8.29 -128.6 NS NS NS1/25/07 12.55 83.60 6.93 1,500 1.51 9.0 <2.0 <20.0 15.81/29/07 11.74 84.41 7.22 NM 13.75 -94.7 NS NS NS2/12/07 11.23 84.92 6.95 NM 13.78 -52.9 NS NS NS2/26/07 NG-S NA NM NM NM NM NS NS NS3/12/07 NG-S NA NM NM NM NM NS NS NS3/26/07 10.42 85.73 7.06 NM 12.40 -89.60 NS NS NS4/10/07 9.77 86.38 6.76 NM 10.88 -14.00 NS NS NS4/24/07 8.83 87.32 5.48 1,642 0.30 -57.8 NS NS NS5/7/07 9.89 86.26 5.93 NM 16.80 -11.9 NS NS NS
5/24/07 10.21 85.94 6.01 NM 13.25 24.3 NS NS NS6/4/07 10.66 85.49 5.99 NM 12.92 28.4 NS NS NS
6/18/07 10.86 85.29 6.71 NM 12.56 -84.4 NS NS NS7/3/07 11.27 84.88 7.85 NM 21.14 46.2 NS NS NS
7/16/07 12.54 83.61 7.88 NM 18.24 60.7 NS NS NS8/1/07 11.47 84.68 6.80 NM 9.79 -59.9 NS NS NS
8/13/07 11.56 84.59 6.35 NM 1.35 -331.1 NS NS NS8/27/07 11.78 84.37 6.34 NM 8.73 -75.3 NS NS NS9/10/07 11.87 84.28 7.26 NM 5.96 -68.2 NS NS NS9/25/07 11.95 84.20 7.23 NM 5.30 -69.9 NS NS NS10/4/07 12.04 84.66 6.71 1,740 1.11 -86.0 <0.100 10.0 21.310/9/07 12.08 84.62 6.71 NM 4.22 -300.4 NS NS NS
10/22/07 11.82 84.88 7.42 NM 3.31 -40.7 NS NS NS11/5/07 11.66 85.04 7.47 NM 6.90 -99.2 NS NS NS

Monitoring
Well & PVC
Elevation (ft)
Monitoring
Date
Depth to
Water (ft)
Groundwater
Elevation (ft)pH (SU)
Specific
Conductivity
(µS/cm)
Dissolved
Oxygen
(mg/L)
Redox
(mV)
Nitrate
(mg/L)
Sulfate
(mg/L)
Dissolved Iron
(mg/L)
TABLE 2GROUNDWATER GEOCHEMICAL MONITORING DATA
730 East Street, Pittsfield, MassachusettsO'Connell Oil Associates
ECS-12 11/19/07 11.38 85.32 7.34 NM 2.97 -39.5 NS NS NS(continued) 12/3/07 12.87 83.83 7.49 NM 6.95 -111.5 NS NS NS
12/17/07 11.47 85.23 7.49 NM 6.51 -110.1 NS NS NS1/2/08 10.97 85.73 6.52 NM 6.51 -76.1 NS NS NS
1/14/08 10.59 86.11 6.59 NM 6.01 -71.5 NS NS NS1/29/08 10.92 85.78 6.85 NM 6.38 16.1 NS NS NS2/11/08 10.82 85.88 NM NM NM NM NS NS NS3/24/08 9.15 87.55 6.75 1,510 0.44 -25 <0.100 2.72 16.35/1/08 9.71 86.99 7.00 1,600 0.35 -29 <0.100 <1.0 6.31
5/27/08 10.18 86.52 NM NM NM NM NS NS NS6/4/08 11.82 84.88 6.67 NM 0.45 -112.2 NS NS NS
6/17/08 10.61 86.09 7.36 NM 0.36 -166.2 NS NS NS7/1/08 10.62 86.08 7.02 NM 1.66 -75 NS NS NS7/9/08 NM 86.08 NM NM NM NM NS NS NS
7/14/08 10.96 85.74 6.63 NM 1.18 -62.7 NS NS NS7/30/08 10.18 86.52 6.48 NM 2.15 -52.3 NS NS NS8/12/08 10.60 86.10 6.77 NM 0.90 -63.5 NS NS NS8/20/08 10.67 86.03 NM NM NM NM NS NS NS8/26/08 11.02 85.68 6.71 NM 2.02 -52.2 NS NS NS9/9/08 10.71 85.99 6.80 NM 0.88 -88.1 NS NS NS
9/22/08 11.17 85.53 6.80 NM 0.81 -74.3 NS NS NS10/17/08 11.3 85.40 6.91 NM 2.20 -35.8 NS NS NS10/27/08 10.9 85.80 6.60 NM 1.12 -22.1 NS NS NS11/11/08 10.59 86.11 6.67 NM 0.75 -51.3 NS NS NS11/24/08 10.79 85.91 6.81 1,840 0.17 -67.0 <0.100 <1.0 15.411/25/08 10.78 85.92 5.71 NM 3.62 56.1 NS NS NS12/11/08 10.44 86.26 6.84 NM 2.06 -22.7 NS NS NS
1/6/09 9.62 87.08 6.26 NM 4.00 85.0 NS NS NS2/3/09 11.01 85.69 6.50 NM 12.28 40.6 NS NS NS
3/19/09 10.89 85.81 6.31 NM 2.09 39.1 NS NS NS4/9/09 9.77 86.93 6.50 1,390 0.49 -46.2 <0.100 1.98 11.5
4/23/09 10.39 86.31 6.86 1,499 1.42 44.2 NS NS NS5/5/09 10.65 86.05 7.05 NM 2.19 9.6 NS NS NS
5/19/09 10.52 86.18 6.88 1,474 1.42 -19.0 NS NS NS6/11/09 11.00 85.70 6.86 1,354 0.79 -106.9 NS NS NS6/26/09 11.70 85.00 6.91 1,387 2.04 -16.2 NS NS NS7/9/09 9.98 86.72 6.83 1,409 0.59 -54.1 NS NS NS
7/22/09 10.28 86.42 6.76 1,411 2.02 -10.1 NS NS NS8/6/09 9.20 87.50 6.94 1,343 1.41 -76.1 NS NS NS
8/24/09 9.62 87.08 6.83 1,520 0.31 -54.0 <0.100 <1.0 13.79/10/09 10.36 86.34 7.01 1,301 1.12 -36.2 NS NS NS9/23/09 10.39 86.31 7.00 1,051 7.11 -37.6 NS NS NS10/6/09 10.75 85.95 6.57 1,293 3.77 80.1 NS NS NS
10/13/09 10.73 85.97 6.99 1,141 3.48 -29.8 <0.100 <1.0 12.410/23/09 10.86 85.84 6.79 1,473 2.69 -54.2 NS NS NS11/5/09 10.18 86.52 6.83 1,446 1.60 -60.9 NS NS NS
11/17/09 10.39 86.31 6.98 1,206 1.81 -30.0 NS NS NS12/8/09 10.2 86.50 6.96 1,120 1.49 -50.8 NS NS NS
12/23/09 10.5 86.20 7.10 940 1.10 2.7 NS NS NS1/8/10 11.63 85.07 6.96 1,030 1.10 -19.2 NS NS NS
1/20/10 10.89 85.81 6.96 1,066 1.66 -35.1 NS NS NS2/3/10 10.52 86.18 6.10 NM 13.67 -6.0 NS NS NS
2/11/10 10.69 86.01 6.85 1,730 0.21 -82.0 <0.100 <1.0 12.52/18/10 10.96 85.74 7.05 NM 1.84 -24.4 NS NS NS3/3/10 10.42 86.28 6.20 2,700 3.40 42.4 NS NS NS
3/17/10 9.63 87.07 6.88 1,276 0.70 -66.4 NS NS NS4/15/10 9.82 86.88 7.02 931 1.86 -9.1 NS NS NS4/28/10 10.35 86.35 6.86 NM 4.11 30.9 NS NS NS5/13/10 10.59 86.11 6.75 1,328 4.88 -21.1 NS NS NS5/27/10 10.83 85.87 7.01 NM 0.97 -50.2 NS NS NS6/9/10 10.50 86.20 6.52 NM 2.22 -11.1 NS NS NS
6/24/10 11.10 85.60 6.86 NM 0.84 -64.4 NS NS NS7/9/10 11.44 85.26 6.34 NM 9.29 88.3 NS NS NS
7/20/10 11.48 85.22 7.03 NM 1.41 -209.1 NS NS NS8/5/10 11.54 85.16 6.77 NM 1.04 -17.9 NS NS NS
8/18/10 11.71 84.99 6.77 NM 4.60 -14.8 NS NS NS9/9/10 11.92 84.78 7.25 1,780 0.26 -76.0 <0.100 <1.0 10.6
9/15/10 12.00 84.70 6.89 NM 2.81 -13.5 NS NS NS9/30/10 12.05 84.65 6.58 NM 3.12 511.7 NS NS NS10/5/10 11.36 85.34 6.97 1,687 0.50 -83.0 NS NS NS
10/21/10 11.18 85.52 6.81 NM 1.00 -32.6 NS NS NS

Monitoring
Well & PVC
Elevation (ft)
Monitoring
Date
Depth to
Water (ft)
Groundwater
Elevation (ft)pH (SU)
Specific
Conductivity
(µS/cm)
Dissolved
Oxygen
(mg/L)
Redox
(mV)
Nitrate
(mg/L)
Sulfate
(mg/L)
Dissolved Iron
(mg/L)
TABLE 2GROUNDWATER GEOCHEMICAL MONITORING DATA
730 East Street, Pittsfield, MassachusettsO'Connell Oil Associates
ECS-12 11/5/10 11.04 85.66 6.78 NM 9.31 -1.8 NS NS NS(continued) 11/19/10 10.90 85.80 6.84 NM 2.01 -45.5 NS NS NS
12/9/10 10.79 85.91 6.45 NM 1.13 -55.7 NS NS NS12/22/10 11.10 85.60 6.53 1,757 1.45 -79.0 NS NS NS
1/7/11 10.97 85.73 6.46 NM 5.24 -62.6 NS NS NS1/19/11 11.30 85.40 6.94 NM 2.47 -98.8 NS NS NS2/4/11 NM NA NM NM NM NM NS NS NS
2/15/11 NM NA NM NM NM NM NS NS NS3/3/11 NM NA NM NM NM NM NS NS NS
3/28/11 9.43 87.27 7.10 1.528 0.29 -114.1 <0.100 1.50 15.64/7/11 9.53 87.17 7.39 NM 3.98 -87.4 NS NS NS
4/22/11 9.45 87.25 6.96 1.286 2.18 -59.8 NS NS NS5/7/11 9.53 87.17 7.77 1.332 1.75 -26.1 NS NS NS6/2/11 10.40 86.30 6.73 1.357 4.92 -42.8 NS NS NS
6/14/11 10.42 86.28 6.88 NM 0.35 -91.0 NS NS NS7/7/11 10.18 86.52 6.09 NM 1.58 -48.7 NS NS NS
7/25/11 10.79 85.91 6.52 NM 1.66 11.7 NS NS NS8/15/11 11.14 85.56 6.79 NM 0.54 -82.2 NS NS NS8/26/11 10.59 86.11 6.57 1.340 0.40 -79.3 NS NS NS9/14/11 8.55 88.15 6.97 1,510 0.28 -100.1 <0.100 <1.00 20.310/6/11 9.09 87.61 6.95 NM 0.76 -45.3 NS NS NS
10/20/11 9.72 86.98 6.93 NM 1.50 -101.6 NS NS NS11/3/11 9.88 86.82 6.42 887 1.46 -26.0 NS NS NS
11/17/11 10.12 86.58 6.21 NM 1.54 -6.9 NS NS NS12/7/11 NM NM NM NM NM NM NS NS NS
12/21/11 9.92 86.78 7.00 1,089 4.92 234.8 NS NS NS1/4/12 9.92 86.78 7.37 1,419 7.84 126.3 NS NS NS2/1/12 NM NM NM NM NM NM NS NS NS
2/15/12 10.29 86.41 7.27 1,685 0.75 -46.8 <0.100 <1.00 20.73/1/12 10.60 86.10 7.58 9,232 9.10 350 NS NS NS
3/15/12 10.17 86.53 7.08 1,539 5.03 315.8 NS NS NS4/5/12 10.68 86.02 6.95 NM 6.42 333.2 NS NS NS
4/19/12 10.98 85.72 7.43 1,619 5.74 338.0 NS NS NS5/3/12 10.72 85.98 7.61 1,423 1.87 252.5 NS NS NS
5/17/12 10.27 86.43 7.10 1,542 4.41 232.5 NS NS NS5/31/12 10.50 86.20 6.58 864 6.24 352.5 NS NS NS6/14/12 10.64 86.06 6.71 162 5.5 408.6 NS NS NS6/26/12 10.98 85.72 6.90 1,080 0.94 -6.4 NS NS NS7/3/12 11.13 85.57 7.11 NM 0.71 -90.3 NS NS NS
7/19/12 11.50 85.20 6.82 1,315 2.07 -38.5 NS NS NS8/1/12 11.50 85.20 6.77 1,709 0.75 -103.5 NS NS NS
8/20/12 11.42 85.28 6.93 1,507 0.23 -92.7 3.54 <1.00 15.908/30/12 11.62 85.08 NM NM NM NM NS NS NS
ECS-13** 1/25/06 NG NA NM NM NM NM NS NS NS97.66 4/10/06 12.20 85.46 6.61 246 0.75 -2.0 NS NS NS
7/20/06 12.53 85.13 3.00 890 0.28 543 NS NS NS9/15/06 10.45 87.21 7.10 NM 9.28 -40.2 NS NS NS9/21/06 13.11 84.55 7.76 NM 11.94 244 NS NS NS10/6/06 12.97 84.69 8.19 NM 4.94 -7.6 NS NS NS
10/10/06 13.01 84.65 6.32 533 0.73 14.2 NS NS NS10/23/06 12.34 85.32 6.40 NM 1.50 NM NS NS NS11/7/06 12.31 85.35 6.25 NM 13.45 109.4 NS NS NS
11/20/06 11.72 85.94 6.74 NM 3.33 16.3 NS NS NS12/4/06 12.18 85.48 7.42 NM 9.57 180.2 NS NS NS
12/18/06 12.62 85.04 6.40 NM 5.97 -13.7 NS NS NS1/2/07 12.58 85.08 7.29 NM 6.41 -135.4 NS NS NS
1/15/07 12.04 85.62 7.18 NM 6.27 -173.5 NS NS NS1/25/07 12.18 85.48 7.59 668 1.46 57.0 NS NS NS1/29/07 12.34 85.32 7.58 NM 12.82 -84.6 NS NS NS2/12/07 12.83 84.83 7.41 NM 8.54 -59.4 NS NS NS2/26/07 NG-S NA NM NM NM NM NS NS NS3/12/07 NG-S NA NM NM NM NM NS NS NS3/26/07 12.03 85.63 6.92 NM 14.41 104.5 NS NS NS4/10/07 11.41 86.25 6.69 NM 13.47 14.6 NS NS NS4/24/07 10.51 87.15 6.96 685 NA -41.3 NS NS NS5/7/07 11.42 86.24 4.75 NM 15.95 125.6 NS NS NS
5/24/07 11.27 86.39 5.06 NM 14.82 132.7 NS NS NS6/4/07 12.27 85.39 6.18 NM 11.05 21.8 NS NS NS

Monitoring
Well & PVC
Elevation (ft)
Monitoring
Date
Depth to
Water (ft)
Groundwater
Elevation (ft)pH (SU)
Specific
Conductivity
(µS/cm)
Dissolved
Oxygen
(mg/L)
Redox
(mV)
Nitrate
(mg/L)
Sulfate
(mg/L)
Dissolved Iron
(mg/L)
TABLE 2GROUNDWATER GEOCHEMICAL MONITORING DATA
730 East Street, Pittsfield, MassachusettsO'Connell Oil Associates
ECS-13 6/18/07 12.50 85.16 7.31 NM 14.44 48.1 NS NS NS(continued) 7/3/07 12.88 84.78 8.22 NM 12.65 73.3 NS NS NS
7/16/07 12.95 84.71 7.81 NM 12.64 88.1 NS NS NS8/1/07 13.07 84.59 7.34 NM 24.48 110.5 NS NS NS
8/13/07 13.17 84.49 6.97 NM 10.09 -256.6 NS NS NS8/27/07 13.39 84.27 6.61 NM 10.78 -111.8 NS NS NS9/10/07 13.45 84.21 7.73 NM 7.28 -83.8 NS NS NS9/25/07 13.52 84.14 7.72 NM 7.10 -86.7 NS NS NS10/4/07 13.64 84.02 7.22 937 0.53 -53.0 NS NS NS10/9/07 13.67 83.99 6.61 NM 3.41 -268.4 NS NS NS
10/22/07 13.38 84.28 7.52 NM 4.81 -46.2 NS NS NS11/5/07 13.20 84.46 7.13 NM 8.19 -37.1 NS NS NS
11/19/07 12.92 84.74 7.45 NM 4.02 -45.5 NS NS NS12/3/07 12.87 84.79 7.07 NM 8.12 -102.4 NS NS NS
12/17/07 13.01 84.65 7.19 NM 7.15 -102.5 NS NS NS1/2/08 12.54 85.12 6.01 NM 5.10 39.8 NS NS NS
1/14/08 12.06 85.60 6.05 NM 5.04 42.3 NS NS NS1/29/08 12.53 85.13 7.01 NM 8.13 -11.3 NS NS NS2/11/08 12.34 85.32 NM NM NM NM NS NS NS3/7/08 11.19 86.47 7.19 161 8.81 303 NS NS NS
3/11/08 10.80 86.86 7.27 905 3.52 -39 NS NS NS5/1/08 11.28 86.38 6.44 1,350 1.00 -7 NS NS NS
5/27/08 10.63 87.03 NM NM NM NM NS NS NS6/4/08 12.44 85.22 6.28 NM 4.81 49.1 NS NS NS
6/17/08 12.18 85.48 7.08 NM 7.41 33.8 NS NS NS7/1/08 12.20 85.46 6.61 NM 0.80 25.1 NS NS NS7/9/08 NM 85.46 NM NM NM NM NS NS NS
7/14/08 12.56 85.10 6.53 NM 2.29 -18 NS NS NS7/30/08 11.78 85.88 6.75 NM 2.52 47.2 NS NS NS8/12/08 12.21 85.45 6.69 NM 1.85 -28.3 NS NS NS8/20/08 11.49 86.17 NM NM NM NM NS NS NS8/26/08 12.65 85.01 6.82 NM 0.96 -62.5 NS NS NS9/9/08 11.99 85.67 6.72 NM 1.37 -42.7 NS NS NS
9/22/08 12.73 84.93 6.69 NM 1.36 -111.7 NS NS NS10/17/08 12.87 84.79 7.13 NM 1.31 -66.6 NS NS NS10/27/08 12.51 85.15 6.79 NM 1.20 -28.5 NS NS NS11/11/08 12.18 85.48 6.84 NM 1.60 -9.1 NS NS NS11/24/08 12.42 85.24 6.90 890 0.20 -71.0 NS NS NS11/25/08 12.36 85.30 6.50 NM 3.87 18.6 NS NS NS12/11/08 12.04 85.62 7.01 NM 3.67 -8.1 NS NS NS3/19/09 11.47 86.19 7.33 NM 15.94 5.4 NS NS NS4/9/09 11.53 86.13 5.89 652 0.89 -10.1 NS NS NS
4/23/09 11.80 85.86 7.15 226 11.44 125.8 NS NS NS5/5/09 12.29 85.37 7.11 NM 11.22 156.3 NS NS NS
5/19/09 12.09 85.57 7.03 258 6.59 78.9 NS NS NS6/11/09 12.66 85.00 6.91 243 5.71 -64.1 NS NS NS6/26/09 11.44 86.22 7.04 301 5.48 67.8 NS NS NS7/6/09 11.55 86.11 7.08 242 1.27 96.5 NS NS NS
7/22/09 11.79 85.87 7.06 236 2.84 54.2 NS NS NS8/6/09 10.84 86.82 7.03 220 1.73 105.1 NS NS NS
8/24/09 11.22 86.44 6.54 1,720 0.34 -48.0 NS NS NS9/10/09 11.70 85.96 7.24 240 1.04 42.3 NS NS NS9/23/09 11.21 86.45 7.29 252 4.59 -64.6 NS NS NS10/6/09 12.20 85.46 6.52 273 1.80 69.9 NS NS NS
10/13/09 12.34 85.32 6.60 1,096 2.90 -4.7 NS NS NS10/23/09 12.38 85.28 6.50 1,380 2.02 -28.6 NS NS NS11/5/09 11.82 85.84 6.86 415 2.28 -19.2 NS NS NS
11/17/09 11.96 85.70 6.83 687 1.28 23.6 NS NS NS12/8/09 11.87 85.79 7.06 487 7.83 -33.1 NS NS NS2/3/10 12.13 85.53 6.66 NM 11.53 -76.6 NS NS NS
2/11/10 12.34 85.32 6.36 2 0.46 -55.0 NS NS NS2/18/10 12.55 85.11 7.00 NM 6.99 -12.2 NS NS NS3/3/10 12.00 85.66 6.47 1,541 3.56 -5.8 NS NS NS
3/17/10 11.23 86.43 7.65 187 7.55 84.4 NS NS NS4/15/10 11.30 86.36 6.87 254 3.18 -76.7 NS NS NS4/28/10 11.68 85.98 6.80 NM 3.18 52.2 NS NS NS5/13/10 12.11 85.55 6.67 276 2.13 52.8 NS NS NS5/27/10 12.45 85.21 6.56 NM 6.11 -22.9 NS NS NS6/9/10 12.56 85.10 6.58 NM 1.37 -24.0 NS NS NS
6/24/10 12.63 85.03 6.70 NM 0.34 -31.7 NS NS NS7/9/10 12.93 84.73 6.23 NM 5.93 76.9 NS NS NS

Monitoring
Well & PVC
Elevation (ft)
Monitoring
Date
Depth to
Water (ft)
Groundwater
Elevation (ft)pH (SU)
Specific
Conductivity
(µS/cm)
Dissolved
Oxygen
(mg/L)
Redox
(mV)
Nitrate
(mg/L)
Sulfate
(mg/L)
Dissolved Iron
(mg/L)
TABLE 2GROUNDWATER GEOCHEMICAL MONITORING DATA
730 East Street, Pittsfield, MassachusettsO'Connell Oil Associates
ECS-13 7/20/10 13.00 84.66 7.17 NM 0.97 -297.9 NS NS NS(continued) 8/5/10 13.06 84.60 7.36 NM 3.41 -45.3 NS NS NS
8/18/10 13.21 84.45 6.79 NM 1.50 13.7 NS NS NS9/9/10 13.47 84.19 7.42 947 0.27 -72.0 NS NS NS
9/15/10 13.67 83.99 6.31 NM 1.50 -16.7 NS NS NS9/30/10 13.60 84.06 6.99 NM 6.21 200.4 NS NS NS10/5/10 12.92 84.74 7.21 588 3.24 -49.1 NS NS NS
10/21/10 12.63 85.03 6.89 NM 2.45 -41.5 NS NS NS11/5/10 12.57 85.09 7.19 NM 11.01 -35.1 NS NS NS
11/19/10 12.40 85.26 6.91 NM 1.40 -46.4 NS NS NS12/9/10 12.27 85.39 6.57 NM 1.78 -15.0 NS NS NS
12/22/10 12.12 85.54 6.60 634 4.97 15.0 NS NS NS1/7/11 12.52 85.14 6.66 NM 10.21 -69.8 NS NS NS
1/19/11 NM NA NM NM NM NM NS NS NS2/4/11 NM NA NM NM NM NM NS NS NS
2/15/11 NM NA NM NM NM NM NS NS NS3/3/11 NM NA NM NM NM NM NS NS NS
3/28/11 11.00 86.66 7.21 0.795 5.41 -51.7 NS NS NS4/7/11 11.05 86.61 7.58 NM 10.91 -36.7 NS NS NS
4/22/11 10.99 86.67 7.38 0.752 5.15 -62.4 NS NS NS5/7/11 11.09 86.57 8.13 1.808 9.27 -5.9 NS NS NS6/2/11 11.95 85.71 7.23 0.842 7.96 33.4 NS NS NS
6/14/11 11.98 85.68 7.06 NM 1.93 -47.4 NS NS NS7/7/11 11.17 86.49 6.05 NM 6.55 -37.9 NS NS NS
7/25/11 12.34 85.32 7.13 NM 1.25 4.4 NS NS NS8/15/11 12.70 84.96 7.06 NM 0.67 -46.7 NS NS NS8/26/11 12.13 85.53 7.31 0.728 1.18 -25.2 NS NS NS9/14/11 10.10 87.56 7.29 675 0.23 -99.1 NS NS NS10/6/11 10.65 87.01 7.41 NM 2.18 14.0 NS NS NS
10/20/11 11.26 86.40 7.58 NM 0.59 -89.8 NS NS NS11/3/11 11.44 86.22 7.46 789 3.55 -36.1 NS NS NS
11/17/11 11.67 85.99 7.43 NM 5.07 52.3 NS NS NS12/7/11 11.66 86.00 7.49 667 3.35 244.9 NS NS NS
12/21/11 11.50 86.16 7.00 1,089 4.92 234.8 NS NS NS1/4/12 11.46 86.20 7.86 662 11.42 139.6 NS NS NS2/1/12 11.47 86.19 7.97 1,574 5.57 209.1 NS NS NS
2/15/12 11.91 85.75 7.65 756 0.82 -75.8 NS NS NS3/1/12 12.13 85.53 8.03 694 9.34 287.3 NS NS NS
3/15/12 11.72 85.94 7.76 673 6.36 255.0 NS NS NS4/5/12 12.20 85.46 6.95 NM 8.07 288.0 NS NS NS
4/19/12 12.55 85.11 7.75 132 7.31 304.5 NS NS NS5/3/12 12.44 85.22 8.10 701 1.96 195.9 NS NS NS
5/17/12 11.80 85.86 7.45 710 5.29 212.2 NS NS NS5/31/12 12.07 85.59 7.23 715 5.90 284.1 NS NS NS6/14/12 12.18 85.48 7.12 718 8.18 372.7 NS NS NS6/26/12 12.52 85.14 7.36 670 2.34 -36.8 NS NS NS7/3/12 12.70 84.96 7.41 NM 2.04 -18.3 NS NS NS
7/19/12 13.05 84.61 7.34 643 1.26 -63.7 NS NS NS8/1/12 13.07 84.59 7.32 797 10.20 122.1 NS NS NS
8/20/12 12.95 84.71 7.38 704 0.36 -120.4 NS NS NS8/30/12 13.17 84.49 NM NM NM NM NS NS NS
ECS-14 4/10/06 10.00 86.25 6.92 1,310 0.20 4.0 NS NS NS96.25 7/20/06 10.31 85.94 NM NM NM NM NS NS NS
10/10/06 10.79 85.46 NM NM NM NM NS NS NS1/25/07 9.87 86.38 NM NM NM NM NS NS NS4/24/07 8.51 87.74 NM NM NM NM NS NS NS10/4/07 11.35 84.90 6.90 1,720 1.21 -81 NS NS NS3/7/08 9.13 87.12 6.83 1,698 0.42 16.6 NS NS NS
11/24/08 10.22 86.03 NM NM NM NM NS NS NS9/14/11 8.23 88.02 NM NM NM NM NS NS NS2/15/12 9.84 86.41 NM NM NM NM NS NS NS8/20/12 11.48 84.77 NM NM NM NM NS NS NS

Monitoring
Well & PVC
Elevation (ft)
Monitoring
Date
Depth to
Water (ft)
Groundwater
Elevation (ft)pH (SU)
Specific
Conductivity
(µS/cm)
Dissolved
Oxygen
(mg/L)
Redox
(mV)
Nitrate
(mg/L)
Sulfate
(mg/L)
Dissolved Iron
(mg/L)
TABLE 2GROUNDWATER GEOCHEMICAL MONITORING DATA
730 East Street, Pittsfield, MassachusettsO'Connell Oil Associates
ECS-15 4/10/06 10.47 85.98 6.54 1,357 0.97 68.0 NS NS NS96.45 7/20/06 10.72 85.73 NM NM NM NM NS NS NS
10/10/06 11.23 85.22 NM NM NM NM NS NS NS1/25/07 10.37 86.08 NM NM NM NM NS NS NS4/24/07 8.93 87.52 NM NM NM NM NS NS NS10/4/07 11.91 84.54 6.24 1,082 0.90 80 NS NS NS3/7/08 9.68 86.77 6.61 898 3.06 34.6 NS NS NS
11/24/08 10.70 85.75 NM NM NM NM NS NS NS9/14/11 8.73 87.72 NM NM NM NM NS NS NS2/15/12 10.50 85.95 NM NM NM NM NS NS NS8/20/12 10.83 85.62 NM NM NM NM NS NS NS
MW-1 3/28/11 10.07 NM 6.91 961 0.27 -91.7 <0.100 26.8 12.48/20/12 12.11 NM NM NM NM NM NS NS NS
NOTES: System shut down between 2/11/08 and 5/26/08ft = feet; SU = standard units; mS/cm = milliSiemens per centimeter; mg/L = milligrams per liter; mV = millivolts.NG = Not gauged; NS = Not sampled; NA = Not applicable; NM = Not measured. NG-S= Not gauged due to snow.
97.02 = PVC elevations following well repairs on 8/29/05 & 9/1/05. Bold date denotes a groundwater sampling event.* indicates these wells are sampled for secondary MNA parameters. **Wells ECS-2, ECS-3, ECS-4, ECS-8, ECS-11, ECS-12, and ECS-13 are within O2 remediation

Monitoring Well
& Elevation (ft)Sampling Date
Depth to
Water (ft)
Groundwater
Elevation (ft)
C5 - C8
Aliphatics
(mg/L)
C9 - C12
Aliphatics
(mg/L)
C9 - C10
Aromatics
(mg/L)
Benzene (µg/L)Ethyl-benzene
(µg/L)MtBE (µg/L)
Naphthalene
(µg/L)
Toluene
(ug/L)
Xylenes
(µg/L)
Σ BTEX
(µg/L)
GW-2: 3 5 7 2,000 20,000 50,000 1,000 50,000 9,000 NA
GW-3: 50 50 50 10,000 5,000 50,000 20,000 40,000 5,000 NA
MW-1 3/28/2011 10.07 87.06 0.984 <0.0250 <0.0250 <5.0 <5.0 <5.0 <5.0 <5.0 <10.0 ND
97.13 8/20/2012 12.11 85.02 NS NS NS NS NS NS NS NS NS NS
ECS-1 11/8/99 11.48 85.71 <0.075 <0.025 <0.025 <5.0 <5.0 <5.0 <5.0 <5.0 <10 ND
97.19 12/19/02 11.60 85.59 <0.075 <0.025 <0.025 <5.0 <5.0 <5.0 <5.0 <5.0 <10 ND
97.02 9/8/05 11.78 85.38 <0.075 <0.025 <0.025 <5.0 <5.0 <5.0 <5.0 <5.0 <10 ND
97.16 1/25/06 8.49 88.67 0.263 <0.025 <0.025 <5.0 <5.0 6.5 <5.0 <5.0 <10 ND
4/11/06 11.38 85.78 <0.075 <0.025 <0.025 <5.0 <5.0 <5.0 <5.0 <5.0 <10 ND
7/20/06 11.72 85.44 <0.075 <0.025 <0.025 <5.0 <5.0 <5.0 <5.0 <5.0 <10 ND
10/10/06 12.21 84.95 NS NS NS NS NS NS NS NS NS ND
1/25/07 11.34 85.82 <0.075 <0.025 <0.025 <5.0 <5.0 <5.0 <5.0 <5.0 <10 ND
4/24/07 9.89 87.27 NS NS NS NS NS NS NS NS NS NA
10/4/07 12.74 84.42 <0.075 <0.025 <0.025 <5.0 <5.0 <5.0 <5.0 <5.0 <10 ND
3/11/08 9.82 87.34 <0.075 <0.025 <0.025 <5.0 <5.0 8.5 <5.0 <5.0 <10 ND
5/1/08 11.50 85.66 <0.075 <0.025 <0.025 <5.0 <5.0 8.5 <5.0 <5.0 <10 ND
11/24/08 11.61 85.55 <0.075 <0.025 <0.025 <5.0 <5.0 <5.0 <5.0 <5.0 <10.0 ND
2/18/09 11.60 85.56 <0.075 <0.025 <0.025 <5.0 <5.0 <5.0 <5.0 <5.0 <10.0 ND
8/24/09 10.47 86.69 <0.075 <0.025 <0.025 <5.0 <5.0 <5.0 <5.0 <5.0 <10.0 ND
2/11/10 11.60 85.56 <0.075 <0.025 <0.025 <5.0 <5.0 <5.0 <5.0 <5.0 <10.0 ND
9/9/10 12.61 84.55 <0.075 <0.025 <0.025 <5.0 <5.0 <5.0 <5.0 <5.0 <10.0 ND
3/28/11 NM NM NS NS NS NS NS NS NS NS NS NS
9/14/11 9.51 87.65 <0.075 <0.025 <0.025 <5.0 <5.0 <5.0 <5.0 <5.0 <10.0 ND
2/15/12 11.27 85.89 <0.075 <0.025 <0.025 <5.0 <5.0 <5.0 <5.0 <5.0 <10.0 ND
8/20/12 12.07 85.09 <0.075 <0.025 <0.025 <5.0 <5.0 <5.0 <5.0 <5.0 <10.0 ND
*ECS-2 11/8/99 12.35 85.41 <1.50 <0.500 5.0 <100 1,600 190 260 670 7,400 9,670
97.76 12/19/02 12.56 85.20 0.501 <0.100 0.54 <20 420 5,700 34 1,000 1,920 3,340
97.60 9/8/05 12.44 85.16 2.35 1.52 3.13 <5.0 463 3,330 92 754 2,396 3,613
11/1/05 10.65 86.95 2.37 0.44 2.81 <50 366 4,590 <50 425 1,502 2,293
1/25/06 10.16 87.44 5.23 1.39 4.31 32.2 781 1,970 163 778 3,827 5,418
4/10/06 12.09 85.51 9.29 3.63 6.64 42.1 1,040 1,590 244 600 5,820 7,502
7/20/06 12.42 85.18 2.70 2.85 4.53 <100 1,090 31,700 240 670 5,460 7,220
10/10/06 12.92 84.68 <0.750 0.763 1.82 <50 232 4,860 <50 81.9 951 1,265
1/25/07 12.06 85.54 0.793 0.533 1.01 <10 139 1,180 29.9 79.1 642 860
4/24/07 10.39 87.21 1.92 1.12 2.39 <25 479 2,080 81.6 114 2,113 2,706
10/4/07 13.50 84.10 1.53 0.544 1.19 8.2 247 350 66.7 <5.0 399 654
3/11/08 10.38 87.22 0.623 <0.025 <0.025 <5.0 <5.0 <5.0 <5.0 <5.0 <10 ND
5/1/08 11.13 86.47 1.60 <0.025 0.0477 <5.0 <5.0 <5.0 <5.0 <5.0 7.6 7.6
11/24/08 12.24 85.36 4.81 2.980 3.3 <10.0 232 54.7 87.9 <10.0 3,590 3,822
2/18/09 12.23 85.37 2.37 1.020 2.98 16.7 101 <10.0 56.7 10.3 1,999 2,127
8/24/09 11.07 86.53 3.04 2.870 2.28 53.5 243 185.0 112.0 31.9 4,720 5,048
10/13/09 12.15 85.45 0.74 3.650 1.73 48.9 333 130.0 121.0 36.9 4,990 5,409
2/11/10 12.76 84.84 0.438 0.828 0.514 <10.0 <10.0 <10.0 12.0 <10.0 69.8 69.8
9/9/10 13.37 84.23 1.460 2.780 1.520 <20.0 182 36.7 56.8 <20.0 1,056 1,238
3/28/11 10.88 86.72 2.420 6.310 3.650 21.0 209 <20.0 131 <20.0 2,013 2,243
9/14/11 10.00 87.60 0.712 0.757 0.660 7.5 30.1 16.4 22.1 31.6 762 831
9/14/11D 10.00 87.60 0.774 0.592 0.525 <10.0 23.2 15.0 20.9 23.4 579 626
2/15/12 11.82 85.78 1.210 1.790 1.270 6.0 48.8 25.8 22.6 26.3 432 513
2/15/12D 11.82 85.78 1.950 2.260 1.610 <20.0 58.9 32.8 26.5 37.4 532 628
8/20/12 12.86 84.74 0.348 0.553 0.670 <5.0 <5.0 <5.0 <5.0 8.5 34.0 42.5
8/20/12D 12.86 84.74 0.319 0.540 0.632 <10.0 <10.0 <10.0 <10.0 10.3 11.5 21.8
TABLE 3
RESULTS OF ANALYSIS OF GROUNDWATER SAMPLES FOR VPH
O'Connell Oil Associates (Mobil Station)
730 East Street, Pittsfield, MA
MassDEP RTN 1-13347
Results reported in milligrams per liter (mg/L) or micrograms per liter (mg/L), as noted
MCP Method 1 Standards

Monitoring Well
& Elevation (ft)Sampling Date
Depth to
Water (ft)
Groundwater
Elevation (ft)
C5 - C8
Aliphatics
(mg/L)
C9 - C12
Aliphatics
(mg/L)
C9 - C10
Aromatics
(mg/L)
Benzene (µg/L)Ethyl-benzene
(µg/L)MtBE (µg/L)
Naphthalene
(µg/L)
Toluene
(ug/L)
Xylenes
(µg/L)
Σ BTEX
(µg/L)
GW-2: 3 5 7 2,000 20,000 50,000 1,000 50,000 9,000 NA
GW-3: 50 50 50 10,000 5,000 50,000 20,000 40,000 5,000 NA
TABLE 3
RESULTS OF ANALYSIS OF GROUNDWATER SAMPLES FOR VPH
O'Connell Oil Associates (Mobil Station)
730 East Street, Pittsfield, MA
MassDEP RTN 1-13347
Results reported in milligrams per liter (mg/L) or micrograms per liter (mg/L), as noted
MCP Method 1 Standards
ECS-3 11/8/99 12.58 85.37 <1.50 <0.500 9.2 <100 2,700 <100 370 10,500 12,200 25,400
97.95 12/19/02 12.70 85.25 0.594 <0.100 2.22 <100 1,400 240 100 2,900 4,900 9,200
97.76 9/8/05 12.65 85.11 15.1 5.5 11.0 55 3,010 821 468 3,210 14,190 20,465
11/1/05 10.87 86.89 2.54 0.13 1.88 10.2 536 <5.0 83 565 2,250 3,361
1/25/06 NG NA NS NS NS NS NS NS NS NS NS NA
4/11/06 12.34 85.42 27.1 5.35 12.3 145 3,820 546 491 2,390 16,930 23,285
7/20/06 12.56 85.20 3.50 2.40 3.15 <20 744 70 131 564 2,909 4,217
10/10/06 13.17 84.59 2.93 1.23 2.98 15.1 1,280 <10 150 1,110 5,570 7,975
1/25/07 12.27 85.49 2.62 0.711 3.02 11.3 865 65.6 137 168 3,694 4,738
4/24/07 10.62 87.14 0.298 0.169 0.446 <5.0 112 7.5 14 87.1 510 709
10/3/07 13.73 84.03 0.403 0.115 0.180 <5.0 52.7 <5.0 8.6 <5.0 131.9 185
3/11/08 10.68 87.08 0.812 0.291 0.735 <5.0 342 <5.0 27.6 29.4 618 989
5/1/08 11.42 86.34 6.75 2.86 10.00 <50.0 2,220 <50.0 355 387.0 9,180 11,787
11/24/08 12.51 85.25 11.70 6.04 6.32 <20.0 1,540 <20 280 297.0 6,740 8,577
4/9/09 11.48 86.28 10.10 7.46 6.61 <50 1,280 <50 250 127.0 6,670 8,077
8/24/09 11.34 86.42 12.40 12.10 9.82 <100 3,920 <100 587 393.0 21,330 25,643
10/13/09 12.43 85.33 <1.5 12.10 5.76 <100 2,160 <100 442 184.0 6,550 8,894
2/11/10 12.43 85.33 7.66 11.40 7.33 <100 990 <100 282 <100 6,400 7,390
9/9/10 13.63 84.13 1.10 0.925 0.500 <20.0 282 <20.0 36 <20.0 1,349 1,631
3/28/11 11.15 86.61 0.192 0.126 0.0713 <5.0 71 <5.0 <5.0 <5.0 231 302
9/14/11 10.24 87.52 <0.075 1.240 1.130 <5.0 336 <5.0 64.6 <5.0 1,224 1,560
2/15/12 12.09 85.67 0.555 0.716 0.495 <10.0 108 <10.8 36.7 10.2 445 563
8/20/12 13.10 84.66 0.137 0.500 0.644 <5.0 39 <5.1 12.2 <15.0 180 219
*ECS-4 11/8/99 11.78 85.28 0.42 <0.025 0.45 <5.0 340 19 20 <5.0 460 800
97.06 12/19/02 12.45 84.61 NS (DRY) NS (DRY) NS (DRY) NS (DRY) NS (DRY) NS (DRY) NS (DRY) NS (DRY) NS (DRY) NA
96.75 9/8/05 11.94 84.81 NS (DRY) NS (DRY) NS (DRY) NS (DRY) NS (DRY) NS (DRY) NS (DRY) NS (DRY) NS (DRY) NA
1/25/06 NG NA NS NS NS NS NS NS NS NS NS NA
4/10/06 11.51 85.24 <0.075 <0.025 <0.025 <5.0 <5.0 <5.0 <5.0 <5.0 <10 ND
7/20/06 11.96 84.79 <0.075 <0.025 <0.025 <5.0 <5.0 10.9 <5.0 <5.0 <10 ND
10/10/06 12.43 84.32 NS NS NS NS NS NS NS NS NS NA
4/24/07 9.88 86.87 <0.075 <0.025 <0.025 <5.0 <5.0 <5.0 <5.0 <5.0 <10 ND
10/4/07 NM NA NS NS NS NS NS NS NS NS NS NS
3/11/08 9.93 86.82 <0.075 <0.025 <0.025 <5.0 <5.0 29.1 <5.0 <5.0 <10 ND5/1/08 10.71 86.04 <0.075 <0.025 <0.025 <5.0 <5.0 5.6 <5.0 <5.0 <10 ND
11/24/08 11.77 84.98 <0.075 <0.025 <0.025 <5.0 <5.0 <5.0 <5.0 <5.0 <10 ND4/9/09 10.72 86.03 <0.075 <0.025 <0.025 <5.0 <5.0 <5.0 <5.0 <5.0 <10 ND8/24/09 10.58 86.17 <0.075 <0.025 <0.025 <5.0 <5.0 <5.0 <5.0 <5.0 <10 ND
10/13/09 11.69 85.06 <0.075 <0.025 <0.025 <5.0 <5.0 <5.0 <5.0 <5.0 <10 ND3/28/11 10.38 86.37 <0.075 <0.025 <0.025 <5.0 <5.0 <5.0 <5.0 <5.0 <10 ND9/14/11 9.41 87.34 NS NS NS NS NS NS NS NS NS NS2/15/11 11.22 85.53 NS NS NS NS NS NS NS NS NS NS8/30/12 12.47 84.28 <0.075 <0.025 <0.025 <5.0 <5.0 <5.0 <5.0 <5.0 <10 ND

Monitoring Well
& Elevation (ft)Sampling Date
Depth to
Water (ft)
Groundwater
Elevation (ft)
C5 - C8
Aliphatics
(mg/L)
C9 - C12
Aliphatics
(mg/L)
C9 - C10
Aromatics
(mg/L)
Benzene (µg/L)Ethyl-benzene
(µg/L)MtBE (µg/L)
Naphthalene
(µg/L)
Toluene
(ug/L)
Xylenes
(µg/L)
Σ BTEX
(µg/L)
GW-2: 3 5 7 2,000 20,000 50,000 1,000 50,000 9,000 NA
GW-3: 50 50 50 10,000 5,000 50,000 20,000 40,000 5,000 NA
TABLE 3
RESULTS OF ANALYSIS OF GROUNDWATER SAMPLES FOR VPH
O'Connell Oil Associates (Mobil Station)
730 East Street, Pittsfield, MA
MassDEP RTN 1-13347
Results reported in milligrams per liter (mg/L) or micrograms per liter (mg/L), as noted
MCP Method 1 Standards
*ECS-5 11/8/99 12.26 85.47 1.2 <0.100 5.0 <20 1,400 <20 240 110 6,000 7,51097.73 12/19/02 12.54 85.19 0.105 <0.025 0.404 <5.0 70 <5.0 12 <5.0 339 40997.56 9/8/05 12.44 85.12 0.403 0.438 0.948 <5.0 48 <5.0 27 5.7 208 262
1/25/06 10.22 87.34 0.480 0.414 0.988 <5.0 28.7 <5.0 20.5 <5.0 109 1384/11/06 11.15 86.41 0.330 0.336 0.678 <5.0 13.2 <5.0 10.1 <5.0 52.4 667/20/06 12.48 85.08 0.187 0.286 0.414 <5.0 <5.0 <5.0 6.2 <5.0 14.6 15
10/10/06 12.98 84.58 NS NS NS NS NS NS NS NS NS NA4/24/07 10.43 87.13 NS NS NS NS NS NS NS NS NS NA10/4/07 13.57 83.99 <0.075 <0.025 0.0735 <5.0 <5.0 <5.0 <5.0 <5.0 <10 ND3/11/08 10.54 87.02 0.335 0.156 0.430 <5.0 9.5 <5.0 7.8 <5.0 35.7 455/1/08 11.27 86.29 NS NS NS NS NS NS NS NS NS NA
11/24/08 12.38 85.18 NS NS NS NS NS NS NS NS NS NA10/21/10 12.58 84.98 0.0994 0.260 0.177 <5.0 <5.0 <5.0 <5.0 <5.0 <10.0 ND3/28/11 11.04 86.52 0.274 0.490 0.282 <5.0 <5.0 <5.0 <5.0 <5.0 <10.0 ND9/14/11 10.17 87.39 0.208 0.296 0.254 <5.0 <5.0 <5.0 <5.0 <5.0 <10.0 ND2/15/12 12.00 85.56 <0.075 0.0734 0.0524 <5.0 <5.0 <5.0 <5.0 <5.0 <10.0 ND8/20/12 13.03 84.53 <0.075 0.111 0.134 <5.0 <5.0 <5.0 <5.0 <5.0 <10.0 ND
*ECS-6 2/13/03 10.74 85.84 <0.075 <0.025 0.026 <5.0 <5.0 <5.0 <5.0 <5.0 <10 ND96.58 9/8/05 11.34 85.00 4.15 1.90 4.96 <20 1,170 <20 167 53 4,183 5,40696.34 11/1/05 9.57 86.77 0.885 0.264 1.37 <5.0 172 13.4 41.0 15.8 564 752
1/25/06 9.10 87.24 2.24 0.969 2.17 <10.0 390 51.8 45.4 23.3 1,029 1,4421/25/06D NA NA 2.22 1.04 2.12 <10.0 363 50.2 57.1 14.7 962 1,3404/10/06 11.05 85.29 0.944 0.512 0.985 <5.0 130 <5.0 30.3 12.6 352 4957/20/06 11.40 84.94 0.095 0.049 0.091 <5.0 <5.0 <5.0 <5.0 <5.0 <15 ND
7/20/06D NA NA <0.075 0.045 0.067 <5.0 <5.0 <5.0 <5.0 <5.0 <15 ND10/10/06 11.89 84.45 0.380 0.089 0.183 <5.0 123 26.4 8.3 6.4 286 4151/25/07 10.99 85.35 0.653 0.385 1.570 <5.0 172 128.0 40.9 7.5 568.1 7484/24/07 9.35 86.99 0.152 0.109 0.297 <5.0 91 40.6 14.7 <5.0 83.2 17410/4/07 12.46 83.88 0.194 0.0621 0.0638 <5.0 <5.0 24.8 <5.0 <5.0 <10.0 ND3/11/08 9.43 86.91 2.38 1.16 2.91 <25 545 376.0 111.0 <25 2,054 2,5995/1/08 10.16 86.18 3.37 2.14 3.71 <25.0 572 39.5 98.1 62.5 2,789 3,424
11/24/08 11.26 85.08 0.623 0.436 1.19 <5.0 26.7 <5.0 11.1 11.4 108.6 1472/18/09 11.25 85.09 1.390 1.550 4.08 <20.0 21.0 <20.0 42.6 21.4 130.5 1738/24/09 10.06 86.28 <0.075 0.0726 0.0532 <5.0 <5.0 <5.0 <5.0 <5.0 13.1 13.12/11/10 11.18 85.16 <0.075 <0.025 <0.025 <5.0 <5.0 <5.0 <5.0 <5.0 <10.0 ND9/9/10 12.36 83.98 0.168 0.242 0.129 <5.0 11.4 17.8 <5.0 <5.0 37.3 48.73/28/11 9.91 86.43 0.686 0.350 0.190 16.8 <5.0 <5.0 <5.0 <5.0 21.5 38.39/14/11 9.04 87.30 0.314 0.249 0.196 <5.0 <5.0 22.0 5.9 5.6 <10.0 5.62/15/12 10.82 85.52 0.534 0.187 0.117 <5.0 <5.0 9.5 <5.0 24.7 <10.0 24.78/20/12 11.85 84.49 0.195 0.501 0.589 <5.0 9.9 17.5 8.4 6.1 30.0 46.0
ECS-7 2/13/03 10.14 85.83 <0.075 <0.025 <0.025 <5.0 <5.0 <5.0 <5.0 <5.0 <10 ND95.97 9/8/05 9.75 85.79 <0.075 <0.025 <0.025 <5.0 <5.0 <5.0 <5.0 <5.0 <10 ND95.54 1/25/06 9.05 86.49 <0.075 <0.025 <0.025 <5.0 <5.0 <5.0 <5.0 <5.0 <10 ND
4/10/06 9.90 85.64 <0.075 <0.025 <0.025 <5.0 <5.0 <5.0 <5.0 <5.0 <10 ND7/20/06 9.78 85.76 NS NS NS NS NS NS NS NS NS NA
10/10/06 9.96 85.58 NS NS NS NS NS NS NS NS NS NA
4/24/07 9.47 86.07 NS NS NS NS NS NS NS NS NS NA
10/4/07 10.41 85.13 <0.075 <0.025 <0.025 <5.0 <5.0 <5.0 <5.0 <5.0 <10 ND
3/11/08 9.24 86.30 NS NS NS NS NS NS NS NS NS NA
5/1/08 9.62 85.92 NS NS NS NS NS NS NS NS NS NA
11/24/08 10.79 84.75 NS NS NS NS NS NS NS NS NS NA
9/14/11 8.71 86.83 NS NS NS NS NS NS NS NS NS NA
2/15/12 9.17 86.37 NS NS NS NS NS NS NS NS NS NA
8/30/12 9.26 86.28 <0.075 <0.025 <0.025 <5.0 <5.0 <5.0 <5.0 <5.0 <10 ND

Monitoring Well
& Elevation (ft)Sampling Date
Depth to
Water (ft)
Groundwater
Elevation (ft)
C5 - C8
Aliphatics
(mg/L)
C9 - C12
Aliphatics
(mg/L)
C9 - C10
Aromatics
(mg/L)
Benzene (µg/L)Ethyl-benzene
(µg/L)MtBE (µg/L)
Naphthalene
(µg/L)
Toluene
(ug/L)
Xylenes
(µg/L)
Σ BTEX
(µg/L)
GW-2: 3 5 7 2,000 20,000 50,000 1,000 50,000 9,000 NA
GW-3: 50 50 50 10,000 5,000 50,000 20,000 40,000 5,000 NA
TABLE 3
RESULTS OF ANALYSIS OF GROUNDWATER SAMPLES FOR VPH
O'Connell Oil Associates (Mobil Station)
730 East Street, Pittsfield, MA
MassDEP RTN 1-13347
Results reported in milligrams per liter (mg/L) or micrograms per liter (mg/L), as noted
MCP Method 1 Standards
ECS-8 2/13/03 11.63 84.09 3.6 3.7 3.4 <5.0 1,100 40 120 160 4,400 5,660
95.72 9/8/05 10.35 85.08 <0.075 <0.025 <0.025 <5.0 <5.0 <5.0 <5.0 <5.0 <10 ND
95.43 9/8/05D NG NA <0.075 <0.025 <0.025 <5.0 <5.0 <5.0 <5.0 <5.0 <10 ND
1/25/06 NG NA NS NS NS NS NS NS NS NS NS NA
4/11/06 9.98 85.45 <0.075 <0.025 <0.025 <5.0 <5.0 <5.0 <5.0 <5.0 <10 ND
7/20/06 10.28 85.15 NS NS NS NS NS NS NS NS NS NA
10/10/06 10.81 84.62 NS NS NS NS NS NS NS NS NS NA
4/24/07 8.19 87.24 NS NS NS NS NS NS NS NS NS NA
10/4/07 11.45 83.98 <0.075 <0.025 <0.025 <5.0 <5.0 <5.0 <5.0 <5.0 <10 ND
3/11/08 NG NA NS NS NS NS NS NS NS NS NS NA
3/24/08 8.56 86.87 <0.075 <0.025 <0.025 <5.0 <5.0 <5.0 <5.0 <5.0 <10.0 ND
5/1/08 9.02 86.41 <0.075 <0.025 <0.025 <5.0 <5.0 <5.0 <5.0 <5.0 <10.0 ND
11/24/08 10.12 85.31 <0.075 <0.025 <0.025 <5.0 <5.0 <5.0 <5.0 <5.0 <10.0 ND
4/9/09 9.02 86.41 <0.075 <0.025 <0.025 <5.0 <5.0 <5.0 <5.0 <5.0 <10.0 ND
8/24/09 8.98 86.45 <0.075 <0.025 <0.025 <5.0 <5.0 <5.0 <5.0 <5.0 <10.0 ND
10/13/09 10.05 85.38 <0.075 <0.025 <0.025 <5.0 <5.0 <5.0 <5.0 <5.0 <10.0 ND
9/9/10 11.29 84.14 <0.075 <0.025 <0.025 <5.0 <5.0 <5.0 <5.0 <5.0 <10.0 ND
3/28/11 8.80 86.63 <0.075 <0.025 <0.025 <5.0 <5.0 <5.0 <5.0 <5.0 <10.0 ND
9/14/11 7.89 87.54 NS NS NS NS NS NS NS NS NS NA
2/15/12 9.56 85.87 NS NS NS NS NS NS NS NS NS NA
8/30/12 10.77 84.66 <0.075 <0.025 <0.025 <5.0 <5.0 <5.0 <5.0 <5.0 <10.0 ND
ECS-9 2/13/03 10.82 84.40 0.540 0.240 0.300 <5.0 <5.0 16 <5.0 <5.0 85 85.0
95.22 9/19/05 10.91 84.08 0.652 0.611 1.41 9.6 60.7 831 40.2 6.7 730 807
94.99 1/25/06 8.38 86.61 0.660 0.429 1.11 <10 57.9 1,090 26.6 12.7 568 639
4/11/06 10.33 84.66 1.73 0.770 1.53 <25 98.3 3,970 47.3 <25 915 1,013.3
7/20/06 10.72 84.27 0.913 0.970 1.24 <25 51.5 1,980 51.9 <25 626 678
10/10/06 11.12 83.87 NS NS NS NS NS NS NS NS NS NA
1/25/07 10.31 84.68 0.356 0.522 0.949 <10 28.5 1,370 28.8 <10 336 365
4/24/07 8.57 86.42 <0.075 0.262 0.571 <5.0 12.6 1,540 15.1 5.3 145 163
10/4/07 11.79 83.20 <0.75 0.399 1.290 <50 <50 4,260 <50 <50 <100 ND
3/11/08 8.63 86.36 <0.075 0.140 0.400 5.6 <5.0 666 11.6 <5.0 38.7 44.3
5/1/08 9.47 85.52 <0.075 0.0523 0.0995 <5.0 <5.0 335 5.0 12.7 31.9 44.6
11/24/08 10.60 84.39 0.377 0.3080 0.3480 <5.0 <5.0 133 8.8 <5.0 52.8 52.8
2/18/09 10.62 84.37 0.314 0.2110 0.5800 <5.0 <5.0 149 18.5 <5.0 38.5 38.5
8/24/09 9.33 85.66 <0.075 0.0836 0.0625 <5.0 <5.0 56 <5.0 <5.0 <10.0 ND
2/11/10 10.49 84.50 <0.075 0.0745 0.0392 <5.0 <5.0 28.5 <5.0 <5.0 <10.0 ND
9/9/10 11.64 83.35 0.155 0.1300 0.0618 <5.0 <5.0 11.7 <5.0 <5.0 <10.0 ND
3/28/11 9.28 85.71 <0.075 <0.025 <0.025 <5.0 <5.0 <5.0 <5.0 <5.0 <10.0 ND
9/14/11 8.41 86.58 <0.075 <0.025 <0.025 <5.0 <5.0 <5.0 <5.0 <5.0 <10.0 ND
2/15/12 10.23 84.76 <0.075 <0.025 0.0377 <5.0 <5.0 <5.0 <5.0 <5.0 <10.0 ND
8/30/12 11.35 83.64 <0.075 <0.025 <0.025 <5.0 <5.0 <5.0 <5.0 <5.0 <10.0 ND

Monitoring Well
& Elevation (ft)Sampling Date
Depth to
Water (ft)
Groundwater
Elevation (ft)
C5 - C8
Aliphatics
(mg/L)
C9 - C12
Aliphatics
(mg/L)
C9 - C10
Aromatics
(mg/L)
Benzene (µg/L)Ethyl-benzene
(µg/L)MtBE (µg/L)
Naphthalene
(µg/L)
Toluene
(ug/L)
Xylenes
(µg/L)
Σ BTEX
(µg/L)
GW-2: 3 5 7 2,000 20,000 50,000 1,000 50,000 9,000 NA
GW-3: 50 50 50 10,000 5,000 50,000 20,000 40,000 5,000 NA
TABLE 3
RESULTS OF ANALYSIS OF GROUNDWATER SAMPLES FOR VPH
O'Connell Oil Associates (Mobil Station)
730 East Street, Pittsfield, MA
MassDEP RTN 1-13347
Results reported in milligrams per liter (mg/L) or micrograms per liter (mg/L), as noted
MCP Method 1 Standards
ECS-10 2/13/03 10.11 85.79 <0.075 <0.025 <0.025 <5.0 <5.0 <5.0 <5.0 <5.0 <10 ND
95.90 9/8/05 9.59 86.16 <0.075 <0.025 <0.025 <5.0 <5.0 <5.0 <5.0 <5.0 <10 ND
95.75 1/25/06 8.57 87.18 <0.075 <0.025 <0.025 <5.0 <5.0 <5.0 <5.0 <5.0 <10 ND
4/10/06 9.52 86.23 <0.075 <0.025 <0.025 <5.0 <5.0 <5.0 <5.0 <5.0 <10 ND
7/20/06 9.42 86.33 NS NS NS NS NS NS NS NS NS NA
10/10/06 9.64 86.11 NS NS NS NS NS NS NS NS NS NA
4/24/07 8.53 87.22 NS NS NS NS NS NS NS NS NS NA
10/4/07 10.18 85.57 <0.075 <0.025 <0.025 <5.0 <5.0 <5.0 <5.0 <5.0 <10.0 ND
3/11/08 5.74 90.01 <0.075 <0.025 <0.025 <5.0 <5.0 <5.0 <5.0 <5.0 <10.0 ND
5/1/08 8.87 86.88 <0.075 <0.025 <0.025 <5.0 <5.0 <5.0 <5.0 <5.0 <10.0 ND
11/24/08 9.40 86.35 <0.075 <0.025 <0.025 <5.0 <5.0 <5.0 <5.0 <5.0 <10.0 ND
2/18/09 9.62 86.13 <0.075 <0.025 <0.025 <5.0 <5.0 <5.0 <5.0 <5.0 <10.0 ND
8/24/09 8.75 87.00 <0.075 <0.025 <0.025 <5.0 <5.0 <5.0 <5.0 <5.0 <10.0 ND
2/11/10 9.34 86.41 <0.075 <0.025 <0.025 <5.0 <5.0 <5.0 <5.0 <5.0 <10.0 ND
9/9/10 9.55 86.20 <0.075 <0.025 <0.025 <5.0 <5.0 <5.0 <5.0 <5.0 <10.0 ND
3/28/11 8.70 87.05 <0.075 <0.025 <0.025 <5.0 <5.0 <5.0 <5.0 <5.0 <10.0 ND
9/14/11 8.15 87.60 NS NS NS NS NS NS NS NS NS NA
2/15/12 NM NM NS NS NS NS NS NS NS NS NS NA
8/30/12 9.12 86.63 <0.075 <0.025 <0.025 <5.0 <5.0 <5.0 <5.0 <5.0 <10.0 ND
ECS-11 1/25/06 9.28 87.42 1.08 0.056 0.059 18.0 <10 1,040 12.5 <10 <30 18.0
96.70 4/10/06 10.94 85.76 0.226 <0.025 0.029 <5.0 <5.0 277 <5.0 <5.0 <10.0 ND
7/20/06 11.31 85.39 0.164 <0.025 0.025 <5.0 <5.0 243 <5.0 <5.0 <10.0 ND
10/10/06 11.81 84.89 0.261 0.047 0.077 <5.0 <5.0 598 <5.0 <5.0 <10.0 ND
1/25/07 10.98 85.72 0.133 <0.025 0.041 <5.0 <5.0 359 <5.0 <5.0 <10.0 ND
4/24/07 9.35 87.35 0.369 <0.025 0.026 5.8 <5.0 628 <5.0 5.1 <10.0 10.9
10/4/07 12.47 84.23 0.899 0.124 0.072 5 <5.0 207 <5.0 <5.0 <10.0 5.0
3/11/08 9.36 87.34 0.982 0.029 0.093 14.5 <5.0 387 6.9 <5.0 <10.0 14.5
5/1/08 10.28 86.42 0.639 0.0685 0.0669 <5.0 <5.0 81.4 13.0 5.7 <10.0 5.7
11/24/08 11.21 85.49 0.376 0.0384 0.0305 5 <5.0 20.9 <5.0 <5.0 <10.0 5.0
2/18/09 11.25 85.45 0.497 0.0352 0.0521 6.1 <5.0 24.2 <5.0 5.1 <10.0 11.2
8/24/09 10.08 86.62 0.34 0.0336 <0.025 6.3 <5.0 53 <5.0 <5.0 <10.0 6.3
10/13/09 11.20 85.50 0.452 0.0434 <0.025 16.3 <5.0 73.3 <5.0 <5.0 <10.0 16.3
2/11/10 11.26 85.44 0.335 0.0467 <0.025 8.1 <5.0 90.7 <5.0 <5.0 <10.0 8.1
9/9/10 12.48 84.22 0.361 0.0547 <0.025 14.9 <5.0 41.3 <5.0 <5.0 <10.0 14.9
3/28/11 9.94 86.76 0.746 0.0609 0.0273 5.6 <5.0 <5.0 <5.0 <5.0 <10.0 5.6
9/14/11 9.11 87.59 0.536 0.0329 <0.025 6.3 <5.0 18.5 <5.0 <5.0 <10.0 6.3
2/15/12 10.89 85.81 0.559 0.0894 0.0357 <5.0 <5.0 <5.0 <5.0 <5.0 <10.0 ND
8/20/12 11.86 84.84 0.275 <0.025 0.0389 5.8 <5.0 33.1 <5.0 <5.0 <10.0 5.8

Monitoring Well
& Elevation (ft)Sampling Date
Depth to
Water (ft)
Groundwater
Elevation (ft)
C5 - C8
Aliphatics
(mg/L)
C9 - C12
Aliphatics
(mg/L)
C9 - C10
Aromatics
(mg/L)
Benzene (µg/L)Ethyl-benzene
(µg/L)MtBE (µg/L)
Naphthalene
(µg/L)
Toluene
(ug/L)
Xylenes
(µg/L)
Σ BTEX
(µg/L)
GW-2: 3 5 7 2,000 20,000 50,000 1,000 50,000 9,000 NA
GW-3: 50 50 50 10,000 5,000 50,000 20,000 40,000 5,000 NA
TABLE 3
RESULTS OF ANALYSIS OF GROUNDWATER SAMPLES FOR VPH
O'Connell Oil Associates (Mobil Station)
730 East Street, Pittsfield, MA
MassDEP RTN 1-13347
Results reported in milligrams per liter (mg/L) or micrograms per liter (mg/L), as noted
MCP Method 1 Standards
ECS-12 1/25/06 8.64 87.51 14.1 6.04 13.6 47.0 1,960 <20 399 54.0 9,690 11,751
96.15 4/10/06 10.60 85.55 5.94 6.69 12.9 <10 86.6 20.9 98.9 37.3 437 560.6
7/20/06 10.95 85.20 3.38 4.39 6.60 <10 19.9 14.7 53.9 32.4 59 111.3
10/10/06 11.42 84.73 2.72 3.07 6.17 <10 53.0 32.2 69.3 33.7 270 356.9
10/10/06D NA NA 4.14 3.21 7.13 <10 53.9 45.9 102 70.9 288 412.4
1/25/07 12.55 83.60 3.22 2.07 3.82 <5.0 29.8 17.1 63.8 50 149.6 229.4
1/25/07D 12.55 83.60 3.03 2.14 4.10 <25 30 <25.0 64.5 40.3 147 217.3
4/24/07 8.83 87.32 3.95 1.20 4.31 <10 18.8 <10 74.6 56.2 29.7 104.7
4/24/07D 8.83 87.32 2.06 1.46 2.88 <5.0 11.7 <5.0 54.5 33.3 17.5 62.5
10/4/07 12.04 84.11 2.88 1.44 3.44 5.7 12.2 <5.0 54 <5.0 30.3 48.2
10/4/07D 12.04 84.11 2.21 1.10 2.74 <5.0 10.7 <5.0 46.9 <5.0 29.9 40.6
3/11/08 NG NA NS NS NS NS NS NS NS NS NS NA
3/24/08 9.15 87.00 2.20 1.76 1.95 <10 17.1 <10 60 <10 67.9 85.0
3/24/08D 9.15 87.00 2.39 2.33 2.68 <10 24.5 <10 76 <10 78.7 103.2
5/1/08 9.71 86.44 2.47 1.58 4.48 <25.0 43.7 <25.0 96.9 <25.0 151.3 195.0
5/1/08D 9.71 86.44 2.48 1.48 4.48 <25.0 29.4 <25.0 87.4 <25.0 66.5 95.9
11/24/08 10.79 85.36 1.76 1.61 1.42 <5.0 <5.0 <5.0 65.4 22.9 20.4 43.3
11/24/08D 10.79 85.36 1.67 1.28 1.12 <5.0 <5.0 <5.0 45 19.9 17.6 37.5
4/9/09 9.77 86.38 1.55 2.87 2.16 <25 <25 <25 48.2 <25 <50 ND
4/9/09D 9.77 86.38 1.58 2.88 2.15 <25 <25 <25 49.6 <25 <50 ND
8/24/09 9.62 86.53 1.20 1.55 1.13 <5.0 <5.0 <5.0 39.4 19.8 <10 19.8
8/24/09D 9.62 86.53 1.19 1.55 1.14 <5.0 11.8 <5.0 46.8 20.3 53.5 85.6
10/13/09 10.73 85.42 1.19 1.55 0.915 <5.0 <5 <5.0 60.7 20.3 <10.0 20.3
10/13/09D 10.73 85.42 1.37 1.29 0.605 <10 <10 <10 41.1 24.3 <20 24.3
2/11/10 10.69 85.46 1.07 1.43 0.818 <5.0 <5.0 20.5 39.9 19.4 <10.0 19.4
2/11/10D 10.69 85.46 1.01 1.36 0.779 <5.0 <5.0 18 39.8 17.6 <10.0 17.6
9/9/10 11.92 84.23 0.84 0.969 0.466 <5.0 <5.0 <5.0 25.6 14.7 <10.0 14.7
9/9/10D 11.92 84.23 1.73 1.41 0.663 <20.0 <20.0 <20.0 37.4 21.3 <40.0 21.3
3/28/11 9.43 86.72 1.27 1.42 0.739 <5.0 <5.0 <5.0 35.8 <5.0 <10.0 ND
3/28/11D 9.43 86.72 1.23 1.43 0.746 <5.0 <5.0 <5.0 35.7 <5.0 <10.0 ND
9/14/11 8.55 87.60 1.46 1.46 1.26 <10.0 <10.0 11.3 32.6 27.2 <20.0 27.2
2/15/12 10.29 85.86 2.17 2.53 1.74 <20.0 <20.0 <20.0 49.0 33.2 <40.0 33.2
8/20/12 11.42 84.73 0.793 1.24 1.41 <10.0 <10.0 <10.0 30.5 13.8 <20.0 13.8
ECS-13 1/25/06 NG NA NS NS NS NS NS NS NS NS NS NA
97.66 4/10/06 12.20 85.46 28.9 5.66 11.0 77.8 4,780 342 566 9,600 22,430 36,888
7/20/06 12.53 85.13 0.727 0.454 0.809 <5.0 223 <5.0 36.5 9.2 753 985
10/10/06 13.01 84.65 <0.075 <0.025 <0.025 <5.0 <5.0 <5.0 <5.0 <5.0 <10 ND
1/25/07 12.18 85.48 <0.075 <0.025 <0.025 <5.0 <5.0 36.3 <5.0 <5.0 <10 ND
4/24/07 10.51 87.15 <0.075 <0.025 <0.025 <5.0 <5.0 <5.0 <5.0 <5.0 <10 ND
10/4/07 13.64 84.02 0.598 0.434 1.29 <5.0 451 <5.0 33.0 11.1 206.3 668
3/11/08 10.80 86.86 0.50 0.345 0.704 <5.0 266 <5.0 11.4 <5.0 22.9 289
5/1/08 11.28 86.38 6.00 2.35 7.54 <50.0 2,470 <50 371 178.0 6,044 8,692
11/24/08 12.42 85.24 <0.075 0.084 0.0892 <5.0 5.4 <5.0 5.5 <5.0 <10 5.4
4/9/09 11.53 86.13 0.468 0.215 0.1900 <5.0 6.6 <5.0 18.9 17.6 <10 24.2
8/24/09 11.22 86.44 8.99 9.15 7.29 <5.0 3,560 52.9 521.0 610 16,570 20,740
10/13/09 12.34 85.32 3.97 12.0 5.38 <100 889 <100 276.0 <100 5,290 6,179
2/11/10 12.34 85.32 8.98 11.5 7.33 <50.0 2,550 <50.0 571.0 89.6 14,550 17,190
9/9/10 13.47 84.19 3.46 2.33 1.21 <50.0 536 <50.0 76.2 <50.0 1,469 2,005
3/28/11 11.00 86.66 <0.075 <0.025 <0.025 <5.0 <5.0 <5.0 <5.0 <5.0 <10.0 ND
9/14/11 10.10 87.56 <0.075 <0.025 <0.025 <5.0 <5.0 <5.0 <5.0 <5.0 <10.0 ND
2/15/12 11.91 85.75 0.0906 0.116 0.0648 <5.0 16.8 <5.0 <5.0 <5.0 6.2 23
8/20/12 12.95 84.71 <0.075 <0.025 0.0364 <5.0 <5.0 <5.0 <5.0 <5.0 <10.0 ND

Monitoring Well
& Elevation (ft)Sampling Date
Depth to
Water (ft)
Groundwater
Elevation (ft)
C5 - C8
Aliphatics
(mg/L)
C9 - C12
Aliphatics
(mg/L)
C9 - C10
Aromatics
(mg/L)
Benzene (µg/L)Ethyl-benzene
(µg/L)MtBE (µg/L)
Naphthalene
(µg/L)
Toluene
(ug/L)
Xylenes
(µg/L)
Σ BTEX
(µg/L)
GW-2: 3 5 7 2,000 20,000 50,000 1,000 50,000 9,000 NA
GW-3: 50 50 50 10,000 5,000 50,000 20,000 40,000 5,000 NA
TABLE 3
RESULTS OF ANALYSIS OF GROUNDWATER SAMPLES FOR VPH
O'Connell Oil Associates (Mobil Station)
730 East Street, Pittsfield, MA
MassDEP RTN 1-13347
Results reported in milligrams per liter (mg/L) or micrograms per liter (mg/L), as noted
MCP Method 1 Standards
ECS-14 4/10/06 10.00 86.25 1.22 0.278 0.328 <5.0 <5.0 <5.0 15.2 11.7 <15 11.7
96.25 7/20/06 10.31 85.94 NS NS NS NS NS NS NS NS NS NA
10/10/06 10.79 85.46 NS NS NS NS NS NS NS NS NS NA
1/25/07 9.87 86.38 NS NS NS NS NS NS NS NS NS NA
4/24/07 8.51 87.74 NS NS NS NS NS NS NS NS NS NA
10/4/07 11.35 84.90 2.32 0.710 1.22 7.2 <5.0 <5.0 57.6 5.0 42.8 55.0
3/11/08 8.80 87.45 NS NS NS NS NS NS NS NS NS NA
5/1/08 9.19 87.06 NS NS NS NS NS NS NS NS NS NA
11/24/08 10.22 86.03 NS NS NS NS NS NS NS NS NS NA
9/14/11 8.23 88.02 NS NS NS NS NS NS NS NS NS NA
2/15/12 9.84 86.41 NS NS NS NS NS NS NS NS NS NA
8/20/12 11.48 84.77 NS NS NS NS NS NS NS NS NS NA
ECS-15 4/10/06 10.47 85.98 0.307 <0.025 0.032 <5.0 <5.0 <5.0 <5.0 <5.0 <10 ND
96.45 7/20/06 10.72 85.73 NS NS NS NS NS NS NS NS NS NA
10/10/06 11.23 85.22 NS NS NS NS NS NS NS NS NS NA
1/25/07 10.37 86.08 NS NS NS NS NS NS NS NS NS NA
4/24/07 8.93 87.52 NS NS NS NS NS NS NS NS NS NA
10/4/07 11.91 84.54 <0.075 <0.025 <0.025 <5.0 <5.0 52.7 <5.0 <5.0 <10 ND
3/11/08 9.92 86.53 NS NS NS NS NS NS NS NS NS NA
5/1/08 9.76 86.69 NS NS NS NS NS NS NS NS NS NA
11/24/08 10.70 85.75 NS NS NS NS NS NS NS NS NS NA
9/14/11 8.73 87.72 NS NS NS NS NS NS NS NS NS NA
2/15/12 10.50 85.95 NS NS NS NS NS NS NS NS NS NA
8/20/12 10.83 85.62 NS NS NS NS NS NS NS NS NS NA
NOTES: Depth to water in feet from PVC.
ft = feet. NA = Not applicable/available.
*Denotes well where the GW-2 standards apply. 97.02 = PVC elevations following well repairs on 8/29/05 & 9/1/05
Bolded text indicates value or detection limit exceeds GW-2 standard.
Italicized text indicates value or detection limit exceeds GW-3 standard.
D = Duplicate sample.
Elevation of PVC in feet.

Monitoring 2-Methyl C9 - C18 C19-C36 C11-C22
Well & Naphthalene Naphthalene Acenaphthene Phenanthrene Fluorene Aliphatic Hydrocarbons Aliphatic Hydrocarbons Aromatic Hydrocarbons
Elevation (Ft) (µg/L) (µg/L) (µg/L) (µg/L) (µg/L) (mg/L) (mg/L) (mg/L)
1,000 2,000 NA NA 5 NA 50
20,000 20,000 6,000 10,000 50 50 5
100,000 100,000 50,000 3,000 100 100 100
ECS-2 9/14/2011 10.00 87.60 10.0 4.60 <1.00 <1.00 <1.00 <0.108 <0.108 0.286
97.60 2/15/2012 11.82 85.78 12.2 17.0 <1.00 <1.00 <1.00 <0.110 <0.110 <0.110
8/20/2012 12.86 84.74 1.57 2.18 <1.00 <1.00 <1.00 <0.112 <0.112 <0.112
ECS-12 9/14/2011 8.55 87.60 <1.00 21.9 <1.00 <1.00 <1.00 <0.111 <0.111 0.466
96.15 2/15/2012 10.29 85.86 <1.00 49.6 <1.00 <1.00 1.57 <0.145 <0.145 0.237
8/20/2012 11.42 84.73 <1.00 9.27 <1.00 <1.00 <1.00 <0.111 <0.111 0.122
Method 3 UCL
TABLE 4
SUMMARY OF EPH GROUNDWATER ANALYTICAL DATA
O'Connell Oil Associates
730 East Street, Pittsfield, Massachusetts
MassDEP EPH Method 5/2004 Rev. 1.1
Results and standards reported in milligrams per liter (mg/L) or micrograms per liter (µg/L), as noted
SamplingDate
Depth toWater (ft)
GroundwaterElevation (ft)
Method 1 GW-2
Method 1 GW-3

Appendix F
City of Pittsfield Drinking Water
Quality Reports

1
2011 Annual Drinking Water Quality Report
For The City of Pittsfield, Massachusetts
MassDEP Public Water Supply ID #1236000
This report is a snapshot of drinking water quality that we provided last year. Included are details about where your water comes from, what it contains, and how it compares to state and federal standards. We are committed to providing you with information about the public drinking water system.
PUBLIC WATER SYSTEM INFORMATION Water System Improvements Our water system is routinely inspected by the Massachusetts Department of Environmental Protection (MassDEP). MassDEP inspects our system for its technical, financial, and managerial capacity to provide safe drinking water to you. To ensure that the City of Pittsfield provides the highest quality of water available, your water system is operated by a Massachusetts certified operator who oversees the routine operations of our system. In 2011, the new Coltsville Flow Control Station went online. It had been relocated approximately 400 feet from its original location on the same property, the Coltsville Shopping Center. The old station was demolished, and the area restored and parking for the shopping center added in its place. The City also replaced 12 hydrants and replaced 163 water meters with new remote-read Sensus water meters. Opportunities for Public Participation If you would like to participate in discussions regarding your water quality, you may attend the regular meetings of the City Council, which fall on the second and fourth Tuesdays of each month, except July and August, at 7:30 pm. City Council meets in the Council Chambers on the second floor of City Hall. You may also contact your local elected representatives with any water quality concerns.
DRINKING WATER SOURCES What are the sources for my drinking water, and how is it treated? The drinking water for the City of Pittsfield comes from six surface reservoirs, none from wells. Cleveland Reservoir and Sackett Reservoir are situated in the Town of Hinsdale, and Ashley Lake, Lower Ashley Intake Reservoir, Farnham Reservoir, and Sandwash Reservoir are situated in the Town of Washington. The City of Pittsfield restricts use of these reservoirs and the land around them to protect the water supply from contamination. Our water system makes every effort to provide you with safe and pure drinking water. To improve the quality of the water delivered to you, we treat it to remove several contaminants and impurities. Our two water filtration plants, the Ashley Water Treatment Plant in the Town of Dalton and the Cleveland Water Treatment Plant in the Town of Hinsdale, treat water by using aluminum sulfate and sodium aluminate to remove particulate matter by coagulation and flocculation. Sodium hydroxide (caustic soda) and zinc orthophosphate are added to the drinking water to make it less corrosive to pipes, and chlorine is added later in the process, via the Ashley and Cleveland chlorinators, to disinfect the water. The processed water is pumped throughout the City via six pump stations and stored in four ground-level water tanks. The water quality of our system is constantly monitored by the City of Pittsfield and MassDEP to determine the effectiveness of existing water treatments and to determine if any additional treatment is required. What Hazards Exist For Our Water Supply? MassDEP has prepared a Source Water Assessment Program (SWAP) Report for the sources serving the City of Pittsfield potable water supply system. The SWAP Report assesses the susceptibility of public water supplies to contamination. A susceptibility ranking of “high” was assigned to this system because of at least one high land use within the City water supply protection area. The complete SWAP report is available online at http://www.mass.gov/dep/water/drinking/1236000.pdf.

2
Several common sources of contamination can pollute the water supply. Improperly maintained or nonworking septic systems can be a source of microbial contamination if unsuitable materials are disposed into them. Common household substances, such as fertilizers, paints, weed killers, and pesticides, can endanger public water. Underground oil storage tanks, if maintained improperly, can lead to leaks or spills. Storm water can pick up and carry debris and contaminants from roadways and lawns as it flows to catch basins. See below for further explanation on potential drinking water contaminants. How Is Our Water Source Protected, and How Can Protection Improve Further? The SWAP Report notes the key issues of watershed management, utility line right-of-ways, residential land use, and transportation corridors in or around the protection areas for the City water sources. The report commends our water system on promoting measures to protect our potable water supply sources. In order to maintain and improve source water protection, the SWAP report recommends several key measures. Access should be controlled to areas surrounding the City water supply. Inspections should be made regularly to the protection areas and any problems encountered remedied. Emergency response teams in the areas of the water sources should be educated on the water supply protection issues and should be prepared to respond to any accidents or spills in the vicinity of the sources. Residents in the areas of the water supplies can help protect sources by limiting fertilizer and pesticide use, maintaining septic systems properly, participating in hazardous materials collection events, and being vigilant for any suspicious or potentially harmful activities.
POTENTIAL DRINKING WATER CONTAMINANTS Sources of drinking water (both tap water and bottled water) include rivers, lakes, streams, ponds, reservoirs, springs, and wells. As water travels overland or underground, it dissolves naturally occurring minerals and, in some cases, radioactive material, and can pick up substances resulting from the presence of animals or from human activity. Contaminants that may be present in source water include: Microbial contaminants, such as viruses and bacteria, which may come from sewage treatment plants, septic systems, agricultural livestock operations, and wildlife. Inorganic contaminants, such as salts and metals, which can occur naturally or result from urban stormwater runoff, industrial and domestic wastewater discharges, oil and gas production, mining, and farming. Pesticides and herbicides, which may come from a variety of sources, such as agriculture, urban stormwater runoff, and residential uses. Organic chemical contaminants, including synthetic and volatile organic chemicals, which are byproducts of industrial processes and petroleum production, and can come from gas stations, urban stormwater runoff, and septic systems. Radioactive contaminants, which can occur naturally or result from oil and gas production and mining activities. In order to ensure that tap water is safe to drink, the MassDEP and U.S. Environmental Protection Agency (EPA) prescribe regulations that limit the amount of certain contaminants in water provided by public water systems. The Food and Drug Administration (FDA) and Massachusetts Department of Public Health (DPH) regulations establish limits for contaminants in bottled water that must provide the same protection for public health. All drinking water, including bottled water, may reasonably be expected to contain at least small amounts of some contaminants. The presence of contaminants does not necessarily indicate that water poses a health risk. More information about contaminants and potential health effects can be obtained by calling the EPA’s Safe Drinking Water Hotline at (800) 426 4791. Some people may be more vulnerable to contaminants in drinking water than the general population. Immuno-compromised persons, such as those having cancer, undergoing chemotherapy, having undergone organ transplants, and having HIV/AIDS or other immune system disorders, as well as some elderly and some infants, can be particularly at risk from infections. These people should seek advice about drinking water from their health care providers. EPA/Centers for Disease Control and Prevention (CDC) guidelines on lowering the risk of

3
infection by cryptosporidium and other microbial contaminants are available from the Safe Drinking Water Hotline (800-426-4791). If present, elevated levels of lead can cause serious health problems, especially for pregnant women and young children. Lead in drinking water is primarily from materials and components associated with service lines and home plumbing. The City of Pittsfield is responsible for providing high-quality drinking water, but cannot control the variety of materials used in plumbing components. When your water has been sitting for several hours, it is recommended that you flush your tap for 30 seconds to 2 minutes before using water for drinking or cooking to minimize the potential for lead exposure. If you are concerned about lead in your water, you may wish to have your water tested. Information on lead in drinking water, testing methods, and steps you can take to minimize exposure is available from the Safe Drinking Water Hotline or at http://www.epa.gov/safewater/lead. Cross Connection Inspection/Backflow Prevention Program Cross connections are potentially hazardous situations for a public or private potable water supply and a source of potable water contamination. A cross connection is any potential or actual physical connection between a potable water supply and any source through which it is possible to introduce any substance (such as gasoline, soap, gray water, or an industrial chemical) other than potable water to the water supply. Common cross connection scenarios are a garden hose whose spout is submerged in a bucket of soapy water or connected to a spray bottle of weed killer. A backflow, or unintended flow of water toward a source, is caused when a higher pressure develops at a water system than in a water supply. This can occur with an increase in pressure in the target system (backsiphonage) or a decrease of pressure in the supply (backpressure). Since water flows from higher pressure to lower pressure, a backflow event can occur when such a variation in pressure occurs somewhere in the system or the supply. This variation may result from a water main break, an unusually high demand for water, or even a submerged hose end that is higher than the faucet to which it is connected. Prevention of contamination of the water supply from backflow events is the responsibility of the water user. Responsibility begins at the connection from the public main to the user system and includes all piping included in the water distribution system on the property. Any water user whose internal water system presents a potential or actual cross connection conflict with the City potable water supply must have a backflow prevention assembly appropriate for the hazard level of the facility installed, maintained, and periodically tested at the user’s expense to protect the public, per Chapter 22, Section 23.2 of the Code of the City of Pittsfield. The City of Pittsfield is not currently required to survey residential properties for cross connections. However, residential properties still may have potential or actual cross connections, most commonly involving outdoor faucets, hot tubs, and swimming pools. All faucets to which hoses attach must have a hose bib vacuum breaker to prevent backsiphonage. To obtain a copy of the Massachusetts regulations regarding cross connections (310 CMR 22.22), or for any further information regarding cross connections, please contact the Massachusetts Department of Environmental Protection Western Regional Office at (413) 784 1100.
IMPORTANT DEFINITIONS Maximum Contaminant Level (MCL) – The highest level of a contaminant that is allowed in drinking water. MCLs are set as close to the MCLGs as feasible using the best available treatment technology. Maximum Contaminant Level Goal (MCLG) –The level of a contaminant in drinking water below which there is no known or expected risk to health. MCLGs allow for a margin of safety. Maximum Residual Disinfectant Level (MRDL) -- The highest level of a disinfectant (chlorine, chloramines, chlorine dioxide) allowed in drinking water. There is convincing evidence that addition of a disinfectant is necessary for control of microbial contaminants. Maximum Residual Disinfectant Level Goal (MRDLG) -- The level of a drinking water disinfectant (chlorine, chloramines, chlorine dioxide) below which there is no known of expected risk to health. MRDLGs do not reflect the benefits of the use of disinfectants to control microbial contaminants.
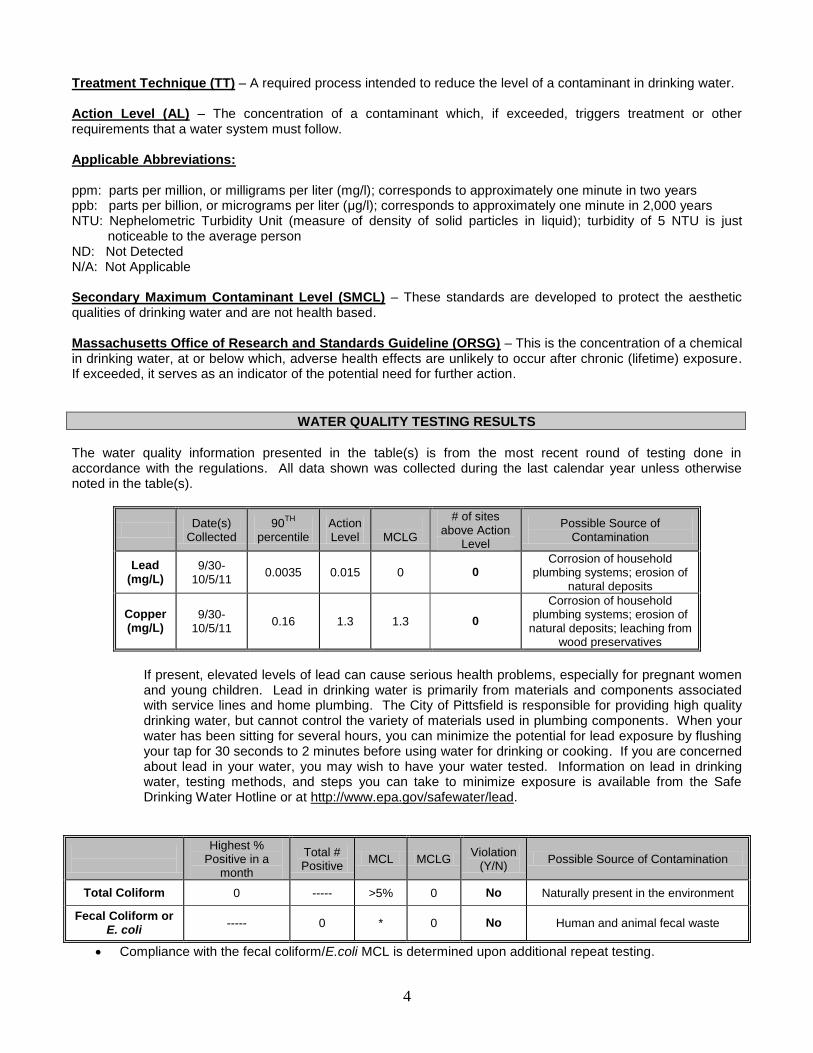
4
Treatment Technique (TT) – A required process intended to reduce the level of a contaminant in drinking water. Action Level (AL) – The concentration of a contaminant which, if exceeded, triggers treatment or other requirements that a water system must follow. Applicable Abbreviations: ppm: parts per million, or milligrams per liter (mg/l); corresponds to approximately one minute in two years ppb: parts per billion, or micrograms per liter (μg/l); corresponds to approximately one minute in 2,000 years NTU: Nephelometric Turbidity Unit (measure of density of solid particles in liquid); turbidity of 5 NTU is just
noticeable to the average person ND: Not Detected N/A: Not Applicable Secondary Maximum Contaminant Level (SMCL) – These standards are developed to protect the aesthetic qualities of drinking water and are not health based. Massachusetts Office of Research and Standards Guideline (ORSG) – This is the concentration of a chemical in drinking water, at or below which, adverse health effects are unlikely to occur after chronic (lifetime) exposure. If exceeded, it serves as an indicator of the potential need for further action.
WATER QUALITY TESTING RESULTS The water quality information presented in the table(s) is from the most recent round of testing done in accordance with the regulations. All data shown was collected during the last calendar year unless otherwise noted in the table(s).
Date(s) Collected
90TH percentile
Action Level
MCLG
# of sites above Action
Level
Possible Source of Contamination
Lead (mg/L)
9/30-10/5/11 0.0035 0.015 0 0
Corrosion of household plumbing systems; erosion of
natural deposits
Copper (mg/L)
9/30-10/5/11 0.16 1.3 1.3 0
Corrosion of household plumbing systems; erosion of
natural deposits; leaching from wood preservatives
If present, elevated levels of lead can cause serious health problems, especially for pregnant women and young children. Lead in drinking water is primarily from materials and components associated with service lines and home plumbing. The City of Pittsfield is responsible for providing high quality drinking water, but cannot control the variety of materials used in plumbing components. When your water has been sitting for several hours, you can minimize the potential for lead exposure by flushing your tap for 30 seconds to 2 minutes before using water for drinking or cooking. If you are concerned about lead in your water, you may wish to have your water tested. Information on lead in drinking water, testing methods, and steps you can take to minimize exposure is available from the Safe Drinking Water Hotline or at http://www.epa.gov/safewater/lead.
Highest % Positive in a
month
Total # Positive MCL MCLG Violation
(Y/N) Possible Source of Contamination
Total Coliform 0 ----- >5% 0 No Naturally present in the environment
Fecal Coliform or E. coli ----- 0 * 0 No Human and animal fecal waste
Compliance with the fecal coliform/E.coli MCL is determined upon additional repeat testing.

5
TT Highest Detected Daily Value
Violation (Y/N) Possible Source of Contamination
Turbidity (NTU) 5 0.49 No Soil runoff Turbidity is a measure of the cloudiness of the water. We monitor it because it is a good indicator of water quality.
Regulated Contaminant Date(s) Collected
Highest Result/Running
Average Detected
Range Detected
MCL or
MRDL
MCLG or
MRDLG
Violation (Y/N)
Possible Source(s) of Contamination
Inorganic Contaminants
Barium (ppm) 11/22/11 0.011 0.0076-0.011 2 2 No
Discharge of drilling wastes; discharge from
metal refineries; erosion of natural
deposits
Fluoride (ppm) ■ 11/22/11 0.03 0.02-0.03 4 4 No
Erosion of natural deposits; water additive which
promotes strong teeth; discharge from
fertilizer and aluminum factories
Nitrate (ppm) 11/22/11 0.05 0.03-0.05 10 10 No
Runoff from fertilizer use; leaching from
septic tanks; sewage; erosion of natural
deposits
Nitrite (ppm) 11/22/11 0 0 1 1 No
Runoff from fertilizer use; leaching from
septic tanks; sewage; erosion of natural
deposits
Perchlorate (μg)
9/28/11 0 0 2 N/A No Rocket propellants,
fireworks, munitions, flares, blasting agents
Disinfection Byproducts
Total Trihalomethanes (TTHMs) (ppb)
Quarterly in 2011 50.1 19.5-
50.1 80 ----- No Byproduct of drinking water chlorination
Haloacetic Acids (HAA5) (ppb)
Quarterly in 2011
28.5 13.2-28.5 60 ----- No Byproduct of drinking
water disinfection
Chlorine (ppm) (free, total or combined)
Weekly in 2011 1.61 0.22-
1.61 4 4 No Water additive used to control microbes
■ Fluoride also has a secondary contaminant level (SMCL) of 2 ppm. Unregulated contaminants are those for which there are no established drinking water standards. The purpose of unregulated contaminant monitoring is to assist regulatory agencies in determining their occurrence in drinking water and whether future regulation is warranted.

6
City of Pittsfield Department of Public Utilities 70 Allen Street Pittsfield, MA 01201
Unregulated and Secondary Contaminants
Date(s) Collected
Result or Range
Detected
Average Detected SMCL ORSG Possible Source
Inorganic Contaminants
Sodium (ppm) 11/22/11 8.0-12.2 10.1 ---- 20 Natural sources; runoff from use of salt on roadways; by-product
of treatment process Other Organic Contaminants - When detected at treatment plant as VOC residuals, not TTHM compliance
Bromodichloromethane (ppb) 9/28/11 0.60-3.20 1.90 --- --- Byproduct of drinking water
chlorination
Chloroform (μg/L) 9/28/11 13-97 55 --- --- Byproduct of drinking water chlorination
Bacteriological Contaminants
Cryptosporidium N/A 0 0 ---- ---- Discharged especially where water is contaminated with sewage or animal wastes
* The EPA has established a lifetime health advisory (HA) value of 0.3 mg/L for manganese to protect against concerns of potential neurological effects, and a one-day and 10-day HA of 1 mg/L for acute exposure.
COMPLIANCE WITH DRINKING WATER REGULATIONS Does My Drinking Water Meet Current Health Standards? We failed to complete required sampling for copper in a timely manner; this is a monitoring and reporting violation. A sufficient number of samples were taken of copper, and the results of those tests fell within the allowable range, as indicated above, but we did not mail the results of those samples on time. No other violations occurred during the year 2011, and thus our water met all applicable health standards regulated by the state and federal government in 2011.

2010 Annual Drinking Water Quality Report For
The City of Pittsfield, Massachusetts MassDEP Public Water Supply ID #1236000
This report is a snapshot of drinking water quality that we provided last year. Included are details about where your water comes from, what it contains, and how it compares to state and federal standards. We are committed to providing you with information because informed customers are our best allies.
PUBLIC WATER SYSTEM INFORMATION
Address: _70 Allen Street, Pittsfield, MA
Contact Person: Bruce Collingwood, Commissioner of Public Utilities
Telephone#: (413) 499 9330 Fax#: (413) 499 9418
Internet Address: http://www.pittsfield.com/city_departments/public_works_and_utilities/water_sewer_and_drain.htm
Water System Improvements Our water system is routinely inspected by the Massachusetts Department of Environmental Protection (MassDEP). MassDEP inspects our system for its technical, financial, and managerial capacity to provide safe drinking water to you. To ensure that the City of Pittsfield provides the highest quality of water available, your water system is operated by a Massachusetts certified operator who oversees the routine operations of our system.
In 2010, the City of Pittsfield replaced 12 hydrants and replaced 608 water meters with new remote-read Sensus water meters. The Hathaway Brook dams, which formerly impounded the Hathaway Reservoir, were removed to restore natural stream conditions. The natural connectivity of the stream now allows for the natural movement of aquatic life upstream from the Housatonic River; it also allows for natural nutrient and sediment transport, natural flow patterns, and overall improvement of water quality. In addition, the Coltsville Flow Control Station has been in the process of being relocated and updated. The flow control station, which tempers the flow and pressure of water entering the City of Pittsfield distribution system from the Cleveland Transmission Main, will be equipped newly with redundancies in flow control conduits so that the new station may continue to operate even when it is under maintenance. The new station will be located approximately 400 feet from the old station, remaining in the parking lot of the Coltsville Shopping Center, and the old station will be demolished and replaced with additional parking space for the shopping center.
Opportunities for Public Participation If you would like to participate in discussions regarding your water quality, you may attend the regular meetings of the City Council, which fall on the second and fourth Tuesdays of each month, except July and August, at 7:30 pm. City Council meets in the Council Chambers on the second floor of City Hall. You may also contact your local elected representatives with any water quality concerns.
DRINKING WATER SOURCES
What are the sources for my drinking water, and how is it treated?
The drinking water for the City of Pittsfield comes from six surface reservoirs, none from wells. Cleveland Reservoir and Sackett Reservoir are situated in the Town of Hinsdale, and Ashley Lake, Lower Ashley Intake Reservoir, Farnham Reservoir, and Sandwash Reservoir are situated in the Town of Washington. The City of Pittsfield restricts use of these reservoirs and the land around them to protect the water supply from contamination.
Our water system makes every effort to provide you with safe and pure drinking water. To improve the quality of the water delivered to you, we treat it to remove several contaminants and impurities. Our two water filtration plants, the Ashley Water Treatment Plant in the Town of Dalton and the Cleveland Water Treatment Plant in the Town of Hinsdale, treat water by using aluminum sulfate and sodium aluminate to remove particulate matter by coagulation and flocculation. Sodium hydroxide (caustic soda) and zinc orthophosphate are added to the drinking
1

water to make it less corrosive to pipes, and chlorine is added later in the process, via the Ashley and Cleveland chlorinators, to disinfect the water. The processed water is pumped throughout the City via six pump stations and stored in four ground-level water tanks.
The water quality of our system is constantly monitored by the City of Pittsfield and MassDEP to determine the effectiveness of existing water treatments and to determine if any additional treatment is required.
What Hazards Exist For Our Water Supply?
MassDEP has prepared a Source Water Assessment Program (SWAP) Report for the sources serving the City of Pittsfield potable water supply system. The SWAP Report assesses the susceptibility of public water supplies to contamination. A susceptibility ranking of high was assigned to this system because of at least one high land use within the City water supply protection area. The complete SWAP report is available online at http://www.mass.gov/dep/water/drinking/1236000.pdf.
Several common sources of contamination can pollute the water supply. Improperly maintained or nonworking septic systems can be a source of microbial contamination if unsuitable materials are disposed into them. Common household substances, such as fertilizers, paints, weed killers, and pesticides, can endanger public water. Underground oil storage tanks, if maintained improperly, can lead to leaks or spills. Storm water can pick up and carry debris and contaminants from roadways and lawns as it flows to catch basins. See below for further explanation on potential drinking water contaminants.
How Is Our Water Source Protected, and How Can Protection Improve Further?
The SWAP Report notes the key issues of watershed management, utility line right-of-ways, residential land use, and transportation corridors in or around the protection areas for the City water sources. The report commends our water system on promoting measures to protect our potable water supply sources.
In order to maintain and improve source water protection, the SWAP report recommends several key measures. Access should be controlled to areas surrounding the City water supply. Inspections should be made regularly to the protection areas and any problems encountered remedied. Emergency response teams in the areas of the water sources should be educated on the water supply protection issues and should be prepared to respond to any accidents or spills in the vicinity of the sources. Residents in the areas of the water supplies can help protect sources by limiting fertilizer and pesticide use, maintaining septic systems properly, participating in hazardous materials collection events, and being vigilant for any suspicious or potentially harmful activities.
POTENTIAL DRINKING WATER CONTAMINANTS
Sources of drinking water (both tap water and bottled water) include rivers, lakes, streams, ponds, reservoirs, springs, and wells. As water travels overland or underground, it dissolves naturally occurring minerals and, in some cases, radioactive material, and can pick up substances resulting from the presence of animals or from human activity.
Contaminants that may be present in source water include:
Microbial contaminants, such as viruses and bacteria, which may come from sewage treatment plants, septic systems, agricultural livestock operations, and wildlife.
Inorganic contaminants, such as salts and metals, which can occur naturally or result from urban stormwater runoff, industrial and domestic wastewater discharges, oil and gas production, mining, and farming.
Pesticides and herbicides, which may come from a variety of sources, such as agriculture, urban stormwater runoff, and residential uses.
Organic chemical contaminants, including synthetic and volatile organic chemicals, which are byproducts of industrial processes and petroleum production, and can come from gas stations, urban stormwater runoff, and septic systems.
Radioactive contaminants, which can occur naturally or result from oil and gas production and mining activities.
In order to ensure that tap water is safe to drink, the MassDEP and U.S. Environmental Protection Agency (EPA) prescribe regulations that limit the amount of certain contaminants in water provided by public water systems.
2

The Food and Drug Administration (FDA) and Massachusetts Department of Public Health (DPH) regulations establish limits for contaminants in bottled water that must provide the same protection for public health. All drinking water, including bottled water, may reasonably be expected to contain at least small amounts of some contaminants. The presence of contaminants does not necessarily indicate that water poses a health risk. More information about contaminants and potential health effects can be obtained by calling the EPA s Safe Drinking Water Hotline at (800) 426 4791.
Some people may be more vulnerable to contaminants in drinking water than the general population. lmmunocompromised persons, such as those having cancer, undergoing chemotherapy, having undergone organ transplants, and having HIV/AIDS or other immune system disorders, as well as some elderly and some infants, can be particularly at risk from infections. These people should seek advice about drinking water from their health care providers. EPA/Centers for Disease Control and Prevention {CDC) guidelines on lowering the risk of infection by cryptosporidium and other microbial contaminants are available from the Safe Drinking Water Hotline {800-426-4 791 ).
If present, elevated levels of lead can cause serious health problems, especially for pregnant women and young children. Lead in drinking water is primarily from materials and components associated with service lines and home plumbing. The City of Pittsfield is responsible for providing high-quality drinking water, but cannot control the variety of materials used in plumbing components. When your water has been sitting for several hours, it is recommended that you flush your tap for 30 seconds to 2 minutes before using water for drinking or cooking to minimize the potential for lead exposure. If you are concerned about lead in your water, you may wish to have your water tested. Information on lead in drinking water, testing methods, and steps you can take to minimize exposure is available from the Safe Drinking Water Hotline or at http://www.epa.gov/safewater/lead.
Cross Connection lnspection/Backflow Prevention Program
Cross connections are potentially hazardous situations for a public or private potable water supply and a source of potable water contamination. A cross connection is any potential or actual physical connection between a potable water supply and any source through which it is possible to introduce any substance (such as gasoline, soap, gray water, or an industrial chemical) other than potable water to the water supply. Common cross connection scenarios are a garden hose whose spout is submerged in a bucket of soapy water or connected to a spray bottle of weed killer.
A backflow, or unintended flow of water toward a source, is caused when a higher pressure develops at a water system than in a water supply. This can occur with an increase in pressure in the target system (backsiphonage) or a decrease of pressure in the supply {backpressure). Since water flows from higher pressure to lower pressure, a backflow event can occur when such a variation in pressure occurs somewhere in the system or the supply. This variation may result from a water main break, an unusually high demand for water, or even a submerged hose end that is higher than the faucet to which it is connected.
Prevention of contamination of the water supply from backflow events is the responsibility of the water user. Responsibility begins at the connection from the public main to the user system and includes all piping included in the water distribution system on the property. Any water user whose internal water system presents a potential or actual cross connection conflict with the City potable water supply must have a backflow prevention assembly appropriate for the hazard level of the facility installed, maintained, and periodically tested at the users expense to protect the public, per Chapter 22, Section 23.2 of the Code of the City of Pittsfield.
The City of Pittsfield is not currently required to survey residential properties for cross connections. However, residential properties still may have potential or actual cross connections, most commonly involving outdoor faucets, hot tubs, and swimming pools. All faucets to which hoses attach must have a hose bib vacuum breaker to prevent backsiphonage. To obtain a copy of the Massachusetts regulations regarding cross connections (310 CMR 22.22), or for any further information regarding cross connections, please contact the Massachusetts Department of Environmental Protection Western Regional Office at {413) 784 1100.
3

IMPORTANT DEFINITIONS
Maximum Contaminant Level CMCL) The highest level of a contaminant that is allowed in drinking water. MCLs are set as close to the MCLGs as feasible using the best available treatment technology.
Maximum Contaminant Level Goal CMCLG) The level of a contaminant in drinking water below which there is no known or expected risk to health. MCLGs allow for a margin of safety.
Maximum Residual Disinfectant Level CMRDL) -- The highest level of a disinfectant (chlorine, chloramines, chlorine dioxide) allowed in drinking water. There is convincing evidence that addition of a disinfectant is necessary for control of microbial contaminants.
Maximum Residual Disinfectant Level Goal CMRDLG) -- The level of a drinking water disinfectant (chlorine, chloramines, chlorine dioxide) below which there is no known of expected risk to health. MRDLGs do not reflect the benefits of the use of disinfectants to control microbial contaminants.
Treatment Technique (TT) A required process intended to reduce the level of a contaminant in drinking water.
Action Level CAL) The concentration of a contaminant which, if exceeded, triggers treatment or other requirements that a water system must follow.
Applicable Abbreviations:
ppm: parts per million, or milligrams per liter (mg/1); corresponds to approximately one minute in two years ppb: parts per billion, or micrograms per liter (IJg/1); corresponds to approximately one minute in 2,000 years NTU: Nephelometric Turbidity Unit (measure of density of solid particles in liquid); turbidity of 5 NTU is just
noticeable to the average person ND: Not Detected N/A: Not Applicable
Secondary Maximum Contaminant Level CSMCL) These standards are developed to protect the aesthetic qualities of drinking water and are not health based.
Massachusetts Office of Research and Standards Guideline CORSG) This is the concentration of a chemical in drinking water, at or below which, adverse health effects are unlikely to occur after chronic (lifetime) exposure. If exceeded, it serves as an indicator of the potential need for further action.
WATER QUALITY TESTING RESUL=T-=-S ________ o==J The water quality information presented in the table(s) is from the most recent round of testing done in accordance with the regulations. All data shown was collected during the last calendar year unless otherwise noted in the table(s).
Date('.>) 8QTI-f Act1on #of s1tes
Pos~ible Source Ctf above Act1on Collected perr.entile Level MCLG
Level ContamlnatJ•)n
Lead Corrosion of household
(ppb) 2008 4.6 15 0 0 plumbing systems; erosion of
natural deposits Corrosion of household
Copper 2008 0.12 1.3 1.3 0 plumbing systems; erosion of (ppm) natural deposits; leaching from
wood preservatives
If present, elevated levels of lead can cause serious health problems, especially for pregnant women and young children. Lead in drinking water is primarily from materials and components associated with service lines and home plumbing. The City of Pittsfield is responsible for providing high quality drinking water, but cannot control the variety of materials used in plumbing components. When your water has been sitting for several hours, you can minimize the potential for lead exposure by flushing your tap for 30 seconds to 2 minutes before using water for drinking or cooking. If you are concerned
4

about lead in your water, you may wish to have your water tested. Information on lead in drinking water, testing methods, and steps you can take to minimize exposure is available from the Safe Drinking Water Hotline or at http://www.epa.gov/safewater/lead .
I Highest %
Positive tn a
tl--------+·- · month Total Coliform
Fecal Coliform or E. coli
0
Total# Pos1t1va
0
MCL
>5%
*
MCLG
0
0
Vtolabon ! t'f/N)
No
No
Possible Source of Contammation
Naturally present in the environment
Human and animal fecal waste
• Compliance with the fecal coliform/E. coli MCL is determined upon additional repeat testing.
TT I Htghest Detected Violat1on Possible Source of Contamination
Dally Value (Y/N)
Turbidity (NTU) 5 l 1.88 No Soil runoff
Turbidity is a measure of the cloudiness of the water. We monitor it because it is a good indicator of water quality.
I H1gh.;,st I M'"'L MCLG I
Regulated Contam1m:nt Date;(s) Rl9sult1Runmng RangP- 'J
tJr Vtolat1on Possible Source(s) of
Collected Average I or (Y/NJ Contamination Detected MRDL MRDLG I Detected
Inorganic Contaminants
Discharge of drilling
0.007-wastes; discharge from
Barium (ppm) 12/16/10 0.010 0.010
2 2 No metal refineries; erosion of natural
deposits Erosion of natural deposits; water
0.02-additive which
Fluoride (ppm) • 12/16/10 0.03 0.03
4 4 No promotes strong teeth; discharge from
fertilizer and aluminum factories
Runoff from fertilizer
0.03-use; leaching from
Nitrate (ppm) 12/16/10 0.07 0.07
10 10 No septic tanks; sewage; erosion of natural
deposits Runoff from fertilizer use; leaching from
Nitrite (ppm) 12/17/10 0 0 1 1 No septic tanks; sewage;
erosion of natural deposits
Disinfection Byproducts
Total Trihalomethanes Quarterly 56.3
31.6-80 No
Byproduct of drinking (TTHMs) (ppb) in 2010 56.3 ---- water chlorination
Haloacetic Acids (HAA5) Quarterly 34.3 18-34.3 60 -- No
Byproduct of drinking (ppb) in 2010 water disinfection
Chlorine (ppm) (free, total Weekly in 1.00 0.86-
4 4 No Water additive used to
or combined) 2010 1.00 control microbes
• Fluoride also has a secondary contaminant level (SMCL) of 2 ppm.
5

City of Pittsfield Department of Public Utilities City Hall 70 Allen Street Pittsfield, MA 01201 413-499-9330
2010 PRSRTSTD
US POSTAGE
PAID HOLLISTON, MA PERMIT NO. 72
Unregulated contaminants are those for which there are no established drinking water standards. The purpose of unregulated contaminant monitoring is to assist regulatory agencies in determining their occurrence in drinking water and whether future regulation is warranted.
Unregulated and Date(sJ Result or
Average ! -l Range SMCL I ORSG PCissibl~ Source Secondary Contaminants Collected Detected
Detected
Inorganic Contaminants
I
Natural sources; runoff from use Sodium (ppm) 12/16/10 8.4-12.0 10.2 --- 20 of salt on roadways; by-product
of treatment process
Other Organic Contaminants -When detected at treatment plant as VOC residuals, not TTHM compliance
Bromodichloromethane 9/9/10 0.58-1.30 0.94 Byproduct of drinking water (ppb) --- --- chlorination
Chloroform (ppb) 9/9/10 18-24 21 --- --- Byproduct·of drinking water chlorination
Bacteriological Contaminants
Cryptosporidium Discharged especially where
N/A 0 0 ---- ---- water is contaminated with sewage or animal wastes
* The EPA has established a lifetime health advisory (HA) value of 0.3 mg/L for manganese to protect against concerns of potential neurological effects, and a one-day and 1 0-day HA of 1 mg/L for acute exposure.
COMPLIANCE WITH DRINKING WATER REGULATIONS
Does My Drinking Water Meet Current Health Standards?
We are committed to providing you with the best water quality available. We are proud to report that last year your drinking water met all applicable health standards regulated by the state and federal government.
6