ground-water and geohydrologic conditions in … and geohydrologic conditions in queens county, long...
TRANSCRIPT

Ground-Water and Geohydrologic Conditions in Queens County, Long Island, New York
Prepared in cooperation with the New York State Department of Environmental Conservation,
Division of Water Resources

GROUND-WATER AND GEOHYDROLOGIC CONDITIONS IN
QUEENS COUNTY, LONG ISLAND, NEW YORK
By Julian Soren
U.S. Geological Survey Water Supply Paper 2001-A (1971)
Prepared in cooperation with New York State Department of Environmental Conversation
E R R A T A
Page A14, caption to fig. 2: change "approximately" to "approximate"
Page A29: Well Q2373 is 158 ft deep (not 558 ft)
Page A30, 3d and 4th lines from bottom: change "two" to "four" and add well numbers Q307 and Q1378
Page A38: reference to Perlmutter and Soren, 1963: change 420-E to 450-E
Plate 1: Table of geologic and hydrologic units: Switch headings in last two columns
Plate 1: Change well Q2420D to 24020

Ground-Water and
Geohydrologic Conditions
in Queens County,
Long Island, New York By JULIAN SOREN
WATER IN THE URBAN ENVIRONMENT
GEOLOGICAL SURVEY WATER-SUPPLY PAPER 2001-A
Prepared in cooperatton wtth the
New York State Department of Envtronmental Conservatton,
Dzvtston of Water Resources
UNITED STATES GOVERNMENT PRINTING OFFICE, WASHINGTON 1971

UNITED STATES DEPARTMENT OF THE INTERIOR
WALTER J. HICKEL, Secretary
GEOLOGICAL SURVEY
William T Pecora, D•rector
Library of Congress catalog-card No 72-609230
For sale by the Supermtendent of Documents, U S Government Prmtmg Office Washmgton, DC 20402

Abstract Introduction Geography
CONTENTS
LocatiOn and extent of area Topography Dramage Culture
Surficial geology Aqmfer system
GeohydrologiC settmg Upper glacial aquifer J ameco aquifer Magothy aqmfer Lloyd aquifer
Movement of water through the hydrologic system Water-table and piezometn.c surfaces Water-level fluctuatiOns Hydraulic mterconnecbon of aquifers Inflow and recharge of ground water Ground-water movement Ground-water discharge
Utilization of ground water Quality of the ground water
Distn.butwn of dissolved constituents Salt-water mtruswn Temperature
Outlook for the future Engmeermg considerations Water-management Imphcabons
References cited
ILLUSTRATIONS
PLATE 1 Surficial geologic map, geohydrologic sections, and table
Page A1
2 3 3 3 4 5 6
7 7 8 8 9
10 11 12 18 19 20 21 22 23 27 27 31 34 35 35 36 38
Page
showmg geologic and hydrogeologic umts In pocket 2 Maps showmg water levels and approximate farthest land-
ward position of the 40 milligrams per hter chloride lme m four aquifers, 1961 and 1968 In pocket
III

IV CONTENTS
Page
FIGURE 1. Map of Long !slana, NY, showtng location of Queens County and general regwnal geography A4
2 Map showmg approximate net change m the position of the water table m the upper glacial aqmfer from mid-1903 to the end of 1967 14
3 Hydrographs of selected wella, 1939-67 17 4. Map showmg d1stnbutwn and sources of net ground-water
pumpage m 1967 25
TABLE
Page
TABLE 1 Selected chemical analyses of ground water m Queens County, N. Y A28

WATER IN THE URBAN ENVIRONMENT
GROUND-WATER AND GEOHYDROLOGIC CONDITIONS IN QUEENS COUNTY, LONG ISLAND,
NEW YORK
By JULIAN SOREN
ABSTRACT
Queens County IS a heavily populated borough of New York City, at the western end of Long Island, N Y , m which large amounts of ground water are used, mostly for public supply Ground water, pumped fiom local aqmfers, by privately owned water-supply compames, supplied the water needs of about 750,000 of the nearly 2 million residents of the county m 1967, the balance was supplied by New York City from surface sources outside the county m upstate New York
The county's aqmfers consist of sand and g1avel of Late Cretaceous and of Pleistocene ages, and the aqmfers comprise a wedge-shaped ground-water reservoir lymg on a southeastward-slopmg floor of Precambrian ( ?) bedrock Beds of clay and Silt gene1 ally confine water m the deeper parts of the reservoir, water m the deeper aqmfers ranges from poorly confined to well confined Wisconsm-age glacial deposits m the uppermost part of the reservmr contam ground water under water-table conditions
Ground water pumpage averaged about 60 mgd (milliOn gallons per day) m Queens County from about 1900 to 1967 Much of the water was used m adjacent Kmgs County, another borough of New York City, prior to 1950 The large ground-water withdrawal has resulted m a wide-spread and sbll-growmg cone of depressiOn m the water table, reflectmg a loss of about 61 billion gallons of fresh water from storage Sigmficant drawdown of the water table probably began with rapid urbamzatwn of Queens County m the 1920's The county has been extensively paved, and storm and samtary sewers divert water, which formerly entered the ground, to tidewater north and south of the county. Natural recharge to the aquifers has been reduced to about one half of the preurban rate and IS below the withdrawal rate Ground-water levels have dechned more than 40 feet from the earhest-known levels, m 1903, to 1967, and the water table IS below sea level m much of the county.
The aqmfers are bemg contammated by the movement of salty ground water toward the deepest parts of the cone of depression m central Queens County Contammatwn of ground water IS probably also occurrmg from leakmg sewers and from pollutants leakmg downward from the land surface
Al

A2 WATER IN THE URBAN ENVIRONMENT
Thermal pollution of the ground water has occurred locally where ground water pumped for coohng uses IS IetUlned, with elevated temperatures, to the source aqmfer through recharge wells
The quahty of ground water m Queens County m 1967 was generally satisfactory for pubhc-supply and most mdustr~al uses. However, the rate and distributiOn of ground-water withdrawals m the county are leadmg to greater declme of the water table and to mcreasmg contammation of the aquifers No "safe limit" on pumpage can be set for the county because hmits on the effects of pumpmg have not been estabhshed A safe hmit, at the present stage of urbamzatwn, could range from considerably less than the current average 60 mgd to considerably more over a wide-range of pumpmg effects and acceptable water quahty. However, contmued removal of fresh water from storage and deterwratwn of water quahty reduces the value of the county's aqmfers, not only for current supply, but also for additional supply to the county and other parts of New York City m times of drought or other emergency
INTRODUCTION
Although the water supply for most of the nearly 2 rrullion people In Queens County, Long Island, N.Y., IS obtained from upstate surface-water sources of the New York City water-supply system, ground water pumped by two private water-supply companies has been serving the needs of about 750,000 people In the south-central part of the county. Therefore, the ground water in the county IS of vital concern to a sizable populatiOn. In addition, the county's ground-water resources have Significant potential value as a possible emergency water supply for other parts of New York City.
Net pumpage from sand and gravel aquifers in Queens County averaged about 60 mgd (million gallons per day) from about 1900 through 1967, and ground-water levels have declined considerably, reflecting a large loss of ground-water storage. Another result of the reduced ground-water heads IS that salty ground water IS slowly moving Into the aquifers of the county, partially replacing fresh water pumped from the aquifers. An Imbalance between pumpage and fresh-water recharge had occurred over a periOd of decades and still existed at the end of 1967, and salt-water contaminatiOn of the aquifers will continue as long as the Imbalance exists.
The basis for this report IS a study designed to evaluate the hydrologic regimen of Queens County and to emphasize changes In the regimen resulting from the activities of man. The study began In 1959, and fieldwork was completed In 1968; this report largely emphasizes geohydrologic conditions in Queens In 1961 and 1968, at which times comprehensive field studies were made. The report descnbes the occurrence, availability, and quality of
GROUND WATER AND GEOHYDROLOGY, LONG ISLAND A3
ground water In Queens County, and the relatwns between various elements of the geohydrologic system. The maJor purpose of this report IS to provide InformatiOn that will aid In the development, use, and conservatiOn of the ground-water supply for current and future needs; the report Will also provide a basis for further studies.
The study of Queens County was made In cooperation with the New York State Department of Environmental ConservatiOn. The report, which Includes Information obtained from a series of water-resources Investigations made on Long Island by the U.S. Geological Survey since 1932, has benefited from prevwus and contemporary work of colleagues too numerous to cite Individually. The study was also aided significantly by the cooperatiOn of the Lauman Co., Inc., and Layne-New York Co., Inc., well-drilling firms that provided many well logs and dnlhng samples; the Jamaica Water Supply Co. and the New York Water Service, DivisiOn of Utilities and Industries Corp., which provided water-level data and chemical analyses. Other industrial and commercial establishments, Individuals, and public agencies, too numerous to cite, generously supplied InformatiOn and permitted collection of waterlevel data and water samples from their wells.
The report was prepared under the supervisiOn of Philip Cohen, assistant district chief, Long Island, and G. G. Parker, district chief, In charge of U.S. Geological Survey water-resources studies In New York.
Selected reports of related InvestigatiOns that are especially pertinent to this study are hsted under "References cited". A more detailed descnptwn of the subsurface geology of the county IS presently being prepared by the writer, and many of those geological details were used to evaluate the geohydrologiC conditions discussed in this report.
GEOGRAPHY LOCATION AND EXTENT OF AREA
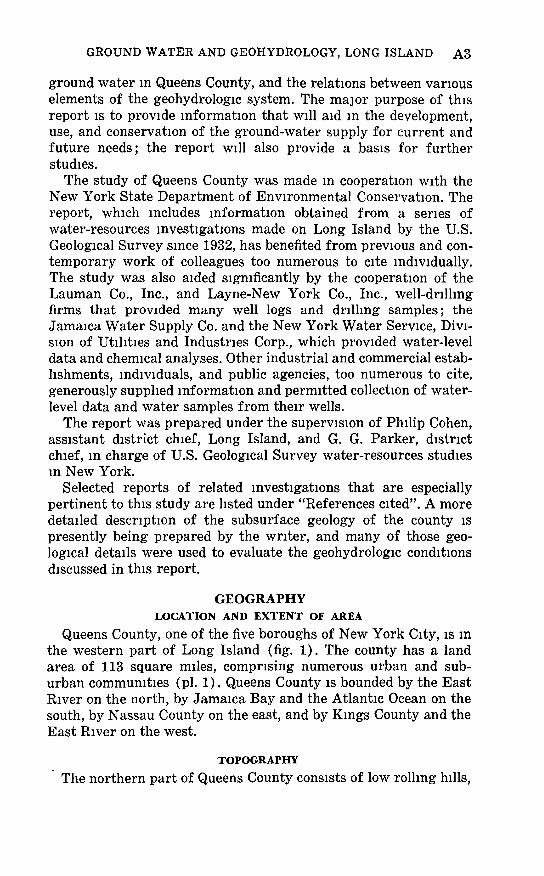
Queens County, one of the five boroughs of New York City, IS In the western part of Long Island (fig. 1). The county has a land area of 113 square miles, compnsing numerous urban and suburban communities (pl. 1). Queens County IS bounded by the East River on the north, by Jamaica Bay and the Atlantic Ocean on the south, by Nassau County on the east, and by Kings County and the East River on the west.
TOPOGRAPHY
The northern part of Queens County consists of low rolhng hills,

A4 WATER IN THE URBAN ENVIRONMENT
74° 73°
41°
I 20 30 MILES _j__ J
FIGURE 1.- Location of Queens County and general regional geography.
overlooking and locally jutting into the East River between various salt-water bays. A narrow ridge trends about east-northeast across the central part of the county north of and parallel to Jamaica Avenue (pl. 1). The base of the ridge is at an altitude of about 100 feet above mean sea level, and the width of the base ranges from about 0.75 mile on the western part of the county to about 1.5 miles on the eastern part. The crest of the ridge ranges in altitude from about 160 feet on the west to about 260 feet on the east.
Two flat-bottomed valleys extend northward from the ridge to the East River. The larger valley, Flushing Meadow, is in the central part of the area, and the smaller valley, Alley Creek, is near the eastern border of the county. A plain slopes gently southward from the ridge to Jamaica Bay. The southernmost part of the county, the Rockaway Peninsula, lies south of Jamaica Bay and is mainly a barrier bar which trends west-southwest into the Atlantic Ocean. The surface of the peninsula generally is 10 feet or less above sea level, and its maximum height is about 23 feet above sea level in Far Rockaway.
DRAINAGE
According to U.S. Weather Bureau statistics, the long-term average annual precipitation in Queens County is about 44 inches, but precipitation averaged about 33 inches annually from 1962 through 1966, a period of drought in the area. Most of the precipitation runs off paved surfaces to sewers and is discharged to tidewater. Some precipitation, however, penetrates the land surface, principally in unpaved areas, and percolates downward to the water table where it joins the ground-water body. (See the
GROUND WATER AND GEOHYDROLOGY, LONG ISLAND A5
section "Inflow and recharge of ground water.") Little precipitation In the county enters natural streams by direct runoff
In contrast with the many streams that existed In 1897 (as shown on older U.S. Geological Survey topographic mapsBrooklyn, Harlem, Hempstead, and Oyster Bay quadrangles), only a few streams occur In Queens County at present. Brookfield
' Stream and three former streams, all of which flowed Into JamaiCa Bay, had a combined discharge of about 13 mgd In the mid-1850's (Veatch and others, 1906, p. 366). Although data are not available for the many other streams In preurban Queens County, the total stream discharge from the county probably exceeded 30 mgd and doubtless consisted mostly of ground-water seepage.
Most of the streams disappeared because of lowering of the water table, artificial filhng of channels, and reduction of runoff resulting from other aspects of urbanizatiOn. The present streams are In near-shore areas where the water table IS near the land surface. Of these present stremns, Flushing and Alley Creeks flow northward to Flushing and Little Neck Bays, respectively, and Brookfield Stream flows southward to Jamaica Bay. (See pl. 1.) Flushing Creek IS dammed by a tidegate near Its mouth, and there IS no VISible natural outward flow to Flushing Bay. The amount of water that enters Flushing Creek apparently IS about equal to evaporation losses from the ponds (Meadow and Willow Lakes) on It. The headwaters of Brookfield Stream onginally were In Nassau County, but lowering of the water table has dewatered the upstream reach of this stream.
Selected discharge measurments obtmned by the U.S. Geological Survey at Alley Creek and Brookfield Stream are given In the following table:
Stream
Alley Creek
Location of measurmg s1te
South Side of Northern Boulevard
Brookfield Stream About 0 6 m1le south of Southern Parkway
CULTURE
Date of measui ement
June 17, 1967
Jan 15, 1963 Apr 10, 1962 June 19, 1967
Discharge (cubic feet
per second)
23
36 49
2
Feb 5, 1963 4 Mar 9, 1955 2 0 Aug -Dec 1852 3 9-7 4
Although highly urban areas occur throughout the county, suburban communities charactenzed by one- and two-family homes are common. Urban charactensbcs are most highly developed In

A6 WATER IN THE URBAN ENVIRONMENT
the western part of the county, where most of the closely spaced apartment houses, from two to as many as 20 stones, and most Industnes are located In 1960 Queens County had the second largest population of the five boroughs of New York City. Statistics of the US Bureau of the Census show that Queens County had a population of about 1.8 million In 1960, which was more than 20 times Its populatiOn In 1890. The greatest Increase In a Single decade occurred from 1920 to 1930, when the population Increased from about 181,000 to about 610,000. The Increased water needs accompanying the population growth were met largely by Increased Importation of water from the New York City system, except In the south-central part of Queens County where ground water is used
The county census statistics for 1960 hst more than 10,000 stores, ranging from small shops to large multilevel department stores, and hundreds of factones and service Industnes. Although substantial volumes of ground water are pumped for use by these establishments, most of the ground water IS not consumed, but IS used mainly for air conditioning or Industrial cooling and then returned to the ground-water reservmr. (See the section "Ubhzation of ground water.")
The area Is traversed by thousands of paved streets and sidewalks and by many maJor highways (pl. 1). The central and western parts of the county are traversed by municipal-owned rapid-transit surface and subway railroads and by the Long Island Railroad. Two large commercial airports are In the county: New York Municipal Airport In the northwestern part and John F. Kennedy International Airport In the south-central part. A significant effect of the many streets and buildings IS that the land surface In much of Queens County has been made Impermeable; consequently, InfiltratiOn of precipitation Into the ground-water reservoir has been greatly reduced.
SURFICIAL GEOLOGY
The surficial geology of Queens County, which Is descnbed bnefly In the following paragraphs, significantly affects many aspects of the local hydrology. The subsurface geology of the county IS described In the sectwn "Aquifer system" and on plate 1.
More than three-fourths of Queens County IS mantled by deposits of Pleistocene (Wisconsin) glacial drift (pl. 1). The remainder of the county (generally along or near shorelines) IS covered by shore and salt-marsh deposits and artificial fill of Holocene age.

GROUND WATER AND GEOHYDROLOGY, LONG ISLAND A7
The topography of the county IS largely related to the different glacial deposits. The low rolhng hills of northern Queens are mostly underlain by ground moraine, and to a lesser extent, by outwash deposits. The ndge across the central part of the county Is part of the Harbor Hill Terminal Mormne, which marks the farthest advance of the Wisconsin GlaCiatiOn In Queens County. East of Queens County, the ridge branches Into two ridges-the Harbor Hill Moraine, which traverses the length of the north shore of Long Island, and the Ronkonkoma Terminal Moraine, whiCh traverses the length of central Long Island.
Outwash deposits of sand and gravel, laid down by water Issuing from the melting glaciers at the end of the Pleistocene Epoch, underlie the plain south of the terminal-moraine ndge In Queens County. Salt-marsh deposits occur in Jamaica Bay, and shore deposits mantle much of the surface of the Rockaway Peninsula Artificial fill has been used to extend and reinforce shorelines and to eliminate swampy areas.
AQUIFER SYSTEM
GEOHYDROLOGIC SETTING
Virtually all the fresh-water resources of Queens County are contained in the ground-water reservoir beneath the county. The reservoir, which comprises a sequence of unconsolidated sedimentary deposits that range In age from Late Cretaceous to Pleistocene, rests on a relatively featureless eroswnal surface formed on crystalline bedrock of Precambrian ( ?) age (pl. 1). Small exposures of the bedrock crop out near the East River in Astoria and Long Island City (pl. 1). The bedrock surface dips about 80 feet per mile to the southeast and Is at a depth of about 1,100 feet below sea level at Far Rockaway. Thus, the unconsolidated deposits form a wedgeshaped mass which ranges In thickness from zero In northwestern Queens to about 1,100 feet In the southeastern part of the county. For practical purposes, the bedrock surface Is considered to be the bottom of the ground-water reservoir.
The deposits that transmit water readily to wells are called aquifers. In Queens County the maJor aquifers are layers of sand and gravel. The layers of clay and silt In the ground-water reservoir do not transmit water readily, and they confine the water under artesian pressure Ill the aquifers lying between them. Four distinct aquifers occur In Queens County. They are, In descending order, the upper glacial aquifer, the J ameco aquifer, the Magothy aquifer, and the Lloyd aquifer; the aquifer names are those adopted by Cohen, Franke, and Foxworthy (1968, p. 18).

A8 WATER IN THE URBAN ENVIRONMENT
UPPER GLACIAL AQUIFER
The upper glacial aquifer Is the uppermost water-bearing unit. It consists mainly of glacial-outwash deposits of sand and gravel south of the terminal moraine and of ground-moraine deposits north of the terminal moraine Its thickness ranges from a few feet In northwestern Queens and In the Whitestone area of the county (pl. 1, section A-A',) to about 150 feet near Woodhaven and Hollis (pl. 1, sectwn B-B',). Vanous units Included In this aquifer' (pl. 1) are exposed at the land surface throughout the county.
Laboratory tests for porosity and permeability of a sample of medium sand from the upper glacial aquifer were made by the US. Geological Survey Hydrologic Laboratory. The porosity IS 40 percent and the coefficient of permeability (rate of water flow, In gallons per day, through 1 square foot under a gradient of 100 percent) IS about 1,000 gpd per sq ft. The coefficients of permeability are probably much higher for the coarse sand and gravel in the outwash deposits. Accordingly, the average coefficient of permeability In the horizontal directiOn of the outwash deposits of the upper glacial aquifer In Queens County is estimated to be 1,500 gpd per sq ft.
Ground water occurs under water table (unconfined) conditions In most of the upper glacial aquifer south of the terminal moraine. From the terminal moraine northward, ground water In the aquifer occurs under conditions of variOus degrees of confinement because of complex Interbedding of layers of sand and gravel, ground-moraine, and other glacial deposits.
In Queens County, the upper glacial aquifer Is most extensively pumped In the central part of the county, between the Harbor Hill Terminal Moraine and Jamaica Bay. In this area the aquifer conSists of thick coarse outwash deposits that are capable of yielding large quantities of water to wells. From the terminal moraine northward, the aquifer becomes thinner and contains much clayey and silty till and ground moraine. Consequently, In the northern part of the county the aquifer IS less permeable and contains less ground water In storage than It does south of the terminal moraine. Public-supply and other large-yield wells tapping outwash deposits south of the terminal moraine produce as much as 1,500 gpm (gallons per minute) per well. The specific capacities (gpm pumped per ft of drawdown) of these wells are generally about 50-60 gpm per ft, but specific capacities as large as 139 gpm have been noted.
JAMECO AQUIFER
The main part of the J ameco aquifer IS In a buned valley which extends southward from the Flushing Meadow area to the area of

GROUND WATER AND GEOHYDROLOGY, LONG ISLAND A9
the John F. Kennedy InternatiOnal Airport, from where It passes seaward under the Rockaway Peninsula. Smaller bodies of the aquifer occur In the Ridgewood area (pl. 1, sectwn B-B') and In the Maspeth area. In these latter areas the Magothy aquifer IS miSSing, and the J ameco aquifer hes between the Gardiners Clay and the Raritan clay member (Ridgewood area) or between the Gardiners Clay and bedrock (Maspeth area). The Jameco aquifer attains a maximum thickness of about 250 feet In central Queens County, and It Is generally less than 50 feet thick In the Ridgewood and Maspeth areas
In most places water In the J ameco aquifer IS confined by the overlying Gardiners Clay. In the Woodhaven-Ozone Park area, however, the Gardiners Clay either was not deposited or It was removed by eroswn, and there the J ameco aquifer Is overlain directly by outwash deposits of the upper glacial aquifer. Consequently, water In the J ameco aquifer IS under water-table conditions In that area.
The Jameco aquifer consists mostly of coarse sand and gravel with only small amounts of silt and clay. Permeability data are not avmlable for the Jameco aquifer, but locally the Jmpeco probably IS the most permeable of all the aquifers in Queens County. Locally, the coefficient of permeability of the J ameco aquifer may be as much as 2,000 gpd per sq ft. Wells tapping the aquifer In central Queens County yield as much as 1,600 gpm, and such wells have specific capacities as large as 180 gpm per ft.
MAGOTHY AQUIFER
The Magothy aquifer underlies the upper glacial aquifer In most of Queens County but IS missing in the western and northern parts of the county. The Magothy also is missing In the Flushing Meadow area and In the central part of the buried valley, where It has been replaced by the Jameco aquifer. (See pl. 1.)
The Magothy aquifer, which Includes the Matawan GroupMagothy Formatwn undifferentiated (Perlmutter and Todd, 1965, p. 9), consists chiefly of Intercalated beds and lenses of clay, clayey and silty sand, fine to coarse sand, and gravelly sand. The most persistent lithologic zone In the aquifer IS a basal unit of sand and gravel about 50 to 100 feet thick. Farther east on Long Island the maximum thickness of the basal zone IS about 200 feet The sand and gravel strata commonly contain Interstitial clay and silt In amounts ranging from traces to about 25 percent.
The Magothy aquifer ranges In thickness from zero, where 1t wedges out In western and northern Queens and In the bur1ed valley, to about 450 feet at Far Rockaway. The wide range In

A10 WATER IN THE URBAN ENVIRONMENT
thickness reflects the fact that the aquifer was deeply eroded pnor to the depositiOn of the Pleistocene units. (See pl. 1.)
Water In the Magothy aquifer ranges from poorly confined to highly confined. Generally, water In the upper part IS poorly confined, where the aquifer Is directly overlain by the upper glacial aquifer In most parts of the county, water that occurs farther below the top of the Magothy aquifer IS confined by clayey and silty beds within the aquifer Itself, and water In the basal sand and gravel locally IS well confined. The aquifer IS well confined In the buned valley In south-central Queens County by the overlying Gardiners Clay (pl. 1) . There, the Gardiners Clay overlies the Magothy aquifer either directly (along the margins of the buned valley) or It overlies the Jameco aquifer which, In turn, overlies the Magothy. The sloping contact between the Magothy and J ameco aquifers results Ill broad lateral and vertical hydraulic Interconnection between them.
The porosity and permeability of the Magothy aquifer range widely because of the vaned lithology of Its beds. Perlmutter and Geraghty (1963, p. 30) listed coefficients of permeability that range from 500 to 1,450 gpd per sq ft and average about 950 gpd per sq ft, for disturbed sand samples from the aquifer in southeastern Queens County and adJacent southwestern Nassau County. Wenzel and Fishel (1942, p. 13) show a porosity of 31.4 percent and a coefficient of permeability of 1,200 gpd per sq ft for a sample taken from the basal zone of the Magothy aquifer in the Queens VIllage area. The coefficients of permeability for Isolated sand samples, of course, are not necessanly representative of the entire aquifer. The coefficients of permeability of the finer materials In the aquifer probably range from less than 0.2 to about 100 gpd per sq ft. Furthermore, because of the stratificatiOn of the sand, clay, and silt beds, the permeability of the Magothy aquifer In the horizontal direction IS much greater than In the vertical directiOn. For the purposes of this report, the average coefficient of permeability of the Magothy aquifer In the honzontal directiOn IS estimated to be 500 gpd per sq ft.
Wells tapping the Magothy aquifer yield as much as 1,500 gpm Specific capacities range from 15 to 30 gpm per ft for wells that tap fine-grained layers in the aquifer to as much as 50 gpm per ft for wells screened In the coarser matenals.
LLOYD AQUIFER
The Lloyd aquifer, which consists of the Upper Cretaceous Lloyd Sand Member of the Raritan FormatiOn, IS the lowermost maJor water-beanng unit In Queens County. The aquifer IS highly con-

GROUND WATER AND GEOHYDROLOGY, LONG ISLAND All
fined between the underlying bedrock and the overlying poorly permeable Raritan clay member. The Lloyd aquifer was not deposited In northwestern Queens. It IS about 300 feet thick at Far Rockaway (pl. 1, sectiOn A-A'), but becomes thinner to the northwest and tapers to a knife edge along a line approximately between Ridgewood and the New York Municipal Airport. The Lloyd aquifer and other Cretaceous units also are missing In buried valleys between the New York Municipal Airport and College P01nt, between College Point and Whitestone, and In the Flushing Meadow area.
The Lloyd aquifer consists of beds of sand and gravel Intercalated with beds of clay and silt The sand and gravel beds commonly contain varying amounts of Interstitial clay and silt. Tests by Jacob (1941, p. 784) Indicated that the coefficient of permeability of the Lloyd aquifer In the VICinity of Rockaway Park ranges from about 700 to 800 gpd per sq ft. Lusczynski and Swarzenski (1966, p. 19) reevaluated Jacob's data and estimated that the average coefficient of permeability of the Lloyd aquifer in the horizontal directiOn In that area IS about 500 gpd per sq ft. Coefficients of permeability of the Lloyd aquifer at six sites In central Queens County were estimated from specific-capacity data by a method described by Meyer ( 1963, p. 339). These values range from about 150 to 830 gpd per sq ft and average about 430 gpd per sq ft Thus, the average coefficient of permeability of the Lloyd aquifer (In the horizontal directwn) In Queens County IS estimated to be between 400 and 500 gpd per sq ft.
High-capacity wells screened In the Lloyd aquifer are commonly pumped at less than 1,000 gpm; however, pumpage of as much as 1,600 gpm from a single well has been reported. Specific capacities of Lloyd wells In the county range from 4 to about 40 gpm per ft.
MOVEMENT OF WATER THROUGH THE HYDROLOGIC SYSTEM
The fresh ground water In Queens County Is part of a continuous hydrologic system In which, under natural (preurban) conditions, the long-term average outflow and Inflow were equal. Ground water was replenished entirely by local precipitation that Infiltrated the land surface and percolated down to the upper glacial aquifer In the upper glacial aquifer, most of the ground water moved laterally toward the north and south shores of the county and ultimately discharged by evaporatiOn, transpiratiOn, seepage Into salt-water bodies, and seepage Into streams which flowed Into the salt-water bodies. In the higher, central part of the county, where the altitude of the water table was higher than the hydraulic

Al2 WATER IN THE URBAN ENVIRONMENT
heads In the deeper aquifers, some ground water percolated downward from the upper glac1al aquifer through leaky confining beds Into the J ameco, Magothy, and Lloyd aquifers. Most of the water 1n these deeper aquifers then moved seaward and discharged Into bod1es of salty ground water near the shores.
Two of the maJor factors that have modified the natural hydrologic regimen In the county are the reduced InfiltratiOn of preCipitatiOn resulting from paving, building, and sewers, and the large-scale withdrawals of ground water. The resulting maJOr declines of the water table and artesian pressures have Induced or Increased the Inflow of ground water from ad] acent counties and also have induced landward movement of salty ground water In the near-shore areas. In 1968, salty ground water was moving landward In the upper glacial, J ameco, and Magothy aquifers, and probably also In the Lloyd aquifer, toward centers of pumping. (See the section "Salt-water IntrusiOn.")
At the current (1968) stage of urbanizatiOn, precipitation, water Imported from the mainland New York City reservoir system (about 195 mgd In 1968), and lateral subsurface Inflow from adJacent parts of Long Island are the sole sources of fresh water In Queens County. Fresh water presently recharges the ground-water reservoir of Queens County mainly by: (1) InfiltratiOn of preCipitation, (2) subsurface Inflow of ground water from Kings and Nassau Counties, and (3) leakage from New York City supply pipelines carrying water from upstate New York. In addition to the fresh water, some salty ground water enters the county by Induced landward movement resulting from pumping, and possibly minor amounts of water may leak Into the ground-water reservmr from storm-sanitary sewers.
Water IS discharged from Queens County by: (1) runoff of precipitation to tidewater, mainly through sewers, and to a small degree through the few remaining streams, ( 2) outflow to tidewater of sewage water denved from local ground water and from Imported water, (3) subsurface outflow of ground water to salty water In the shore areas, and ( 4) evapotranspiratiOn. Subsurface outflow of ground water to adJacent counties IS practically negligible.
WATER-TABLE AND PIEZOMETRIC SURFACES
The first known map of the water table (upper surface of the ground water) In Long Island was made In 1903 (Veatch and others, 1906, pl 12), and that map depicted, as nearly as the available data permitted, the natural position of the water table In Queens County. Since about the 1920's decreased ground-water

GROUND WATER AND GEOHYDROLOGY, LONG ISLAND A13
recharge, coupled with large ground-water withdrawals (mostly from the Uf>per glacial aquifer), resulted In the development of cones of depressiOn In the water table and In the piezometnc surfaces of the confined aquifers. The cone of depressiOn In the water table was first observed In the early 1930's (Suter, 1937, p. 48) and was still growing In 1968. •
The configuration of the water table In Queens County was mapped In 1961 and In 1968, and the water-table maps are shown on plate 2A and B; these maps show large changes from the 1930's. The cone of depressiOn mapped In 1936 by Suter (1937, fig. 26) was centered In the Woodhaven area of the county where the water table was between 5 and 10 feet below sea level By 1961 the cone's center Included the Woodhaven-Richmond Hill areas, In which the water table had declined to more than 15 feet below sea level (pl. 2A). In 1968 the center of the cone of depressiOn was more complex, having spread northeastward Into the southern part of Flushing and eastward Into Holhs. The water table In 1968 was more than 15 feet below sea level In the Woodhaven, Richmond Hill, and Flushing areas and about 10 feet below sea level in Holhs (pl. 2B). The spread of the cone of depression Into the Flushing area was caused by new pubhc-supply wells which began pumping In 1963 (pl. 1) ; the eastward extensiOn of the cone to Holhs was the continuation of the trend of the cone's growth with new well Installations, mostly in the east-central part of the county after World War II.
The 1968 water-table map (pl. 2B) and the 1903 water-table map made by Veatch and others (1906, pl. 12) were used to prepare figure 2, which Is a map showing the net change In the position of the water table between these years. In 1968 the water table 1n the deepest parts of the complex cone of depressiOn was more than 40 feet below water-table levels of 1903 In the areas, and significant decline of the water-table was evident throughout most of the county's area. However, the water table had not been drawn below the upper glacial aquifer to 1968.
The zero net-change hne In figure 2 encloses an area of about 80 square miles In Queens County, and this hne IS considered to be the extent of the cone of depressiOn In 1968. The cone of depressiOn does not he wholly within Queens County; It extends eastward Into Nassau County where the effects of pumping In Queens County merge with the effects of pumping in Nassau County; the cone also extends westward a short distance Into Kings County.
The large central area enclosed by the minus-10-foot hne (fig. 2) IS oval-shaped, with the long axis of the oval trending eastnortheast. This hne encloses an area where all the pubhc-supply

A14 WATER IN THE URBAN ENVIRONMENT
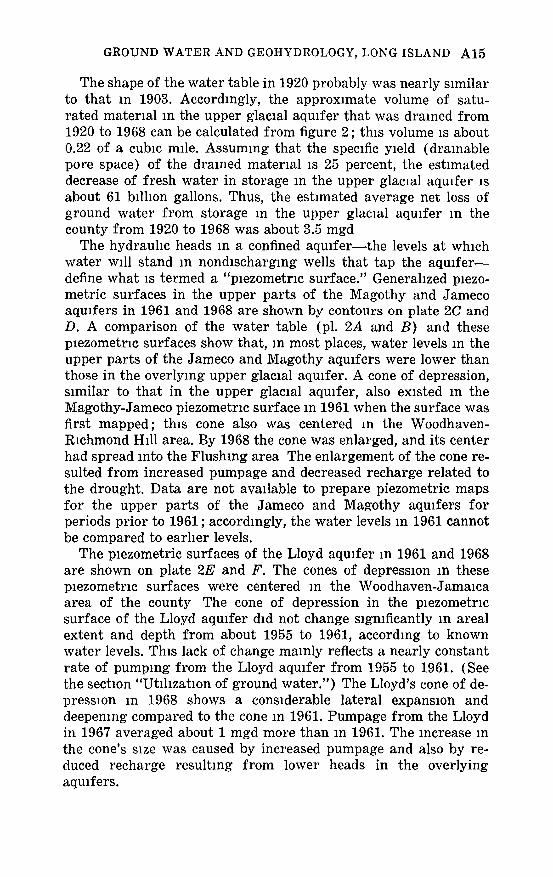
FIGURE 2.-Approximately net change in the position of the water table in the upper glacial aquifer from mid-1903 to the end of 1967.
wells in the county were situated in 1968. Moreover, the deepest parts of the cone of depression also reflect this distribution of wells.
The increase in the size of the cone of depression in the water table from 1961 to 1968 (pl. 2A and B) was caused by a combination of reduced recharge from 1962 through 1966 associated with drought conditions in the area (Cohen, Franke, and McClymonds 1969, p. 9) and continued large ground-water pumpage.
GROUND WATER AND GEOHYDROLOGY, LONG ISLAND A15
The shape of the water table in 1920 probably was nearly similar to that In 1903. Accordingly, the approximate volume of saturated material In the upper glacial aquifer that was drained from 1920 to 1968 can be calculated from figure 2; this volume IS about 0.22 of a cubic mile. Assuming that the specific yield ( drainable pore space) of the drained matenal IS 25 percent, the estimated decrease of fresh water in storage In the upper glacial aquifer Is about 61 billiOn gallons. Thus, the estimated average net loss of ground water from storage In the upper glacial aquifer In the county from 1920 to 1968 was about 3.5 mgd
The hydraulic heads In a confined aquifer-the levels at which water Will stand In nondischarging wells that tap the aquiferdefine what Is termed a "piezometnc surface." Generalized piezometric surfaces in the upper parts of the Magothy and J ameco aquifers in 1961 and 1968 are shown by contours on plate 2C and D. A comparison of the water table (pl. 2A and B) and these piezometric surfaces show that, In most places, water levels In the upper parts of the J ameco and Magothy aquifers were lower than those in the overlying upper glacial aquifer. A cone of depression, similar to that in the upper glacial aquifer, also existed In the Magothy-Jameco piezometric surface In 1961 when the surface was first mapped; this cone also was centered In the WoodhavenRichmond Hill area. By 1968 the cone was enlarged, and its center had spread Into the Flushing area The enlargement of the cone resulted from increased pumpage and decreased recharge related to the drought. Data are not available to prepare piezometric maps for the upper parts of the J ameco and Magothy aquifers for periods prior to 1961; accordingly, the water levels In 1961 cannot be compared to earlier levels.
The piezometric surfaces of the Lloyd aquifer In 1961 and 1968 are shown on plate 2E and F. The cones of depressiOn In these piezometric surfaces were centered In the Woodhaven-J ammca area of the county The cone of depression in the piezometric surface of the Lloyd aquifer did not change significantly In areal extent and depth from about 1955 to 1961, according to known water levels. This lack of change mainly reflects a nearly constant rate of pumping from the Lloyd aquifer from 1955 to 1961. (See the sectiOn "Ubhzabon of ground water.") The Lloyd's cone of depressiOn In 1968 shows a considerable lateral expansion and deepening compared to the cone In 1961. Pumpage from the Lloyd in 1967 averaged about 1 mgd more than In 1961. The Increase In the cone's size was caused by increased pumpage and also by reduced recharge resulting from lower heads in the overlying aquifers.

<..n
GROUND WATER LEVEL, IN FEET ABOVE OR BELOW SEA LEVEL c; ;J; ~ N
<..n w 0
w <..n
1939 / 0
I J
1940 s ~ ,0 r I"V ......
/ ~ ~ ~ 1941 J 0 / :0
1942 5: i ~ ~ I I 1943 ~ ( ~~ 7 ~
_....... D.1:g ~ o:.... 1944 I"V ..-I' -- .::: ""
~ ....._ ~66 ~ :g I r-.. 3"" T ~ 5 1945 ;::::;- V'" ~ -o ( "' = 1
g--~J-~~ <: <"" L 1946 :? ~ / ~~ _?.
o<» n OQ ...... "") ..... 3 1947 g~? : ~
"'~~ .0~ "" ..........._ 1948 ""tl~ ~ ~ ;; ___2 Q) Q) ("D .c ;:s ;. 3 ...... c:
1949 ~ _.Jl> 57 ~ 1950 i -( v ~ L1 1951 !:f 7 I( ~ 1952 ~ '\ _) '---;
1953 S: (~ ~~ ~ 1954 ./, c;! ( 1955 ~~ ~ l.
.jJ 1956 ( ? 1/ 1957 ? _lf'" /,/'
1958 L 13 I'! I I _)/~ 19591 ~ I ~ 1960
r-----~------~~----+-----~-+ 1961
1962 1963 ~--~;;::t----j--J---t-~\--+---+----1----+---_j
1964
1965 1966 ~~~~---p})--t--___;f-----+----+--_j __ _J
1967
1968
.LN~:WNOHIAN~ NVHHil ~H.L NI H3:.L V M 91V
~
g ~ C\:1
I = '< 0.. ., 0
~ r>l 't:l ::r rn 0 ..... rn n> (;) () <"t-n> 0..
~ ~ ¥ .... co ~ co I 0') ...;J
1939
1940
1941
1942
1943
1944
1945
1946
1947
1948
1949
1950
1951
1952
1953
1954
1955
1956
1957
1958
1959
1960
1961
1962
1963
1964
1965
1966
1967
1968
I 5
I c.n
Q
u..., t-...
GROUND WATER LEVEL, IN FEET ABOVE OR BELOW SEA LEVEL I
'8 "" oc; _c <0 0
;:::-0..
"' "' :0 A:! or ~~ "'::I ::Eoco 0 0 <:: 0.. -c
~ 0<:1
~ ~
00 c.n
f ~
c....
L__-1------r! ~-2'5
c
~
G '5~ c~
~~ <" -:::::.
__s-
<~
_J
", ., Cl) .0 1.._~ -----1
"', c.c <::
' ~
'""' :;
'i, \ '"'(
\
~ \ I
9
< }... "'(
r'"'
~ I
/ l
}1
f Q_.
't?
--~ 2 r--t::; r
00 ....___--+-,------=
~~ 15 -; ~ -:g ~
:; ("~ -0:: ....... ,
0 /o --~ ~ --~- ~7 -:; "-...,
3"' -=~ 1! ~
~~ :;z [::7 ~~
? (
L 1V GNV'ISI DNO'l 'XDO'IOHGA.H03:D QNV H3:.L V .M. QNflORD

A18 WATER IN THE URBAN ENVIRONMENT
WATER-LEVEL FLUCTUATIONS
FluctuatiOns of water levels In wells In Queens County reflect variatiOns Ill recharge to and discharge from the aquifers tapped by the wells. These fluctuations are also related to the distribution, extent, and permeabilities of the aquifers, and the manner by which water moves through the ground-water system. Therefore, changes In ground-water levels afford an Insight Into the entire pattern of ground-water flow Furthermore, the fluctuations can be used to assess the Impact of urbanizatiOn on the natural hydrologic system
Data from relatively undeveloped areas In eastern Long Island, where conditions approximate those present Ill Queens County before urbanization, IndiCate that under natural conditions groundwater levels fluctuated only a few feet. The water table had a rhythmic seasonal pattern of highest levels in early spring and lowest levels In late autumn. That pattern reflected greatest losses of rain and ground water by evapotranspiratiOn during the growIng season, and the least such losses between growing seasons. The pattern of seasonal decline and recovery of the water table now occurs only In shoreline areas of the county.
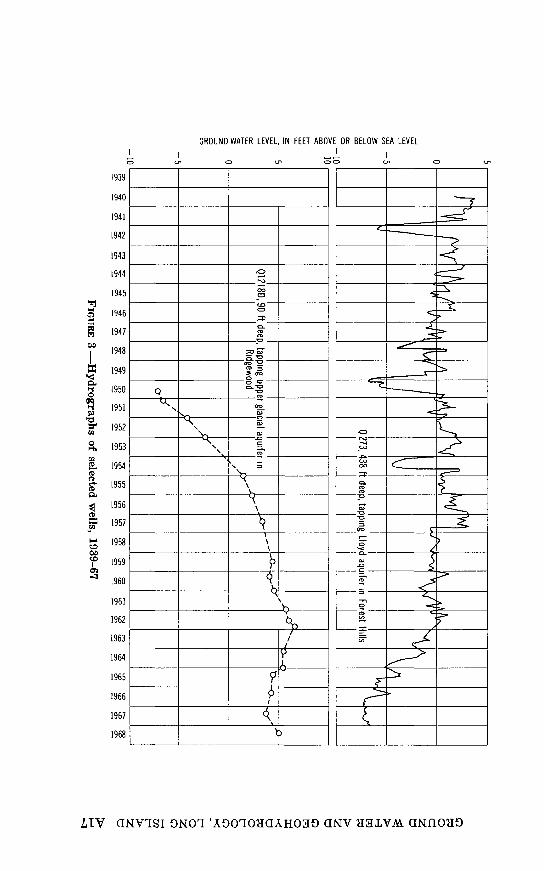
The general pattern of progressively declining ground-water levels In the county (associated with Intensive ground-water development and decreased recharge) are shown by the hydrographs In figure 3. Only one of the hydrographs, that for well Q1218D, shows a riSing water level during the years prwr to 1961. That rise, which occurred In the Ridgewood area, resulted from a recovery of the water table related to the discontinuation of publicsupply pumping In neighboring Kings County 1n 1947. The decline In the water level at well Q1218D from 1962 to 1967 Is Interpreted as having been largely due to drought.
The more common declining trend of the water table IS shown by the hydrographs for wells Q1249 and Q1252. The hydrograph of well Q1237 reflects the somewhat lesser head declines In the J ameco aquifer during the same perwd. The hydrograph of well Q273, which taps the Lloyd aquifer In Forest Hills, shows that hydraulic heads In the Lloyd In that locality had declined very little prwr to 1961. All the hydrographs In figure 3 show declining water levels from 1962 to 1967. The drought conditions, described previOusly, probably caused much of the decline.
Depths to ground water from the land surface in 1961 and 1968 can be estimated from plate 2. Contour lines on the land surface and ground-water surfaces are given In the figures. The depth to
GROUND WATER AND GEOHYDROLOGY, LONG ISLAND A19
water 1n the aqu1fers, at any g1ven locatwn, IS the difference between the land-surface and water-surface altitudes at the locatwn.
HYDRAULIC INTERCONNECTION OF AQUIFERS
Ground water percolates downward readily through the outwash deposits of sand and gravel In the upper glacial aquifer because of the high permeability and general absence of clay and silt layers In these deposits. Ground water moves less readily through the ground-moraine and till deposits In the upper glacial aquifer, and also through the Magothy aqu1fer, because of the low permeability ( espec1ally In the vertical direction) of the clay and silt In these deposits. However, the discontinuous nature of the clay and silt beds In the ground mormne, till, and 1n the Magothy aquifer locally facilitates downward movement of water through the aquifers.
Ground water moves readily from the upper glacial aquifer 1nto the Magothy aqu1fer, except 1n south-central and southern Queens County where the Gardiners Clay separates the two aqu1fers. The Gardiners Clay also retards the downward movement of ground water 1nto the Jameco aqu1fer 1n most of Queens County. However, the Gardiners Clay IS missing In the Woodhaven, Ozone Park, and South Ozone Park areas, and ground water moves easily between the upper glacial and J ameco aqu1fers In these areas. Locally, where the Jameco and Magothy aquifers are adJacent to ' each other (pl. 1), ground water can move laterally from one aquifer to the other.
Downward movement of ground water into the Lloyd aquifer IS generally retarded by the thick and areally extensive Rantan clay member. However, In the buned valley beneath the Flushing Meadow area, the Raritan clay member was removed by eroswn, and ground water flows Into the Lloyd aquifer from contiguous beds of sand and gravel in the upper glacial aqu1fer. This downward movement from the upper glacial aquifer Into the Lloyd aquifer 1s confirmed by a mound 1n the p1ezometric surface of the Lloyd aquifer In that area, shown by the positive 5- and 1-foot contours on plate 2E and F. The decrease In the he1ght of the mound from 1961 to 1968 was due pnmanly to local pumpage for the New York World Fair (1964-65) and new pubhc-supply withdrawals In the Flush1ng area beginning 1n 1963, and, probably to a lesser extent, 1t was due to reduced recharge dunng the drought years 1962-66.
Most of the water pumped from the Magothy aquifer In Queens County In 1968 entered the aquifer by downward percolatiOn

A20 WATER IN THE URBAN ENVIRONMENT
within the county, mainly In the central and eastern parts. This Is confirmed by the water-level contours on plate 2 and by the equal potential hnes on plate 1, which show that the hydraulic heads In the Magothy aquifer were generally lower than those In the upper glacial aquifer. The remainder of the water pumped from the Magothy aquifer In Queens County was mostly denved from subsurface Inflow from neighboring Nassau and Kings Counties (see the section "Inflow and recharge of ground water"), and In part was withdrawn from storage In the aquifer as artesian pressures declined. In early 1968, however, the fact that heads In the Magothy aquifer were higher than water-table heads near Nassau County In east-central Queens IndiCated a change to an upward movement of water from the Magothy Into the upper glacial aquifer there (pl. 1). The head changes In the Magothy aquifer also IndiCate an Increase In the amount of lateral recharge to the Magothy aquifer from Nassau County from 1961 to 1968.
INFLOW AND RECHARGE OF GROUND WATER
PreCipitation that percolates to the water table and then downward to the lower aquifers has been the main source of recharge to the ground-water reservoir In Queens County. However, some water also enters the ground-water reservoir by lateral subsurface Inflow from outside the county. Most of the lateral Inflow of fresh water to the cone of depressiOn In Queens County is from Nassau County. The Inflow IS mainly through the upper glacial and Magothy aquifers, and to a lesser extent through the Lloyd aquifer.
Natural recharge frum precipitatiOn within the county can be estimated only grossly. The maximum rate of recharge on Long Island under natural conditions was estimated to be 1 mgd per square mile by Suter (1937, p. 32). In Queens County recharge from normal amounts of precipitation during the past several decades probably was on the order of 0.5 mgd per sq mi because of the reduced opportunity for InfiltratiOn due to the constructiOn of streets, buildings, automobile parking lots, and other ImperviOus surfaces. Accordingly, the estimated average recharge from precipitation In the county dunng the past several decades was about 55 mgd Dunng the drought years 1962--66, recharge from precipitatiOn probably declined to about 40 mgd or less.
Subsurface fresh-water Inflow to Queens County from Nassau and Kings Counties In 1968 was computed by use of the Darcy equatiOn, utilizing the permeability values hsted In the preceding text, aquifer dimensiOns obtained from geologic mapping, and
GROUND WATER AND GEOHYDROLOGY, LONG ISLAND A21
hydraulic-gradient data obtmned from plate 2. The computed total subsurface Inflow of fresh ground water to Queens County was on the order of 15-20 mgd. Of this amount 6-8 mgd entered through the upper glacial aquifer, 7-9 mgd came through the Magothy aquifer, and 2-3 mgd entered through the Lloyd aquifer. Most of this Inflow, about 12-17 mgd, came from Nassau County. Total Inflow from Kings County was about 2-3 mgd. The inflow from Kings County is considered to be "fresh water" although ground water there was senously contaminated by salt water prwr to cessatwn of pumping for pubhc supply In 1947 (Perlmutter and Soren, 1963,p. 138).
Salty ground water, from the zone of dlffuswn (see the section "Salt-water intruswn"), moving landward Into the cone of depressiOn In central Queens also constitutes a form of Inflow to the aquifer system, most notably 1n the Woodhaven area. The amount of such Inflow In 1968 was estimated to be at least about 2 mgd.
Some recharge also resulted from leaks and breaks In watersupply mains and, perhaps, from sewers. Records of the City of New York, Department of Water Supply, Gas, and Electncity (1958-64) show that from 1958 to 1964 an average of about 5 mgd of water-main leakage was discovered and repaired In Queens County. A study by the Jamaica Water Supply Co., the larger of the two private water-supply companies In the county, reportedly showed that water losses from its system were about 13 percent of the total pumpage. However, the "losses" Included water used for fire fighting, street washing, fire-main testing, and for uses other than supply to customers (oral commun., Mr. Thomas Sebekos, Jamaica Water Supply Co., December 1965); the percentage that constituted leakage to the ground-water reservoir Is unknown.
From the meager data avmlable on leakage from water mains, the average recharge from leakage In Queens County, Including undetected leakage from the New York City water-supply system, IS estimated to have been about 15 mgd In the 1960's. The amount of leakage from sewers Is unknown, but It IS believed to be small In companson to water-mmn leakage; sewer pipes generally are only partly full and ordinanly operate under pressures much lower than those In the water-supply mains. Where sewers flow under gravity, they operate without pump pressure.
GROUND-WATER MOVEMENT
Prior to the maJor dechne of ground-water levels In Queens County, ground-water movement was mainly seaward from the higher, central part of the county and, to a lesser extent, westward

A22 WATER IN THE URBAN ENVIRONMENT
Into Kings County. Large amounts of ground water discharged Into many short streams which, In turn, flowed Into tidewater In the northern and southern parts of the county. However, since the 1930's most of the ground-water movement has been toward the cones of depressiOn In the central part of the county, and groundwater discharge to streams has become negligible. Submarine outflow of ground water has decreased substantially and, as a result, salty water IS moving Into the aquifers (Perlmutter and others, 1959, p. 429) 0
Approximate rates of ground-water movement can be computed from hydrauhc gradients, estimated average coefficients of permeability of the aquifers, and estimated porosities of the aquifers. In the parts of the county that are distant from pumping centers, the rate of ground-water movement In the horizontal direction ranges from about 0.5 foot per day In the deeper 'aquifers to about 1.5 feet per day In the upper glacial aquifer. The extreme rates of ground-water movement In Queens County range from as httle as an extremely small fractwn of an Inch per day in clay to hundreds of feet per day In sand and gravel deposits near pumping wells.
GROUND-WATER DISCHARGE
Net ground-water pumpage-the pumpage that was consumed by evapotranspiration or was discharged to tidewater through sewers-averaged about 63 mgd during the perwd 1960-68 and was the largest element of ground-water discharge In Queens County during those years (See the section "UtilizatiOn of ground water.") Prwr to 1930 the second largest element of ground-water discharge 1n the county probably was evapotranspiratiOn. Since 1930 subsurface outflow to the bordering bodies of salty surface water was the second largest element of ground-water discharge. Subsurface outflow from Queens in 1968 Is estimated at about 10-15 mgd. Of this amount, about 1-2 mgd discharged into the East River In the northwestern part of the county; about 4-6 mgd discharged Into the East River In the northern part of the county, mostly In the Little Neck Bay area; and about 5-7 mgd discharged Into Jamaica Bay and the Atlantic Ocean In the southern part of the county.
Losses from the Queens County ground-water reservoir In 1968 by direct evapotranspiration or outflow to adJacent counties were negligible compared to other losses. EvapotranspiratiOn of ground water was very small because much of the land surface IS paved, most of the natural vegetatiOn has been removed, and former marshy areas are now filled In. VIrtually no ground water dis-

GROUND WATER AND GEOHYDROLOGY, LONG ISLAND A23
charged from Queens County Into adJacent counties as underflow from 1961 to 1968 because of the flow of most of the ground water toward the centers of the deep depressiOns In the water table and the piezometnc surfaces In the central part of Queens County. Pnor to urbanization of the area, there was some natural underflow from Nassau into Queens and from Queens to Kings County. Underflow to Kings County was undoubtedly Increased by pumpage In that county; however, since the cessation of large-scale withdrawals there In 1947, underflow to Kings has virtually ceased.
UTILIZATION OF GROUND WATER
Ground-water development began in Queens County In the 1600's with the settlement of the first Europeans In the New York City area In those days spnngs, streams, ponds, and shallow dug wells were the sources of most of the water for the people. The use of ground water for large-scale public-supply purposes began In Long Island City In the 1870's. Beginning in 1880, ground water from Queens County was pumped by New York City and exported to neighboring Kings County for public-supply use. However, this pumping was virtually discontinued In the early 1950's, and the pumping plants owned by New York City were abandoned between 1961 and 1968.
Records of ground-water pumpage In Queens County are available only from about the beginning of the 20th century. According to a compilation of pumpage data by Lusczynski and Spiegel (1954), for the perwd 1904--53, net pumpage for public-supply use during that periOd averaged about 44 mgd. A compilation of pumpage prepared by the New York State Water Resources Commission In 1963 (wntten commun.) shows that the average net pumpage for pubhc-supply use dunng the periOd 1954--61 was about 50 mgd. Net industrial pumpage is not accurately known pnor to 1933, but In that year It was about 20 mgd (Suter, 1937, p. 36). Net Industrial pumpage from 1948 to 1961 averaged about 8 mgd Net industnal pumpage declined from about 7 mgd In 1961 to about 4 mgd In 1967. As the ground-water withdrawals for use In Queens County Increased from year to year, exportation of ground water to Kings County decreased. Moreover, as pumpage for public-supply use increased in Queens County, industnal pumpage In the county decreased. Therefore, the estimated total net ground-water pumpage (for all uses) In Queens County remained fairly constant from year to year and averaged about 60 mgd from 1904 to 1967.
The average net ground-water pumpage (compiled from data

73°45' > 1\:) ~
~ 4-'-1&
>
'& ~ tz:j ~
'
"" 1-1 z ,,
~~ ~
<r ::r:
\ t:rJ
c:! ~
02 I to
45 • / > 47 03 z
I
~-_; t:rJ
'3 z
( <
25 3 6\
1-1
- 5 05
~ 0
1 0 I
z
8
~ I
~
" --I I ll
t:rJ
\
z
I
I
041
~
- 08 26 Qfi 26 0~
40° 37' 30"
EXPLANATION
~1 5 Magothy aqu1fer
Lloyd aqu1fer 0 8 Jameco aqu1fer
7 0 Upper glac1al aqu1fer
\, I
,r 0 02
0 04
wells) and ~A~':' ·~,~ ( or more , -
umpmg one ~ ~ • ' ' C.nt" of p souree aqu•fer.; l to pump- ' ~' - ""
ter of c~rcle ts pro~:~~o"::t pumpage{J, (!J\) .{ , ~ ~ \\l~-, Dwms ·~" •• ~,., n 1967 oa J. \C ) \ -' ,. I age, nl7.;:'. gallons P~ day!~:, than 01 mU- -~.., • y
mm• ump•"<J ~ .~ ~ Centers w~th :~t Jay are not shown ft!t)o \J r-;;; Ac:::>
lumgallonp / {:)~ & ~ r & ~ CJ c__:_;
GS-_R~s -- Q\l --
/ -
~~ce!) ~Jtftj
:'{ /
0\.)~ CJ 6\J
/CJ
1 0 1 2 3 MILES
73"52'30" 73 °45'
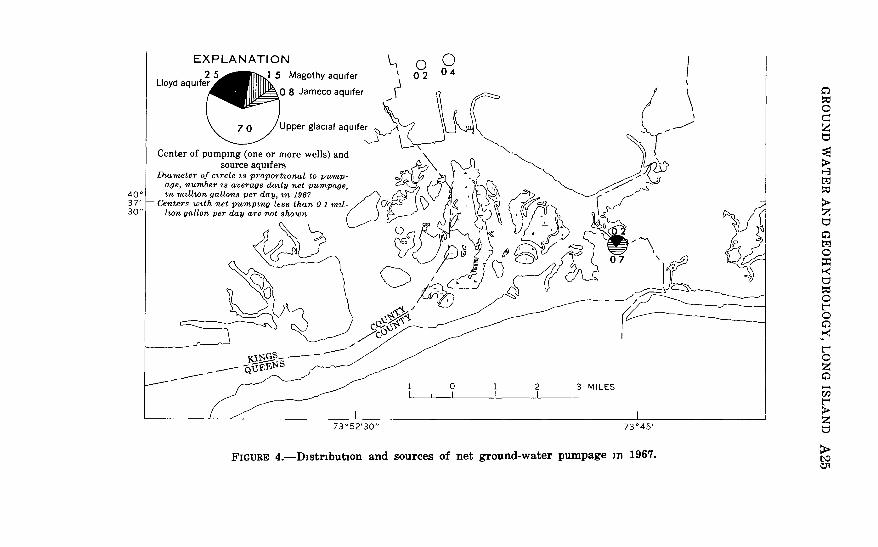
FIGURE 4.-Distribution and sources of net ground-water pumpage m 1967.
C') ~ 0 ~ z ~
$J > 1-3 t::rj ~
> z ~ C') t::rj 0 ::q ~ ~ ~ 0 t"' 0 C')
-~ t"' 0 z C') -00 t"' > z ~
> l:'l:)
Ol

A26 WATER IN THE URBAN ENVIRONMENT
supphed by the New York State Water Resources CommissiOn) In Queens County in 1961 and 1967 from the vanous aquifers was as follows:
Average net pumpage (mgd)
Aquifer Public-supply Industrial and wells other wells Total
1961 1967 1961 1967 1961 1967
Upper glacial 31 0 27 8 44 20 35 4 29 8 Jameco 3 5 38 9 8 44 4 6 Magothy 18 5 22 7 3 2 18 8 22 9 Lloyd 3 5 46 11 1 0 4 6 56
Total 56 5 58 9 67 40 63 2 62 9
In additiOn to the pumpage hsted In the preceding table, about 10-15 mgd was pumped for air-conditioning and coohng uses, mainly from the upper glacial aquifer. However, practically all this water was returned to the source aquifers through diffusiOn (recharge) wells, as required by regulations enforced by the New York State Water Resources Commission.
The distributiOn of the net ground-water pumpage In 1967 In Queens County Is shown In figure 4. Two pnvate water-supply companies pumped most of the ground water In the county In 1967. The Jamaica Water Supply Co. pumped about 49 mgd, and the New York Water Service, DivisiOn of Utilities and Industnes Corp., pumped about 10 mgd. Virtually all the remaining pumpage In 1967, about 4 mgd, was from wells owned by Individual Industnal and Institutional water users; pumpage from privatelyowned domestic wells was negligible. In 1967 the pnvate watersupply companies In Queens County operated 90 wells, and about 350 Industnal, commercial, and InstitutiOnal establishments used one or more wells each.
Most of the ground-water pumpage In Queens County, from the beginning of development to 1968, was taken from the upper glacial aquifer. In the 1930's and 1940's, the Jameco aquifer supplied as much as 13 mgd, and the Lloyd aquifer, as much as 10 mgd. However, pumpage from the Jameco and Lloyd aquifers decreased beginning about the end of World War II, because much of the water from the J ameco contained undesirable amounts of Iron, and because pumpage from the Lloyd was limited by New York State Water Resources Commission regulations. Since the end of World War II, and especially since 1953, the Magothy aquifer has been extensively developed from central to east-central Queens to replace water formerly withdrawn from the J ameco and Lloyd aquifers and to meet additional ground-water needs for the In-

GROUND WATER AND GEOHYDROLOGY, LONG ISLAND A27
creasing population In Queens. In 1961 Magothy pumpage was a little more than one half the pumpage from the upper glacial aquifer; In 1967 pumpage from the Magothy aquifer nearly equaled pumpage from the upper glacial aquifer.
QUALITY OF THE GROUND WATER
DISTRIBUTION OF DISSOLVED CONSTITUENTS
The chemical suitability for use of the ground water In Queens County differs from place to place and has changed with time. Representative chemical- analyses of ground-water from Queens County are listed In table 1. A few of the analyses in table 1 were made dunng the period 1939-55 and are shown because later analyses are not available. However, no significant ground-water development has occurred In the areas for which the older analyses are listed, and It Is not likely that any large changes In the chemical quality of the water have occurred In these areas since the analyses were made.
Most of the ground water in Queens County meets the standards for dnnking water established by the U. S. Public Health Service (1962, p. 7). Locally, however the quality of the ground water IS less than optimum and, In some places, the water Is not potable because of certain natural characteristics or because of pollutiOn related to the activities of man.
Excessive amounts of Iron In solution in the ground water is a maJOr source of difficulty In Queens County, as elsewhere on Long Island. According to the U.S. Public Health Service (1962, p. 43), more than about 0.3 mg/l (milligrams per hter) of Iron IS undesirable because It stains kitchen fixtures, utensils, and other obJects such as painted surfaces, and because It can Impart an obJectionable color and taste to the water. Commonly, excessive amounts of Iron (often as much as 5 or 6 mg/l) are dissolved in water from the Jameco, Magothy, and Lloyd aquifers; the highest concentratiOns commonly occur In water from the J ameco and Lloyd aquifers In Queens County. Most of the water from the Magothy and Lloyd aquifers is slightly acidic (pH of less than 7.0), and the aquifers contain abundant pynte (Iron sulfide). The acidic water and the natural occurrence of iron minerals In the aquifers probably are largely responsible for the high iron content of the water from the Magothy and Lloyd aquifers. The high Iron content of the water from the Jameco aquifer may be largely related to a high content of ferromagnesian (diabase) rock fragments In the aquifer and close hydraulic InterconnectiOn, locally, between the J ameco, Magothy, and Lloyd aquifers.

TABLE !-Selected chemwal analyses of ground water m Queens County, NY Geologrc umt Krl, Lloyd Sand Member of Rarrtan Formatron, Kmm, Magothy Formation-Matawan Group undrfferentrated, QJ, Jameco Gravel, Qo, out-
wash deposrts (see plate 1) Aqurfer L, Lloyd aqurfer, M, Magothy aqurfer, J Jameco aqurfer, U, upper glacral aqurfer. Date of collection Year alone mdrcates average analysts for that year Analyst a, New York State Department of Health, b, New York Crty Bureau of Water Supply, Department of Water Supply, Gas and Electricity, c, Ja
marca Water Supply Co, Jamaica, NY, d, Permutrt Co, Paramus, N J , e, US Geologrcal Survey, f, Lowell Senter, Little Neck, NY, g, O'Brien Industrres, Inc , Brooklyn, N Y , h, Dearborn Chemrcal Co , Chrcago, Ill
Well
Q31
Q34
Q276 Q278 Q283 Q301
Q304 Q307
Q311
Q313
Q314
Q317
Q321
Q355
Q564
Q566
Q567
Q569
Commumty
Glendale
Flushmg
Douglaston do
Flushmg Richmond Hrll
South Ozone Park .Hollts
Jamaica
Queens VIllage
Jamaica
Richmond Hrll
Queens VIllage
Woodhaven
Hollis
Richmond Hrll
Jamarca
do
Depth of well Geo- Aqm-below logrc fer land umt
surface (feet)
491
245
211 512 409 94
61 97
258
106
304
550
145
111
282
281
618
60
Krl L
Krl L
Kmm M Krl L Krl L Qo U
Qo U Qo U
QJ J
Qo U
QJ J
Krl L
Qo U
Qo U
Kmm M
QJ J
Krl L
Qo U
Date of collection
Apr 15,1948
June 9, '1948
1951 1939 1934
June 26, 1961 1966
June 26, 1961 1961 1967 1962 1967
June 12 1961 1967 1962 1967 1961 1967 1962 1966 1962 1967 1961 1967 1962 1967 1962 1967 1962 1967
Iron (Fe)
46
54
03 03
3 1 14 15 04 05 30 40 39 00 07 35 32
1 0 11
05 02 05 02 05 04 83 56
1 4 21
05 02
Specrfic Mrlhgrams per hter con- Tern-
duct- pera- Ana-Hard- Alka- ance pH ture lyst
Chlorrde Nr- Drs- ness hmty (mrcrom- ( °C) ( Cl) trate solved (as (as hos at
(NOs) sohdsCaCOa)CaCOa) 25°C)
52
70
7 7 18 46 18 9 4 1
23 -37 8 3 50 -13 35 26 50 48 4 59 1 4
26 -43 32 21 4 19 4 8 76 4 6 6 11 9 9 23
14 31 163 45 498 56
8 4 24 10 23 72 4 6 • 7 6 9 4 73 3
88 12 28 35
97
'>54
87 50 73
434
254 116 132
157 151 94
178 225 728
1,463 99
116 140 128 82 78
326 254
52
82
34 21 20
294 350 235 104 125
88 87
122 182 100 126
53 49
111 131 471 907
38 46
92 84
48 39
168 176
56
63
12 92 15 13
186 212 680 82 -29 260 49 415 94 200 86 220 34 62 486 92 200 82 230 48 145 52 145 34 260 39 330
172 796 160 1,879
16 125 19 180 83 175 68 200 36 112 34 116 55 450 58 440
70
69
64
57 69 73 66 64 65 75 78 59 66 79 77 68 70 64 66 77 75 63 67 75 73 70 68 65 66
13
11 12 13 12
13 14 12 12 13 14 13 13 13 11 12 13 13 14 12 14 12
a
a
b b b c b c b b b b c b b b b b b b b b b b b b b b b b
Other constituents (mg/1) and remarks
Manganese ( Mn) , 0 10, sulfate (SO,), 4 2
Manganese (Mn), 0 05, sulfate (SO,), 10
Manganese (Mn), 0 27
Manganese (Mn), 0 00
Manganese ( Mn) , 0 00
> 1:1:) 00
~ > ~ t%j ~ ~ z ~ ti:: t%j
c:::: ~ l:d > z t%j
z < ~
~ 0 z s= t%j
z ~

Q582 Bellerose 686 Krl L Jan 6, 1953 85 60 24 104 16 86 - 67 - d S1hca (SIOll), 14, cal-r1um (Ca), 2 4, mag-nes1wn (Mg), 2 3, sulfate (SO•), 7, sod1wn (Na), 20,
C1 potassmm ( K) , 4 7 Q1030 Rockaway Park 795 Krl L Aug 3,1962 3 1 25 0 84 20 34 154 66 16 e Sihca (S102), 53, cal- ~
cium (Ca), 4 8, mag- 0 nesmm (Mg), 2 0, c:: sulfate ( SO•), 0 8, z fluoride (F), 0 2, manganese ( Mn) , t1 0 33 ~ Q1086 Elmhurst 278 Krl L Feb 28, 1952 68 50 154 42 68 - 7 1 - b Manganese (Mn), 0 08, sulfate (SO,), 7 3 >
Q1230 Arverne 161 QJ J July 20, 1942 48 12,600 0 - 530 156 - - - b ~ Q1374 College Pomt 214 Krl L May 18, 1955 53 1,718 - - - 26 - 53 - f Sulfate (SO•), 260 M Q1378 Woodhaven 189 Qo--QJ u 1962 06 413 39 1,310 698 196 1,420 77 14 b Chlonde ( Cl), 452, ~
Jan 19, 1962 1967 04 558 80 1,733 673 205 2,195 77 14 b >
Q1506 John F Kennedy 108 Qo u June 26, 1962 02 5,100 - - 2,341 252 - 72 - g Composite sample from z International two closely spaced t1 Airport wells of same depth
Q1747 Hollis 257 Qo u 1962 05 84 7 5 158 104 78 200 7 5 12 b C1 Qo u 1967 03 12 14 184 114 76 315 72 11 b M
Q1811 Richmond Hill 115 Qo u 1961 05 42 21 433 288 160 600 68 12 b 0 1967 06 48 20 454 260 180 583 7 1 13 b :::0
Q1839 Jamaica 85 Qo M June 19, 1961 62 29 - - 166 70 - 63 - c Manganese (Mn), 0 08 ~ Q1914 Bellerose 258 Kmm Dec 31, 1952 29 6 1 15 165 57 30 - 70 - h Sihca (S102), 22,cal-
CIUm (Ca), 13 6, t1 magnesium (Mg), ~ 56, sulfate (SO,), 0 38 ~
Q2026 Laurelton 431 Kmm M 1961 10 48 4 - 11 6 50 53 9 b 0 Kmm M 1964 14 48 6 40 13 7 40 60 12 b G1
Q2028 Jamaica 285 Kmm M 1962 05 84 58 88 32 9 100 6 1 13 b Manganese ( Mn) , 0 00 ~~ 1964 04 9 1 4 6 87 36 10 87 6 1 13 b
Q2137 do 250 Kmm M 1961 40 11 24 249 160 78 350 70 11 b ~ Dec 18, 1967 65 15 - 160 96 - 68 - c Manganese (Mn), 0 17 0
Q2332 Richmond Hill 242 OJ-KmmJ-MJune 5, 1961 12 16 - - 128 95 - 69 - c Manganese (Mn), 0 00 z 1964 24 15 4 186 130 98 277 73 13 b
Q2333 Long Island City 38 Qo u May 10, 1962 05 133 - - 280 128 650 79 - d SiliCa ( SI02), 25, C1 sodium (Na), 188, H calcmm (Ca), 180, r.n magnesium (Mg), ~ 100, sulfate (SO,), > 75 z
Q2343 Queens VIllage 225 Kmm M 1961 10 80 24 - 30 10 90 60 12 b t1 Q2362 Flushmg 287 Kmm M 1962 05 4 8 13 100 50 52 140 68 12 b Manganese (Mn), 0 00
Jan 22, 1968 00 20 - - 170 95 - 67 - c Q2373 do 558 Kmm M 1962 05 10 58 - 168 88 400 64 13 b Manganese (Mn), 0 00 >
Jan 29, 1968 00 27 - - 237 148 - 72 - c Manganese (Mn), 0 00 l.\:) (.0

A30 WATER IN THE URBAN ENVIRONMENT
The highest Iron content listed In table 1 (53 mg/1) IS from a well tapping the Lloyd aquifer In College Point. The water also has a high chlonde content (about 1,700 mg/1), and the high Iron content probably IS related to complex and not fully understood geochemical processes associated with the "zone of diffusiOn." (See the sectiOn "Salt-water Intruswn.")
Excessive amounts of chlonde (more than about 250 mg/1) Impart a salty taste to water and render the water undesirable for dnnking and cooking purposes. Under natural conditiOns most of the ground water In the upper glacial aquifer of Long Island contains less than 40 mg/1 chloride, and chloride content usually diminishes in the deeper aquifers to less than 10 mg/1 In the Lloyd aquifer. Locally near the shorelines, however, ground water contains thousands of milligrams per liter of chlonde and, therefore, IS unfit for domestic and most other uses The depressiOn of the water table associated with extensive pumping has caused salty ground water to move landward In Queens County, notably In the Ozone Park-Woodhaven areas. (See the section "Salt-water IntrusiOn.")
Hardness, which results mainly from calcium and magnesium wns In the water, also may significantly affect the suitability of the water for use. Under preurban natural conditions, nearly all the ground water In Queens County, except salty ground water near the shorelines, IS believed to have been soft (containing less than 60 mg/1 of hardness). However, for many years prior to 1968, hardness of the ground water In the upper glacial aquifer In much of central and eastern Queens County has been above 60 mg/1, and this factor IS attnbuted to a combinatiOn of lateral salt-water IntrusiOn and downward movement by pollutants from the surface. The hardness shown In the analyses of water from wells Q301 and Q304, (table 1), for example, is representative of the effects of pollutiOn In varwus parts of the county.
Most of the pollutants In the upper glacial aquifer are derived from leaking sewers (storm waters and wastes are carried In common sewers In Queens County), salt used to de-Ice streets and highways, fertilizers, and the large cemeteries In the county. In additiOn to hardness and chloride content, nitrate concentrations are often Indexes of pollutiOn. NItrate Is especially significant because concentrations In excess of 45 mg/1 reportedly can be harmful to the health of infants (U.S. Public Health Service, 1962, p. 50). Of the 37 samples listed In table 1, only two (for wells Q355 and Q2373) had 45 mg/1 or more of nitrate. However, many samples had more than 5 mg/1 nitrate, which very likely IS considerably more than the natural nitrate content of the ground

GROUND WATER AND GEOHYDROLOGY, LONG ISLAND A31
water. Accordingly, the nitrate data are IndiCative of the widespread extent of pollution In the upper glacial aquifer
PollutiOn resulting from the downward percolation of contaminated water Is less common In the deeper aquifers, but the fairly high nitrate content of water from wells Q276, Q564, Q1914, and Q2137 (table 1) suggests that pollutants also have percolated downward to the Magothy aquifer, at least locally. Gradual increasing pollution of the Magothy aquifer can be expected as development of the aquifer continues.
SALT-WATER INTRUSION
Near the shorelines of Queens County, the fresh ground water grades Into salty ground water which, In turn, Is hydraulically connected to the bordenng bodies of salty surface water The contact between the fresh and salty ground water IS gradational, and the zone of mixed ground water commonly is referred to as the "zone of diffusiOn." The position and the thickness of the zone of diffusion in any area at any given time depend upon many complexly interrelated factors Including, but not limited to, the hydraulic heads In the fresh and salty ground water, the amount of fresh subsurface outflow, the rate and distribution of pumpage, and the physical characteristics of the aquifers and confining beds.
Salt-water IntrusiOn occurs when the zone of diffusiOn moves landward, and fresh ground water IS displaced by salty ground water. Under natural conditiOns, the zones of diffusiOn bordenng Queens County moved back and forth In response to such natural features as ocean tides, atmospheric pressure, and long-term changes In the altitude of sea level. However, the salt-water Intrusion that Is of pnncipal concern In this report is that related to the landward movement of the zone of diffusiOn associated with the activities of man-notably, decreased ground-water recharge and Increased ground-water discharge.
The precise landward extent of the zones of diffusiOn In Queens County IS difficult to determine because of several factors: (1) changes In chloride content In the zones of diffusion are gradatiOnal; (2) under natural conditiOns the chlonde content of the fresh ground water doubtless vaned somewhat from place to place In the same aquifer and from time to time; and (3) In addition to Increases related to salt-water intrusiOn, the chloride content of the ground water In Queens County locally has Increased because of the downward movement of salty pollutants from the land surface. A further complicating factor IS that, locally, a tongue of salty ground water that IS laterally Invading one aquifer also may be spreading vertically from one aquifer to another at pOints

A32 WATER IN THE URBAN ENVIRONMENT
distant from the shorehne PreviOus workers on Long Island (Lusczynski and Swarzenski, 1966, p. 19-20) selected the 40-mg/1 chlonde hne (a hne Joining pmnts of equal chlonde content) as an Index of the landward hm1t of the zone of diffusiOn on Long Island; this hne IS shown on plates 1 and 2.
Ground water In the upper glacial aquifer beneath about half of Queens County had a chlonde content of more than 40 mg/1 In 1961 and 1968 (pl. 2A and B). Although supporting data are sparse, the 40-mg/1 chlonde hne In the upper glacial aquifer probably was very near the shorelines of the county pnor to the development of ground water by man. Accordingly, the landward extent of the 40-mg/1 chlonde hne shown on plate 2A and B is Interpreted to have been largely a result of salt-water intrusiOn Into the upper glacial aquifer related to the activities of man.
Widespread salt-water IntrusiOn In the upper glacial aquifer occurred In northwestern Queens County, where the aquifer IS thin and Is generally of low permeability. In that area comparatively small amounts of pumpage have caused a large decrease of fresh ground water In storage and areally extensive salt-water IntrusiOn.
Ground-water withdrawals concentrated In the WoodhavenRichmond Hill area are responsible for a distinct sahent of salty ground water In that area (pl. 2A and B). Evidence of continuing Increase of chlonde content of ground water In the upper glacial aquifer In the Woodhaven area IS provided by data from wells Q355 and Q1378 (pl. 1) . The chloride content of water from these wells In 1953 was 31 and 37 mg/1, respectively, and In 1959 chlonde contents had Increased to 65 and 199 mg/1, respectively. In 1962 the average chloride contents of water from wells Q355 and Q1378 were 163 and 413 mg/1, respectively, and In 1967 they were 498 and 558 mg/1, respectively (table 1).
Significant IntrusiOn of salty ground water In the upper glacial aquifer also has occurred In the Flushing Meadow area, In the northern part of Queens County (pl. 2A and B). The chloride content of water from well Q1730, 260 feet deep, (pl. 1) In that area (not hsted In table 1) was 47 mg/1 In 1950. By 1962 the chlonde content had Increased to 128 mg/1, and In 1965 It had Increased to 292 mg/l. The marked Increase In chlonde content at well Q1730 from 1962 to 1965 Is mostly related to large groundwater withdrawals In that area In 1964-65 for use by the New York World Fair, about 2 miles south of the well, and to new pubhc-supply wells which came Into use In 1963 In the southern part of Flushing, about 3 miles southeast of the well
The position of the 40-mg/1 chlonde hne In the J ameco, Magothy, and Lloyd aquifers under natural conditions IS not well

GROUND WATER AND GEOHYDROLOGY, LONG ISLAND A33
known However, the available evidence suggests that salty wate1 has probably Intruded the J ameco and Magothy aquifers In the Woodhaven area (pl. 2C and D) and the Lloyd aqmfer In the Flushing Meadow area (pl 2E and F)
Wedges of landward-moving salty ground water In the upper glacial, J ameco, and Magothy aquifers, extending northward from the Jamaica Bay area, are shown on plate 1, sectwns A-A' In the Flushing Meadow area, where the upper glacial aquifer hes directly on the Lloyd aquifer (not shown In sections), salty ground water In the Lloyd aquifer (pl. 2E and F) is continuous with the salty ground water In the overlying upper glacial aquifer (pl. 2A and B) The chlonde contents noted at well Q1730 IndiCate that a salty ground-water wedge IS moving south from the Flushing Bay area through the Flushing Meadow area. The salty ground-water wedges moving Into the county from Flushing and Jamaica Bays have nearly bisected the county and will probably meet In a few years If the present rate and distnbutwn of groundwater withdrawals continues
The salty ground-water sahent that moved Into the county from the south In 1961 spread eastward about 1 mile by 1968. The movement was In the upper glacial aquifer from Ozone Park toward J amacia (pi 1, sections A-A'; pi 2A and B). A narrow and thin tongue of salty ground water moved Into the Richmond Hill area between 1961 and 1968 and IS Indicated on plate 1, section B-B', by chlonde contents of more than 40 mgjl at wells Q301 and Q2006. The Richmond Hill tongue 1s not shown on plate 1 because of the complexity of data there; however, It encloses wells Q301 and Q2006 and IS wholly within the upper glacial aquifer Salty ground-water movement Into the J ameco and Magothy aquifers between 1961 and 1968 occurred In a small part of Flushing (pl. 2C and D) . This movement IS attnbuted to pumping by new supply wells from 1963. (See the section "Water-table and piezometric surfaces ") No significant change In salty ground-water movement Into the J ameco and Magothy aquifers was observed In southern Queens County from 1961 to 1968 (pl. 2C and D), and the apparent stability there IS due to a minor amount of pumping from the aquifers In this area (pl 1).
Throughout large parts of Queens County, the chloride content of water In the Magothy aquifer IS more than 20 mg/1 but less than 40 mg/l. Similarly, In many areas the chlonde content of the water In the Lloyd aquifer IS more than 5-10 mg/1 but less than 40 mg/1 (For example, see values at some wells on pl. 1). In the more eastern parts of Long Island, distant from shorelines, chloride contents are generally less than 20 mg/1 In the Magothy

A34 WATER IN THE URBAN ENVIRONMENT
aquifer and less than 10, usually less than 5, mg/1 In the Lloyd aquifer. Thus, the above-normal chloride contents In much of the Magothy and Lloyd aquifers of Queens County may have been caused by lateral salt-water IntrusiOn, by downward leakage of salty water from the overlying aquifers, or by a combination of these factors; however, the evidence Is not conclusive, and careful future monitoring of chloride content Is warranted.
TEMPERATURE
Ground-water temperatures in Queens County are of concern to many well owners who use ground water for refrigeratiOn, coohng, and air-conditioning systems. In 1967 several hundred wells In the county were used for these purposes, and many of them had been so used for several decades. In 1936 the New York State Water Resources Commission was empowered to require, as a conservation measure, that water from wells on Long Island pumping 70 gpm or more for coohng purposes be returned to the source aquifer through recharge wells, or other approved structures. In 1954 the requirement for recharge was expanded to apply to wells that pumped 45 gpm or more for nonconsumptive uses.
The use of ground water as a sink for heat, by returning water heated In the processes of coohng, can result In "thermal pollution" which can Impair or nulhfy the usefulness of the ground water for coohng. On Long Island, the maximum practical temperature of ground water used by itself for air-conditiOning IS about 16°C (61 °F). If the temperature of the ground water IS more than about 16°C, the air-conditioning systems become more expensive to operate and auxiliary mechanical coohng commonly Is used.
Ground-water-temperature data listed 1n table 1 are summarized In the following table:
Depth of water= bearmg zone (feet below land surface)
60-257 . 189-304 158-431 550-795 .
Aquifer
Upper glacial Jameco Magothy Lloyd
Range m water temperature
11-14 12-14 9-13
12-16
52-57 54-57 48-55 54-61
The data are typical of ground-water temperatures in those parts of the county where thermal pollution has not been noted. In such areas there IS httle practical temperature difference, for coohng uses, In water from the upper glacial, Magothy, and

GROUND WATER AND GEOHYDROLOGY, LONG ISLAND A35
J ameco aquifers; the temperature of water from the Lloyd aquifer generally IS only slightly higher than that from the other aquifers. The highest natural ground-water temperature known In Queens, l9°C (67°F, not shown In table 1), was measured In 1962 at well Q1929, which IS 1,020 feet deep, In the Far Rockaway area (pl. 1)
The temperatures of ground water to a depth of about 600 feet generally are low enough In most of the county so that the water can be used sabsfactonly In most air-conditioning and cooling systems; progressively nsing temperature below this depth (about 0.75°C for each 100ft) decreases the efficiency of ground water for cooling
Warm to hot ground water (having a temperature as high as 32°C (90°F) in Jamaica) locally occurs In zones Into which hot exhaust water from cooling systems is Injected through recharge wells. Many large business establishments In JamaiCa use ground water for mr conditioning, and the efficiency of some of the cooling systems has been Impaired by thermal pollution of the ground water In that area.
OUTLOOK FOR THE FUTURE
ENGINEERING CONSIDERATIONS
The deep and widespread decline In ground-water levels has caused problems other than the deterioration of water quality in Queens County. Power costs for pumping have increased because of the greater depth to water, pump settings have had to be lowered, and wells have had to be deepened or abandoned and replaced Moreover, close spacing of wells locally has decreased production efficiency because of the mutual Interference (overlapping of cones of depresswn) of nearby wells.
Locally, the recharge through wells of heated water from airconditiOning InstallatiOns has resulted In thermal pollutwn of the ground water, and thereby, has reduced the cooling efficiency of some installations and caused abandonment of others. Although the warm water In the ground-water reservoir may decrease the cooling efficiency of some installations, It may be useful as a source of heat Reverse-cycle heating and coohng systems, similar to those used In the Pacific Northwest (Brown, 1963, p. 19), may become feasible. Such systems might reduce or halt thermal pollution of the ground water by withdrawing, dunng the cool seasons, the heat added to the water dunng the warm seasons.
The designs of some buildings and other structures In areas where the water table has declined may have been, or may be, based on the suppositiOn that the lowered water table will persist,

A36 WATER IN THE URBAN ENVIRONMENT
and some builders may not be aware that the water table has been ' lowered artificially. Should ground-water withdrawals decrease
substantially or cease entirely, the water table locally Will recover markedly and cause seepage Into some basements and other subsurface structures. Such seepage occurred In parts of Kings County and caused serwus flooding following cessation of pubhc-supply pumping In that county In 1947 (Perlmutter and Soren, 1963, p. 138) . Former swampy areas may also tend to become swampy again, and springs may even reappear at low spots If the water table rises sufficiently.
As of 1968 no significant subsidence of the land surface IS known to have occurred In Queens County as a result of drawdown of the water table, perhaps because thick clay beds, which are the beds most hkely to undergo compaction, have not yet been significantly dewatered. Compaction and associated land subsidence Is unlikely In most of western Queens. The areally extensive and thick clay beds Include the Gardiners Clay and those In the underlying Cretaceous deposits. The top of the Gardiners Clay Is generally more than 40 feet below sea level, and before the water table IS drawn down below the Gardiners, the aquifers will have been excessively contaminated by salt water In most of the county and presumably pumping will have been curtailed. Some clay beds In the Magothy aquifer might be dewatered by continued pumping In eastern Queens, near Nassau County, and land subsidence to some degree may possibly occur there In the future. Other places where subsidence may occur In the county are in the Flushing Meadow and Alley Creek areas (pl. 1). These areas are only a few feet to about 10 feet above sea level and are generally underlain by thick beds of clay only a few feet below land surface.
WATER-MANAGEMENT IMPLICATIONS
The long-term net pumpage of ground water In Queens County, which averaged about 60 mgd In the past several decades, has caused extensive cones of depressiOn In the water table and In the piezometric surfaces of the confined aquifers. The cones of depression had extended Into adJacent counties and were still growing in 1968. The declining ground-water levels are being accompanied by widespread salt-water IntrusiOn Into the aquifers and a concurrent decrease of fresh ground water In storage.
Suter (1937, p 32 and 34) estimated that the "safe development" of ground water In Queens County IS 30 mgd, and suggested that this rate, . . could be Increased after the Brooklyn depression IS removed .... The cone of depressiOn caused by overdevelopment In Biooklyn (Kings County) has been largely dissipated, although

GROUND WATER AND GEOHYDROLOGY, LONG ISLAND A37
mainly by salty-water Inflow which followed the cessation of pubhc-supply pumping In 1947 (Perlmutter and Soren, 1963, p. E138).
Terms such as "safe development" or "safe yield" commonly are defined In terms of hydrologic, economic, or other effects that water managers wish to avmd; consequently, a quantitative value for the "safe yield" of Queens County can range between wide hmits, depending on the water-management decisiOns that are made and the changes In the hydrologic system that are deemed desirable or tolerable. For example, water-management decisiOns might be made to attempt to: (1) restnct the effects of groundwater withdrawals entirely to Queens County and thereby avmd Inducing additional subsurface Inflow from adJacent counties; and (2) prevent a further Increase In the chloride content of the ground water. If such decisiOns were made, net pumpage (and, therefore, the "safe yield"), at the stage of urban development in Queens County In 1968, would have to be considerably less than 60 mgd. Moreover, the pumpage would have to be from a carefully spaced and managed network of wells. Conversely, if hmits were not set on the magnitude of the cones of depressiOn and on the positions of the zones of diffusiOn, and If the average chlonde content of the pumped water were allowed to increase to 250 mgjl, the "safe yield" would be considerably more than 60 mgd for an Indeterminate per10d of time. Under the converse set of conditions, It can be readily appreciated that the large storage of fresh water in the ground-water reservoir of Queens County has significant potential importance as a source of emergency water supply for New York City.
The state of Imbalance that currently exists in the hydrologic system of Queens County Will continue unless net pumpage IS reduced, or recharge IS artificially augmented, so that the total (natural plus artificial) recharge of fresh water equals the total discharge of fresh water. Until this balance between recharge and discharge Is restored, ground-water levels Will continue to decline, and salt-water intrusion will become more widespread. Salt-water IntrusiOn occurred In neighbonng Kings County to such a degree that pubhc-supply pumping there was halted by New York City In 1947 (Lusczynski, 1952, p. 1). Salt-water IntrusiOn In Queens County In 1968 was not nearly as severe as that In Kings County In 1947. However, If changes are not made in the present use and disposal of water In Queens County, the continued deterioration of ground-water quality may ultimately force the abandonment of most, if not all, pubhc-supply wells in the county.

A38 WATER IN THE URBAN ENVIRONMENT
REFERENCES CITED
Brown, S G, 1963, Problems of utihzmg ground water m the west side busmess district of Portland, Oregon· US Geol Survey Water-Supply Paper 1619-0, 42 p
City of New York, Department of Water Supply, Gas, and Electricity, 1958-64, Annual reports of the Bureau of Water Supply
Cohen, Phihp, Franke, 0 L, and McClymonds, N E ,' 1969, Hydrologic' effects of the 1962-66 drought on Long Island, New York: U. S Geol Survey Water-Supply Paper 1879-F, 18 p
Cohen, Philip, Franke, 0 L , and Foxworthy, B. L , 1968, An atlas of Long Island's water resources New York Water Resources Comm Bull 62, 117p
Fuller, M L, 1914, The geology of Long Island, New York US Geol Survey Prof Paper 82, 223 p
Jacob, C E, 1941, Notes of the elasticity of the Lloyd sand on Long Island, New York Am Geophys Umon Trans, pt 3, p 783-787
Lusczynski, N J, 1952, The recovery of ground-water levels m Brooklyn, New York, from 1947 to 1950· US Geol Survey Circ 167, 29 p, 2 pl
Lusczynski, N J , and Spiegel, S J , 1954, Average daily withdrawals for pubhc supply from Kmgs, Queens, and Nassau Counties m Long Island, N Y, from 1904 through 1953 US Geol Survey open-file rept, 1 table, 2 figs
Lusczynski, N J , and Swarzensk1, W V , 1966, Salt-water encroachment m southern Nassau and southeastern Queens Counties, Long Island, New York US Geol Survey Water-Supply Paper 1613-F, 76 p, 5 pl.
Meyer, R R, 1963, A chart relatmg well diameter, specific capacity, and coefficients of transmiSSibility and storage, m Bentall, Ray, compiler, Methods of determmmg permeability, transmiSSibility and drawdown US Geol Survey Water-Supply Paper 1536-I, p 338-341
Perlmutter, N M, Geraghty, J J, and Upson, J E , 1959, the Relationship between fresh and salty ground water m southern Nassau and southeastern Queens Counties, Long Island, New York· Econ Geology, v 54, no 3, p 416-435
Perlmutter, N M , and Geraghty, J J , 1963, Geology and ground-water conditions m southern Nassau and Southeastern Queens Counties, Long Island, NY · U.S Geol. Survey Water-Supply, Paper 1613-A, 205 p, 7 pis
Perlmutter, N M, and Soren, Juhan, 1963, Effects of maJor water-table changes m Kmgs and Queens Counties, New York C1ty US. Geol Survey Prof Paper 420-E, p E136-E139
Perlmutter, N M , and Todd, Ruth, 1965, CorrelatiOn and Forammifera of the Monmouth Group (Upper Cretaceous), Long Island, New York· US Geol Survey Prof. Paper 483-I, 24 p , 8 pls.
Suter, Russell, 1937, Eng~neermg report on the water supplies of Long Island New York State Water Power and Control Comm Bull GW-2, 64 p
Suter, Russell, deLaguna, Wallace, and Perlmutter, N M, 1949, Mappmg of geologic formations and aqmfers of Long Island, New York. New York State Water Power and Control Comm Bull GW-18, 181 p
U S Pubhc Health Service, 1962, Drmkmg water standards, 1962 Pubhc Health Service Pub 956, 61 p

GROUND WATER AND GEOHYDROLOGY, LONG ISLAND A39
Veatch, A. C, Shchter, C S, Bowman, Isaiah, Crosby, W 0, and Horton, R E, 1906, Underg10und water Iesources of Long Island, New York· U S Geol Sm vey Prof Paper 44, 385 p
Wenzel, L K, and F1shel, V C, 1942, Methods for dete1m1mng permeab1hty of water-bearmg matenals, wtth a sectwn on direct laboratory methods and bibliography on permeability and lammar flow· U S Geol Survey Water-Supply Paper 887, 192 p
f:l U S GOVERNMENT PRINTING OFFICE 1971 0-403-468
