geologic and geohydrologic … and geohydrologic reconnaissance of staten ... geohydrologic...
TRANSCRIPT
GEOLOGIC AND GEOHYDROLOGIC RECONNAISSANCE
OF STATEN ISLAND, NEW YORK
by Julian Soren
U.S. GEOLOGICAL SURVEY
Water-Resources Investigations Report 87-4048
Prepared in cooperation with the
NEW YORK STATE DEPARTMENT OF ENVIRONMENTAL CONSERVATION
Syosset, New York
1988
UNITED STATES DEPARTMENT OF THE INTERIOR
DONALD PAUL HODEL, Secretary
GEOLOGICAL SURVEY
Dallas L. Peck, Director
For additional information write to:
U.S. Geological Survey 5 Aerial Way Syosset, NY 11791
Copies of this report may be purchased from:
U.S. Geological SurveyBooks and Open-File Reports SectionFederal Center, Bldg.4lBox 25425Denver, CO 80225
ii

CONTENTS
Page
Abstract. ............................... 1Introduction. ............................. 1
Purpose and scope. ........................ 2Previous investigations. ..................... 2Acknowledgments. ......................... 2Physical setting ......................... 3
Topography and drainage ................... 4Population and culture. ................... 4
Geology ................................ 5Bedrock. ............................. 5
Manhattan Schist. ...................... 5Staten Island Serpentine. .................. 6Newark Supergroup, undivided. ................ 6Palisade Diabase. ...................... 8
Unconsolidated deposits. ..................... 8Raritan Formation ...................... 8Upper Pleistocene deposits. ................. 9
Outwash. ........................ 9Terminal-moraine deposits. ............... 9Ground moraine ..................... 10
Holocene deposits ...................... 11Shore and marsh deposits ................ 11Artificial fill. .................... 11
Geohydrology. ............................. 11Surface water. .......................... 11
Streams ........................... 11Ponds ............................ 12
Ground water ........................... 13Occurrence. ......................... 13
Unconsolidated deposits. ................ 13Outwash ...................... 13Terminal and ground moraines. ........... 13Raritan Formation ................. 14
Bedrock. ........................ 15Newark Supergroup, undivided. ........... 15Palisade Diabase. ................. 15Manhattan Schist. ................. 16Staten Island Serpentine. ............. 16
Water levels. ........................ 16Recharge. .......................... 17Movement. .......................... 19Chemical quality. ...................... 19
Hardness and chloride. ................. 19Iron .......................... 20
Water use .......................... 20Summary and conclusions ........................ 20References cited. ........................... 21
iii
ILLUSTRATIONS
Page
Figure 1. Map showing location of Staten Island (Richmond County). . . 3
2. Geologic sections A-Af and B-B f on Staten Island ...... 7
3. Map showing major surficial deposits on Staten Island. ... 10
4. Generalized hydrogeologic section showing heads anddirections of ground-water movement on Staten Island .... 18
PLATES
(in pocket)
Plate 1. Geography of Staten Island and locations of selected wells and boreholes.
2. Bedrock geology of Staten Island and configuration of the bedrock surface.
3. Configuration of the surface of the Raritan Formation on Staten Island.
4. Composite water-table map of Staten Island, 1931-86.
TABLE
Table 1. Discharge of selected Staten Island streams, 1962-68. .... 12
iv
CONVERSION FACTORS AND ABBREVIATIONS
Multiply inch-pound unit by To obtain metric unit
Length
inch (in.)foot (ft)mile (mi)
25.40.30481.609
millimeter (mm) meter (m) kilometer (km)
square mile (mi2 )
Area
2.59 square kilometer (km2 )
gallon per minute per foot [(gal/min)/ft]
Specific capacity
0.207Liter per second per meter
foot per day (ft/d)
Hydraulic conductivity
0.3048 meter per day (m/d)
Flow
cubic foot per second(ft*/s) 0.02832
gallon per minute (gal/min) 0.06308 inch per day (in/d) 25.40 million gallons per day (Mgal/d) 0.04381
cubic meter per second(ma/s)
liter per second (L/s) millimeter per day (mm/d) cubic meters per second
Miscellaneous Abbreviations
diam - diameterE - eastI.D. - inside diameter/ig/L - micrograms per litermg/L - milligrams per literN - northW - west
Sea level; In this report "sea level" refers to the National Geodetic Vertical Datum of 1929 (NGVD of 1929) a geodetic datum derived from a general adjustment of the first-order level nets of both the United States and Canada, formerly called "sea level datum of 1929."
GEOLOGIC AND GEOHYDROLOGIC RECONNAISSANCE OF STATEN ISLAND, NEW YORK
by Julian Soren
ABSTRACT
Staten Island (Richmond County) is a mainly suburban borough of the City of New York in which considerable interest in ground water has grown as a result of protracted droughts that seriously reduced the City's water supply from its upstate surface-reservoir system in the 1960's and 1980's. Hundreds of residents and business installed wells, mainly for lawn and plant-nursery irrigation, filling swim ming pools, and vehicle washing, because the City prohibited use of the public-water supply for such purposes during the droughts.
Fresh ground water is available from Upper Proterozoic to Lower Jurassic bedrock and from overlying unconsolidated sandy Upper Cretaceous and upper Pleistocene deposits. The principal source of fresh ground-water recharge is precipitation that infiltrates the land surface and percolates to the water table. Fresh ground water moves downward and laterally through the unconsolidated deposits and bedrock toward discharge points streams and tidewater that surround the island and saline ground-water that underlies it at depth.
Four maps of Staten Island's geology and water-table levels provide information on ground-water availability and serve as a basis for future ground-water investigations.
Streamflow on Staten Island has not been noticeably reduced by current ground-water development, which indicates that the ground-water reservoir has not been significantly depleted and that considerably more ground water is available for use.
INTRODUCTION
Richmond County, commonly known as Staten Island, a borough of the City of New York, has had less hydrogeologic study than the City's other four boroughs because it is the least populated and most recently developed.
Public water supply for Staten Island has been provided entirely by New York City's surface-reservoir system in upstate New York since 1971. During 1917-70, from 96 to 67 percent of the water was from upstate reservoirs; the rest was supplied by several municipally owned wells on the island. The amount pumped locally depended on the adequacy of the upstate reservoirs' reserves during drought periods. Before 1917, water from individual wells, from municipal wells, and from privately owned water-company wells, in addition to small, local surface reservoirs, supplied the water needs of Staten Island's population, which was significantly less than the 116,500 stated in the U.S. Census of 1920.
A general drought affected the northeastern United States from 1962-66, during which time the City of New York imposed severe restrictions on the use of municipal water. A local drought affected the upstate-reservoir areas in 1983-84, and again the City sharply curtailed the use of municipal water. During these droughts, the U.S. Geological Survey received thousands of requests for ground-water and geologic data from residents of Staten Island and the City's boroughs of Kings and Queens Counties on nearby Long Island. These people wished to install wells (mostly small-diameter, from 1.25- to 2-in. inside-diameter driven-point wells in sand and some of diameters to 6 in. in rock) to provide water for uses that had been prohibited, such as for lawn irrigation, filling swimming pools, and automobile washing. Ample hydrogeologic data on Kings and Queens Counties were available, but the Staten Island data were meager and could provide for only rough approximations of water-table altitudes in a few localities. Consequently, the Geological Survey began a reconnaissance study of the geology and geohydrology of Staten Island in late 1985, in cooperation with New York State's Department of Environmental Conservation, to obtain additional data and to provide a basis for future studies.
This study entailed mapping the water table and the upper surfaces of the geologic formations beneath Staten Island. Available published well records and geologic data were examined, and additional data were obtained from field observations to interpret and map these surfaces.
Purpose and Scope
This reconnaissance report describes the geology and the hydrologic characteristics of the water-bearing units underlying Staten Island and the chemical quality of ground water. It includes maps and geologic sections that show well locations, bedrock geology, the surface configuration of the Raritan Formation, and ground-water levels.
Previous Investigations
The most significant published reports dealing with Staten Island's geology and hydrogeology are those of Merrill and others (1902) and Perlmutter and Arnow (1953), respectively. The latter report's section on Staten Island is part of a reconnaissance study of ground water in all of New York City's boroughs and consists mainly of a well inventory and logs of wells and bore holes. Several student dissertations and theses describe the rocks and minerals and some unconsolidated deposits on Staten Island; however, these are not readily available and, because they do not describe the island's geology in detail nor contain significant hydrogeologic information, they are not cited in this report.
Acknow Iedgments
Robert M. Germeroth, geologist, and Arnold Aronowitz, engineer, both of the Port Authority of New York and New Jersey, and James Moran of the Somerville Well Drilling Co., Somerville, N.J., provided geologic and hydrologic data that greatly assisted the author's map preparations.
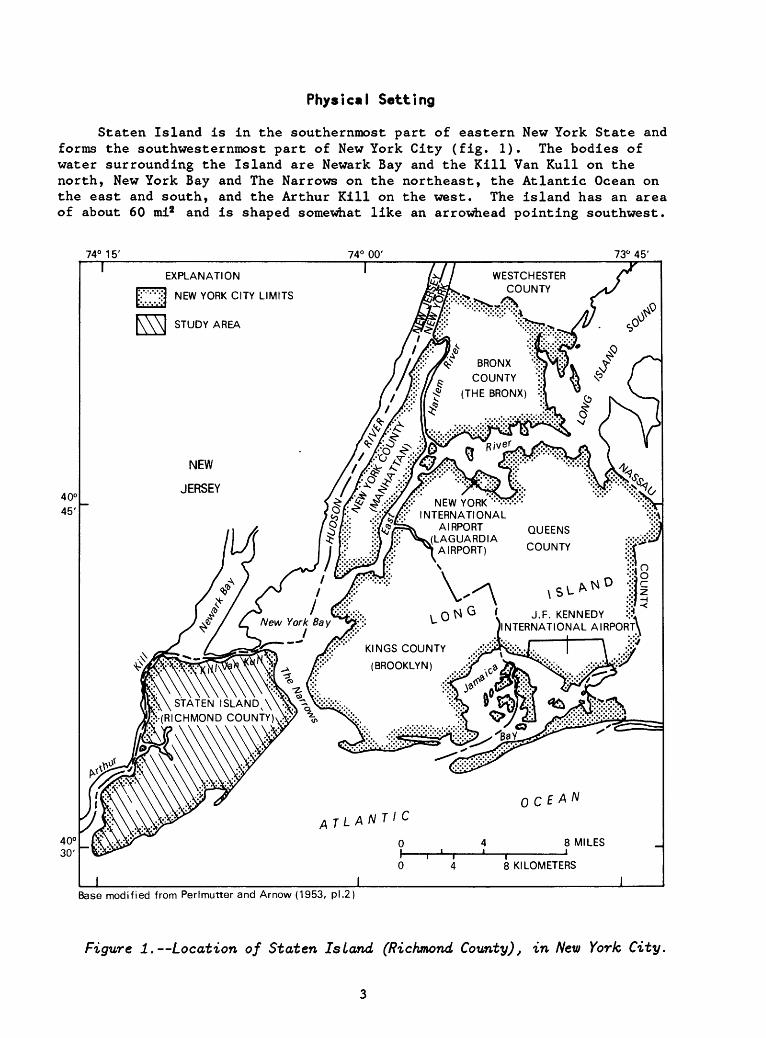
Physical Setting
Staten Island Is In the southernmost part of eastern New York State and forms the southwesternmost part of New York City (fig. 1). The bodies of water surrounding the Island are Newark Bay and the Kill Van Kull on the north, New York Bay and The Narrows on the northeast, the Atlantic Ocean on the east and south, and the Arthur Kill on the west. The island has an area of about 60 mia and is shaped somewhat like an arrowhead pointing southwest.
74° 15' 74° 00' 73° 45'
EXPLANATION
NEW YORK CITY LIMITS
WESTCHESTER COUNTY
BRONX
COUNTY
BRONX)
YORK INTERNATIONAL
AIRPORT(LAGUARDIA
AIRPORT)
QUEENS
COUNTY
J.F. KENNEDY ...* INTERNATIONAL AIRPORTANew York Bay
KINGS COUNTY
(BROOKLYN)
STATEN ISLAND
(RICHMOND COUNTY)
8 KILOMETERS
Base modified from Perlmutter and Arnow (1953, pi.2)
Figure 1. Location of Staten Is Land (Richmond County), in New York City.

Topography and Drainage
The topography of Staten Island ranges from steep hills to flat terrain. A hilly spine trends from about N60°E in the southwestern half of the Island to about N40°E in the northeastern part. Maximum land-surface altitude1 in the southwestern part is about 150 ft above sea level; in the northeastern part, where the slopes are steepest, it is about 405 ft. The 405-ft altitude is on Todt Hill (pi. 1), the highest spot on the eastern seaboard that is within 2.5 mi of the Atlantic Ocean. The hilly spine of the island is flanked by a flat plain ranging from less than 0.1 mi wide at the Island's northern and southern ends to as much as about 2 mi wide in the northwestern part. The topography of Staten Island is depicted on plate 1.
Several small streams form Staten Island's surface-drainage system; their locations are shown on plate 1. The longest stream is Richmond Creek, about 2.5 mi long, which drains westward from the central part of the Island. It starts at an altitude of about 260 ft in Egbertville and discharges to tidewater in the southern part of LaTourette Park. Lemon Creek, about 2.3 mi long, drains southward from an altitude of about 85 ft in Huguenot, in southern Staten Island, to the Atlantic Ocean near Seguine Point. Palmers Run, about 1.8 mi long, flows from an altitude of about 128 ft in Clove Lake Park northward to the Kill Van Kull. Springville Creek, about 1.5 mi long, drains westward from an altitude of about 150 ft north of LaTourette Park into Main Creek. Several smaller unnamed streams occur on the west side of the Island. No natural surface drainage occurs eastward toward The Narrows or Atlantic Ocean between St. George and Seguine Point; natural drainage in this part of the island is only by subsurface ground-water outflow.
Population and CuLture
The population of Staten Island increased at fairly even rates from about 33,830 in 1870 to 222,000 in 1960, then at more rapid rates, to about 295,400 in 1970 and 352,100 in 1980 (U.S. Census); each of the other boroughs of New York City had a population of millions in 1980.
Staten Island is the most sparsely populated borough of New York City; its population density in 1980 was 5,869 per mi2 . The island still has large open spaces. Individual homes predominate, and apartment houses and condominiums with up to six stories are common. Several larger multiple dwellings have been built near the Silver Lake Reservoir in the northeastern part of the Island, near Stapleton.
Staten Island is mostly a residential suburban area made up of many small communities. Small businesses and retail stores are the predominant commercial establishments. Several oil- and fuel-tank farms flank the Arthur Kill near Old Place, Bloomfield, and Charleston, and large sanitary landfills flank the Arthur Kill's eastern bank in the Fresh Kills and Travis areas.
1 Altitude, as used in this report, refers to distance above or below sea level.
Four bridges and a ferry connect Staten Island to points in New York City and New Jersey; counterclockwise from Fort Wadsworth, the Verazzano-Narrows Bridge leads across The Narrows to Kings County (Brooklyn), and the Staten Island-Manhattan Ferry connects St. George to New York County (Manhattan). The Bayonne Bridge spans the Kill Van Kull between Port Richmond and Bayonne, N.J.; the Goethals Bridge spans the Arthur Kill from Old Place to Elizabeth, N.J.; and the Outerbridge Crossing2 spans the Arthur Kill from Tottenville to Perth Amboy, N.J. (pi. 1).
GEOLOGY
Staten Island is underlain by consolidated rocks (bedrock) and unconsolidated deposits. The bedrock structure is complex, and rock types differ greatly within the Island's 60-mi2 area. The island is underlain by igneous, metamorphic, and sedimentary rocks that range from Upper Proterozoic to Lower Jurassic age. These bedrock units are the Manhattan Schist, the Staten Island Serpentine of Merrill (1898, p. 21-31), hereafter referred to as the Staten Island Serpentine or simply serpentine; the Newark Supergroup, undivided; and the Palisade Diabase.
The rocks are directly overlain by unconsolidated deposits of the Upper Cretaceous Raritan Formation, undivided, or by upper Pleistocene deposits of Wisconsinan glacial drift, except in several bedrock-outcrop areas (pi. 2). Holocene shore and salt-marsh deposits overlie upper Pleistocene deposits in shore and low-lying areas, especially in the western part of the island, and large areas of Holocene deposits along the Arthur Kill between Rossville and Bloomfield have been covered by sanitary landfills.
The following sections briefly describe the geology of Staten Island; the mineralogy of the geologic units is described in the several reports cited.
Bedrock
Manhattan Schist
The Manhattan Schist is a crystalline metamorphic-rock complex that could range from Late Proterozoic to Cambrian age (Lyttle and Epstein, in press). It is a dark-gray micaceous unit that was complexly folded and faulted and eroded to a peneplain upon which younger formations were deposited. The schist seems to be underlain or intruded by the Staten Island Serpentine. The unit is unconformably overlain by the Upper Cretaceous Raritan Formation in southern Staten Island and by upper Pleistocene deposits in the northwestern part.
2 "Outerbridge Bridge" is not euphonic. The bridge was named afterEugenius H. Outerbridge, first chairman of the Port Authority of New York, now called the Port Authority of New York and New Jersey.

The Manhattan Schist underlies western Staten Island from the St. George-Stapleton vicinity to Huguenot; nowhere does it crop out. The areal distribution of the schist and its surface configuration are shown on plate 2; its contiguous rocks are shown in the geologic sections in figure 2. The peneplain developed on the Manhattan Schist in Staten Island, represented by nearly straight contour lines on plate 2, is the end product of a long cycle of erosion from Cambrian to Cretaceous time.
Staten Is Land Serpentine
The Staten Island Serpentine is a greenish ultrabasic crystalline rock that is strongly resistant to weathering and underlies the highest part of Staten Island. Merrill (1898, p. 21-31) states that the serpentine is Precambrian and intrusive into the metamorphic rocks of New York City (which, in Merrill»s time, were believed to have been Precambrian). Fisher and others (1970, Lower Hudson Sheet) describe the unit ("serpentinite") as a Lower Ordovician intrusive; Lyttle and Epstein (in press) give the serpentine's age as Late Proterozoic to Cambrian. It is uncertain whether the serpentine is intrusive; its structural connection with the Manhattan Schist is not clear; therefore its age in the Late Proterozoic to Cambrian span is also uncertain (P. J. Lyttle, U.S. Geological Survey, oral commun., 1987).
The location of the serpentine, its surface configuration, and principal outcrops are shown on plate 2; the contiguous-rock relationships are shown in geologic sections in figure 2. The even surface,, shown by nearly straight contours on the serpentine's surface on plate 2 below altitude -50 ft, is part of the peneplain described in the section on the Manhattan Schist; the highly curved contours above altitude -50 ft represent topography developed on the more erosion-resistant serpentine until Pleistocene time.
Newark Supergroup, Undivided
The Upper Triassic and Lower Jurassic Newark Supergroup, undivided, in Staten Island is a sequence of sedimentary rocks consisting of brownish and reddish shales and sandstones. The sandstones are commonly arkosic (containing numerous feldspar fragments) and are probably beds of the Upper Triassic Stockton Formation, which is the basal part of the Newark Supergroup. These rocks underlie the western quarter of the island, where they are unconformably underlain by serpentine in the northern part of the island and by the Manhattan Schist in the southern part. Newark Supergroup rocks are not known to crop out on Staten Island.
The approximate location of the Newark Supergroup and its surface configuration are shown on plate 2; the contiguous-rock relationships are shown in geologic sections in figure 2. The rocks in the Newark Supergroup are softer and less resistant to erosion than the crystalline rocks that they abut (Manhattan Schist and serpentine) or contain (Palisade Diabase, described in the following section). The curved contours shown on the Newark Supergroup surface on plate 2 are interpreted from the few known rock contacts and effects of differential erosion of harder and softer rocks. Examples of differential erosion effects are shown in the Tottenville and Rossville areas where the -100 to -300-ft contours cross Newark Supergroup contacts with
CO
Arthur Kill
CDmOr~ OCD 00 0Z
30-HI
O0)
20)3:rCOX0)3.
COO:rc/> f-»
CO
SCD3
5[Q)3aCOCD 3CD3ffr5'CD
Z
iQ)*
COC oCD
CO
O
p
C3a
T3CO
V)Q)aCD
gQ) CT Q)C/JCD
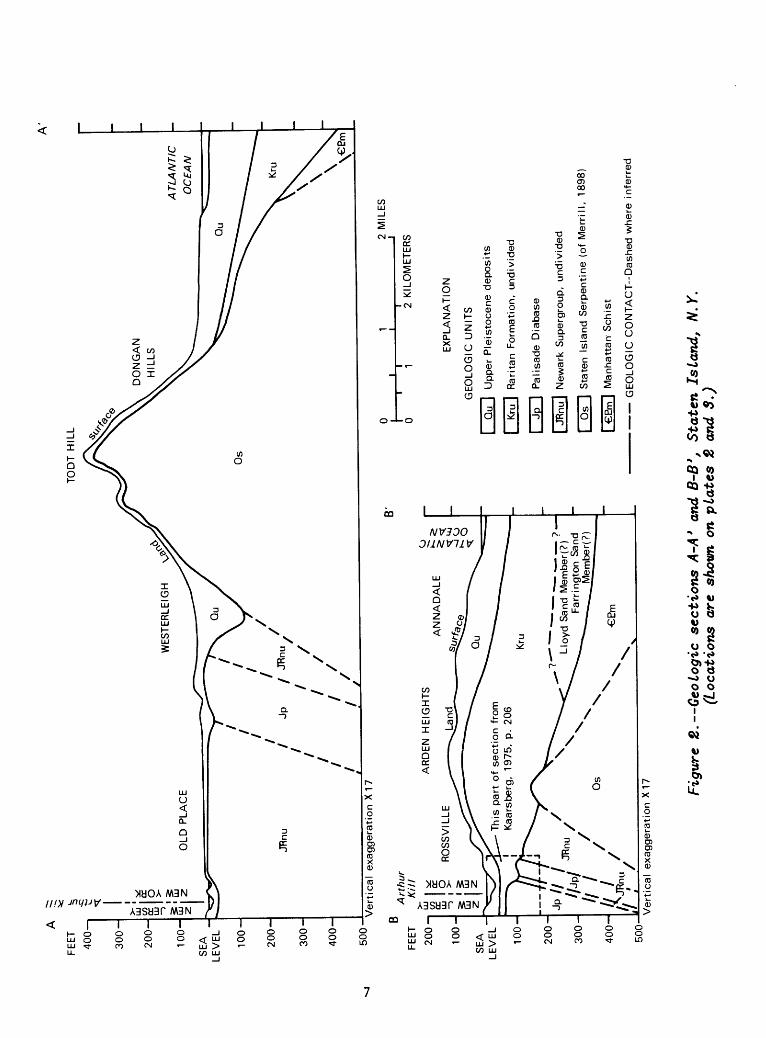
schist and serpentine, and where the -100 ft contour in the Newark Supergroup crosses a small intrusion of Palisade Diabase. In the Westerleigh-Port Richmond area, a buried valley about 100 ft deep is shown to be eroded into the Newark Supergroup between diabase and serpentine contacts.
Palisade. Diabase
The Lower Jurassic Palisade Diabase is a massive basic sill that was emplaced in the Newark Supergroup in western Staten Island (pi. 2 and fig. 2). Unlike the serpentine, which underlies the high and hilly area of the island, the diabase underlies a fairly flat, low area. North of the island, however, it forms the famous Palisades a near-vertical cliff along the Hudson River's western bank in northern New Jersey and southern New York. (The cliff attains an altitude of 827 ft at High Tor, near Haverstraw, N.Y., about 37 mi north of Staten Island.)
The Palisade Diabase also occurs in thin intrusions that are separated from the main diabase mass. Such an intrusion is in the vicinity of Rossville, near the Arthur Kill (pi. 2 and fig. 2); the sill's position on the maps is based on a geologic section by Kaarsberg (1975, p. 206).
UnconsoIi dated Deposi ts
Raritan Formation
The Upper Cretaceous Raritan Formation, undivided, on Staten Island consists of stratified white, light- to dark-gray, and red beds and lenses of clay, silt, and sand; lignite and pyrite are common. The formation is present from about Fort Wadsworth southwestward to the southern edge of LaTourette Park (pi. 3) and thence westward toward the Arthur Kill and into New Jersey; it probably also extends eastward across The Narrows into Long Island. The configuration of the Raritan Formation's surface is shown by contour lines on plate 3; the curvature of the contours indicates much erosion of the formation. Several outcrops of the formation were observed in southwestern Staten Island; their locations are shown on plate 3. The greatest thickness of Raritan penetrated by the few borings on Staten Island is 270 ft at well R70, near Huguenot (pi. 1). Geologic sections in figure 2 and the surface altitudes of the Raritan and the bedrock (pis. 2 and 3) indicate that the Raritan attains a thickness of as much as 400 ft in southern Staten Island. The Raritan Formation is unconformably underlain by bedrock units and unconformably overlain by upper Pleistocene deposits.
The lithology of the Raritan Formation of Staten Island probably is similar to the Raritan of Long Island, which consists of two members an upper, unnamed clay member and a lower unit, the Lloyd Sand Member. Wells R54, R61, and R72 (pi. 1) penetrated significant thicknesses of sand, 51, 35, and 23 ft, respectively, below even greater thicknesses of clay, 122, 52, and 80 ft, respectively (Perlmutter and Arnow, 1953, p. 54, 62, and 66). These wells are just north of Tottenville, where the upper part of the Raritan Formation was deeply eroded, as indicated by the closeness and curvature of

the contour lines (reentrant) on its upper surface (pi. 3). The borings did not fully penetrate the Raritan. The clay thicknesses penetrated by the wells indicate that the underlying sand is probably in the Lloyd Sand Member or in its probable equivalent in New Jersey the Farrington Sand Member. Well R42, in the Huguenot area, penetrates the Raritan and enters schist; the log of the well (Perlmutter and Arnow, 1953, p. 58-59) incompletely describes 270 ft of mostly clayey Raritan Formation (the bottom 57 ft are not described) but does not indicate a definite clay sequence overlying a definite sand sequence. The log of well R63, in the northern corner of Great Kills Park, also shows penetration through the Raritan and into serpentine without a clay-and-sand sequence (Perlmutter and Arnow, 1953, p. 62-63). However, the log of well R70 at Tottenville (pi. 1) shows penetration of 269 ft of virtually all clay before entering bedrock at 353 ft (Perlmutter and Arnow, 1953, p. 66).
The upper clay member of the Raritan Formation is known to overlap the Lloyd Sand Member in western Long Island (Soren, 1978, p. 6) and seems to overlap the Lloyd in Staten Island. It is probable that the northern limit of the Lloyd or Farrington equivalent lies between Tottenville and Huguenot and passes northeastward out of Staten Island (toward Long Island) in the vicinity of Great Kills Harbor (fig. 2, section B-B f ).
New Jersey's Raritan Formation differs from that of Long Island. New Jersey's Raritan is differentiated into four members, the lowest part of which is the Farrington Sand Member. Correlation of Long Island's Raritan with the Raritan of the New Jersey Coastal Plain is probably through an interfingering of lithologic facies between The Narrows and Raritan Bay.
Upper PLeistocene Deposits
Upper Pleistocene deposits of Wisconsinan glacial drift unconformably mantle the bedrock units and Raritan Formation except at a few small bedrock and Raritan outcrops in western and northern Staten Island (pi. 2, 3). The deposits probably are the Harbor Hill moraine. The drift consists of outwash and terminal- and ground-moraine deposits that lie in distinct northeast- oriented bands across Staten Island.
Outwash.--Outwash deposits consist mainly of stratified fine to coarse sand and gravel that were laid down by meltwater from a receding continental ice sheet. Outwash underlies the flat area of eastern Staten Island from Amboy and Richmond Roads to the shore between Arrochar and Great Kills Park. A later phase of ice-front recession is indicated by deposits that underlie the flat northwestern corner of the island in the Bloomfield-Old Place area. The outwash deposits are thickest (about 125 ft) along the eastern shore between New Dorp Lane and Arrochar (fig. 2). The extent of these outwash deposits is shown in figure 3.
Terminal-moraine deposits.--As the ice sheet moved into Staten Island and halted, it deposited along its front a mass of rock material that forms the Harbor Hill Terminal Moraine (fig. 2). The material consists of unsorted sand, gravel, cobbles, and boulders, all of which seem to be largely derived from local rock units, within a clayey and silty matrix. The maximum known thickness of the moraine is about 75 ft (Perlmutter and Arnow, 1953, p. 23).
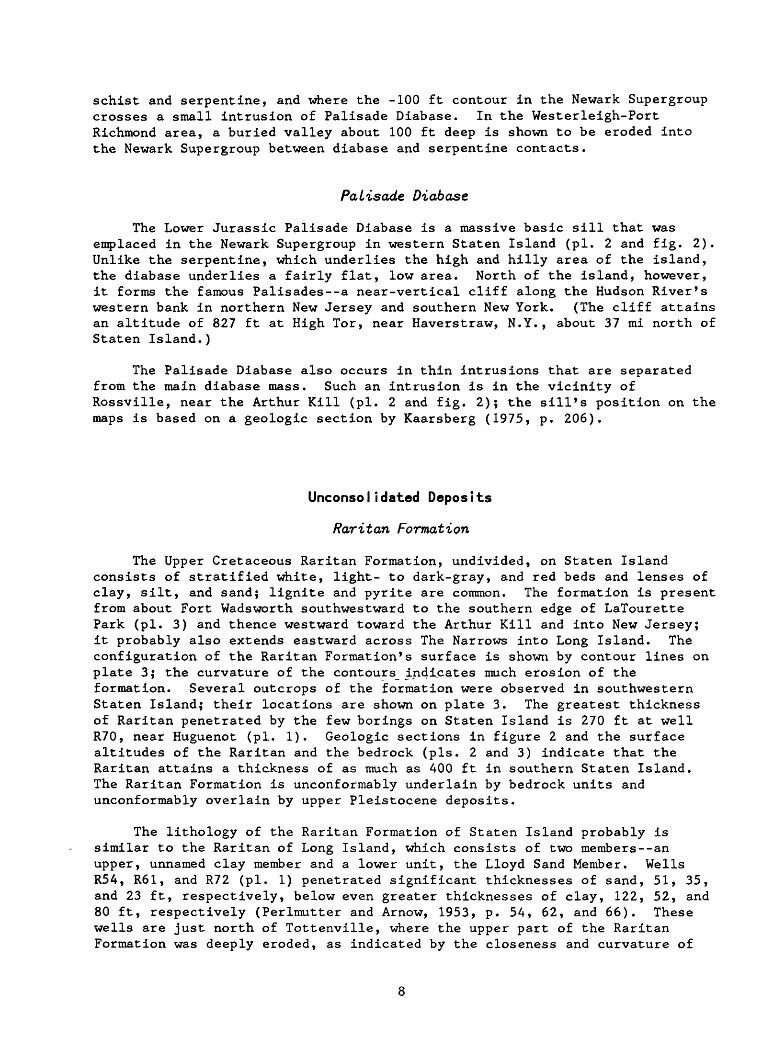
The moraine forms an irregular hilly area 1 to 2 mi wide west of Amboy and Richmond Roads between Stapleton and Tottenville; it is in alignment with the Harbor Hill Terminal Moraine of Long Island and extends southwestward into New Jersey.
Ground moraine.--These deposits are mainly reddish-brown clayey till derived chiefly from the Upper Triassic and Lower Jurassic shale and sandstone. They range in thickness from 0 to about 150 ft. Local bodies of stratified sand and gravel commonly occur within the ground moraine. The extent of the ground-moraine deposits in Staten Island is shown in figure 3.
74° 15' 74° 07'30"
40° 37' 30"
40° 30'
New York Bay
NEW
JERSEY
ARTIFICIAL FILL
HOLOCENE DEPOSIT
Qsm | Marsh deposits
PLEISTOCENE DEPOSITS
Qhtm| Harbor Hill terminal moraine
Qgm | Ground moraine
Qou I Outwash
GEOLOGIC CONTACT
2 MILES
2 KILOMETERS
Base modified from Perlmutter and Arnow, (1953, pi.2)
Pleistocene deposits from Perlmutter and Arnow (1953, pi.2)
Figure S. Surficiai deposits on Staten Is Land.
10

Holocene Deposits
Shore and marsh deposits.--Shore deposits of sand and nearshore and inland marsh deposits of sand and organic clay and silt have been virtually covered by artificial landfills. The extent of these deposits, most of which are on western Staten Island, can be seen on the U.S. Geological Survey's 15-minute topographic map of Staten Island (dated 1901, scale 1:62,500). The deposits' thicknesses are not well known, but they are generally thin, probably not significantly thicker than about 10 ft. Currently visible shore and marsh deposits are indicated in figure 3.
Artificial fill.--Locations of the major low, formerly swampy areas of Staten Island that have been filled in in modern times are shown in figure 3. Much of the material is sanitary fill from Staten Island and the other boroughs of New York City. Thickness of these deposits varies; the greatest thicknesses (more than 30 ft) are in several areas near the Arthur Kill, between Bloomfield and Rossville. The major areas of artificial fill on Staten Island are shown in figure 3.
GEOHYDROLOGY
The streams and ground water of Staten Island derive their water almost entirely from precipitation. Streamflow during dry periods is maintained by ground-water outflow into their channels. (See the following section, "Surface Water.") Minor amounts of water probably enter the ground-water system through leaking water mains and sewers and, in a few areas, from individual household sanitary disposal systems (such as septic tanks and cesspools).
U.S. Weather Bureau records of 1948-68 indicate an average annual precipitation of about 44 in. at Westerleigh, in north-central Staten Island. Monthly precipitation during that period averaged about 3.5 in. except in July and August, in which it averaged 4.5 in. The least annual precipitation in that period was 28.2 in. in 1965; the highest was 55.2 in. in 1958.
Surface Water
Streams
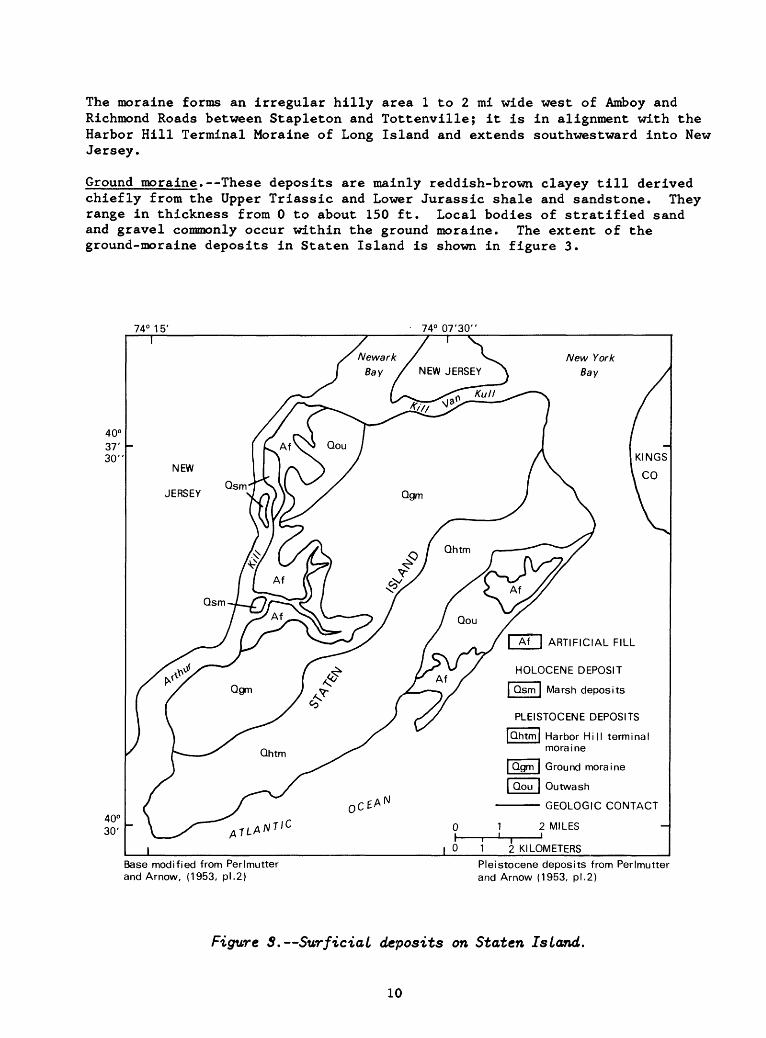
Streams on Staten Island, unlike those in the other boroughs of New York City, have been little affected by urbanization except where parts of their channels have been covered in built-up areas. Although streams in the other boroughs have been largely eliminated by landfills and by water-table draw downs resulting from ground-water pumping, most of Staten Island's streams now (1988) have the same length of perennial flow as before 1900, when the Geological Survey made the first topographic map of the island. The island's streams are identified on plate 1. Miscellaneous streamflow measurements on four streams near their mouths (U.S. Geological Survey, 1962-68, inclusive),
11
are given in table 1. Most of the measurements were mostly made during the 1962-66 drought years and are considered to represent the streams* approximate base flows. Discharge-measurement data to quantify the high-flow characteristics of these streams are lacking. No streamflow records are available from before 1962 or after 1968; however, average annual streamflows in earlier decades were probably higher because the increase in paved areas and number of storm sewers that discharge to tidewater tend to decrease runoff to streams and to decrease infiltration of precipitation to the ground-water body, which in turn diminishes the base flow of streams.
The presence of flow during dry periods indicates that ground water is discharging into the streams* channels. In January and March 1986, after several weeks of insignificant precipitation, all of Staten Island's principal streams were flowing from the points at which their flows are shown to begin on the Geological Survey's maps. Flow along Richmond Creek was observed at altitudes as high as 255 ft.
Table 1.--Average discharge of selected Staten Island streams1 .
[Upper value is average discharge, in ft*/s; lower value is number of measurements; dashes indicate no measure ments made. Stream locations are shown on pi. 1.]
Stream
Lemon Creek
Palmers Run
Richmond Creek
Springville Creek
1962
--
2.74 (1)
.36 (1)
.30 (1)
1963
3.1 (3)
6.1 (3)
2.4 (3)
1.2 (3)
1964
2.9 (2)
3.6 (3)
1.8 (3)
.93 (3)
1965
2.9 (3)
1.8 (3)
.73 (3)
.48 (3)
1966
2.0 (2)
1.5 (2)
.66 (3)
.25 (3)
1967
1.0 (2)
2.1 (2)
.68 (2)
.23 (2)
1968
2.2 (2)
2.0 (2)
.62 (2)
.19 (2)
1 Most measurements were made during the 1962-66 drought years and are considered to represent the streams' base flows. Drainage areas of the streams were not measured.
Ponds
Most of the ponds on Staten Island seem to be outcroppings of the water table. These include Silver Lake (Reservoir) and the other ponds in Clove Lake Park, which are now artificially controlled. The water-table nature of these ponds is indicated by the Geological Survey's 15-minute quadrangle map of Staten Island made from surveys in 1888-89 and 1897, and by the areal water-table altitude described in the following section on ground water.
12

Ground Water
Occurrence
Fresh ground water on Staten Island occurs in the bedrock and unconsoli- dated deposits under both unconfined (water-table) and confined (artesian) conditions. The fresh ground water is surrounded on all sides of the island and at depth by saline ground water. The hydraulic interconnections between the geologic units were not studied; therefore, only a general description of ground water as it occurs within the respective units is given.
Unconsolidated Deposits.--Unconsolidated deposits on Staten Island consist of glacial outwash and moraines and the Raritan Formation, as described below.
Outwash.. Outwash deposits consist mostly of sand and gravel beds that have insignificant amounts of disseminated clay and silt. Because these deposits have few significant interbeds or laminations of clay and silt, water within outwash is almost everywhere under water-table (unconfined) conditions. A well installed in outwash will encounter water at the water table, and the water level in the well will not change significantly with depth of penetration.
Outwash deposits generally have high hydraulic conductivity because of their characteristic coarse texture; those that are thick and extensive are capable of yielding large amounts of water (hundreds to thousands of gal/min) to properly constructed wells. The horizontal and vertical conductivities of outwash deposits on nearby Long Island have been estimated to be 270 and 27 ft/d, respectively (Franke and Cohen, 1972, p. C271); the hydraulic conductivity of Staten Island's outwash deposits is probably similar. Properly constructed wells in outwash commonly have specific capacities of from 50 to 100 (gal/min)/ft of drawdown in the well.
The outwash deposits of Staten Island are neither thick nor extensive compared to those of Long Island, and they are found only in the eastern and northwestern parts (fig. 3). The greatest outwash thickness, about 125 ft, is along the eastern shore between New Dorp Lane and Arrochar. Five New York City well fields (not operated since September 1970) tapped this body of outwash but together pumped less than 5 Mgal/d from these fields to avoid inducing intrusion of saline ground water.
Terminal and ground moraines. These deposits consist t>f till an unsorted mixture of clay, silt, sand, gravel, and sparse to abundant cobbles and boulders. Locally, the moraines may contain stratified beds, including sand and gravel with significant amounts of disseminated clay and silt.
Ground water in the moraines can be under water-table or confined conditions. Water-table conditions are present where the upper part of the till is sandy; confined conditions prevail where clay and silt beds overlie the water-bearing zone. One instance of confined ground water was reported by the owner of well R104, driven in terminal-moraine deposits in the Great Kills vicinity (pi. 1), who stated that no water entered the well casing until the well was driven to a depth of 44 ft, at which point water rose 10 ft into the casing (Theresa Antoniello, oral commun., 1985).
13
Sandy till generally yields small quantities of water to wells; domestic wells in sandy till commonly yield as much as 10 gal/min. The average vertical hydraulic conductivity of clayey and silty till is extremely low less than 0.001 and 0.008 ft/d, respectively (Morris and Johnson, 1967, p. D29); the horizontal hydraulic conductivity, which tends to be 10 to 20 times greater than the vertical value, would still be too low to yield enough water to drilled wells for even the domestic supplies commonly needed in a highly developed area. Large-diameter (dug) wells in clayey and silty well may yield small quantities of water, but because most are shallow and have a large area of exposure, they can easily be contaminated or can become dry in periods of drought.
A yield of 1,500 gal/min from sandy beds in ground moraine is reported for well R69, in the Bulls Head vicinity (pi. 1); this well had been used for public supply by New York City. This seemingly large yield, however, represents the combined contributions from 30 wells on a common-suetion line (Perlmutter and Arnow, 1953, p. 83). The wells in R69 tap sand and gravel strata separated by clayey and silty beds in what appears to be a valley-fill deposit below the surficial moraine (Perlmutter and Arnow, 1953, p. 23). The average pumpage from R69's 30 wells in 1950 was only 0.6 Mgal/d (417 gal/min), and the City's well fields were generally operated only several months per year (Perlmutter and Arnow, 1953, p. 24).
Large sustained yields should be not expected from wells that tap Staten Island's till. Specific capacities of wells in till can differ widely with the nature of the deposits but generally will be less than 3 (gal/min)/ft.
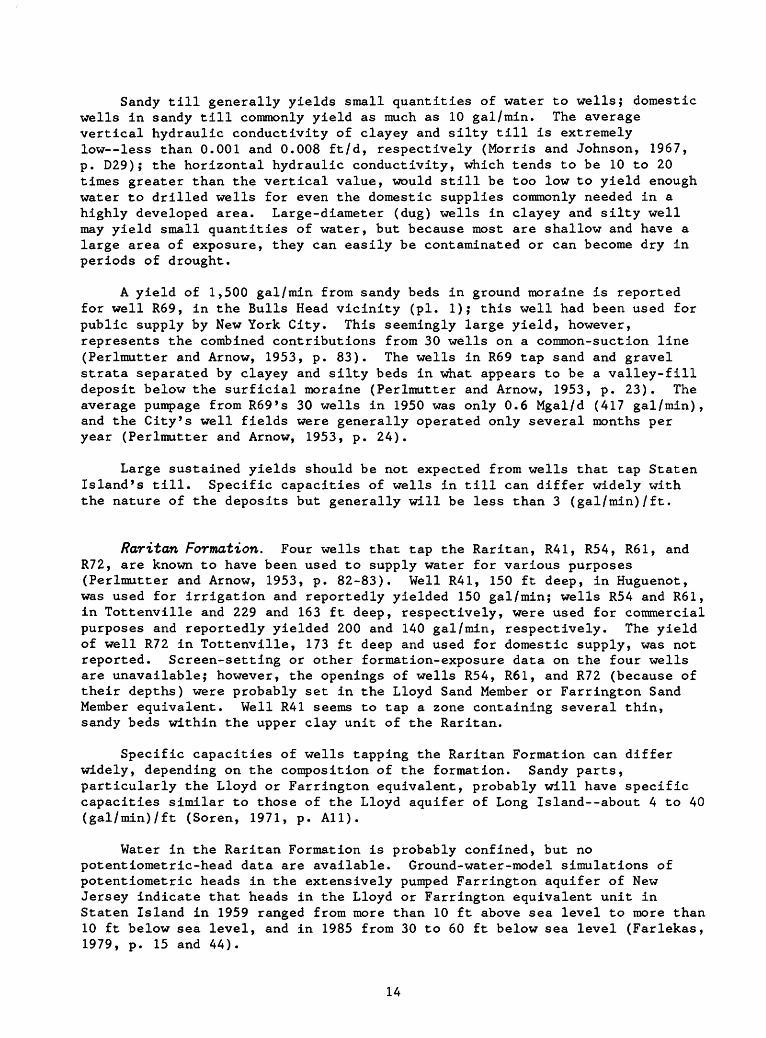
Raritan Formation. Four wells that tap the Raritan, R41, R54, R61, and R72, are known to have been used to supply water for various purposes (Perlmutter and Arnow, 1953, p. 82-83). Well R41, 150 ft deep, in Huguenot, was used for irrigation and reportedly yielded 150 gal/min; wells R54 and R61, in Tottenville and 229 and 163 ft deep, respectively, were used for commercial purposes and reportedly yielded 200 and 140 gal/min, respectively. The yield of well R72 in Tottenville, 173 ft deep and used for domestic supply, was not reported. Screen-setting or other formation-exposure data on the four wells are unavailable; however, the openings of wells R54, R61, and R72 (because of their depths) were probably set in the Lloyd Sand Member or Farrington Sand Member equivalent. Well R41 seems to tap a zone containing several thin, sandy beds within the upper clay unit of the Raritan.
Specific capacities of wells tapping the Raritan Formation can differ widely, depending on the composition of the formation. Sandy parts, particularly the Lloyd or Farrington equivalent, probably will have specific capacities similar to those of the Lloyd aquifer of Long Island about 4 to 40 (gal/min)/ft (Soren, 1971, p. All).
Water in the Raritan Formation is probably confined, but no potentiometric-head data are available. Ground-water-model simulations of potentiometric heads in the extensively pumped Farrington aquifer of New Jersey indicate that heads in the Lloyd or Farrington equivalent unit in Staten Island in 1959 ranged from more than 10 ft above sea level to more than 10 ft below sea level, and in 1985 from 30 to 60 ft below sea level (Farlekas, 1979, p. 15 and 44).
14

Bedrock.--The bedrock on Staten Island consists of the four units described below.
Newark Supergroup, undivided. No data on ground-water yields from the shales and sandstones of the Newark Supergroup in Staten Island are available. These rocks tend to have a primary porosity from bedding-plane separations and a secondary porosity in spaces developed by fractures such as joints and faults. The average horizontal hydraulic conductivity of shales and sand stones (such as those in the Newark Supergroup) ranges from a fraction of an inch per day to about 10 ft/d (Morris and Johnson, 1967, p. D18). The vertical hydraulic conductivity of these rocks can range from much less than to somewhat more than the horizontal hydraulic conductivity because the rock's permeability and hydraulic conductivity are controlled by several factors, including dip, folding, and fracturing, in addition to bedding.
Where the openings in the rocks are numerous and intersecting and are not "healed" (filled) by secondary-mineral deposition, shale and sandstone typically can yield small to large amounts of water to wells. (The yield will depend on several factors, including the amount of fracturing, number of bedding planes, degree of opening in the pore spaces, and the depth and diameter of the well.) A report by Perlmutter (1959, p. 101-120) gives yields of 269 wells that tap the Newark Supergroup in Rockland County, N.Y., about 35 mi north of Staten Island; the yields ranged from 3 to 1,515 gal/min and averaged 83 gal/min. Well depths ranged from 42 to 805 ft, and reported specific capacities of the wells ranged from 0.32 to 33 (gal/min)/ft.
Water in the Newark Supergroup of Staten Island can be under water-table or confined conditions, depending on the degree of confinement in the overlying Pleistocene deposits and the amount of hydraulic interconnections within the shales and sandstones.
The Newark Supergroup on Staten Island can probably yield small to moderate amounts of water to wells, but no information on the quality of water in the island's Newark Supergroup is available., Wells hundreds of feet deep in the Newark Supergroup probably will produce water with undesirable amounts of chloride, and pumping near shores can induce movement of saline ground water toward wells in these rocks.
Palisade Diabase. The Palisade Diabase yields water only from fractures. Where the rock has been weathered, as seen in the Palisades of the Hudson River north of Staten Island, it shows a fairly open columnar jointing and other fractures; at depth it is more solid because the fractures tend to be more compressed. The hydraulic conductivity of the diabase is probably low, similar to that of granite. At the depths to which wells would be installed, the rock is weathered with enlarged fractures, and the average vertical and horizontal hydraulic conductivities, which probably are similar, would be about A.5 ft/d (Morris and Johnson, 1967, p. D16). The diabase can, therefore, yield only small amounts of water to wells. Data are available from only two wells in the diabase of Staten Island--RA7 near the Kill Van Kull and RA8 near Old Place. These wells were reportedly abandoned because of low yield, and the water from RA7 also was reported to be salty (Perlmutter and Arnow, 1953, p. 82). Wells that tap mainly diabase (some of the wells
15
also tap the overlying Newark Supergroup) in Rockland County reportedly yielded from 2.5 to 16 gal/min (Perlmutter, 1959, p. 101-120). The specific capacities of wells that tap the diabase probably will not exceed 3 (gal/min)/ft, and that of most wells will probably be less than 1 (gal/min)/ft.
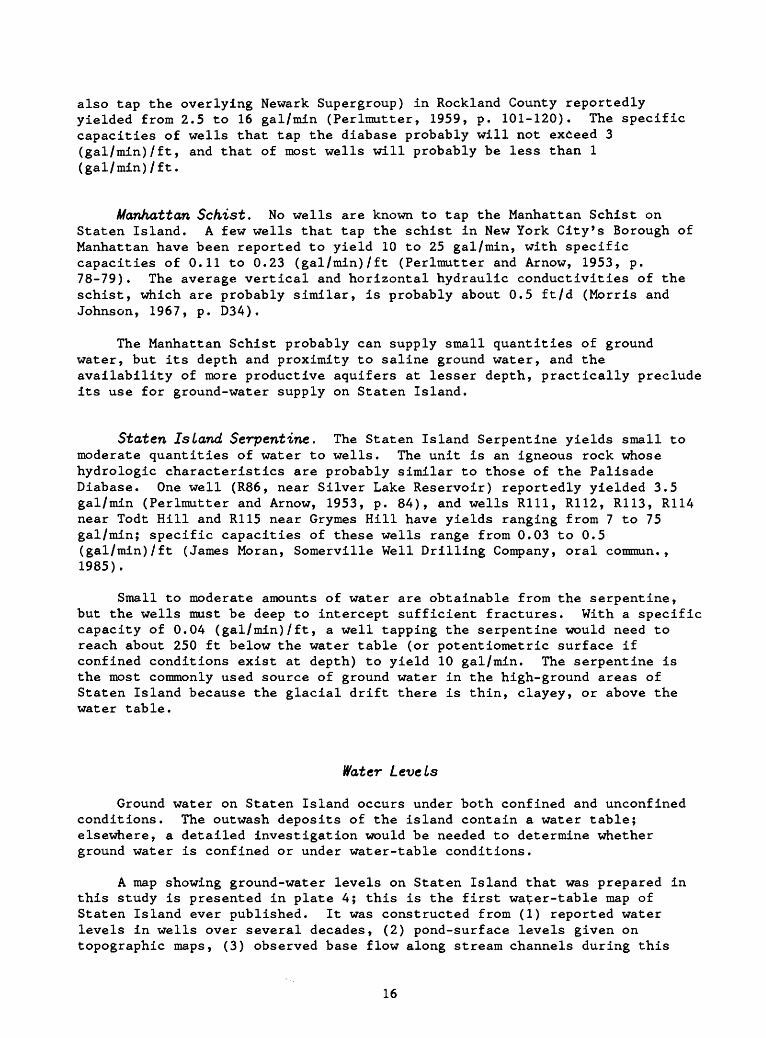
Manhattan Schist. No wells are known to tap the Manhattan Schist on Staten Island. A few wells that tap the schist in New York City's Borough of Manhattan have been reported to yield 10 to 25 gal/min, with specific capacities of 0.11 to 0.23 (gal/min)/ft (Perlmutter and Arnow, 1953, p. 78-79). The average vertical and horizontal hydraulic conductivities of the schist, which are probably similar, is probably about 0.5 ft/d (Morris and Johnson, 1967, p. D34).
The Manhattan Schist probably can supply small quantities of ground water, but its depth and proximity to saline ground water, and the availability of more productive aquifers at lesser depth, practically preclude its use for ground-water supply on Staten Island.
Staten Is Land Serpentine. The Staten Island Serpentine yields small to moderate quantities of water to wells. The unit is an igneous rock whose hydrologic characteristics are probably similar to those of the Palisade Diabase. One well (R86, near Silver Lake Reservoir) reportedly yielded 3.5 gal/min (Perlmutter and Arnow, 1953, p. 84), and wells Rill, R112, R113, R114 near Todt Hill and R115 near Grymes Hill have yields ranging from 7 to 75 gal/min; specific capacities of these wells range from 0.03 to 0.5 (gal/min)/ft (James Moran, Somerville Well Drilling Company, oral commun., 1985).
Small to moderate amounts of water are obtainable from the serpentine, but the wells must be deep to intercept sufficient fractures. With a specific capacity of 0.04 (gal/min)/ft, a well tapping the serpentine would need to reach about 250 ft below the water table (or potentiometric surface if confined conditions exist at depth) to yield 10 gal/min. The serpentine is the most commonly used source of ground water in the high-ground areas of Staten Island because the glacial drift there is thin, clayey, or above the water table.
Water Levels
Ground water on Staten Island occurs under both confined and unconfined conditions. The outwash deposits of the island contain a water table; elsewhere, a detailed investigation would be needed to determine whether ground water is confined or under water-table conditions.
A map showing ground-water levels on Staten Island that was prepared in this study is presented in plate 4; this is the first wa^er-table map of Staten Island ever published. It was constructed from (1) reported water levels in wells over several decades, (2) pond-surface levels given on topographic maps, (3) observed base flow along stream channels during this
16
study, and (4) interpretation of the island's topography in conjunction with the known and reported ground-water levels. Ground-water levels on the island have probably remained nearly constant to date because development has been relatively small and ground-water pumping minimal. Ground-water levels tend to be highest in the early spring (evapotranspiration losses are least from fall to spring) and are lowest in the early fall (evapotranspiration is greatest from spring through summer). The degree of seasonal water-table fluctuation on Staten Island is unknown but probably ranges from 5 to 15 ft; greater fluctuation can be expected in periods of extended droughts.
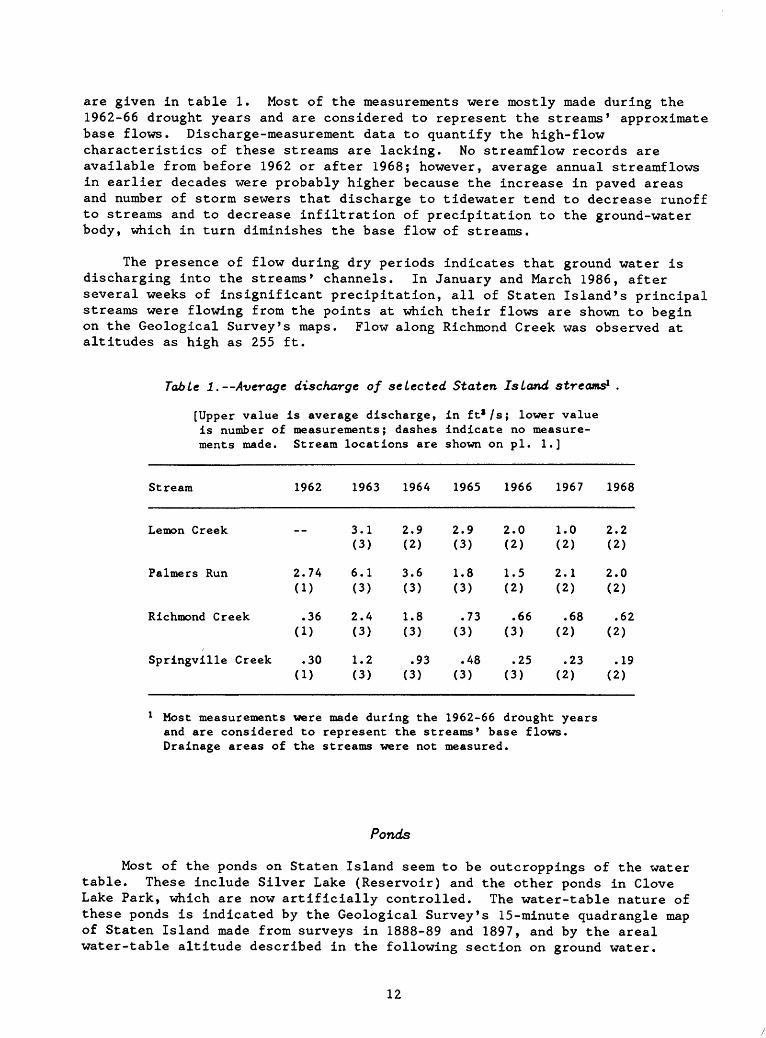
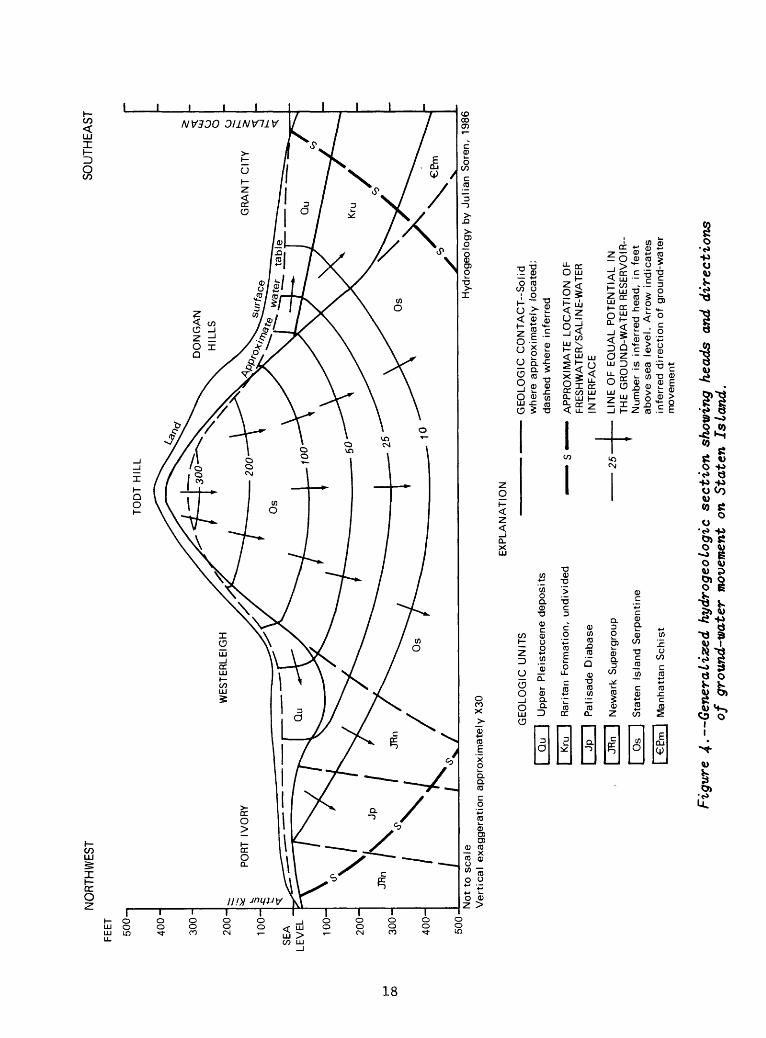
The contours on plate 4 give an estimate of the altitudes at which water will stand in a properly constructed well that taps outwash deposits or in a well that does not penetrate bedrock more than several feet. The map does not necessarily show the depth to which a well must be drilled to encounter water; for example, wells in glacial drift outside the outwash areas may need to be deeper than the water-level altitude shown in plate 4 to reach water, but the final level of water in the well should be approximately that shown on plate 4. Water levels in wells that tap bedrock and the Raritan Formation will significantly decline with depth of penetration (fig. 4). The map on plate 4 and the vertical NE-SW section in figure 4 should, therefore, be helpful to residents of the island who need ground-water information and provide a basis for future ground-water studies on the island.
Recharge
Staten Island's fresh ground-water reservoir is recharged mainly by precipitation, but probably a significant amount is also derived from leaking water mains, sewers, and individual wastewater-disposal systems. Recharge on Staten Island has been adequate to maintain a seemingly stable water table over recent decades. The amount of recharge on the island is unknown, but annual recharge on Long Island, just to the east, is about 20 inches (from the average annual rainfall of about 44 inches), which yields about 1 (Mgal/d)/mi2 (Suter, 1937, p. 32). Staten Island's land surface is more hilly and less permeable than that of Long Island; also, paved areas greatly reduce infiltra tion of water to the water table and increase runoff to streams and sewers. Thus, recharge conditions on Staten Island probably are comparable to those in Kings and Queens Counties (fig. 1), where estimated recharge ranges from about 0.25 to 0.5 (Mgal/d)/mi2 , respectively (Perlmutter and Soren, 1962, p. E139, and Soren, 1971, p. A20). At such recharge rates, Staten Island's ground-water reservoir would receive from 15 to 30 Mgal/d.
Water-levels on Staten Island have probably remained stable because pumpage has been small. This stability is indicated by the island's relatively constant streamflow, which represents surplus water discharged by the ground-water reservoir. Thus, recharge seems to be ample for the current pumpage and probably for considerable increases in pumpage. Ground-water withdrawals are not considered to be excessive until the water table and streamflow show significant long-term lowering. Areal drought conditions can cause temporary declines in streamflow and ground-water levels, and heavy pumping during a drought can cause further decreases in streamflow and lowering of the island's water table.
17
NO
RTH
WE
ST
SO
UTH
EA
ST
oo
No
t to
sca
leV
ert
ical
exa
ggera
tion a
pp
roxim
ate
ly X
30H
ydro
ge
olo
gy
by
Ju
lian
Sor
en,
1986
EX
PLA
NA
TIO
N
GE
OLO
GIC
UN
ITS
Qu
| U
pper
Ple
isto
ce
ne
de
po
sits
Kru
|
Rarita
n F
orm
atio
n,
un
div
ide
d
Jp
| P
alis
ade D
iabase
JKn
| N
ew
ark
Superg
roup
Os
] S
tate
n Is
lan
d S
erp
entin
e
P.m
I
Ma
nh
att
an
Sch
ist
25-
GEOL
OGIC
CO
NTAC
T--S
OIid
where
ap
pro
xim
ate
ly lo
cate
d;
dash
ed w
he
re i
nfe
rre
d
AP
PR
OX
IMA
TE
LO
CA
TIO
N O
F
FR
ES
HW
AT
ER
/SA
LIN
E-W
AT
ER
IN
TE
RF
AC
E
LIN
E O
F E
QU
AL
PO
TE
NT
IAL I
N
TH
E G
RO
UN
D-W
AT
ER
RE
SE
RV
OIR
- N
um
be
r is
in
ferr
ed
head,
in f
ee
t above
sea le
vel. A
rrow
indic
ate
s
infe
rre
d d
ire
ctio
n o
f gro
und-w
ate
r m
ove
me
nt
Figu
re 4
- Generaiized
hydr
ogeo
Logi
c section showing
heads
and directions
of ground-water
move
ment
on Staten
Is Lan
d.
Movement
The fresh ground water of Staten Island moves seaward, toward the saline ground water that surrounds the island. A curvilinear ground-water divide (pi. 4) extends southwestward from St. George through Grymes Hill, Todt Hill, Egbertville, Richmondtown, Eltingville, Huguenot, and Pleasant Plains to Tottenville. Ground water along the divide flows downward; elsewhere it flows laterally away from the divide in a direction perpendicular to the water-level contours toward discharge points stream channels or tidewater. The downward movement through the glacial deposits in the area of the divide provides recharge to the Raritan Formation and the bedrock units.
The unconsolidated deposits and bedrock are hydraulically connected, and ground water flows both vertically and horizontally within the combined system. Most of the flow occurs within the glacial deposits, however, because they generally have greater hydraulic conductivity. (An analogy of the hydraulic system is a parallel electrical circuit, in which the branches with low resistance carry wore current than those with higher resistance.) On Staten Island, the rate of horizontal flow through the geologic system probably ranges from a small fraction of an inch per day in the bedrock to about 1.5 ft/d in the sandy and gravelly glacial deposits.
A diagram showing the directions of ground-water movement in a generalized hydrogeologic section from about Port Ivory to Grant City is given in figure 4. The demarcation between fresh and saline ground water in figure 4 is estimated from the Ghyben-Herzberg principle (which defines the levels at which immiscible fluids of differing densities will stand at in a U-tube). For practical purposes (fresh and saline ground water are not completely immiscible), freshwater will extend approximately 40 ft below sea level for each foot of ground-water head above sea level. The demarcation shown in figure 4 applies only to nonpumping conditions. Sustained heavy pumping will cause saline ground water to move laterally and upward toward pumping centers. The former pumping of ground water from the City of New York's pumping stations on Staten Island was severely restricted to halt the landward movement of salty ground water.
Ckemicai Quality
All ground water on Staten Island except that from shallow wells near the shores and wells screened deeper than about 40 ft below sea level for each foot of head in the well above sea level, is of sufficiently good quality for most of New York City's permitted uses on Staten Island.
Hardness and Chloride. Perlmutter and Arnow (1953, p. 34-35) list 14 chemical analyses of Staten Island's ground water. The analyses show the water as moderately hard (60 to 120 mg/L as CaC08 ) to very hard (more than 180 mg/L as CaC08 ) and with low to moderate chloride concentrations (8 to 70 mg/L). Twelve of the samples were from wells that tap glacial deposits and ranging in depth from 22 to 180 ft. All were within 1 mi of the shore, and most were within 0.5 mi. Water from one well (R19, near Rosebank), 180 ft deep and 0.2 mi from the shore, had a hardness of 761 mg/L (as CaC08 ) and a chloride concentration of 1,550 mg/L. (Chloride above 250 mg/L is considered to be
19
excessively salty.) Two of the wells, R41 near Huguenot and R54 near Tottenville, which tapped the Raritan Formation at depths of 135 and 230 ft, respectively, produced water with the lowest hardness (85 and 50 mg/L, respectively) and lowest chloride concentrations (10 and 2 mg/L, respectively) in 1942 (Perlmutter and Arnow, 1953, p. 35). However, the low potentiometric-head values estimated for the Lloyd or Farrington equivalent unit of the Raritan Formation in 1985 (see preceding section, "Ground Water, Raritan Formation") indicate that water from wells that tap sand beneath thick clay deposits in Staten Island's Raritan Formation will probably have excessive chloride concentrations. Water in the Lloyd aquifer at Kings County's southwestern end, where the aquifer's potentiometric head in 1968 (Soren, 1971, pi. 2, map F) and in 1979 (Donaldson and Koszalka, 1983, pi. 1A west) is indicated to have been at about sea level since the late 1960's, contained 110 mg/L of chloride in 1981 (Buxton and others, 1981, p. 50).
Iron.--In the 14 analyses above, only two showed excessive iron (more than 300 /Jg/L). The concentration of iron at well R19 (glacial) was 7,500 /Jg/L and at well R54 (in the Raritan) was 5,400 /Jg/L. The iron at well R19 is probably due to the well's considerable depth (180 ft), where the water was longer in transit and had the time to dissolve iron minerals from the rocks than water at shallower depths. Iron at well R54 is probably due to the water's residence time in the ground-water body and to the common occurrence of pyrite (iron sulfide) in the Raritan Formation.
Water Use
Ground water has not been used for public supply since September 1970. Before 1970, New York City generally pumped less than 5 Mgal/d to supplement the surface-water supply from upstate New York. Pumpage reached as much as 5 Mgal/d only during drought periods that reduced the supply from upstate reservoirs. Maximum pumpage was limited to 5 Mgal/d because higher rates induced significant saline ground-water infiltration that contaminated the supply.
SUMMARY AND CONCLUSIONS
Staten Island homeowners and business owners have expressed great interest in ground water since the 1962-66 drought. New York City has prohibited the use of its public-supply water for lawn irrigation, automobile washing, filling of swimming pools, and similar uses during droughts. Hundreds of wells for individual-home and commercial uses were installed on Staten Island during the drought of 1962-66, which affected the northeastern United States, and the 1983-85 drought, which affected New York City's upstate watersheds. More wells probably will be installed in future droughts. Most of the wells were small-diameter (1.25- to 2-in. I.D.) driven-point wells in sand, but some were of larger diameter, up to 6-in. I.D., and drilled deep into the Ordovician Staten Island Serpentine.
20
Most homeowners and small businesses on Staten Island should be able to find sufficient ground water for their needs, either from personally installed shallow driven wells or, where bedrock is the source of water or where the depth to water is too great for individual efforts, from wells installed by professional drillers.
The ground-water reservoir in the unconsolidated deposits and bedrock of Staten Island has been little developed for water supply. Public-supply pumpage before September 1970 rarely exceeded 5 Mgal/d, and no public-supply pumping has been done since then because the City of New York has provided the total public supply from its upstate reservoirs.
The ground-water reservoir of Staten Island generally meets its residents' needs for the water uses prohibited by New York City during droughts, and this reservoir seems capable of considerably more development. The largest yields of ground water are obtainable from sand and gravel beds and lenses in the upper Pleistocene deposits, principally from outwash. Sand beds in the Cretaceous Raritan Formation and older bedrock can supply small to moderate supplies. Water pumped from wells near the shore will tend to have high chloride and hardness concentrations, however, depending on the well depth, distances from shore, and rate of withdrawal.
REFERENCES CITED
Buxton, H. T., Soren, Julian, Posner, Alex, and Shernoff, P. K., 1981, Recon naissance of the ground-water resources of Kings and Queens Counties, New York: U.S. Geological Survey Open-File Report 81-1186, 59 p.
Donaldson, C. D., and Koszalka, E. J., 1983, Potentiometric surface of theLloyd aquifer, Long Island, New York, in January 1979: U.S. Geological Survey Open-File Report 82-162, 2 sheets.
Farlekas, G. M., 1979, Geohydrology and digital simulation model of theFarrington aquifer in the northern coastal plain of New Jersey: U.S. Geological Survey Water-Resources Investigations 79-106, 55 p.
Fisher, D. W., Isachsen, Y. W., and Richard, L. V., 1970, Geologic map ofNew York: New York State Museum and Science Service, Geological Survey, Map and chart series no. 15.
Franke, 0. L., and Cohen, Philip, 1972, Regional rates of ground-watermovement on Long Island: U.S. Geological Survey Professional Paper 800-C, p. C271-C277.
Kaarsberg, Ernest, 1975, Glacial features and deposits of Staten Island andadjoining areas, in New York State Geological Association Guidebook, 47th annual meeting: Hempstead, N.Y., Hofstra University, Department of Geology, p. 202-206.
21
REFERENCES CITED (Continued)
Lyttle, P. T., and Epstein, J. B., Geologic map of the Newark l°x 2°Quadrangle, Pennsylvania, New York, and New Jersey: U.S. Geological Survey Miscellaneous Investigations Series Map 1-1715, 1:250,000 (in press).
Merrill, F. J. H., 1898, The geology of crystalline rocks of southeastern New York, in 15th annual report, New York State Museum: Albany, N.Y., v. 1, p. 21-31.
Merrill, F. J. H., Darton, N. H., Rollick, Arthur, Salisbury, R. D., Dodge, R. E., Bailey, Willis, and Pressey, H. A., 1902, Description of the New York City District: U.S. Geological Survey Geologic Atlas, Folio 83, 19 p.
Morris, D. A., and Johnson, A. 1., 1967, Summary of hydrologic and physical properties of rock and soil materials, as analyzed by the hydrologic laboratory of the U.S. Geological Survey, 1948-60: U.S. Geological Survey Water-Supply Paper 1839-D, 42 p.
Perlmutter, N. M., 1959, Geology and ground-water resources of Rockland County, New York: Albany, N.Y., Water Power and Control Commission Bulletin GW-42, 133 p.
Perlmutter, N. M., and Arnow, Theodore, 1953, Ground water in Bronx, New York, and Richmond Counties with summary data on Kings and Queens Counties, New York City, New York: Albany, N.Y., Water Power and Control Commission Bulletin GW-32, 86 p.
Perlmutter, N. M., and Soren, Julian, 1962, Effects of major water-tablechanges in Kings and Queens Counties, New York City: U.S. Geological Survey Professional Paper 450-E, p. E136-E139.
Soren, Julian, 1978, Subsurface geology and paleogeography of Queens County, Long Island, New York: U.S. Geological Survey Water-Resources Investigations Report 77-34, 17 p.
________ 1971, Ground-water and geohydrologic conditions in Queens County,New York: U.S. Geological Survey Water-Supply Paper 2001-A, 39 p.
Suter, Russell, 1937, Engineering report on the water supplies of Long Island, New York: New York State Water Power and Control Commission Bulletin GW-2, 64 p.
U.S. Geological Survey, 1962-68, Water-resources data for New York, part 1, surface-water records: U.S. Geological Survey open-file report (published annually through 1984).
22 <r U.S. GOVERNMENT PRINTING OFFICE: 1988 201 - 979 / 60005