geohydrologic evaluation of spring sites at social circle ... · geohydrologic evaluation of spring...
TRANSCRIPT
GEOHYDROLOGIC EVALUATION OF SPRING SITES
AT SOCIAL CIRCLE, GEORGIA
DECEMBER 5 - 8,1988
By John S. Clarke
U.S. GEOLOGICAL SURVEY
Open-File Report 89-236
Prepared in cooperation with
WALTON COUNTY
Doraville, Georgia
1989

DEPARTMENT OF INTERIOR
MANUEL LUJAN, JR., Secretary
U.S. GEOLOGICAL SURVEY
Dallas L. Peck, Director
For additional information Copies of this report may bewrite to: purchased from:
District Chief U.S. Geological SurveyU.S. Geological Survey Books and Open-File Reports6481-B Peachtree Industrial Blvd. Federal Center, Bldg. 810Doraville, Georgia 30360 Denver, Colorado 80225

CONTENTS
Abstract 1 Introduction 2
Purpose and scope 2Description of study area 2
Geohydrologic setting 3 Spring characteristics 3 Aquifer tests 10
Hydrologic conditions at time of aquifer tests 10Lower spring 12Upper spring 15Discussion of test results 16
Summary and conclusions 17 Selected references 18
ILLUSTRATIONS
Figure 1. Map showing location of study area and data-collection sites 42. Hydrograph showing water level in the lower spring, and daily
precipitation at the National Weather Service monitoring station in Athens, December 1988-March 1989 5
3. Diagram of the lower spring reservoir 74. Diagram of the upper spring reservoir 85. Graph showing precipitation departure from normal at the National
Weather Service monitoring station at Athens, Clarke County, 1979-88, and monthly mean water levels at well 19HH12, Madison County, 1983-88 11
6. Drawdown and recovery curves for the lower (A) and upper (B) springs, December 5-8, 1988 13
7. Semilogarithmic plot of drawdown in the lower spring at a pumping rate of 94 gallons per minute 14
TABLE
Table 1. Water-quality analyses for the upper and lower springs, Social Circle, Georgia, May 16, 1988 9
111
CONVERSION FACTORS
Factors for converting inch-pound units published herein to metric (International System) units are as follows:
Multiply inch-pound unit By To obtain metric unit
inch (in.)
foot (ft)
mile (mi)
Length
25.4
0.3048
1.609
millimeter (mm)
meter (m)
kilometer (km)
square mile (mi2)
Area
2.590 square kilometer (km2)
gal (gal)
Volume
3.785 liter (L)
gallon per minute (gal/min)
gallon per day (gal/d)
Flow
0.06309
0.003785
liter per second (L/s)
cubic meter per day (nrVd)
Sea level
In this report "sea level" refers to the National Geodetic Vertical Datum of 1929 (NGVD of 1929)--a geodetic datum derived from a general adjustment of the first-order level nets of both the United States and Canada, formerly called Sea Level Datum of 1929.
IV

GEOHYDROLOGIC EVALUATION OF SPRING SITES
AT SOCIAL CIRCLE, GEORGIA
DECEMBER 5 - 8,1988
By John S. Clarke
ABSTRACT
Two springs in the Piedmont physiographic province at Social Circle, Georgia, were evaluated to determine their geohydrologic characteristics, estimated recharge, and maximum sustained yield. Aquifer tests indicate that the springs respond to pumping in a manner similar to bored wells in the Piedmont.
At the lower spring, a pronounced water-level response to rainfall indicates that it is under water-table conditions. Recharge to the water table is believed to be limited to a 0.18 square mile drainage basin upgradient of the lower spring. The small drainage area and an estimated annual recharge rate of 6.5 inches indicates that the potential yield to the springs averages about 55,690 gallons per day.
The 13-foot deep lower spring was the most productive; it sustained yields of between 60 and 94 gallons per minute during much of a 25-hour aquifer test. Sluggish recovery during the last 11 percent of drawdown may indicate (1) a water-level decline due to below normal rainfall, (2) that pumping from the upper spring intercepted recharge to the lower spring, or (3) that some water was removed from ground-water storage during the aquifer tests. The 21-foot deep upper spring was pumped at rates ranging from 34 to 83 gallons per minute, and was able to sustain yields of 34 to 40 gallons per minute during a 25-hour aquifer test. At a rate of 34 gallons per minute, drawdown in the spring reservoir stabilized at about 62 percent of the available drawdown, which was probably close to the maximum sustained yield.
Although results of the two tests indicate that the combined yield of the two springs ranged from about 135,360 to 184,320 gallons per day in December 1988, it is doubtful that a combined pumping rate in excess of the estimated average potential yield of the drainage basin (55,690 gallons per day) could be maintained on an annual basis. An intermittent pumping schedule allows for pumping at a higher rate at peak demand periods and at lower rates during periods of low demand.

INTRODUCTION
Water supplies in the Piedmont physiographic province (fig. 1) of northern Georgia are obtained from surface-water reservoirs and streams, springs, and supply wells. Droughts of recent years (1981, 1986, and 1988) have resulted in water-supply problems such as low streamflow and spring discharge, low reservoir levels, declining well yields, dry wells, and deterioration of streamwater quality. These problems have caused concern over the adequacy of existing water supplies to meet future needs. Until recently, there was little information available on the capability of springs to sustain and supply large yields in the Piedmont physiographic province of Georgia.
Two springs in the town of Social Circle, Walton County, Ga., are being considered by the county as sources of water for a public water-supply system. Important considerations in determining the adequacy of a water supply are the amount of recharge available to supply wells and springs, and the maximum pumping rate that a well or spring can sustain (maximum sustained yield) without drawing the water level below the pump intake. Determination of the maximum sustained yield is based on the available drawdown, which is the amount of water-level decline that a well or a spring can sustain without breaking pump suction.
The U.S. Geological Survey, in cooperation with Walton County, conducted a study to evaluate the geohydrologic setting, recharge, and maximum sustained yield of two springs at Social Circle, Ga. As part of this study, the U.S. Geological Survey conducted short-term (25-hour) aquifer tests in each of the springs during December 5-8, 1988. Data collected during this study can be used to determine whether springs in the Piedmont physiographic province are capable of supplying and sustaining large yields.
Purpose and Scope
The purpose of this report is to describe the geohydrologic setting, the estimated recharge, and the results of aquifer tests of two springs in the Piedmont physiographic province of Georgia. Data collected during this study include an inventory of site characteristics such as determination of drainage area and geologic characteristics, and the collection and analysis of data from two aquifer tests performed during December 5-8, 1988.
Description of Study Area
The study area is entirely within the town of Social Circle in the southern tip of Walton County (fig. 1). Social Circle is on the drainage divide between the Ocmulgee and Oconee River basins, and the two springs are in the headwaters of the Little River, which is a tributary of the Oconee River.
GEOHYDROLOGIC SETTING
Social Circle lies entirely in the Piedmont physiographic province of Georgia (fig. 1). The area is underlain by a complex of metamorphosed plutonic, volcanic, and sedimentary rocks. Radtke and others (1986) grouped the rocks underlying the Social Circle area into a single unit (unit A),which generally consists of amphibolite interlayered with muscovite-biotite schist and a variety of biotite gneisses.
Ground water in the Social Circle area occurs in the regolith and in joints, fractures, bedding planes, or other secondary openings in the bedrock. Regolith is the unconsolidated material that is present nearly everywhere as a layer on top of the bedrock, that is composed of soil, saprolite, and stream alluvium. Saprolite is clay-rich, residual material derived from in-place weathering of the bedrock. The largest volume of ground water in the Piedmont is stored in the regolith, which replenishes or recharges the openings in the bedrock. The amount of water available to wells or springs depends on the thickness and character of the regolith, the volume, and the degree of connection between secondary openings in the bedrock, and the amount of available recharge.
Ground-water levels in the Piedmont are affected mainly by precipitation and evapotranspiration. During 1941-70, average annual precipitation in the Social Circle area was about 48 in/yr and overland runoff was about 14 to 16 in/yr (Carter and Stiles, 1983). Statewide, Carter and Stiles (1983) estimated about 12 percent, or 6 in/yr of annual precipitation goes to recharge the ground-water flow system. In the Piedmont physiographic province, ground-water recharge rates were estimated for the upper Flint River basin at Culloden, which is about 70 mi southwest of the study area (fig. 1). According to G.C. Mayer (U.S. Geological Survey, oral commun., 1988), ground-water recharge rates in that area, as estimated by the Rorabaugh-Daniel method (Daniel, 1976) of hydrograph separation, range from 4.7 in/yr during an average dry year (1941) to 8.8 in/yr during an average wet year (1949), an average of 6.5 in/yr.
SPRING CHARACTERISTICS
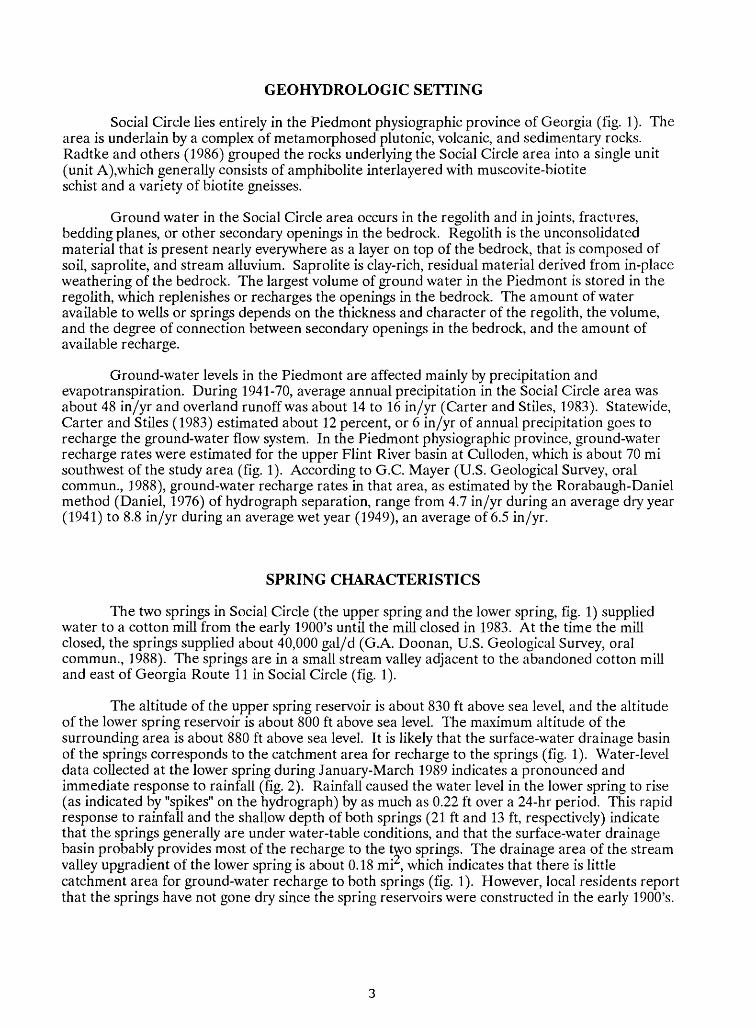
The two springs in Social Circle (the upper spring and the lower spring, fig. 1) supplied water to a cotton mill from the early 1900's until the mill closed in 1983. At the time the mill closed, the springs supplied about 40,000 gal/d (G.A. Doonan, U.S. Geological Survey, oral commun., 1988). The springs are in a small stream valley adjacent to the abandoned cotton mill and east of Georgia Route 11 in Social Circle (fig. 1).
The altitude of the upper spring reservoir is about 830 ft above sea level, and the altitude of the lower spring reservoir is about 800 ft above sea level. The maximum altitude of the surrounding area is about 880 ft above sea level. It is likely that the surface-water drainage basin of the springs corresponds to the catchment area for recharge to the springs (fig. 1). Water-level data collected at the lower spring during January-March 1989 indicates a pronounced and immediate response to rainfall (fig. 2). Rainfall caused the water level in the lower spring to rise (as indicated by "spikes" on the hydrograph) by as much as 0.22 ft over a 24-hr period. This rapid response to rainfall and the shallow depth of both springs (21 ft and 13 ft, respectively) indicate that the springs generally are under water-table conditions, and that the surface-water drainage basin probably provides most of the recharge to the two springs. The drainage area of the stream valley upgradient of the lower spring is about 0.18 mi , which indicates that there is little catchment area for ground-water recharge to both springs (fig. 1). However, local residents report that the springs have not gone dry since the spring reservoirs were constructed in the early 1900's.

Figure 1 EXPLANATION
0 10 20 30 40 50 MILESh >, ,J-rL J
0 1020 30 40 50 KILOMETERS
83° 43'30"33° 40'
33° 39' -
Base from U.S. Geological Survey Social Circle 1:24,000, 1971
1 MILE
1 KILOMETER
STUDY AREA
Figure 1 .--Location of study area and data-collection sites.

LUO< 4.4
CCD C/)
9 4.5
LU CO
4.6
LU
B! 4.7
LU>LU_lCC LU
48
4.9
5.0DECEMBER
1988
JANUARY FEBRUARY
1989
MARCH
Figure 2.--Water level in the lower spring and daily precipitation at National Weather Service monitoringstation at Athens, December 1988-March 1989.
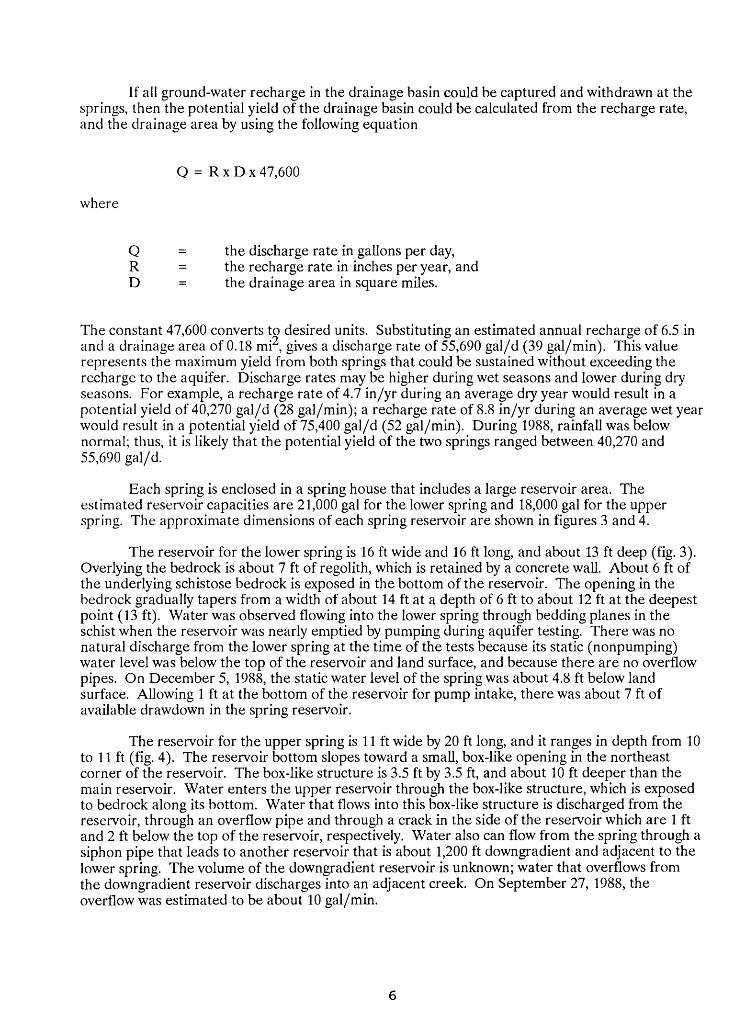
If all ground-water recharge in the drainage basin could be captured and withdrawn at the springs, then the potential yield of the drainage basin could be calculated from the recharge rate, and the drainage area by using the following equation
O = RxDx47,600
where
Q = the discharge rate in gallons per day,R = the recharge rate in inches per year, andD = the drainage area in square miles.
The constant 47,600 converts to desired units. Substituting an estimated annual recharge of 6.5 in and a drainage area of 0.18 mi , gives a discharge rate of 55,690 gal/d (39 gal/min). This value represents the maximum yield from both springs that could be sustained without exceeding the recharge to the aquifer. Discharge rates may be higher during wet seasons and lower during dry seasons. For example, a recharge rate of 4.7 in/yr during an average dry year would result in a potential yield of 40,270 gal/d (28 gal/min); a recharge rate of 8.8 in/yr during an average wet year would result in a potential yield of 75,400 gal/d (52 gal/min). During 1988, rainfall was below normal; thus, it is likely that the potential yield of the two springs ranged between 40,270 and 55,690 gal/d.
Each spring is enclosed in a spring house that includes a large reservoir area. The estimated reservoir capacities are 21,000 gal for the lower spring and 18,000 gal for the upper spring. The approximate dimensions of each spring reservoir are shown in figures 3 and 4.
The reservoir for the lower spring is 16 ft wide and 16 ft long, and about 13 ft deep (fig. 3). Overlying the bedrock is about 7 ft of regolith, which is retained by a concrete wall. About 6 ft of the underlying schistose bedrock is exposed in the bottom of the reservoir. The opening in the bedrock gradually tapers from a width of about 14 ft at a depth of 6 ft to about 12 ft at the deepest point (13 ft). Water was observed flowing into the lower spring through bedding planes in the schist when the reservoir was nearly emptied by pumping during aquifer testing. There was no natural discharge from the lower spring at the time of the tests because its static (nonpumping) water level was below the top of the reservoir and land surface, and because there are no overflow pipes. On December 5, 1988, the static water level of the spring was about 4.8 ft below land surface. Allowing 1 ft at the bottom of the reservoir for pump intake, there was about 7 ft of available drawdown in the spring reservoir.
The reservoir for the upper spring is 11 ft wide by 20 ft long, and it ranges in depth from 10 to 11 ft (fig. 4). The reservoir bottom slopes toward a small, box-like opening in the northeast corner of the reservoir. The box-like structure is 3.5 ft by 3.5 ft, and about 10 ft deeper than the main reservoir. Water enters the upper reservoir through the box-like structure, which is exposed to bedrock along its bottom. Water that flows into this box-like structure is discharged from the reservoir, through an overflow pipe and through a crack in the side of the reservoir which are 1 ft and 2 ft below the top of the reservoir, respectively. Water also can flow from the spring through a siphon pipe that leads to another reservoir that is about 1,200 ft downgradient and adjacent to the lower spring. The volume of the downgradient reservoir is unknown; water that overflows from the downgradient reservoir discharges into an adjacent creek. On September 27, 1988, the overflow was estimated to be about 10 gal/min.
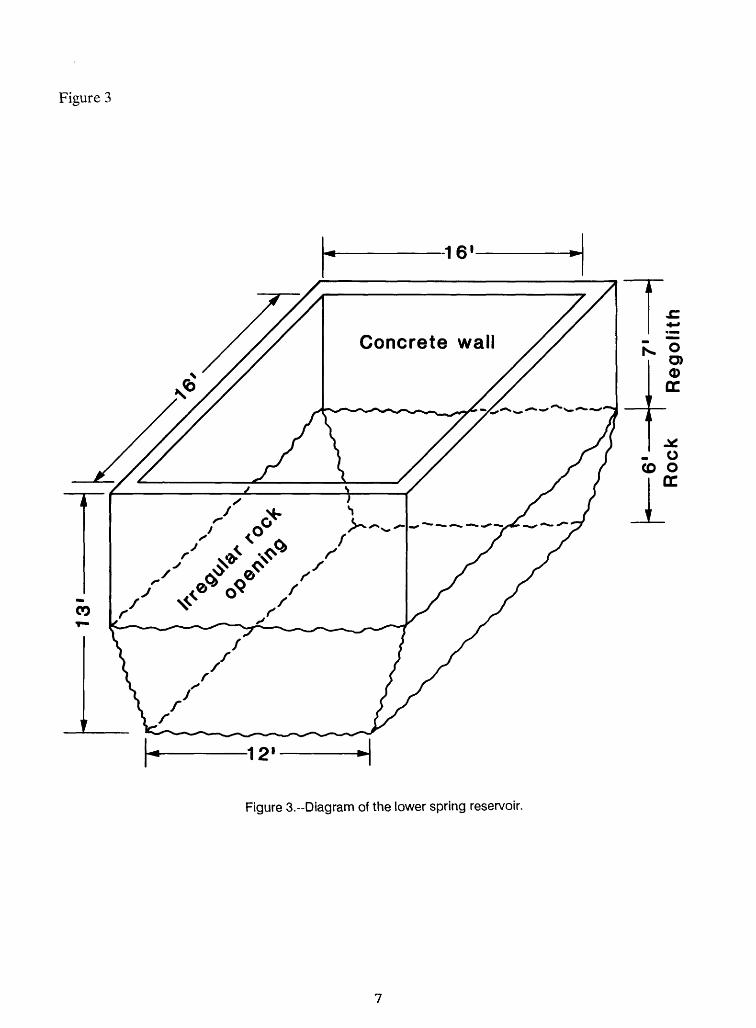
Figure 3
Concrete wall
Figure 3.-Diagram of the lower spring reservoir.

Figure 4
"Box-like"structure
Reservoir
Rock ^3.5'-^
Figure 4.--Diagram of the upper spring reservior.

Prior to the December testing by the U.S. Geological Survey, flow through the siphon from the upper spring was shut off. On December 6, 1988, the discharge from the upper spring through the crack in the side of the reservoir was measured at 12 gal/min. After this discharge measurement, the crack was sealed and the water level was allowed to rise. Later that day, the water level had risen about 1 ft and the spring was discharging through the overflow pipe. The static water level could not be measured owing to the low height of the reservoir. By using the level of the overflow pipe as an upper limit (1 ft below top of reservoir) and allowing 1 ft at the bottom of the box-like structure for the pump intake, the maximum available drawdown in the spring reservoir was about 19 ft during the aquifer test.
The quality of water from each spring was tested by the Georgia Environmental Protection Division in May 1988, and was found to be suitable for most uses (table 1). Constituent concentrations in water from each spring were within State and Federal drinking water standards (Georgia Department of Natural Resources, 1977; U.S. Environmental Protection Agency, 1986a; 1986b). In addition, water samples analyzed for coliform bacteria in June 1988 by the Georgia Department of Agriculture were found to meet drinking water standards (none were detected).
A program to monitor the quality of water withdrawn from the springs would be desirable because of the spring's susceptibility to potential contamination from land-surface sources. A spill of toxic chemicals along the railroad line, which is located immediately upgradient of the stream valley, or elsewhere in the vicinity of the springs potentially could contaminate the springs.
Table l.--Water-quality analyses for the upper and lower springs, Social Circle, Georgia, May 16,1988
[Analyses by Georgia Environmental Protection Division. Unit: mg/L, milligrams per liter; <, less than; Mg/L, micrograms per liter]
Constituent (unit)
Fluoride (mg/L)Chloride (mg/L)Sulfate (mg/L)Sodium (mg/L)Nitrate + Nitrite (mg/L)Dissolved solids (mg/L)Arsenic (Mg/L)Barium (Mg/L)Cadmium (Mg/L)Chromium (Mg/L)Lead (Mg/L)Selenium (Mg/L)Silver (/ig/L)Iron (Mg/L)Manganese (Mg/L)Copper (Mg/L)Zinc (Mg/L)
Concentration
Upper spring
0.12713.8124.3
116<25
74<5.0
<25<25<5.0
<25<50
28<50<50
Lower spring
<0.112<2.0
5.02.6
48<25
65<5.0
<25<25<5.0
<251204050
<50
AQUIFER TESTS
Aquifer tests of the two springs were conducted during December 5-8, 1988. It was assumed that the springs would respond to pumping as do bored wells that have been tested in the Piedmont. Therefore, the springs were treated as if they were large-diameter wells and step- drawdown tests of spring productivity were conducted.
It is important to note that yields from the two springs can vary seasonally, and that the tests reflect the climatic and hydrologic conditions at the time of the tests (December 1988). In the Piedmont province, yields generally are lower during dry periods, such as the recent drought during summer 1988. Other conditions, such as interference from nearby pumped wells or the diversion of surface drainage and subsequent loss of recharge may lower the maximum sustained yield of a well or a spring. Continuously monitoring the water level in a pumped well or spring allows for the determination of whether the available drawdown is being depleted, and it provides the data needed to make adjustments to the pumping rate or the pumping schedule to maintain the optimum yield and water level.
Continuous water-level recorders were installed at each spring, and were monitored for several days prior to the tests to determine whether interferences were present that might affect water levels. Turlington and others (1987, p. 98) reported no major ground-water users in the Social Circle area, so pumping effects were not anticipated. No interferences were observed during the pumping period or during a 3-month period following the tests (fig. 2).
During pumping of each spring, water levels were monitored in the other spring reservoir to determine if the two were hydraulically connected. No connection was observed between the springs, although this may be owing to the tests being too short in duration for effects of interference to be observed. Because of the proximity of the two springs in the relatively small drainage basin, some hydraulic connection and drawdown interference might reasonably be expected during extended periods of pumping. If the springs are hydraulically connected, the effects of drawdown interference would be greatest when both springs are pumped at the same time. Water pumped from each spring was discharged downgradient of the spring into the intermittent stream running through the valley. Hourly discharge rates were estimated by using a 5-gal bucket and a stopwatch. Pumping rates were monitored continuously because the discharge rate decreased as water levels in the spring reservoir decreased. The pumping rate was adjusted, as necessary, by throttling the pump motor.
Hydrologic Conditions at Time of Aquifer Tests
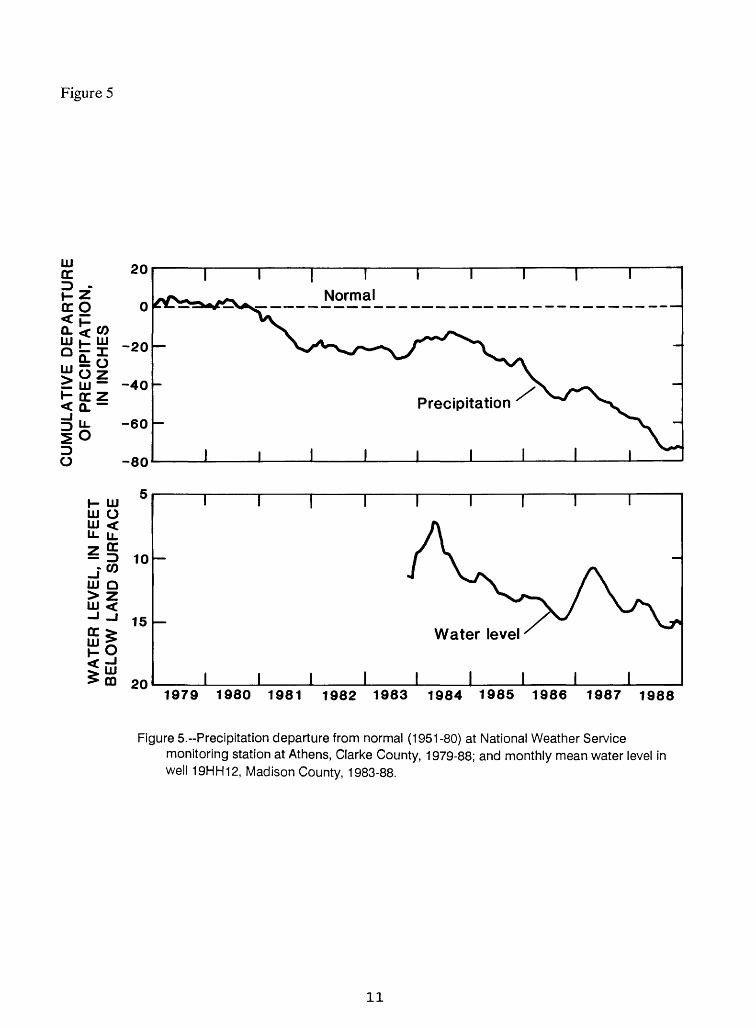
Aquifer tests of the springs at Social Circle were conducted in December 1988, near the end of a very dry year in Georgia. On the basis of rainfall records for the National Weather Service station at Athens, about 30 mi northeast of Social Circle, the rainfall deficit at the time of the tests was about 15 in. for 1988, and about 75 in. for the period 1979-88 (fig. 5). Rainfall was deficient throughout most of 1988 although monthly rainfall totals for September and November were slightly above normal.
10
H
H
31
ca'
I
3 ^
2L o
01 g
-J
CO
O
"0
s §
^0
) 5"
O'
Q.
U
^</
>"
Q)
Q.
o B
3.
O
CD
Fc
u
=;U
CO
CD
*<
O -
Li o
£
S! 3
oo
O g
oo
o
3C
0
)u
~~
CD
-
00 3
§O
0
)
v<
CD
1 I
s I"
3
CO
CD
O"
WA
TE
R L
EV
EL
, IN
FE
ET
B
ELO
W L
AN
D S
UR
FA
CE
CU
MU
LA
TIV
E D
EP
AR
TU
RE
OF
PR
EC
IPIT
AT
ION
,IN
IN
CH
ES
o>
Lft
ro
oi 00 o
I o>
oI ro
oro
o
CD 03 10 CD
00
00

Although there were no long-term ground-water-level monitoring wells in the Social Circle area prior to the December 1988 aquifer tests, records are available for well 19HH12 (fig. 5) in western Madison County, about 40 mi northeast of Social Circle (fig. 1). Ground-water levels in the 185-ft-deep well generally are highest in the spring and lowest in the fall. With the exception of a rise during late 1986 to early 1987, the water level in the well generally declined during 1984-88, which corresponded to a period of below normal rainfall. The annual water-level fluctuation in well 19HH12 ranged from 2 to 5 ft during the same period. In December 1988, the water level in well 19HH12 was slightly higher than the water level recorded in September 1988. It is likely that water-level fluctuations and trends in the Social Circle area prior to and during the time that the aquifer tests were performed, were similar to those in well 19HH12.
Streamflows in the Piedmont generally were below normal during 1988. The Flint River at the gage near Culloden, about 70 mi southwest of Social Circle, is representative of streams in the central part of the State (fig. 1). Streamflows were below normal during much of 1988, and were near the previous minimum for the season during the last several days of December 1988.
Lower Spring Test
The first aquifer test was conducted on the lower spring from December 5-7, 1988 (fig. 6). A centrifugal pump was installed on the spring and the spring was pumped at rates ranging from 60 to 160 gal/min.
The lower spring initially was pumped at about 160 gal/min for 5 min, but then the pump was turned off because of a mechanical problem. During the first 5 min of pumping, the water level declined about 0.42 ft. The pump remained off for an hour, during which time the water level recovered 0.27 ft. The pump then was restarted (65 min into the test) and the spring was pumped at a rate of 120 gal/min for about 115 min. At the end of that time (185 min into test), the drawdown was about 4.4 ft, which was about 63 percent of the 7 ft of available drawdown. Because the rate of drawdown at this point was considered excessive, the pumping rate was reduced to about 60 gal/min. The water level began to recover immediately at this pumping rate, and within 60 min (240 min into test) it seemed to stabilize at 8.8 ft below land surface (4.0 ft of drawdown, 57 percent of total available drawdown). The pumping rate was then increased to 94 gal/min. The water level again began to decline, but at a much slower rate than previously. At 420 min into the test, the water level declined an additional 1.2 ft, making the drawdown 5.2 ft or 74 percent of the available drawdown. The rate of decline continued to decrease, and at 1,460 min into the test, the water level was 11.2 ft below land surface, making the drawdown 6.4 ft or 91 percent of the available drawdown. At this point, the water level continued to decline slowly. A semilog arithmic plot of the rate of drawdown at this point indicated that the 7 ft of available drawdown might have been reached about 3,500 min into the test (fig. 7). When pumping was discontinued at 1,460 min, the water level in the spring began to recover immediately (fig. 6).
12

Figure 6
200 400 600 800
LU O< 10ccID CO
LU CO
LJJ LJJ
12
TIME, IN MINUTES
1,000 1,200 1,400 1,600 1,800 2,000 2,200 2,400 2,600
RECOVERY-
Pump off Available drawdown is 7 feet
LJJ LJJ
O4 Q
ICCQ
12 14 16 18 20 22 24
DECEMBERS
8 10 12 14 16 18 20 22 24
DECEMBERS
TIME, IN HOURS.
2 4 6 8 10
DECEMBER?
12
200 400 600 800
TIME, IN MINUTES
1,000 1,200 1,400 1,600 1,800 2,000 2,200 2,400 2,600
Top of "box-like" structure
44 gal/min
Available drawdown is 19 feet
12 14 16 18 20 22 24 DECEMBERS
8 10 12 14 16 18 20 22 24 DECEMBER 7
TIME, IN HOURS
2 4 6 8 10 DECEMBERS
12
Figure 6.--Drawdown and recovery curves for the lower (A) and upper (B) springs, December 5-8, 1988.
13

Figure 7
tuLJU LL
ocQ
7.25
T I I I I I I
Maximum available drawdown
i i i i i i100 1,000
TIME, IN MINUTES
10,000
Figure 7.--Semilogarithmic plot of drawdown in the lower spring at a pumping rate of 94 gallons per minute.
14
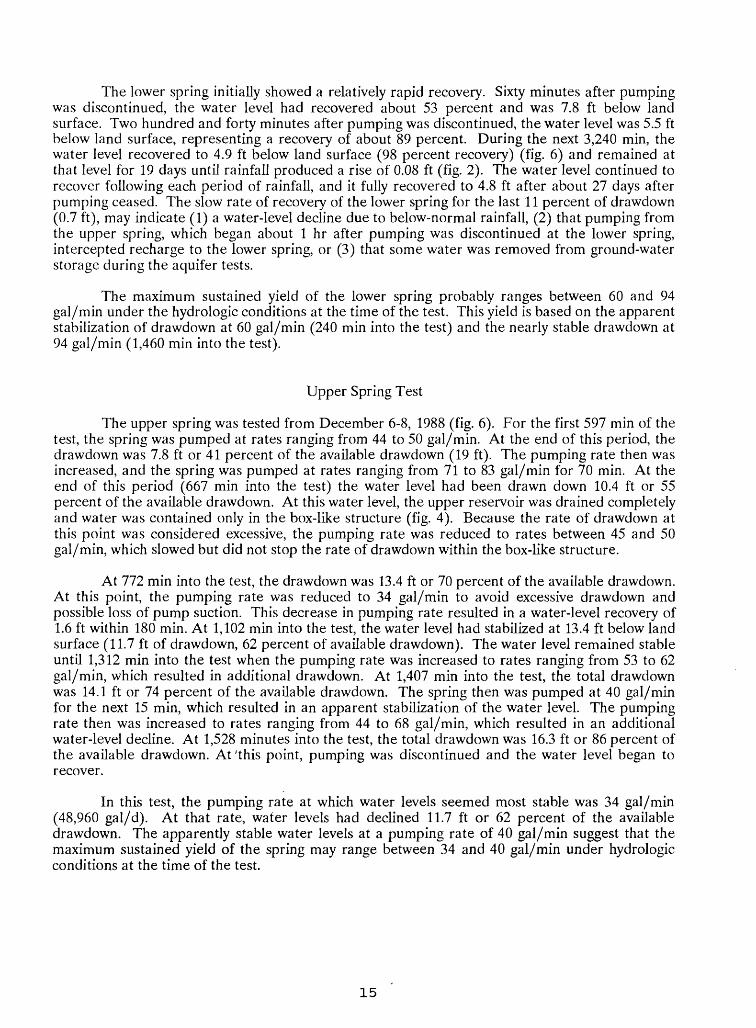
The lower spring initially showed a relatively rapid recovery. Sixty minutes after pumping was discontinued, the water level had recovered about 53 percent and was 7.8 ft below land surface. Two hundred and forty minutes after pumping was discontinued, the water level was 5.5 ft below land surface, representing a recovery of about 89 percent. During the next 3,240 min, the water level recovered to 4.9 ft below land surface (98 percent recovery) (fig. 6) and remained at that level for 19 days until rainfall produced a rise of 0.08 ft (fig. 2). The water level continued to recover following each period of rainfall, and it fully recovered to 4.8 ft after about 27 days after pumping ceased. The slow rate of recovery of the lower spring for the last 11 percent of drawdown (0.7 ft), may indicate (1) a water-level decline due to below-normal rainfall, (2) that pumping from the upper spring, which began about 1 hr after pumping was discontinued at the lower spring, intercepted recharge to the lower spring, or (3) that some water was removed from ground-water storage during the aquifer tests.
The maximum sustained yield of the lower spring probably ranges between 60 and 94 gal/min under the hydrologic conditions at the time of the test. This yield is based on the apparent stabilization of drawdown at 60 gal/min (240 min into the test) and the nearly stable drawdown at 94 gal/min (1,460 min into the test).
Upper Spring Test
The upper spring was tested from December 6-8, 1988 (fig. 6). For the first 597 min of the test, the spring was pumped at rates ranging from 44 to 50 gal/min. At the end of this period, the drawdown was 7.8 ft or 41 percent of the available drawdown (19 ft). The pumping rate then was increased, and the spring was pumped at rates ranging from 71 to 83 gal/min for 70 min. At the end of this period (667 min into the test) the water level had been drawn down 10.4 ft or 55 percent of the available drawdown. At this water level, the upper reservoir was drained completely and water was contained only in the box-like structure (fig. 4). Because the rate of drawdown at this point was considered excessive, the pumping rate was reduced to rates between 45 and 50 gal/min, which slowed but did not stop the rate of drawdown within the box-like structure.
At 772 min into the test, the drawdown was 13.4 ft or 70 percent of the available drawdown. At this point, the pumping rate was reduced to 34 gal/min to avoid excessive drawdown and possible loss of pump suction. This decrease in pumping rate resulted in a water-level recovery of 1.6 ft within 180 min. At 1,102 min into the test, the water level had stabilized at 13.4 ft below land surface (11.7 ft of drawdown, 62 percent of available drawdown). The water level remained stable until 1,312 min into the test when the pumping rate was increased to rates ranging from 53 to 62 gal/min, which resulted in additional drawdown. At 1,407 min into the test, the total drawdown was 14.1 ft or 74 percent of the available drawdown. The spring then was pumped at 40 gal/min for the next 15 min, which resulted in an apparent stabilization of the water level. The pumping rate then was increased to rates ranging from 44 to 68 gal/min, which resulted in an additional water-level decline. At 1,528 minutes into the test, the total drawdown was 16.3 ft or 86 percent of the available drawdown. At 'this point, pumping was discontinued and the water level began to recover.
In this test, the pumping rate at which water levels seemed most stable was 34 gal/min (48,960 gal/d). At that rate, water levels had declined 11.7 ft or 62 percent of the available drawdown. The apparently stable water levels at a pumping rate of 40 gal/min suggest that the maximum sustained yield of the spring may range between 34 and 40 gal/min under hydrologic conditions at the time of the test.
15
The rate of water-level recovery in the upper spring was slower than that in the lower spring. Within the first 60 min, the water level recovered 46 percent to 10.4 ft below land surface. Within 240 min, the spring recovered 64 percent to 7.9 ft below land surface. The water level in the spring fully recovered within 1,140 min, and water began to flow out the overflow pipe. The change in the slope of the recovery graph at 11 ft in figure 6 is due to the water level rising out of the box-like structure and into the larger reservoir. Because the initial starting static water level of the upper spring is unknown, it is not known if any depletion of ground-water storage occurred as a result of the aquifer test.
Discussion of Test Results
The results of the two short-term aquifer tests indicate that drawdown from sustained pumping rates of 60 to 94 gal/min (86,400 to 135,360 gal/d) at the lower spring and 34 gal/min (48,960 gal/d) at the upper spring would not have exceeded the available drawdown during the December 1988 aquifer tests. However, the two springs were not pumped at the same time, and the extent of long-term interference that might be experienced if both springs were pumped at the same time is unknown. Also, it is possible that the durations of the tests were insufficient for the water levels to fully stabilize.
For these reasons, it is doubtful that a combined pumping rate in excess of the estimated average recharge to the basin (55,690 gal/d) could be sustained for long periods of time. An intermittent pumping schedule would allow for pumping at a higher rate at peak demand periods, and at lower rates during periods of low demand. For example, if the combined pumping rate for both springs was 100 gal/min, then pumping both springs for 9 hrs would yield 54,000 gal, which is near the estimated recharge of the basin.
Continuous monitoring of water levels during production would reveal whether the above- mentioned sustained yields over-stress the springs during dry seasons, and whether the pumping rates should be adjusted. It is possible that higher yields could be obtained from the springs during the wet season, which usually is late winter and early spring.
16

SUMMARY AND CONCLUSIONS
Two short term pumping tests indicate that there is a substantial difference in the water* bearing capabilities of the two springs at Social Circle, Ga. The two springs responded to pumping in a manner similar to bored wells that are common in the Piedmont physiographic province.
The 13-ft-deep lower spring was pumped at rates ranging from 60 to 160 gal/min, and was able to stabilize drawdown at pumping rates ranging 60 to 94 gal/min. The maximum drawdown during the 25-hr test was about 91 percent of the 7 ft of available drawdown. Following pump shutdown, the lower spring initially showed a rapid recovery, and was 89 percent recovered within the first 240 min. Sluggish recovery for the last 11 percent of the drawdown may indicate (1) a water-level decline due to below-normal rainfall, (2) that pumping from the upper spring intercepted recharge to the lower spring, or (3) that some water was removed from ground-water storage during the aquifer tests.
The 21-ft-deep upper spring was pumped at rates ranging from 34 to 83 gal/rnin, and was able to stabilize drawdown at rates ranging from 34 to 40 gal/min. The maximum drawdown during the 25-hr test was about 86 percent of the 19 ft of available drawdown. Following pump shutdown, the upper spring showed a slower recovery than the lower spring. Within the first 240 min, the water level had recovered 64 percent, and within 1,140 min it was fully recovered. Because the actual starting static water level of the upper spring was unknown, it is not known if there was any depletion of ground-water storage as a result of the aquifer test.
Water-level records for the lower spring indicate that it shows a pronounced response to rainfall, and therefore is under water-table conditions. Recharge to the water table upgradient of the lower spring is believed to be limited to a 0.18 mi drainage basin. The estimated ground- water recharge in the Piedmont physiographic province based on records from the Flint River at Culloden, ranges from 4.7 in/yr during an average dry year (1941) to 8.8 in/yr during an average wet year (1949), and averages 6.5 in/yr. The potential yield of the spring's drainage basin was calculated from the estimated recharge rates and from the drainage area. Because rainfall during 1988 largely was below normal, it is likely that the potential yield of the drainage basin ranged between 40,270 and 55,690 gal/d.
17

SELECTED REFERENCES
Carter, R.F., and Stiles, H.R., 1983, Average annual rainfall and runoff in Georgia, 1941-70: Georgia Geologic Survey Hydrologic Atlas 9, 1 sheet.
Clarke, J.S., Longsworth, S.A., Joiner, C.N., Peck, M.F., McFadden, K.W., and Milby, B.J.,1987, Ground-water data for Georgia, 1986: U.S. Geological Survey Open-File Report 87-376, 177 p.
Cressler, C.W., Thurmond, C.J., and Hester, W.G., 1983, Ground water in the greater Atlanta region, Georgia: Georgia Geologic Survey Information Circular 63,144 p.
Daniel, J.F., 1976, Estimating ground-water evapotranspiration from streamflow records: Water Resources Research, v. 12, no. 3, p. 360-364.
Ferris, D.B., Knowles, R.H., and Stallman, R.W., 1962, Theory of aquifer tests, ground-water hydraulics: U.S. Geological Survey Water-Supply Paper 1536-E, 171 p.
Georgia Department of Natural Resources, 1977, Rules for safe drinking water: Atlanta: Environmental Protection Division, Chapter 391-3-5, p. 601-657.
Heath, R.C., 1983, Basic ground-water hydrology: U.S. Geological Survey Water-Supply Paper 2220, 84 p.
LeGrand, H. E., 1967, Ground water of the Piedmont and Blue Ridge provinces in the southeastern states: U.S. Geological Survey Circular 538, lip.
Lohman, S.W., 1972, Ground-water hydraulics: U.S. Geological Survey Professional Paper 708, 70 p.
Radtke, D.B., Cressler, C.W., Perlman, H.A., Blanchard, H.E., McFadden, K.W., and Brooks, Rebekah, 1986, Occurrence and availability of ground water in the Athens region, northeastern Georgia: U.S. Geological Survey Water-Resources Investigations Report 86-4075, 79 p.
Turlington, M.C., Fanning, J.L., and Doonan, G.A., 1987, Water use in Georgia by county for 1985: Georgia Geologic Survey Information Circular 81, 109 p.
U.S. Environmental Protection Agency, 1986a, Maximum contaminant levels (subpart B of part 141, National interim primary drinking-water regulations): U.S. Code of Federal Regulations, Title 40, Parts 100 to 149, revised July 1, 1986, p. 524-528.
1986b, Maximum contaminant levels (section 143.3 of part 143, National secondarydrinking-water regulations): U.S. Code of Federal Regulations, Title 40, Parts 100 to 149, revised July 1, 1986, p. 587-590.
18