ground penetrating radar survey at the hasty-fowler · pdf fileground penetrating radar survey...
TRANSCRIPT
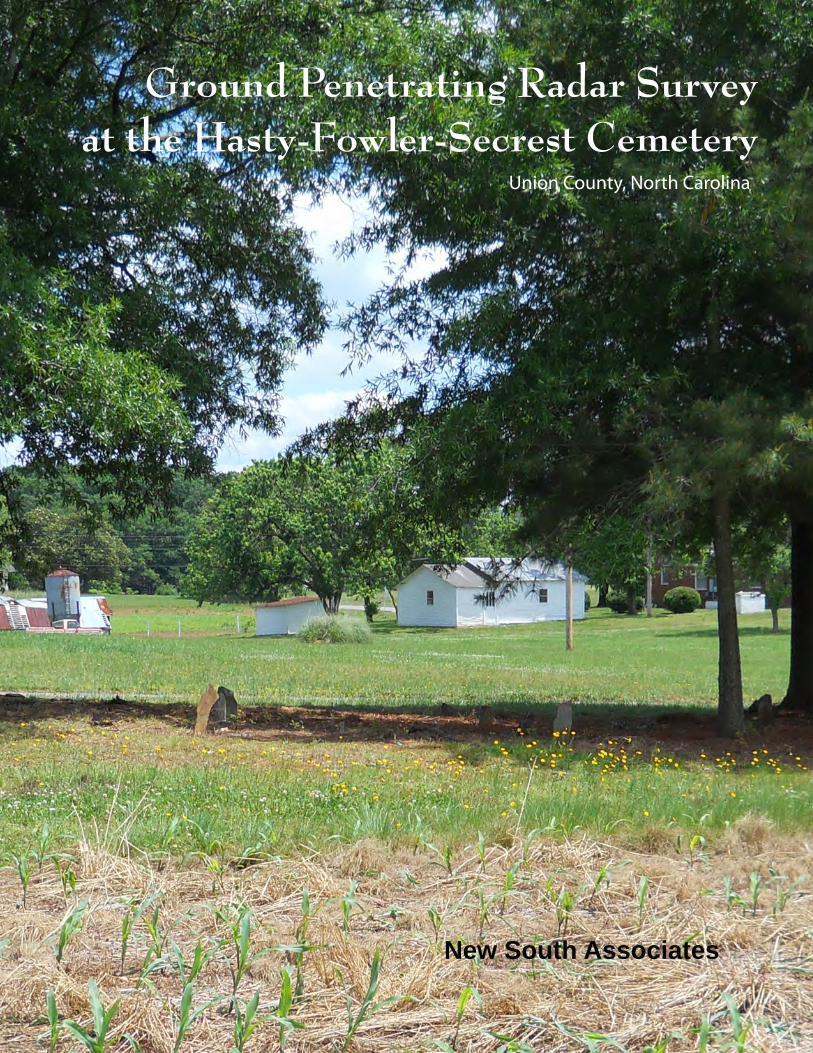
Ground Penetrating Radar Surveyat the Hasty-Fowler-Secrest Cemetery
Union County, North Carolina
New South Associates


Ground Penetrating Radar Survey at the Hasty-Fowler-Secrest Cemetery (31UN351**)
Union County, North Carolina
TIP #R-3329 WBS # 34533.1.TA1
Report submitted to: North Carolina Department of Transportation, Human Environment Section • 1598 Mail Service
Center • Raleigh, North Carolina 27699-1598
Report prepared by: New South Associates • 6150 East Ponce de Leon Avenue • Stone Mountain, Georgia 30083
and New South Associates • 408B Blandwood Avenue • Greensboro, North Carolina 27401
Christopher T. Espenshade, M.A., RPA Principal Investigator
Shawn M. Patch, M.A., RPA Geophysical Specialist and Author
April 24, 2013 • Final Report New South Associates Technical Report 2162


GROUND PENETRATING RADAR SURVEY AT THE HASTY-FOWLER-SECREST CEMETERY
i
ABSTRACT
New South Associates conducted an intensive ground penetrating radar (GPR) survey at
the Hasty-Fowler-Secrest Cemetery in Union County, North Carolina. The survey was conducted
for the North Carolina Turnpike Authority (NCTA) and North Carolina Department of
Transportation (NCDOT) in support of environmental studies for the proposed US 74 Bypass
Extension. The survey covered approximately 1.4 acres.
Results indicate at least 19 anomalies consistent with the expected signature for historic-
era graves. The anomalies occur in three areas. Two of the anomalies spatially correlate with
existing grave markers and the remaining 17 have no surface expression. In addition, there are
four marked graves without a geophysical anomaly. New South Associates recommends that the
23 anomalies be treated as potential human graves and investigated through additional work. If
the anomalies near the existing house are verified as human graves, it will be appropriate to
examine the area beneath the house once the structure has been removed.
ii
ACKNOWLEDGMENTS
Multiple individuals contributed to the successful completion of this project. First and
foremost, we wish to acknowledge the cooperation and assistance of Ron and Kathy Fowler, the
current property owners, for granting access and sharing information about the area. We express
our sincere gratitude to the Fowlers and appreciate their help.
At New South Associates, David Diener and Diana Valk prepared the maps and other
graphics and Jennifer Wilson edited the report.
GROUND PENETRATING RADAR SURVEY AT THE HASTY-FOWLER-SECREST CEMETERY
iii
TABLE OF CONTENTS
ABSTRACT ..................................................................................................................................... i ACKNOWLEDGMENTS .............................................................................................................. ii TABLE OF CONTENTS ............................................................................................................... iii LIST OF FIGURES ........................................................................................................................ v LIST OF TABLES ......................................................................................................................... vi
I. INTRODUCTION ...................................................................................................................... 1
II. ENVIRONMENT ....................................................................................................................... 5SOILS .......................................................................................................................................... 5 CURRENT SETTING ................................................................................................................. 5
III. PREVIOUS WORK .................................................................................................................. 7
IV. METHODS ............................................................................................................................... 9MAPPING ................................................................................................................................... 9 MARKER INVENTORY ............................................................................................................ 9 GROUND PENETRATING RADAR (GPR) ........................................................................... 10 FIELD METHODS .................................................................................................................... 13 DATA PROCESSING ............................................................................................................... 14 GPR IN CEMETERIES ............................................................................................................ 15
V. RESULTS AND RECOMMENDATIONS ............................................................................. 17 EXISTING GRAVE MARKERS .............................................................................................. 17 GROUND PENETRATING RADAR ....................................................................................... 25 POSSIBLE GRAVES (N=19) ................................................................................................... 28
Cluster 1 (Extant Markers) ..................................................................................................... 29 Cluster 2 ................................................................................................................................. 29 Single Outlier ......................................................................................................................... 37
NON-MORTUARY FEATURES ............................................................................................. 37 Utilities (N=8) ........................................................................................................................ 37 Driveway (N=3) ..................................................................................................................... 42 Building Elements (N=7) ....................................................................................................... 42 Agricultural Field ................................................................................................................... 42 Root Systems (N=5) ............................................................................................................... 42 Unknown (N=4) ..................................................................................................................... 43
DISCUSSION ............................................................................................................................ 43 RECOMMENDATIONS .......................................................................................................... 45
REFERENCES CITED ................................................................................................................. 47
APPENDIX A: GPR AMPLITUDE SLICE MAPS


GROUND PENETRATING RADAR SURVEY AT THE HASTY-FOWLER-SECREST CEMETERY
v
LIST OF FIGURES
Figure 1. Map Showing Location of GPR Survey in Union County, North Carolina .................. 2 Figure 2. Photographs of the Current Setting ............................................................................... 6 Figure 3. Map Showing Locations of GPR Survey Grids and Other Surface Features .............. 11 Figure 4. Map Showing Location and Detail of Existing Grave Markers .................................. 18 Figure 5. Photograph Showing Arrangement of Existing Grave Markers, Looking West ......... 19 Figure 6. Photographs of Graves 1-3 .......................................................................................... 20 Figure 7. Photographs of Graves 4-6 .......................................................................................... 21 Figure 8. Photographs of Three Markers with Inscriptions ........................................................ 22 Figure 9. Photograph of Marker Number 3, Loose and Leaning ................................................ 23 Figure 10. Photographs Showing Piles of Fieldstone at Bases of Trees ....................................... 24 Figure 11. Map Showing Distribution of All GPR Anomalies ..................................................... 27 Figure 12. Plan View Detail of GPR Anomalies in the Southwest Portion of the Survey Area .. 30 Figure 13. GPR Profiles for Anomalies 20-22 .............................................................................. 31 Figure 14. GPR Profile for Anomalies 15 and 18 ......................................................................... 32 Figure 15. GPR Profile for Anomaly 19 ....................................................................................... 33 Figure 16. GPR Profiles for Anomalies 12 and 13 ....................................................................... 34 Figure 17. GPR Profile for Anomalies 16 and 17 ......................................................................... 35 Figure 18. Map Showing Possible GPR Graves in Cluster 2 ....................................................... 36 Figure 19. GPR Profiles for Anomalies 24, 25, and 29 in Cluster 2 ............................................ 38 Figure 20. Map Showing Possible Grave in Cluster 3 .................................................................. 39 Figure 21. GPR Profile for Anomaly 23 ....................................................................................... 40 Figure 22. GPR Profile Showing Septic System Features ............................................................ 41 Figure 23. GPR Profiles of Selected Unknown Features .............................................................. 44

vi
LIST OF TABLES
Table 1. Summary Data for GPR Survey Grids ............................................................................ 14 Table 2. Summary of GPR Anomalies by Depth with Interpretation ........................................... 25 Table 3. GPR Interpretations by Depth Below Surface ................................................................ 28
GROUND PENETRATING RADAR SURVEY AT THE HASTY-FOWLER-SECREST CEMETERY
1
I. INTRODUCTION
New South Associates conducted an intensive ground-penetrating radar (GPR) survey at
the Hasty-Fowler-Secrest Cemetery (31UN351**) in Union County, North Carolina (Figure 1).
The survey was conducted for the North Carolina Turnpike Authority (NCTA) and North
Carolina Department of Transportation (NCDOT) in support of environmental studies for the
proposed US 74 Bypass Extension.
The proposed cross-section of the US 74 Connector is a four-lane divided facility with a
46-foot wide grass median, a shoulder section within a 350-foot right-of-way (ROW). The
proposed project begins at the existing interchange between I-485 and the current US 74. The
current US 74 will be widened at the starting point before swinging northward onto new location,
then turning eastward until it terminates beyond US 601 at the proposed junction with the
Monroe Bypass. The Hasty-Fowler-Secrest Cemetery was discovered during the archaeological
survey, and falls within the proposed ROW.
The Scope of Work (SOW) for this project outlined the general research goals and
objectives with an emphasis on revisiting the cemetery and further documenting the number of
potential burials located within the proposed project’s area of potential effects (APE) and to
record any extant markers for analysis and interpretation of the cemetery. The method for
achieving these goals employed GPR. All fieldwork was completed in accordance with the
SOW. Fieldwork was conducted from May 7-10, 2012 by Shawn Patch and Danny Gregory.
All GPR data processing was performed by Shawn Patch and Sarah Lowry.
Results indicate 19 anomalies consistent with the expectations for historic-era graves are
present in the APE. These anomalies are located in three areas: one cluster around the existing
markers, a second cluster in the front yard of the house, and the third is a single outlier in the rear
yard. Two of the anomalies correlate with existing grave markers. In addition, there are four
marked graves without a geophysical anomaly. New South Associates recommends that the 23
anomalies be treated as potential human graves and investigated through additional work. In
addition, if excavation verifies that the near-house anomalies are human graves, then the area
beneath the house should be examined for possible graves after the structure has been carefully
removed.

Figure 1. Map Showing Location of GPR Survey in Union County, North Carolina
GPR Survey Area
0 350 700 Feet
0 100 200 Meters
$
Source: Bing Maps Aerial (2010)
2

GROUND PENETRATING RADAR SURVEY AT THE HASTY-FOWLER-SECREST CEMETERY
3
The remainder of this report includes a brief overview of the local environment in
Chapter II, Chapter III is a discussion of previous work, Chapter IV is a description of methods,
Chapter V contains results and recommendations, and is followed by the References Cited. GPR
amplitude slice maps are included in the Appendix A.

GROUND PENETRATING RADAR SURVEY AT THE HASTY-FOWLER-SECREST CEMETERY
5
II. ENVIRONMENT
SOILS
The project area is Piedmont Physiographic Province. Soils in the project area are
classified as Badin channery silty clay loam, 2-8 percent slopes, moderately eroded. This type is
found on interfluves and is well drained. Parent material is residuum from metavolcanics and/or
argillite. Depth to bedrock varies from 20-40 inches. A typical profile consists of silty clay
loam (0-6 in.), silty clay (6-20 in.), channery silty clay loam (20-28 in.), weathered bedrock (28-
42 in.), and unweathered bedrock (42-80 in.).
These soils are considered acceptable for geophysical prospection with GPR.
CURRENT SETTING
The project area is in a rural setting and is characterized by an agricultural field, a
modern residence built circa 1991, manicured lawn, gravel driveway, and a large wooded area on
the north side (Figure 2). Historically the area was primarily under cultivation.
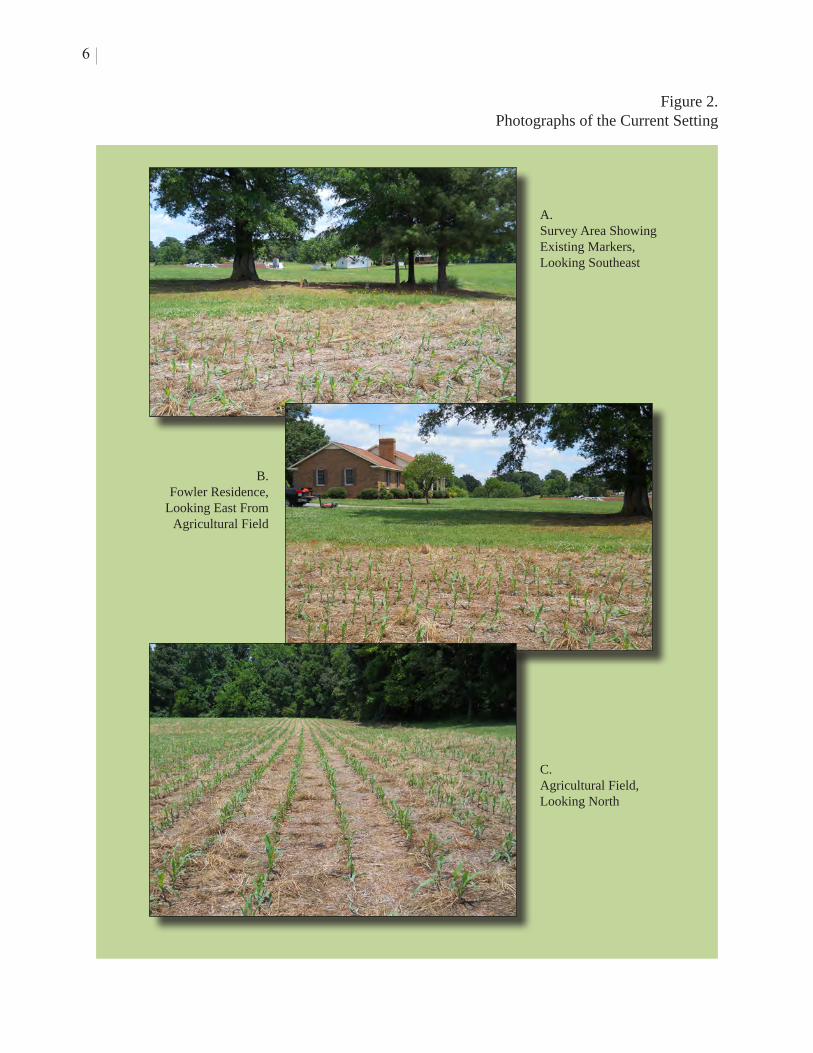
Figure 2. Photographs of the Current Setting
6
A.Survey Area Showing Existing Markers, Looking Southeast
B.Fowler Residence,
Looking East From Agricultural Field
C.Agricultural Field, Looking North
GROUND PENETRATING RADAR SURVEY AT THE HASTY-FOWLER-SECREST CEMETERY
7
III. PREVIOUS WORK
The Hasty-Fowler-Secrest Cemetery is identified as site 31UN351** (Gregory et al.
2009). Initially, the site was recorded during the archaeological survey of the proposed highway
improvements. Fieldstone grave markers were noted, and the landowners reported these as the
Hasty-Fowler-Secrest Cemetery.
Subsequent work at the site included archival research (e.g., deeds, genealogy) and a
penetrometer survey to identify possible unmarked graves. Conflicting accounts were noted
regarding the number of grave markers and whether or not they had been moved from a previous
location. Archival research yielded information that reported the cemetery was impacted from
house construction and the grave markers were moved.
Initial identification efforts were based on the presence of broken grave markers and
fieldstone scattered among a small stand of mature trees (Figure 2). Cemeteries in rural, upland
environments typically exhibit at least a few of the following patterns or traits: human-sized
rectangular/oval depressions or mounds, formal grave markers (wood, stone, or metal),
fieldstone markers arranged as headstones and footstones, ornamental ground cover (vinca,
narcissus, cedar, hemlock, and other flowers), enclosures to restrict land use (stone walls, iron
fences, vegetation), materials placed on the ground to outline a grave (stone, glass, wood, metal,
etc.), low oval or rectangular piles of stones, maintained areas with evidence of clearing or
vegetation removal, and human-sized ground discolorations.
Field survey identified standing fieldstone markers arranged in rows and paired to
represent the head and foot positions, as well as piles of loose fieldstone scattered on the surface.
These were all clustered in the tree area south and west of the Fowler residence. Additional
fieldstone was noted behind (north) the Fowler residence, but this area is densely wooded and
there was no indication that these served as grave markers.
Additional field efforts involved the use of a soil penetrometer to measure compaction
and identify potential unmarked graves. Transects were spaced at 50 centimeters and sampling
occurred at 50 centimeter intervals. Results indicated 12 subsurface anomalies that were
consistent with expectations for human graves. Recommendations included additional work such
as GPR and/or machine-assisted stripping to expose potential grave features.

GROUND PENETRATING RADAR SURVEY AT THE HASTY-FOWLER-SECREST CEMETERY
9
IV. METHODS
MAPPING
Field mapping was conducted with a Nikon DTM-32 total station and TDS Recon data
collector. A primary map station was established in the northwest portion of the study area.
Coordinates (540506E, 3877061N, UTM Zone 17, NAD83) for this point were then collected
with a Trimble GeoXT global positioning system (GPS). These coordinates were entered into
the data collector so the total station data could be incorporated into the GIS.
All grave markers, GPR grid corners, and other major surface features such as trees, the
Fowler house and driveway, and obstructions were recorded. Grave markers were identified
with four points, one on each corner, to provide the maximum degree of accuracy and each was
assigned a unique number in the field. The associated number for each grave feature was then
displayed on subsequent maps prepared for the inventory phase.
All total station data were imported in ArcGIS for map production. Individual shapefiles
were then created for each feature class (e.g., grave marker, tree, house). These data were used
in the production of a detailed map that was overlaid with other spatial data (e.g., aerial imagery,
topography).
MARKER INVENTORY
Each marker within the project area was inventoried and examined. In all cases, the
markers were of local fieldstone with little to no additional modification. This limited the
number and types of attributes that could be recorded. Each marker was given a unique
inventory number. The 12 markers are arranged in pairs with a headstone and footstone, which
leaves the appearance of six graves. Two of the markers contained epitaphs that were largely
illegible, although the name “Hasty” was identified in both cases. Epitaphs on these markers are
on the western face. Complete dates could not be determined, although they appeared to be from
the 1860s. Many of the markers have been broken or damaged and have missing fragments. In
addition, several rocks were recorded piled at the bases of two trees. Because they were not in
primary context it was impossible to determine whether or not they were displaced grave
markers or naturally occurring stone.
10
GROUND PENETRATING RADAR (GPR)
The GPR survey covered an area that measured approximately 1.4 acres in size (262 x
246 feet) (Figure 3). As proposed in our Work Plan, the survey area was defined to capture the
potential cemetery as identified by Gregory et al. (2009). This included the small stand of trees
with existing markers, all areas around the Fowler residence, portions of an agricultural field,
and as much ground as possible up to the heavily wooded area on the north side. Archival
research reported by Gregory et al. (2009) indicated up to 51 markers on the landform now
occupied by the Fowler residence.
GPR is a remote sensing technique frequently used by archaeologists to investigate a
wide range of research questions. In archaeological applications, GPR is used to prospect for
potential subsurface features. Because GPR is a remote sensing technique, it is non-invasive,
non-destructive, relatively quick and efficient, and highly accurate when used in appropriate
situations. In cemeteries, GPR is commonly used to identify anomalies consistent with the
expectations for human graves, without ground disturbance (Jones 2008; King et al. 1993).
The use of GPR for identifying potential historic graves is based on the concept of
contrast, which may include differences in physical, electrical, or chemical properties between an
object or feature and its surrounding matrix (Conyers 2006). For graves, the body itself is
generally not detected; it is typically the coffin or casket, burial shaft, or bottom of the grave that
causes the reflection (Jones 2008; King et al. 1993). Not surprisingly, greater contrast generally
equates to better detection and resolution. For example, a metal casket in a concrete vault is
much easier to see with GPR than a body buried in a wooden coffin only. In certain cases, it is
also possible to detect buried markers or other associated grave features that were once present
on the surface (Patch 2007).
GPR data are acquired by transmitting pulses of radar energy into the ground from a
surface antenna, reflecting the energy off buried objects, features, or bedding contacts, and then
detecting the reflected waves back at the ground surface with a receiving antenna (Conyers
2004a:1). When collecting radar reflection data, surface radar antennas are moved along the
ground in transects, typically within a surveyed grid, and a large number of subsurface
reflections are collected along each line. As radar energy moves through various materials, the
velocity of the waves will change depending on the physical and chemical properties of the
material through which they are traveling (Conyers and Lucius 1996). The greater the contrast in
electrical and magnetic properties between two materials at an interface, the stronger the
reflected signal, and, therefore, the greater the amplitude of reflected waves (Conyers 2004a).
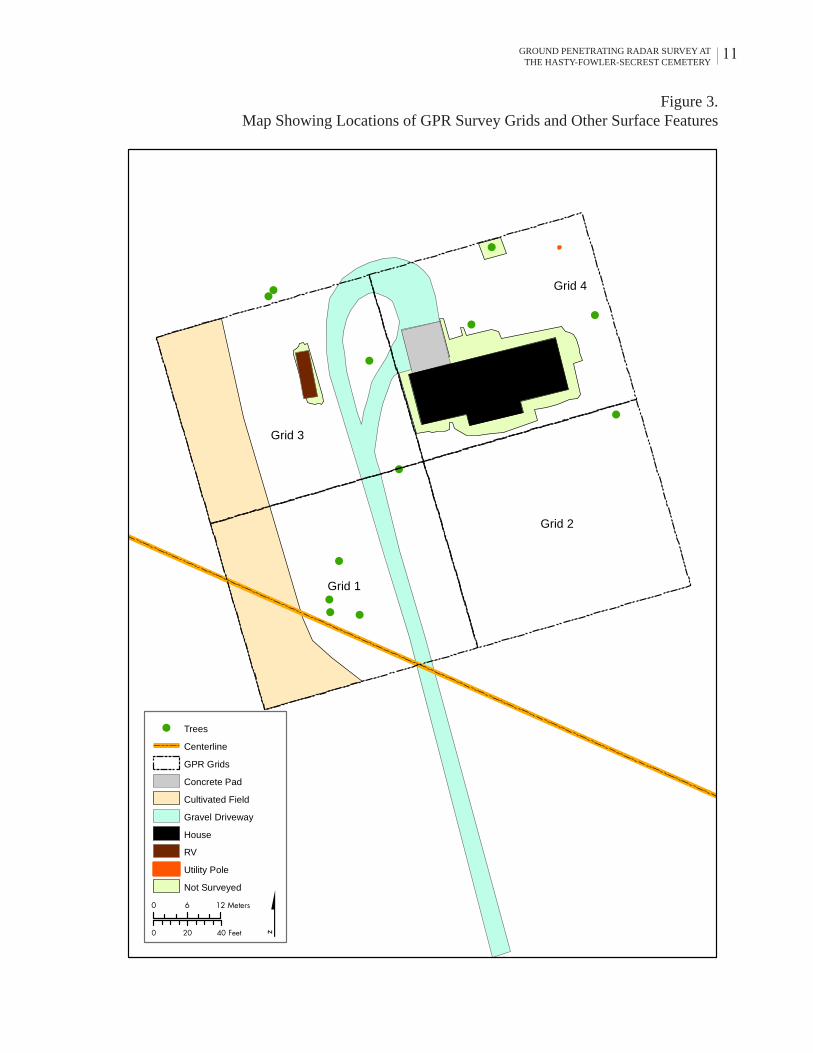
Figure 3. Map Showing Locations of GPR Survey Grids and Other Surface Features
!
! !
!
!
!
!
!
!!
!
!
Grid 4
Grid 2
Grid 1
Grid 3
0 20 40 Feet
0 6 12 Meters $
! Trees
Centerline
GPR Grids
Concrete Pad
Cultivated Field
Gravel Driveway
House
RV
Utility Pole
Not Surveyed
11GROUND PENETRATING RADAR SURVEY AT THE HASTY-FOWLER-SECREST CEMETERY
12
When travel times of energy pulses are measured, and their velocity through the ground is
known, distance (or depth in the ground) can be accurately measured (Conyers and Lucius 1996).
Each time a radar pulse traverses a material with a different composition or water saturation, the
velocity will change and a portion of the radar energy will reflect back to the surface and be
recorded. The remaining energy will continue to pass into the ground to be further reflected,
until it finally dissipates with depth.
The depths to which radar energy can penetrate, and the amount of resolution that can be
expected in the subsurface, are partially controlled by the frequency (and therefore the
wavelength) of the radar energy transmitted (Conyers 2004a). Standard GPR antennas propagate
radar energy that varies in frequency from about 10 megahertz (MHz) to 1000 MHz. Low
frequency antennas (10-120 MHz) generate long wavelength radar energy that can penetrate up
to 50 meters in certain conditions but are capable of resolving only very large buried features. In
contrast, the maximum depth of penetration of a 900 MHz antenna is about one meter or less in
typical materials, but its generated reflections can resolve features with a maximum dimension of
a few centimeters. A trade-off therefore exists between depth of penetration and subsurface
resolution.
The success of GPR surveys in archaeology is largely dependent on soil and sediment
mineralogy, clay content, ground moisture, depth of buried features, and surface topography and
vegetation. Electrically conductive or highly magnetic materials will quickly attenuate radar
energy and prevent its transmission to depth. Depth penetration varies considerably depending
on local conditions. Clay can be challenging for GPR because it has a low relative dielectric
permittivity (RDP). In practical applications, this generally results in shallower than normal
depth penetration because the radar signal is absorbed (attenuated) by the clay regardless of
antenna frequency (Conyers 2004a).
The basic configuration for a GPR survey consists of an antenna (with both a transmitter
and receiver), a harness or cart, and a wheel for calibrating distance. The operator then pulls or
pushes the antenna across the ground surface systematically (a grid) collecting data along a
transect. These data are then stored by the receiver and available for later processing.
The “time window” within which data were gathered was 30 nanoseconds (ns). This is
the time during which the system is “listening” for returning reflections from within the ground.
The greater the time window, the deeper the system can potentially record reflections. To
convert time in nanoseconds to depth, it is necessary to determine the elapsed time it takes the
radar energy to be transmitted, reflected, and recorded back at the surface by doing a velocity
test. Hyperbolas were found on reflection profiles and measured to yield a relative dielectric
GROUND PENETRATING RADAR SURVEY AT THE HASTY-FOWLER-SECREST CEMETERY
13
permittivity (RDP), which is a way to calculate velocity. The shape of hyperbolas generated in
programs is a function of the speed at which energy moves in the ground, and can therefore be
used to calculate velocity (Conyers and Lucius 1996). The RDP for soils in the survey area was
approximately eight, which, when converted to one-way travel time, (the time it takes the energy
to reach a reflection source), is approximately 10 centimeters/nanosecond. All profiles and
processed maps were converted from time in nanoseconds (ns) to depth in centimeters using this
average velocity.
FIELD METHODS
The first step was to calibrate the antenna to local conditions by walking the survey area
and adjusting the instrument’s gain settings. This method allows the user to get an average set of
readings based on subtle changes in the RDP (Conyers 2004a). Field calibration was repeated as
necessary to account for changes in soil and/or moisture conditions (Conyers 2004b). Effective
depth penetration was approximately 1.2 meters. Slight signal attenuation (degradation) was
noted in the field, which was due to the presence of clay soils. However, signal attenuation was
not severe enough to limit detection of graves.
The field survey was conducted using a GSSI SIR-3000 using two antennae of different
frequencies over the entire area. Transect spacing with the 400MHz antenna was 50 centimeters
and with the 900MHz was 25 centimeters. The closer transect spacing with the 900MHz antenna
provided a very dense and high resolution dataset. All transects were oriented north-south to
intercept the presumed long axis of potential graves at right angles. Signal attenuation was
observed with both antennae at approximately 25 nanoseconds (+/- 3 feet). This was likely
caused by shallow bedrock and dense clay soils. However, overall data quality and resolution
are good. The purpose of both antennae and increased sampling density was to provide the
maximum amount of data on the distribution and extent of potential burials. In short, this
approach ensured that every possible advantage of GPR was used to its fullest extent.
In order to effectively collect and process GPR data, it is necessary to establish a formal
grid. For this project, grid layout was accomplished with a total station, metric tapes, and
surveyor’s chaining pins. The survey area was subdivided into smaller grids to facilitate data
collection and limit file sizes from becoming too large (Table 1). Total survey area was
approximately 1.4 acres, but because it was covered twice it was the equivalent of 2.8 acres.
14
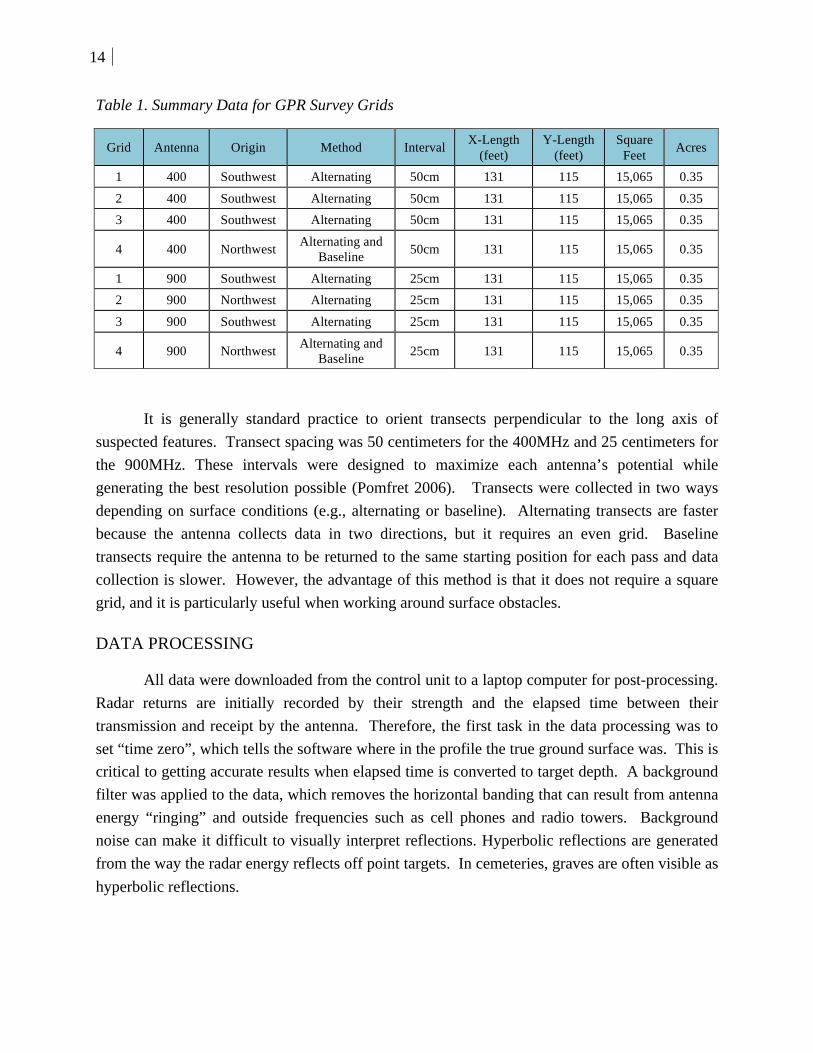
Table 1. Summary Data for GPR Survey Grids
Grid Antenna Origin Method Interval X-Length
(feet) Y-Length
(feet) Square
Feet Acres
1 400 Southwest Alternating 50cm 131 115 15,065 0.35
2 400 Southwest Alternating 50cm 131 115 15,065 0.35
3 400 Southwest Alternating 50cm 131 115 15,065 0.35
4 400 Northwest Alternating and
Baseline 50cm 131 115 15,065 0.35
1 900 Southwest Alternating 25cm 131 115 15,065 0.35
2 900 Northwest Alternating 25cm 131 115 15,065 0.35
3 900 Southwest Alternating 25cm 131 115 15,065 0.35
4 900 Northwest Alternating and
Baseline 25cm 131 115 15,065 0.35
It is generally standard practice to orient transects perpendicular to the long axis of
suspected features. Transect spacing was 50 centimeters for the 400MHz and 25 centimeters for
the 900MHz. These intervals were designed to maximize each antenna’s potential while
generating the best resolution possible (Pomfret 2006). Transects were collected in two ways
depending on surface conditions (e.g., alternating or baseline). Alternating transects are faster
because the antenna collects data in two directions, but it requires an even grid. Baseline
transects require the antenna to be returned to the same starting position for each pass and data
collection is slower. However, the advantage of this method is that it does not require a square
grid, and it is particularly useful when working around surface obstacles.
DATA PROCESSING
All data were downloaded from the control unit to a laptop computer for post-processing.
Radar returns are initially recorded by their strength and the elapsed time between their
transmission and receipt by the antenna. Therefore, the first task in the data processing was to
set “time zero”, which tells the software where in the profile the true ground surface was. This is
critical to getting accurate results when elapsed time is converted to target depth. A background
filter was applied to the data, which removes the horizontal banding that can result from antenna
energy “ringing” and outside frequencies such as cell phones and radio towers. Background
noise can make it difficult to visually interpret reflections. Hyperbolic reflections are generated
from the way the radar energy reflects off point targets. In cemeteries, graves are often visible as
hyperbolic reflections.
GROUND PENETRATING RADAR SURVEY AT THE HASTY-FOWLER-SECREST CEMETERY
15
The next data processing step involved the generation of amplitude slice-maps (Conyers 2004a). Amplitude slice-maps are a three-dimensional tool for viewing differences in reflected amplitudes across a given surface at various depths (see Appendix A). Reflected radar amplitudes are of interest because they measure the degree of physical and chemical differences in the buried materials. Strong, or high amplitude reflections often indicate denser (or different) buried materials. Such reflections can be generated at pockets of air, such as within collapsed graves, or from slumping sediments. Amplitude slice-maps are generated through comparison of reflected amplitudes between the reflections recorded in vertical profiles. In this method, amplitude variations, recorded as digital values, are analyzed at each location in a grid of many profiles where there is a reflection recorded. The amplitudes of all reflection traces are compared to the amplitudes of all nearby traces along each profile. This database can then be “sliced” horizontally and displayed to show the variation in reflection amplitudes at a sequence of depths in the ground. The result is a map that shows amplitudes in plan view, but also with depth.
Slicing of the data was done using the mapping program Surfer 8. Slice maps are a series of x,y,z values, with x (east) and y (north) representing the horizontal location on the surface within each grid and z representing the amplitude of the reflected waves. All data were interpolated using the Inverse Distance Weighted method and then image maps were generated from the resulting files.
From the original .dzt files (raw reflection data), a series of image files was created for cross-referencing to the amplitude slice maps that were produced. Two-dimensional reflection profiles were also analyzed to determine the nature of the features identified on the amplitude slice maps. The reflection profiles show the geometry of the reflections, which can lend insight into whether the radar energy is reflecting from a flat layer (seen as a distinct band on profile) or a single object (seen as a hyperbola in profile). Individual profile analysis was used in conjunction with amplitude slice maps to provide stronger interpretations about possible graves.
The final step in the data processing is to integrate the depth slices with other spatial data. This was done using ArcGIS 9.3, which can display and manipulate all forms of spatial data created for this project, including GPR results, GPS data, and base graphics such as aerial photography and topographic maps. The resulting anomalies were digitized as individual features and referenced to the UTM Zone 17, NAD83 coordinate system.
GPR IN CEMETERIES
Several factors influence the overall effectiveness of GPR for detecting human graves.
Soil conditions are the most important, with clay being the most difficult to penetrate. Its high
conductivity causes the radar signal to attenuate much quicker, which in turn limits its overall
depth and strength.

16
Age of the graves is also critical, with older graves being more difficult to detect because
they have had more time to decompose and are less likely to have intact coffins or caskets (if
they were present to begin with).
Burial “container,” or what the physical remains may have been placed in, is also
important, and includes simple linen or cloth shrouds, pine boxes or wooden coffins, lead or
other metal caskets, and burial vaults (Trinkley and Hacker 2009). In certain cases, hardware
such as nails, hinges, and handles may be present, but not necessarily all the time. Although
there is a high degree of variation in specific types among different geographical regions, each of
these tends to have been used at certain times throughout history and correlates with the
presumed age of the grave. For example, burial shrouds were common throughout the
seventeenth and early eighteenth centuries before being replaced by wooden coffins. It must also
be noted that cultural trends and patterns tended to persist longer in rural and/or economically
depressed areas much longer than urban centers.
GROUND PENETRATING RADAR SURVEY AT THE HASTY-FOWLER-SECREST CEMETERY
17
V. RESULTS AND RECOMMENDATIONS
EXISTING GRAVE MARKERS
Twelve grave markers of local fieldstone are present in a cluster of trees in the southwest corner of the survey area (Figure 4). These are the same markers discussed by Gregory et al. (2009). The markers are arranged in two rows with three graves each (Figures 5-7). Each set of stones forms one pair, with a corresponding headstone and footstone (Figure 5). They are oriented approximately east-west, which is consistent with patterns noted in most Judeo-Christian cemeteries.
Markers 1, 2, and 4 have inscriptions on their west sides that vary considerably in terms of legibility (Figure 8). For example, the inscription on marker 1 was completely illegible except for the fragment of a date. Only the “18” could be discerned. Marker 2 had an inscription that was arranged with text on three lines:
C HAST(illegible)
NOV
1867
Marker 4 had an inscription with text on two lines:
J HASTY
18(illegible)
Conditions for all extant markers were overwhelmingly poor. Almost all show at least minimal evidence of weathering (e.g., flaking surfaces, nicked corners). Headstone markers 2 and 4, both of which are inscribed, were also broken in multiple pieces. Several of the markers are loosely buried in the ground and as a result are leaning or in danger or falling (Figure 9). In these cases very little of the marker is actually buried in the ground and it suggests that they may have been moved or reset.
Several additional fragments of fieldstone were noted at the bases of two of the mature trees (Figure 10). It is unclear what their original context might have been and whether or not they served as actual grave markers or simply represent fieldstone that was collected opportunistically. Inspection of these did not identify any pieces or fragments that could be refit
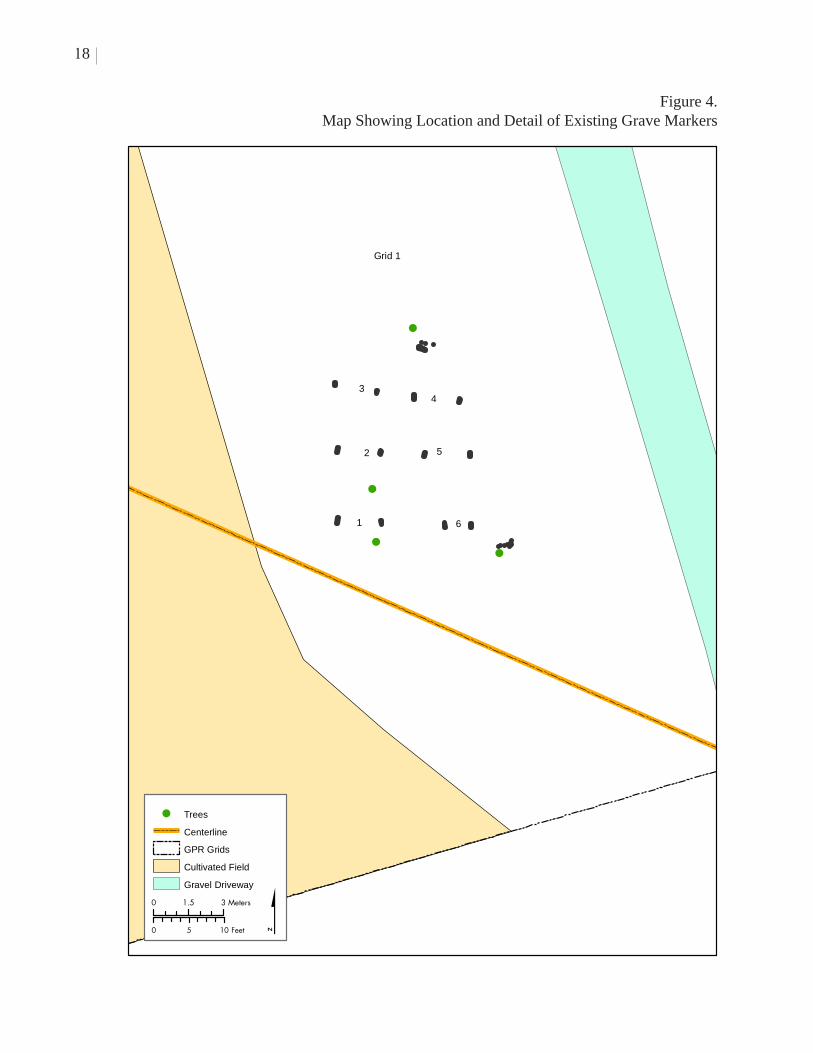
Figure 4.Map Showing Location and Detail of Existing Grave Markers
!
!!
!
!
!
!
!
!
!
!
!
6
5
1
2
34
Grid 1
0 5 10 Feet
0 1.5 3 Meters $
! Trees
Centerline
GPR Grids
Cultivated Field
Gravel Driveway
18

Figu
re 5
.Ph
otog
raph
Sho
win
g A
rran
gem
ent o
f E
xist
ing
Gra
ve M
arke
rs, L
ooki
ng W
est
19GROUND PENETRATING RADAR SURVEY AT THE HASTY-FOWLER-SECREST CEMETERY

Figure 6.Photographs of Graves 1-3
20
A.Markers for Grave 1
B.Markers for Grave 2
C.Markers for Grave 3
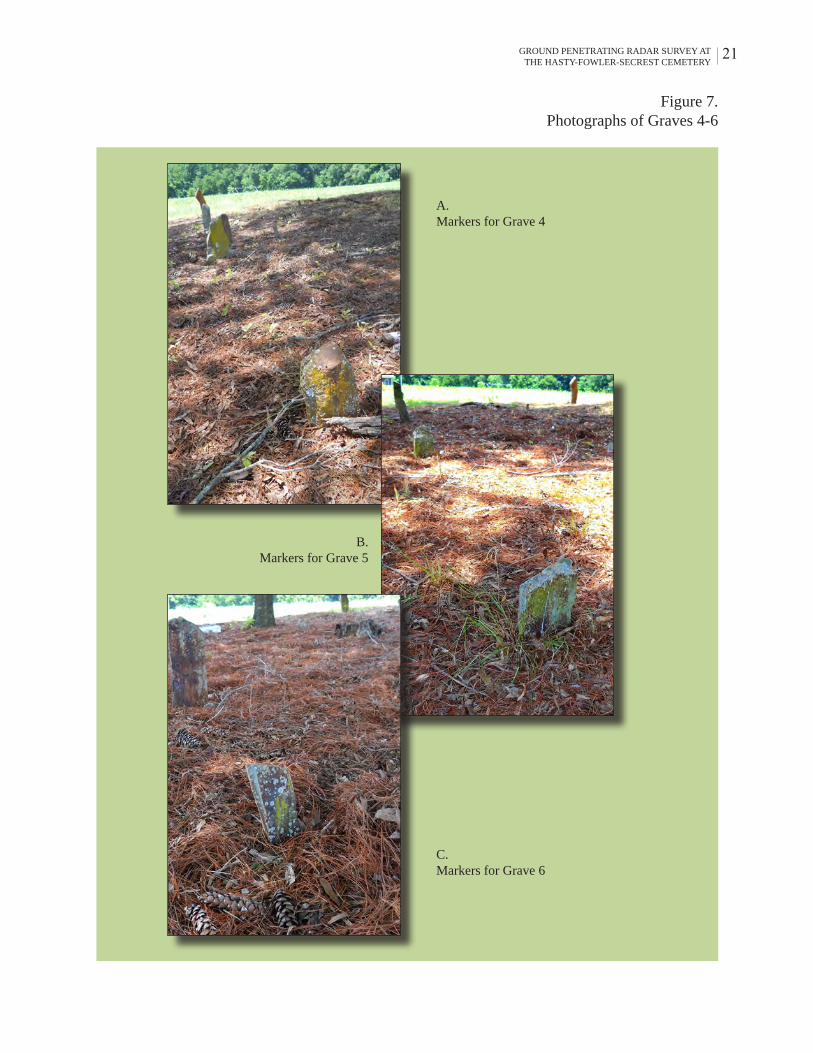
Figure 7.Photographs of Graves 4-6
21GROUND PENETRATING RADAR SURVEY AT THE HASTY-FOWLER-SECREST CEMETERY
A.Markers for Grave 4
B.Markers for Grave 5
C.Markers for Grave 6

Figure 8.Photographs of Three Markers with Inscriptions
22
A.Detail of Marker 1 (illegible)
B.Detail of Marker 2
C.Detail of Marker 4

Figure 9.Photograph of Marker Number 3, Loose and Leaning
23GROUND PENETRATING RADAR SURVEY AT THE HASTY-FOWLER-SECREST CEMETERY

Figure 10.Photographs Showing Piles of Fieldstone at Bases of Trees
24

GROUND PENETRATING RADAR SURVEY AT THE HASTY-FOWLER-SECREST CEMETERY
25
with the extant markers. These show a huge size range from very small pebbles to large cobbles, yet none had any evidence of having served as a grave marker. Several had edge damage consistent with plowing, suggesting they were collected from agricultural fields and deposited in this area at an unknown time.
Archival research included review of North Carolina cemetery records for Union County
collected during the WPA years. This particular cemetery was not listed, although numerous
references were located in other cemeteries for the names Hasty, Fowler, and Secrest. It is
unclear whether or not these surveys were comprehensive or selective and opportunistic. A full
range of cemetery types is represented, including rural locations with only a handful of graves to
urban settings with hundreds of marked graves.
GROUND PENETRATING RADAR
The primary purpose of the GPR survey was to identify geophysical anomalies consistent
with the expected signature for historic-era graves. GPR results were based on analysis of both
the 400MHz and 900MHz datasets, including individual reflection profiles and amplitude slice
maps. Analysis of the 400MHz data indicated a very clean landscape with no obvious anomalies
beyond those that were associated with trees, the driveway, and Fowler residence. However,
analysis of the 900MHz data indicated a much different situation with far better resolution of
subtle features. The results presented below were derived primarily from this dataset, although
there was a certain degree of overlap between the two. The finer resolution generated in the
900MHz dataset made it possible to better distinguish subtle features that appeared as general
background noise in the 400MHz dataset. Results indicate the presence of 46 unique anomalies
(Tables 2 and 3, and Figure 11).
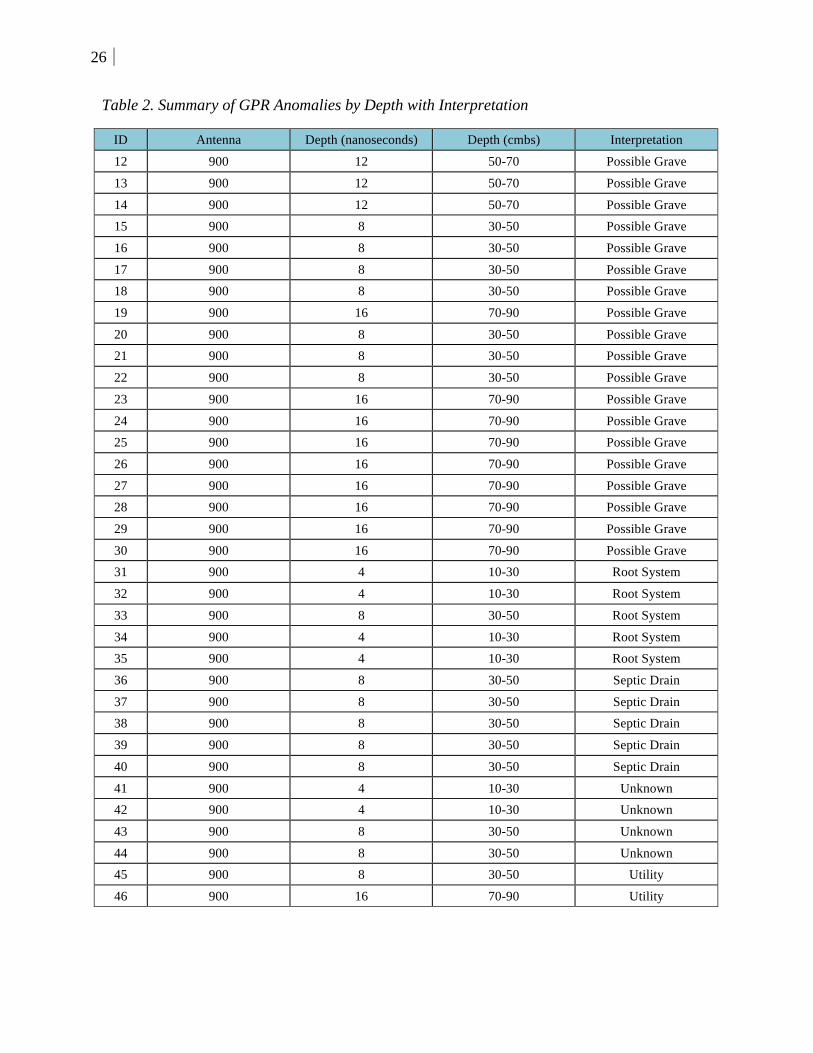
Table 2. Summary of GPR Anomalies by Depth with Interpretation
ID Antenna Depth (nanoseconds) Depth (cmbs) Interpretation
1 900 4 10-30 Concrete
2 900 4 10-30 Driveway
3 900 4 10-30 Driveway
4 900 4 10-30 Driveway
5 900 4 10-30 Foundation
6 900 4 10-30 Foundation
7 900 4 10-30 Foundation
8 900 4 10-30 Foundation
9 900 4 10-30 Foundation
10 900 4 10-30 Foundation
11 900 16 70-90 Pipe
26
Table 2. Summary of GPR Anomalies by Depth with Interpretation
ID Antenna Depth (nanoseconds) Depth (cmbs) Interpretation
12 900 12 50-70 Possible Grave
13 900 12 50-70 Possible Grave
14 900 12 50-70 Possible Grave
15 900 8 30-50 Possible Grave
16 900 8 30-50 Possible Grave
17 900 8 30-50 Possible Grave
18 900 8 30-50 Possible Grave
19 900 16 70-90 Possible Grave
20 900 8 30-50 Possible Grave
21 900 8 30-50 Possible Grave
22 900 8 30-50 Possible Grave
23 900 16 70-90 Possible Grave
24 900 16 70-90 Possible Grave
25 900 16 70-90 Possible Grave
26 900 16 70-90 Possible Grave
27 900 16 70-90 Possible Grave
28 900 16 70-90 Possible Grave
29 900 16 70-90 Possible Grave
30 900 16 70-90 Possible Grave
31 900 4 10-30 Root System
32 900 4 10-30 Root System
33 900 8 30-50 Root System
34 900 4 10-30 Root System
35 900 4 10-30 Root System
36 900 8 30-50 Septic Drain
37 900 8 30-50 Septic Drain
38 900 8 30-50 Septic Drain
39 900 8 30-50 Septic Drain
40 900 8 30-50 Septic Drain
41 900 4 10-30 Unknown
42 900 4 10-30 Unknown
43 900 8 30-50 Unknown
44 900 8 30-50 Unknown
45 900 8 30-50 Utility
46 900 16 70-90 Utility

Figure 11.Map Showing Distribution of All GPR Anomalies
!
! !
!
!
!
!
!
!!
!
!6
34
2 45
1
5
32
23
10
3311
9
87
24
25
35
30
28
36
26
27
41
4642
40
37
38
39
293
43
44
31
22
1719
4
13
12
16
18
152120
14
0 25 50 Feet
0 7.5 15 Meters
$
! Trees
Centerline
GPR Grids
Markers
Concrete
Driveway
Foundation
Pipe or Utility
Possible Grave
Root System
Septic Drain
Unknown
Utility
Concrete Pad
Cultivated Field
Gravel Driveway
House
RV
Utility Pole
Not Surveyed
27GROUND PENETRATING RADAR SURVEY AT THE HASTY-FOWLER-SECREST CEMETERY
28
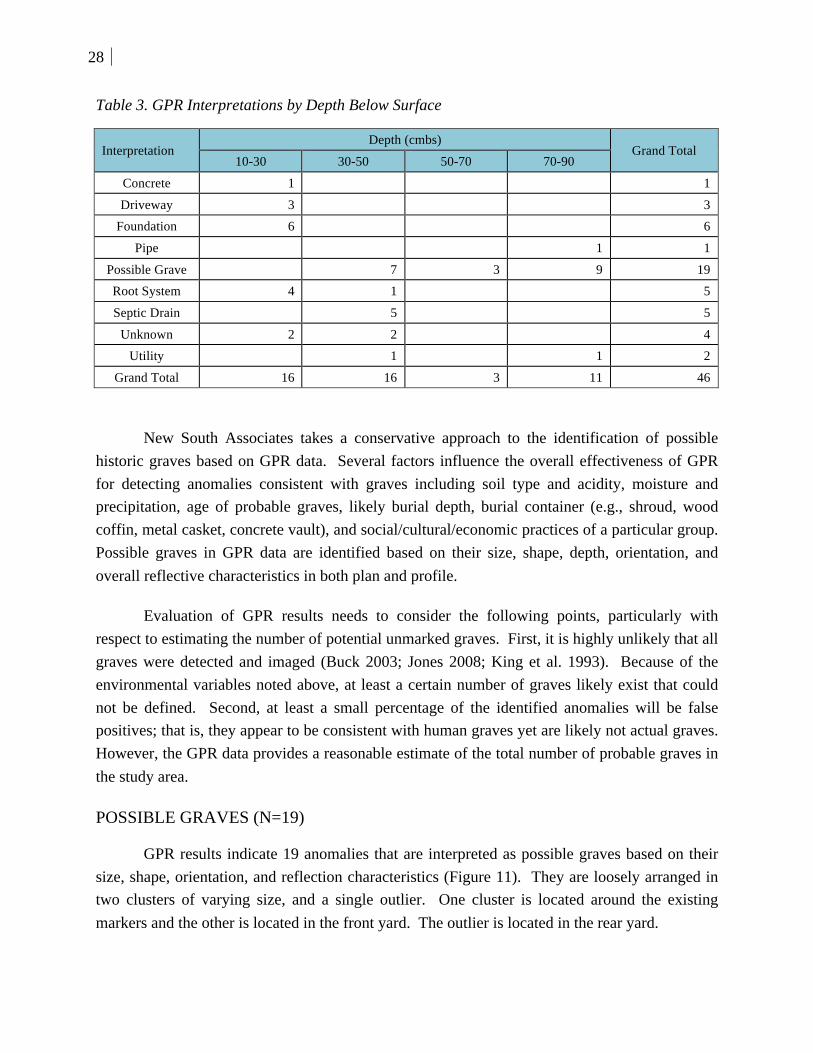
Table 3. GPR Interpretations by Depth Below Surface
Interpretation Depth (cmbs)
Grand Total 10-30 30-50 50-70 70-90
Concrete 1 1
Driveway 3 3
Foundation 6 6
Pipe 1 1
Possible Grave 7 3 9 19
Root System 4 1 5
Septic Drain 5 5
Unknown 2 2 4
Utility 1 1 2
Grand Total 16 16 3 11 46
New South Associates takes a conservative approach to the identification of possible
historic graves based on GPR data. Several factors influence the overall effectiveness of GPR
for detecting anomalies consistent with graves including soil type and acidity, moisture and
precipitation, age of probable graves, likely burial depth, burial container (e.g., shroud, wood
coffin, metal casket, concrete vault), and social/cultural/economic practices of a particular group.
Possible graves in GPR data are identified based on their size, shape, depth, orientation, and
overall reflective characteristics in both plan and profile.
Evaluation of GPR results needs to consider the following points, particularly with
respect to estimating the number of potential unmarked graves. First, it is highly unlikely that all
graves were detected and imaged (Buck 2003; Jones 2008; King et al. 1993). Because of the
environmental variables noted above, at least a certain number of graves likely exist that could
not be defined. Second, at least a small percentage of the identified anomalies will be false
positives; that is, they appear to be consistent with human graves yet are likely not actual graves.
However, the GPR data provides a reasonable estimate of the total number of probable graves in
the study area.
POSSIBLE GRAVES (N=19)
GPR results indicate 19 anomalies that are interpreted as possible graves based on their
size, shape, orientation, and reflection characteristics (Figure 11). They are loosely arranged in
two clusters of varying size, and a single outlier. One cluster is located around the existing
markers and the other is located in the front yard. The outlier is located in the rear yard.
GROUND PENETRATING RADAR SURVEY AT THE HASTY-FOWLER-SECREST CEMETERY
29
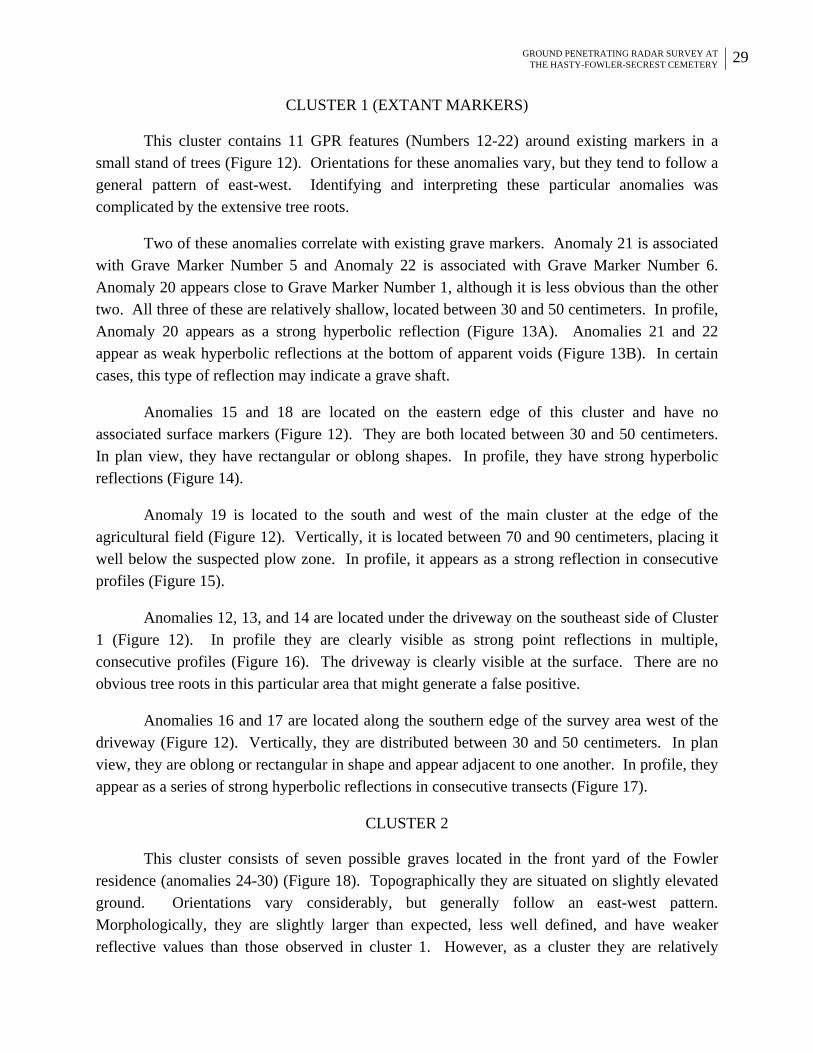
CLUSTER 1 (EXTANT MARKERS)
This cluster contains 11 GPR features (Numbers 12-22) around existing markers in a small stand of trees (Figure 12). Orientations for these anomalies vary, but they tend to follow a general pattern of east-west. Identifying and interpreting these particular anomalies was complicated by the extensive tree roots.
Two of these anomalies correlate with existing grave markers. Anomaly 21 is associated with Grave Marker Number 5 and Anomaly 22 is associated with Grave Marker Number 6. Anomaly 20 appears close to Grave Marker Number 1, although it is less obvious than the other two. All three of these are relatively shallow, located between 30 and 50 centimeters. In profile, Anomaly 20 appears as a strong hyperbolic reflection (Figure 13A). Anomalies 21 and 22 appear as weak hyperbolic reflections at the bottom of apparent voids (Figure 13B). In certain cases, this type of reflection may indicate a grave shaft.
Anomalies 15 and 18 are located on the eastern edge of this cluster and have no associated surface markers (Figure 12). They are both located between 30 and 50 centimeters. In plan view, they have rectangular or oblong shapes. In profile, they have strong hyperbolic reflections (Figure 14).
Anomaly 19 is located to the south and west of the main cluster at the edge of the agricultural field (Figure 12). Vertically, it is located between 70 and 90 centimeters, placing it well below the suspected plow zone. In profile, it appears as a strong reflection in consecutive profiles (Figure 15).
Anomalies 12, 13, and 14 are located under the driveway on the southeast side of Cluster 1 (Figure 12). In profile they are clearly visible as strong point reflections in multiple, consecutive profiles (Figure 16). The driveway is clearly visible at the surface. There are no obvious tree roots in this particular area that might generate a false positive.
Anomalies 16 and 17 are located along the southern edge of the survey area west of the driveway (Figure 12). Vertically, they are distributed between 30 and 50 centimeters. In plan view, they are oblong or rectangular in shape and appear adjacent to one another. In profile, they appear as a series of strong hyperbolic reflections in consecutive transects (Figure 17).
CLUSTER 2
This cluster consists of seven possible graves located in the front yard of the Fowler residence (anomalies 24-30) (Figure 18). Topographically they are situated on slightly elevated ground. Orientations vary considerably, but generally follow an east-west pattern. Morphologically, they are slightly larger than expected, less well defined, and have weaker reflective values than those observed in cluster 1. However, as a cluster they are relatively
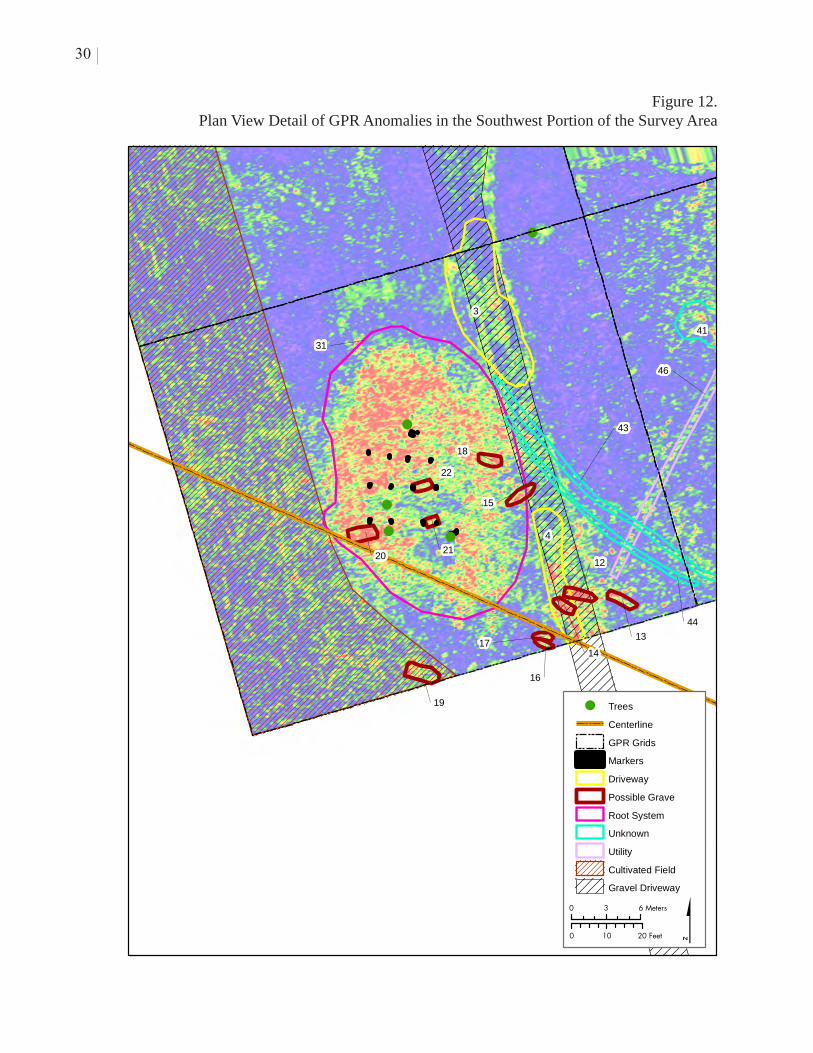
Figure 12.Plan View Detail of GPR Anomalies in the Southwest Portion of the Survey Area
!
! !
!
!
!
!
!
!!
!
!
24
25
41
46
3
43
44
31
22
17
19
4
13
12
16
18
15
2120
14
0 10 20 Feet
0 3 6 Meters
$
! Trees
Centerline
GPR Grids
Markers
Driveway
Possible Grave
Root System
Unknown
Utility
Cultivated Field
Gravel Driveway
30
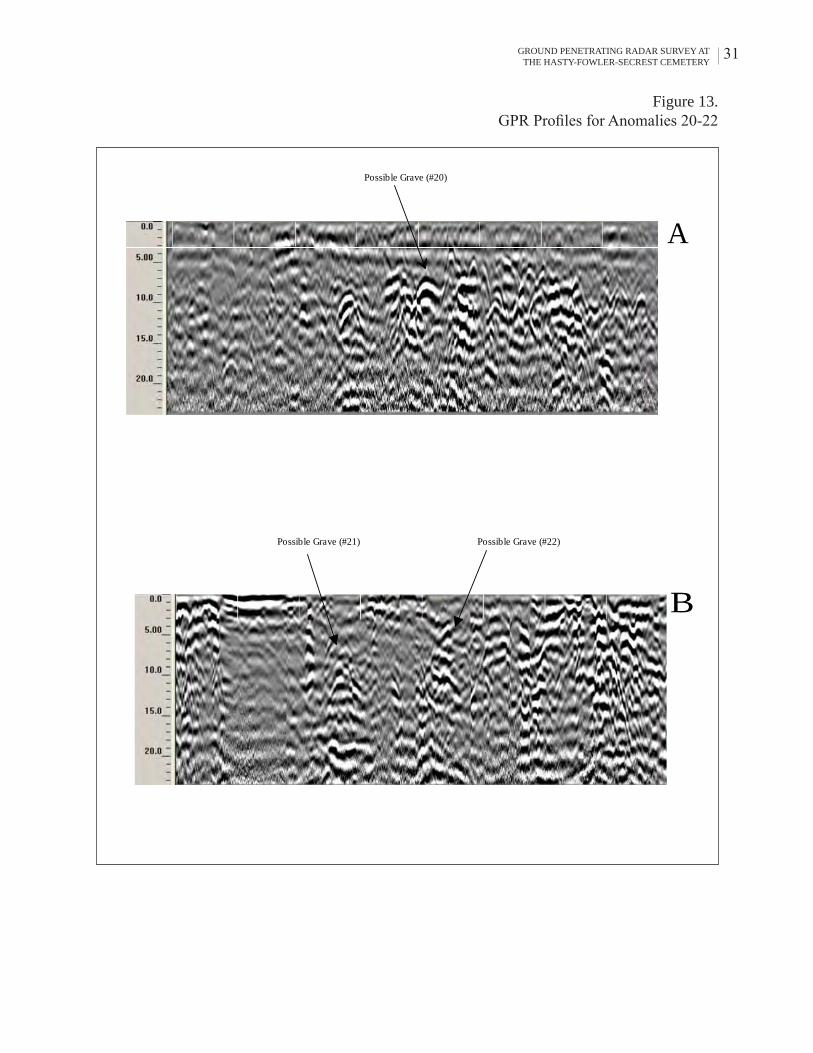
Figure 13. GPR Profiles for Anomalies 20-22
Possible Grave (#21) Possible Grave (#22)
Possible Grave (#20)
A
B
31GROUND PENETRATING RADAR SURVEY AT THE HASTY-FOWLER-SECREST CEMETERY

Figure 14. GPR Profile for Anomalies 15 and 18
Possible Grave (#15)
Possible Grave (#18)
A
B
33GROUND PENETRATING RADAR SURVEY AT THE HASTY-FOWLER-SECREST CEMETERY
32
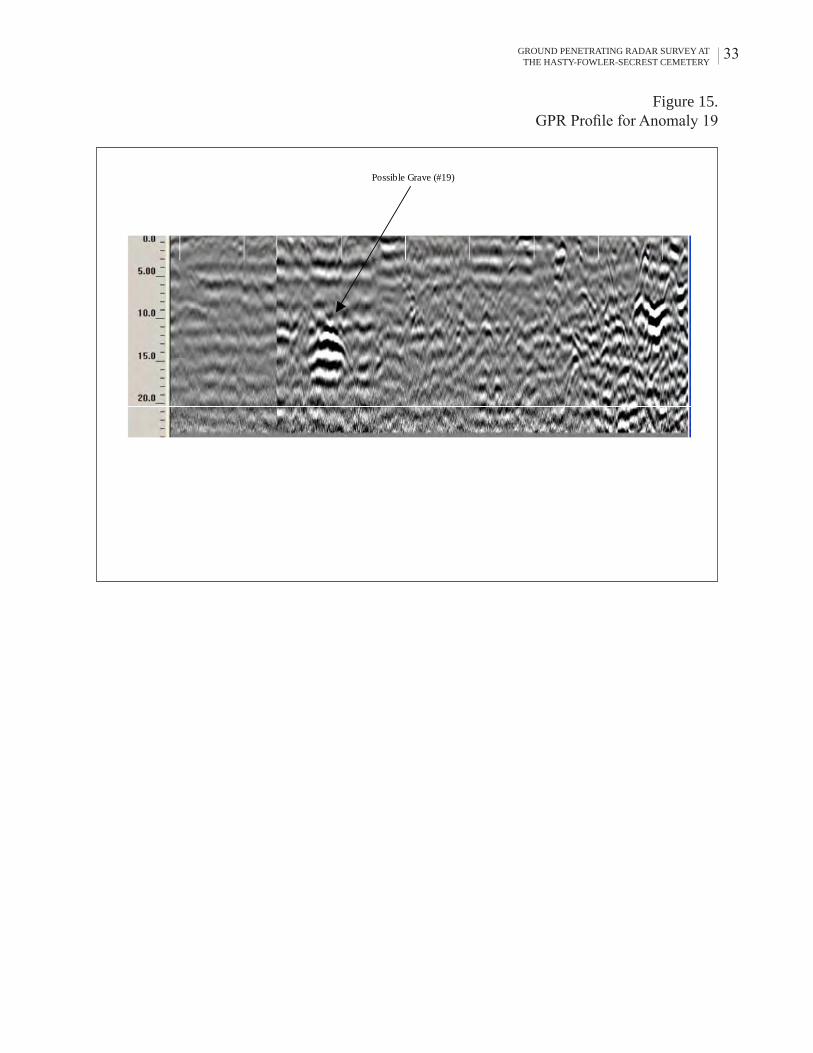
Figure 15.GPR Profile for Anomaly 19
Possible Grave (#19)
33GROUND PENETRATING RADAR SURVEY AT THE HASTY-FOWLER-SECREST CEMETERY

Figure 16. GPR Profiles for Anomalies 12 and 13
Possible Grave (#12)
A
B
Possible Grave (#13)
34
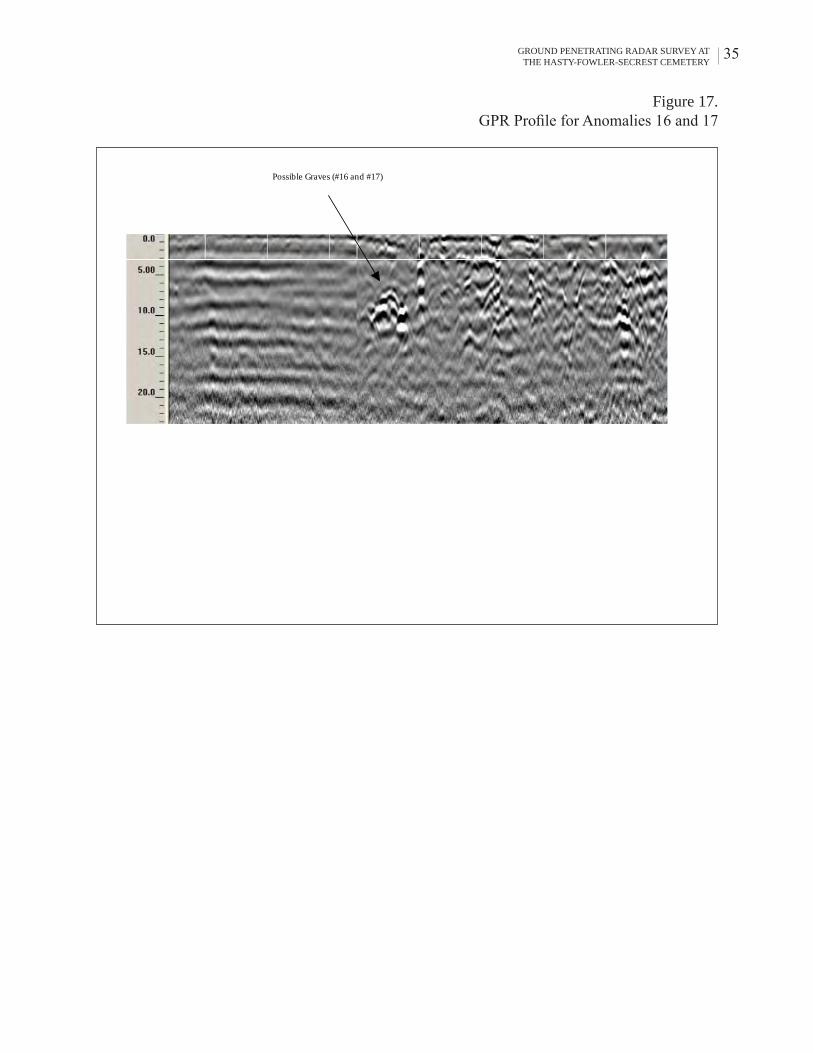
Figure 17.GPR Profile for Anomalies 16 and 17
Possible Graves (#16 and #17)
35GROUND PENETRATING RADAR SURVEY AT THE HASTY-FOWLER-SECREST CEMETERY
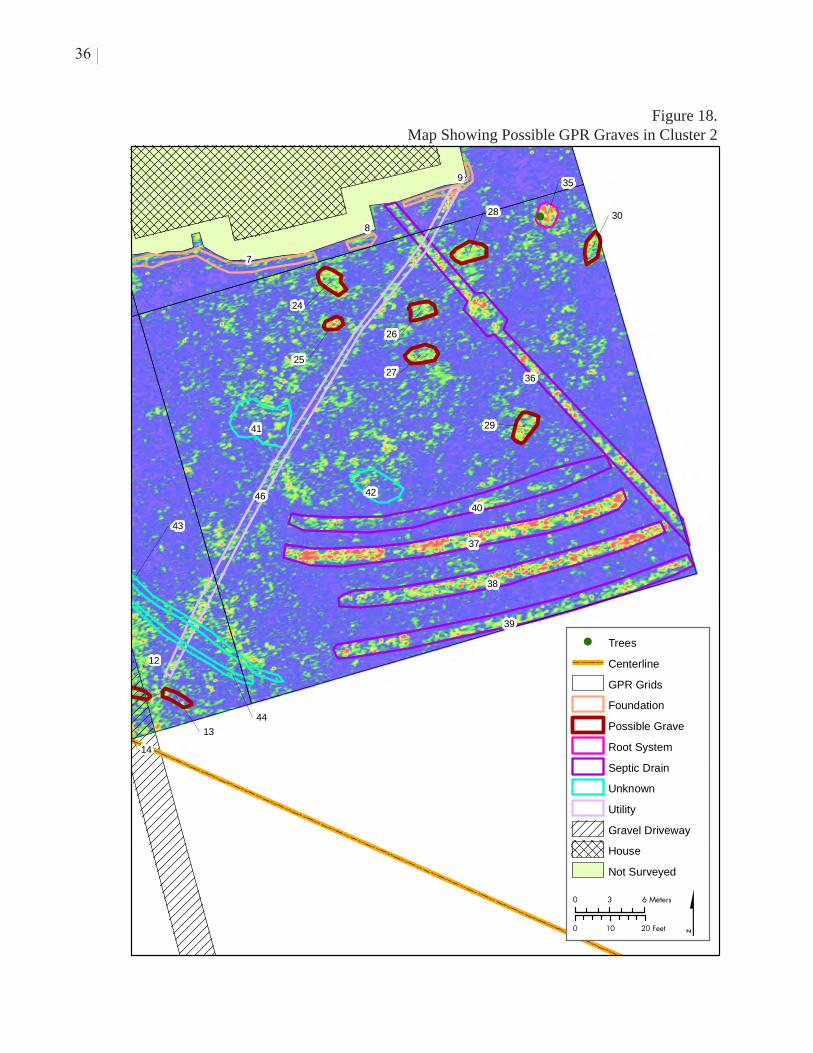
Figure 18. Map Showing Possible GPR Graves in Cluster 2
!
!!
!
!
!
!
!
!
!
!
!
59
8
7
24
25
35
3028
36
26
27
41
46 4240
37
38
39
29
43
4413
12
14
0 10 20 Feet
0 3 6 Meters
$
! Trees
Centerline
GPR Grids
Foundation
Possible Grave
Root System
Septic Drain
Unknown
Utility
Gravel Driveway
House
Not Surveyed
36
GROUND PENETRATING RADAR SURVEY AT THE HASTY-FOWLER-SECREST CEMETERY
37
consistent. Vertically, they appear strongest between 70 and 90 centimeters. In profile, these anomalies tend to be fainter and more difficult to see than those identified in Cluster 1 (Figure 19). The point reflections are slightly weaker and more diffuse. False positives cannot be ruled out, although it is difficult to speculate about what other types of features might cause these reflections.
SINGLE OUTLIER
This outlier consists of a single possible grave located in the rear yard of the Fowler
residence (Anomaly 23) (Figure 20). Topographically it is situated on level, elevated ground.
There are no trees or other surface obstructions that might have caused signal interference.
Vertically, it is located between 70 and 90 centimeters. In plan view, it is rectangular or oblong
and oriented northeast-southwest. In profile, it appears as a strong hyperbolic reflection in
consecutive transects (Figure 21). These characteristics are all consistent with expectations for
historic graves.
NON-MORTUARY FEATURES
UTILITIES (N=8)
Several utility lines are present in the survey area, all of which clearly lead to/from the
Fowler residence (Figure 11). The front yard has an extensive sewer system, with an outlet pipe,
septic tank, and associated drain lines (Anomalies 36-40). The outlet (Anomaly 36) leads from
the southeast corner of the house to the drain lines (Anomalies 37-40), which are downslope
from and roughly parallel to the house. In plan view, these are clearly visible in both datasets as
high amplitude linear features. In profile, they appear as very strong hyperbolic reflections
(Figure 22). Vertically, these are located between 30 and 50 centimeters.
Anomaly 46 is another likely utility that is oriented southwest through the front yard. It
is narrower and of lower reflection and is associated with an unknown function. At 70-90
centimeters below surface, it is relatively deep compared to other utilities. In plan view, it is
faint but discernable and in profile it appears as a series of low amplitude hyperbolas in
consecutive transects.
Anomaly 45 is another utility located in the rear yard area that connects the house to a
small pump house near the edge of the treeline. This likely serves to provide water from the
well. It is buried between 30 and 50 centimeters. In plan view, it is clearly visible as a linear
feature of low to moderate reflective strength. In profile, it appears as a hyperbolic reflection in
consecutive transects.

Figure 19. GPR Profiles for Anomalies 24, 25, and 29 in Cluster 2
Possible Grave (#25)
Possible Grave (#24)
Possible Grave (#29)
38
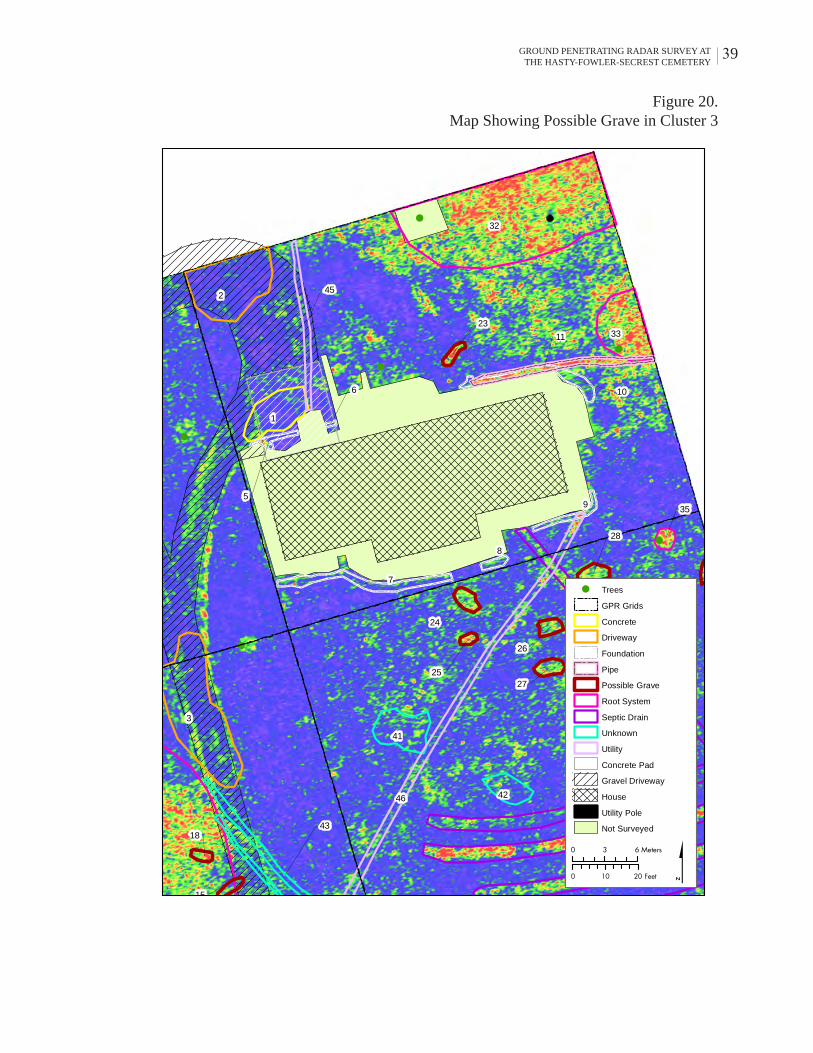
Figure 20.Map Showing Possible Grave in Cluster 3
!
!!
!
!
!
!
!
!
!
!
!
6
2 45
1
5
32
23
10
3311
9
8
7
24
25
35
3028
36
26
27
41
46 4240
37
38
39
293
43
22
18
15
21
0 10 20 Feet
0 3 6 Meters
$
! Trees
GPR Grids
Concrete
Driveway
Foundation
Pipe
Possible Grave
Root System
Septic Drain
Unknown
Utility
Concrete Pad
Gravel Driveway
House
Utility Pole
Not Surveyed
39GROUND PENETRATING RADAR SURVEY AT THE HASTY-FOWLER-SECREST CEMETERY
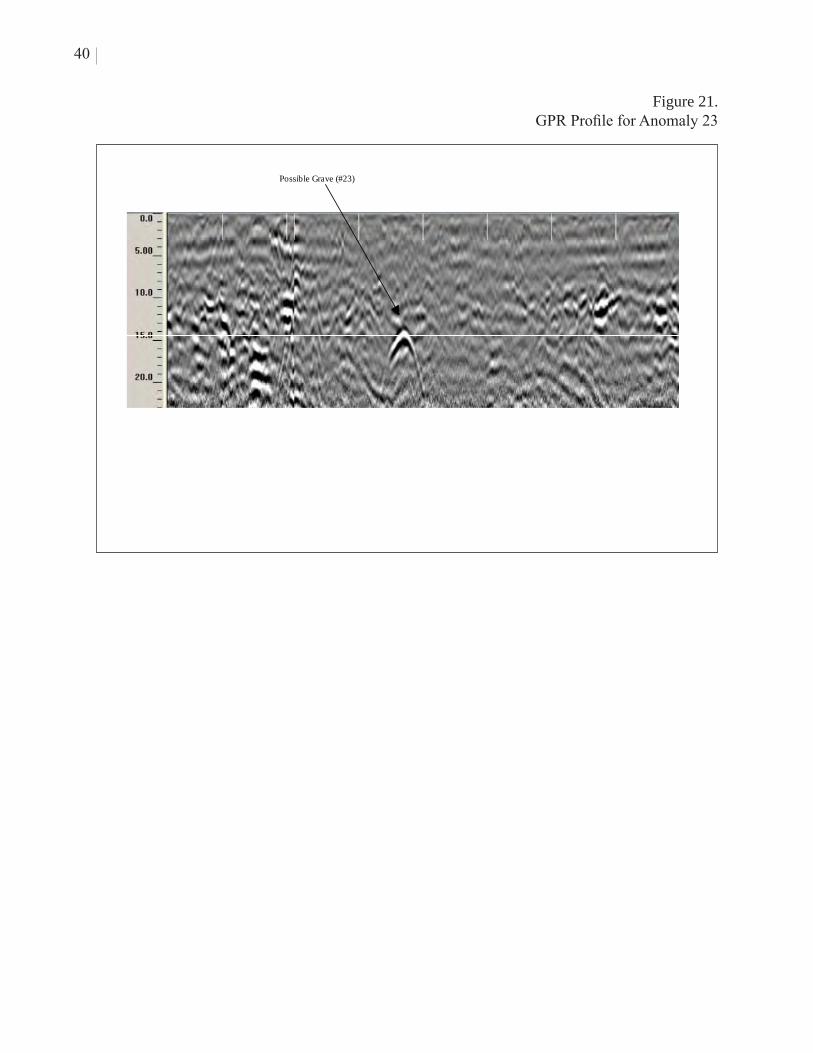
Figure 21. GPR Profile for Anomaly 23
Possible Grave (#23)
40
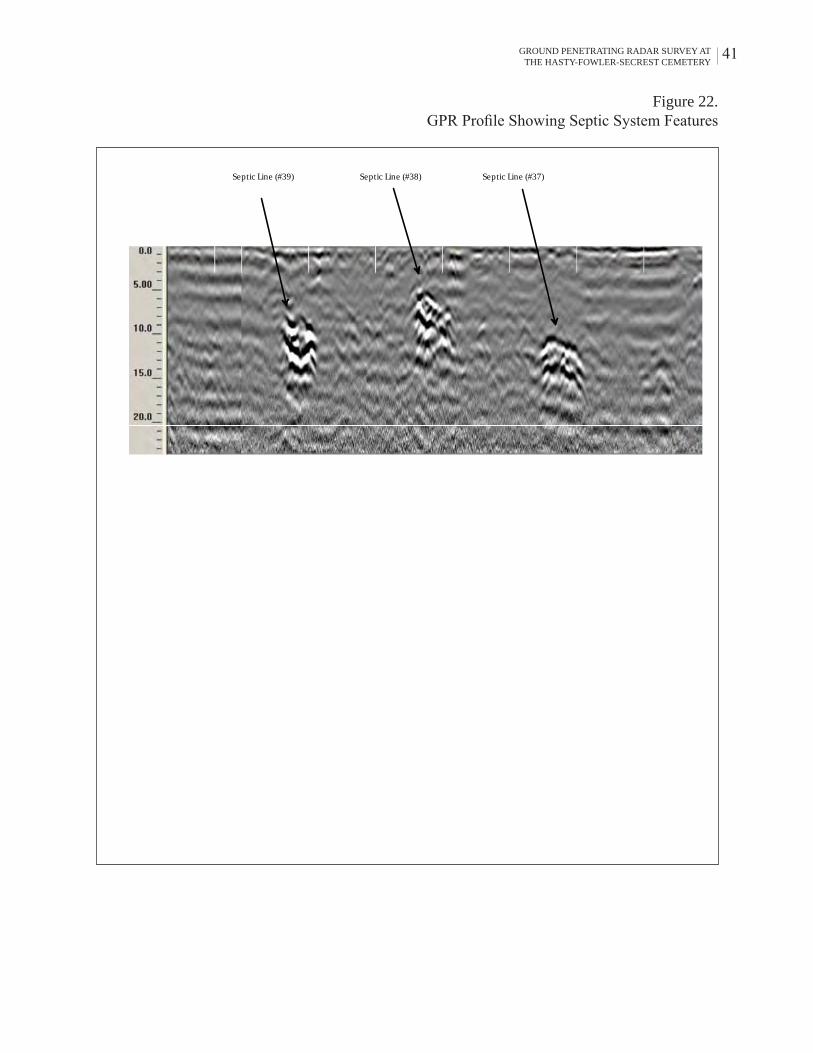
Figure 22. GPR Profile Showing Septic System Features
Septic Line (#39) Septic Line (#38) Septic Line (#37)
41GROUND PENETRATING RADAR SURVEY AT THE HASTY-FOWLER-SECREST CEMETERY

42
Anomaly 11 is a probable fourth utility that leads eastward from the northeast corner of
the house. It is buried between 70 and 90 centimeters. In profile, the hyperbolic reflection is
consistent with a pipe. This could serve a drainage function.
DRIVEWAY (N=3)
The driveway is clearly visible as a near-surface feature in both GPR datasets because of
its physical differences from the surrounding soil (Figure 11). GPR Anomalies 2-4 were
identified as driveway related reflections, but below surface. Based on their size, shape, and
reflective characteristics, these likely represent areas of pooled water or localized soil
differences.
BUILDING ELEMENTS (N=7)
GPR results indicate a series of consistent anomalies located around the perimeter of the
house and its associated landscaping beds (Anomalies 5-10) (Figure 11). These appear as
different segments depending on their reflective strengths. In certain cases (e.g., near the
concrete pad and garage), they appear to represent portions of the foundation or possibly
construction zones. In other cases (e.g., front of house) where the landscaping beds are wide, the
reflections may represent soil or moisture changes. Either way, these are clearly associated with
the house. GPR Anomaly 1 is a concrete pad associated with the garage.
AGRICULTURAL FIELD
The agricultural field on the western side of the survey area is clearly visible in the GPR
data. Plowing has resulted in changes in the sub-surface setting that appears as a series of
streaks.
ROOT SYSTEMS (N=5)
Several areas were identified representing prominent and extensive root systems
(Anomalies 31-35) (Figure 11). The most obvious are located around the extant markers in the
southwest quadrant and along the northern survey boundary adjacent to the tree line. Two
additional areas were also recorded along the eastern edge of the survey area that are associated
with specific trees. These tend to be relatively shallow vertically (10-30 centimeters) and
extensive horizontally (i.e., they cover a broad area). In profile, tree roots tend to appear as very
sharp hyperbolic reflections with very long tails.

GROUND PENETRATING RADAR SURVEY AT THE HASTY-FOWLER-SECREST CEMETERY
43
In certain cases, it was also possible to identify specific networks of individual tree roots.
Although these were not recorded as distinct GPR anomalies, they were included on maps of the
project area.
UNKNOWN (N=4)
Several GPR anomalies were identified that could not be clearly associated with a
specific function or event. Anomalies 41 and 42 are both located in the front yard area at a depth
of 30-50 centimeters. In plan view, they are approximately rectangular in shape and have clear
boundaries. Anomaly 41 has a strong hyperbolic reflection at the bottom and more subtle
reflections along its sides (Figure 23A). It is larger and better defined than a typical grave. The
sides, or walls, are sloped, which gives the appearance of a depression or pit from an unknown
origin.
Anomaly 42 is slightly different in profile (Figure 23B). It appears more like a buried
surface rather than a depression. There is a series of small, repeating hyperbolic reflections that
are not as clearly defined. It is larger than a typical grave and has a different signature. This
anomaly is less distinct and more diffuse, but still clear in the slice maps.
Anomalies 43 and 44 are located in the southern portion of the survey area (Figure 11).
They are long, linear, parallel, and very faint in the GPR data. Vertically, they are located
between 30 and 50 centimeters. They do not appear to be utilities because of their low reflective
values and lack of association with any structures or buildings. Although there is no evidence to
support this possibility, they are reminiscent of what might be expected from a former road.
DISCUSSION
Analysis of the 400MHz dataset did not yield evidence for possible graves. However, the
900MHz dataset produced 19 possible graves. In most cemetery applications, a 400MHz
antenna is sufficient for identifying graves and it is better suited for greater depths. The
circumstances at the Hasty-Fowler-Secrest Cemetery indicate a relatively shallow profile with
heavily eroded soils and bedrock close to the surface. For this reason, the 900MHz antenna with
its better resolution and higher density sampling interval, produced better imagery of the
subsurface conditions. Comparison of both datasets clearly indicates the 900MHz dataset was
more useful for this particular setting. Evaluation of these results suggests that future cemetery
GPR surveys should consider using a 900MHz antenna at least in addition to a 400MHz antenna.
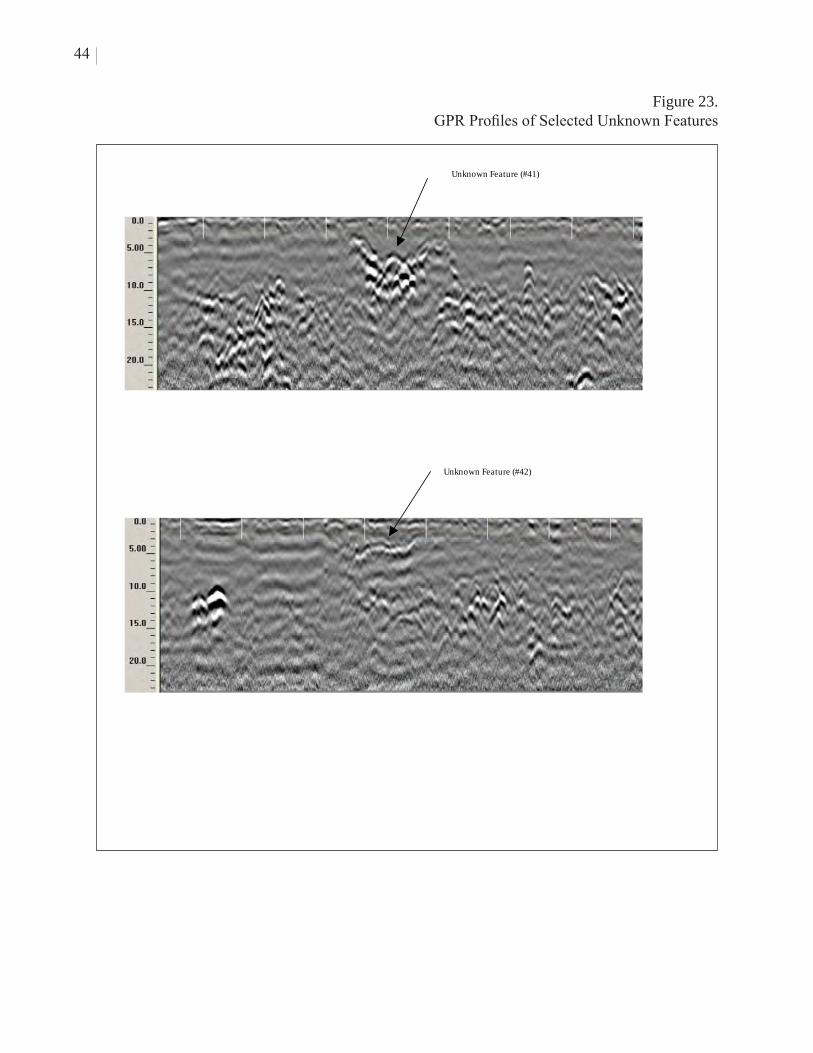
Figure 23.GPR Profiles of Selected Unknown Features
Unknown Feature (#41)
Unknown Feature (#42)
44
GROUND PENETRATING RADAR SURVEY AT THE HASTY-FOWLER-SECREST CEMETERY
45
The high resolution GPR data clearly show buried anomalies, which indicates the
instrument worked as expected. Despite the clay soils and shallow bedrock, there is virtually no
background or environmental noise to interfere with identification and interpretation of potential
features beyond those already noted. Therefore, it is not easy to reconcile the relatively low
number of possible graves (n=19) against the 51 graves suggested by the archival record. Two
possibilities are that additional graves were/are present beneath the 1991 house, or the archival
record is mistaken.
RECOMMENDATIONS
The Hasty-Fowler-Secrest Cemetery contains six marked graves arranged in two rows of
three graves each. Analysis of the GPR data indicates at least 19 features consistent with
expectations for historic graves, two of which correlate with extant markers. The remaining 17
possible graves have no surface expression. The GPR features are clustered around extant
markers, in the front yard of the Fowler residence, and a single anomaly in the rear yard.
New South Associates recommends that all possible burials identified through GPR, as
well as though indicated by markers in the absence of an anomaly, be treated as burials for
management purposes. All such anomalies should be considered potential human remains, and
treated appropriately under North Carolina burial removal laws. It is also possible that additional
graves are present that were not imaged with GPR. Field investigations to test the possible grave
features should include mechanical scraping of the topsoil to expose grave shafts and outlines.
In addition, if excavation verifies that the near-house anomalies are human graves, the area
beneath the house should be examined for possible graves after the structure has been carefully
removed.

GROUND PENETRATING RADAR SURVEY AT THE HASTY-FOWLER-SECREST CEMETERY
47
REFERENCES CITED
Buck, Sabrina C.
2003 Searching for Graves Using Geophysical Technology: Field Tests with Ground
Penetrating Radar, Magnetometry, and Electrical Resistivity. Journal of Forensic
Science 48(1):1-7.
Conyers, Lawrence B.
2004a Ground Penetrating Radar for Archaeology. Altamira Press, Walnut Creek,
California.
2004b Moisture and Soil Differences as Related to the Spatial Accuracy of GPR
Amplitude Slice Maps at Two Archaeological Sites. Tenth International
Conference on Ground Penetrating Radar, 21-24 June, 2004, Delft, The
Netherlands.
2006 Ground-Penetrating Radar Techniques to Discover and Map Historic Graves,
Historical Archaeology, 40(3):64-73.
Conyers, Lawrence and Jeffrey Lucius
1996 Velocity Analysis in Archaeological Ground-Penetrating Radar Studies.
Archaeological Prospection, 3:25-38.
Gregory, Danny, Shawn M. Patch, David Price, and Hugh B. Matternes
2009 Archaeological Inventory and Evaluation for the U.S. 74 Monroe Connector,
Mecklenburg and Union Counties, North Carolina. New South Associated
Technical Report No. 1812, Stone Mountain, Georgia.
Jones, Geoffrey
2008 Geophysical Mapping of Historic Cemeteries. Technical Briefs in Historical
Archaeology 3:25-38.
King, Julia A., Bruce W. Bevan, and Robert J. Hurry
1993 The Reliability of Geophysical Surveys at Historic-Period Cemeteries: An
Example from the Plains Cemetery, Mechanicsville, Maryland. Historical
Archaeology 27(3):4-16.

48
Patch, Shawn M.
2007 Ground Penetrating Radar (GPR) Investigations at the Old Presbyterian
Cemetery, City of Greensboro, Guilford County, North Carolina. Submitted to
First Presbyterian Church, Greensboro, North Carolina. New South Associates
Technical Report No. 1493, Stone Mountain, Georgia.
Pomfret, James E.
2006 Ground-Penetrating Radar Profile Spacing and Orientation for Subsurface
Resolution of Linear Features. Archaeological Prospection 13:151-153.
Trinkley, Michael and Debi Hacker
2009 The Penitentiary Cemetery, Columbia, South Carolina. Chicora Research
Contribution 509, Chicora Foundation, Columbia, South Carolina.
United States Department of Agriculture
2012 Web Soil Survey, Electronic Document,
http://websoilsurvey.nrcs.usda.gov/app/Homepage.htm, accessed April 2012.

APPENDIX A: GPR AMPLITUDE SLICE MAPS

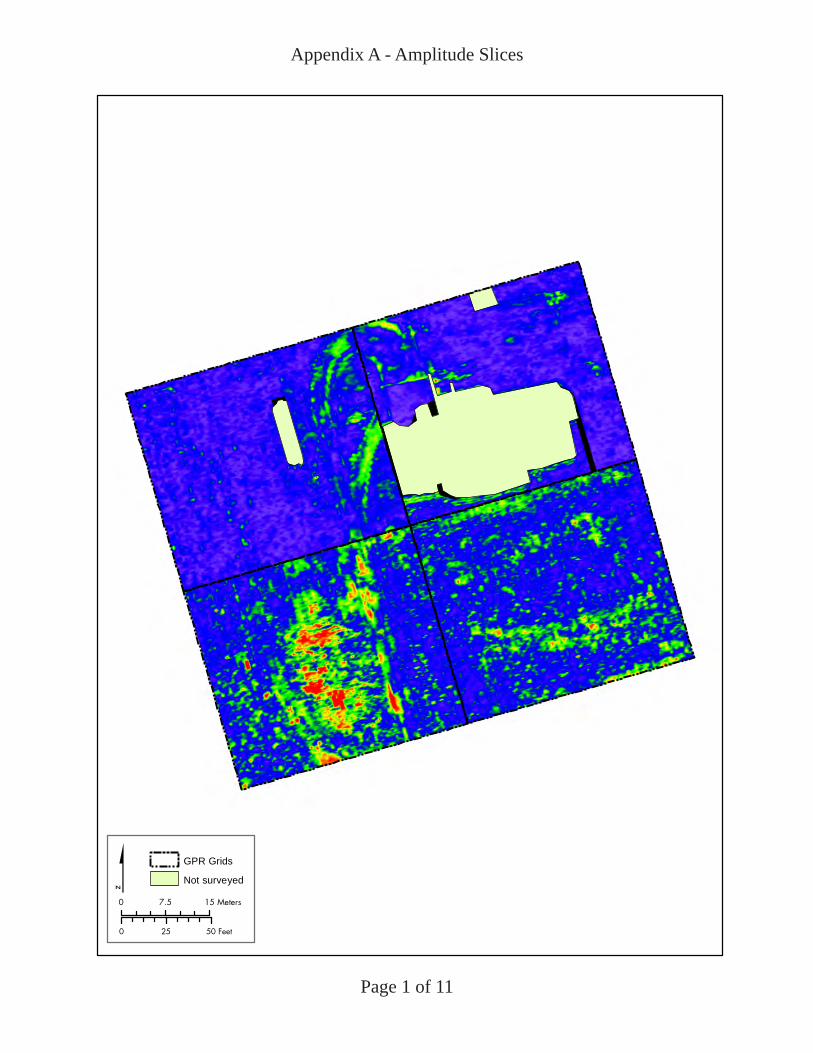
Appendix A - Amplitude Slices
Page 1 of 11
0 25 50 Feet
0 7.5 15 Meters$ GPR Grids
Not surveyed

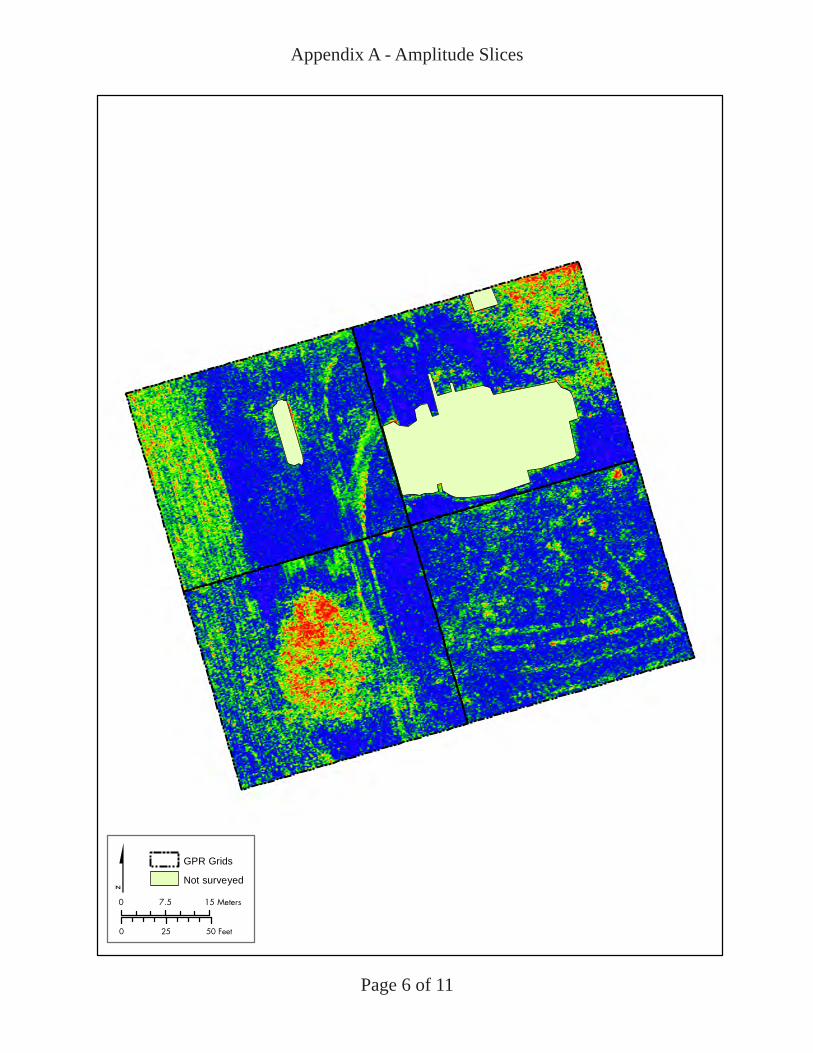
Appendix A - Amplitude Slices
Page 2 of 11
0 25 50 Feet
0 7.5 15 Meters$ GPR Grids
Not surveyed
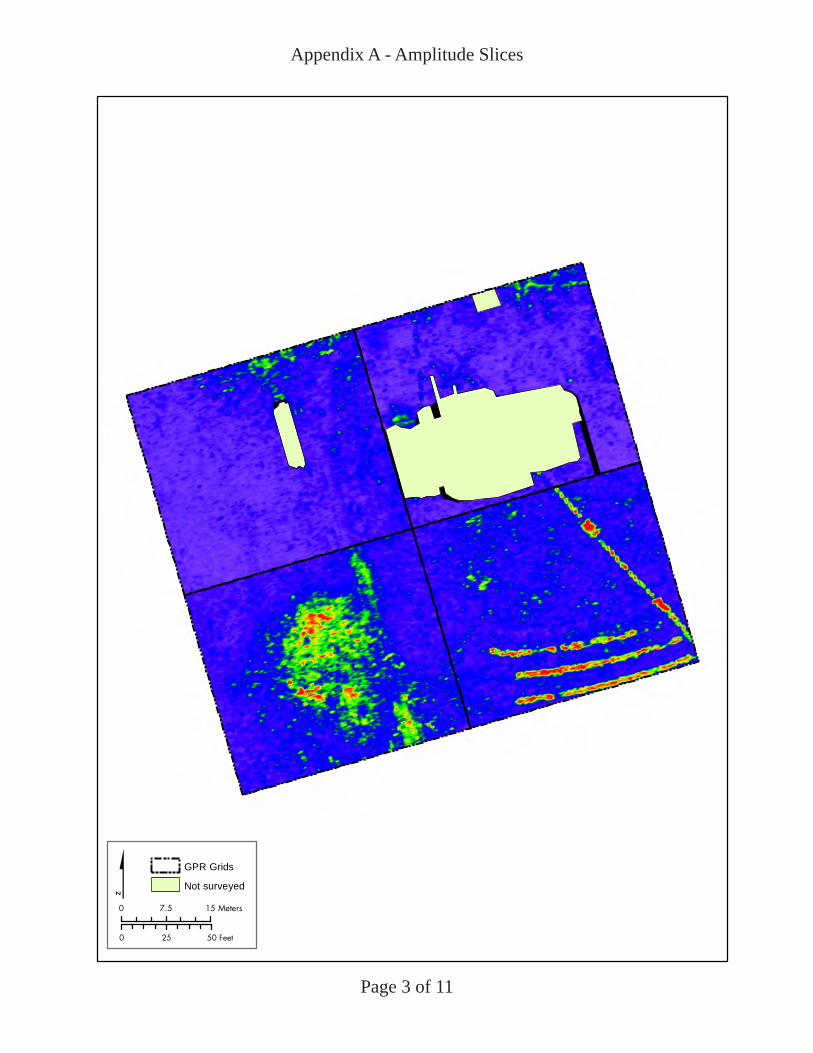
Appendix A - Amplitude Slices
Page 3 of 11
0 25 50 Feet
0 7.5 15 Meters$ GPR Grids
Not surveyed
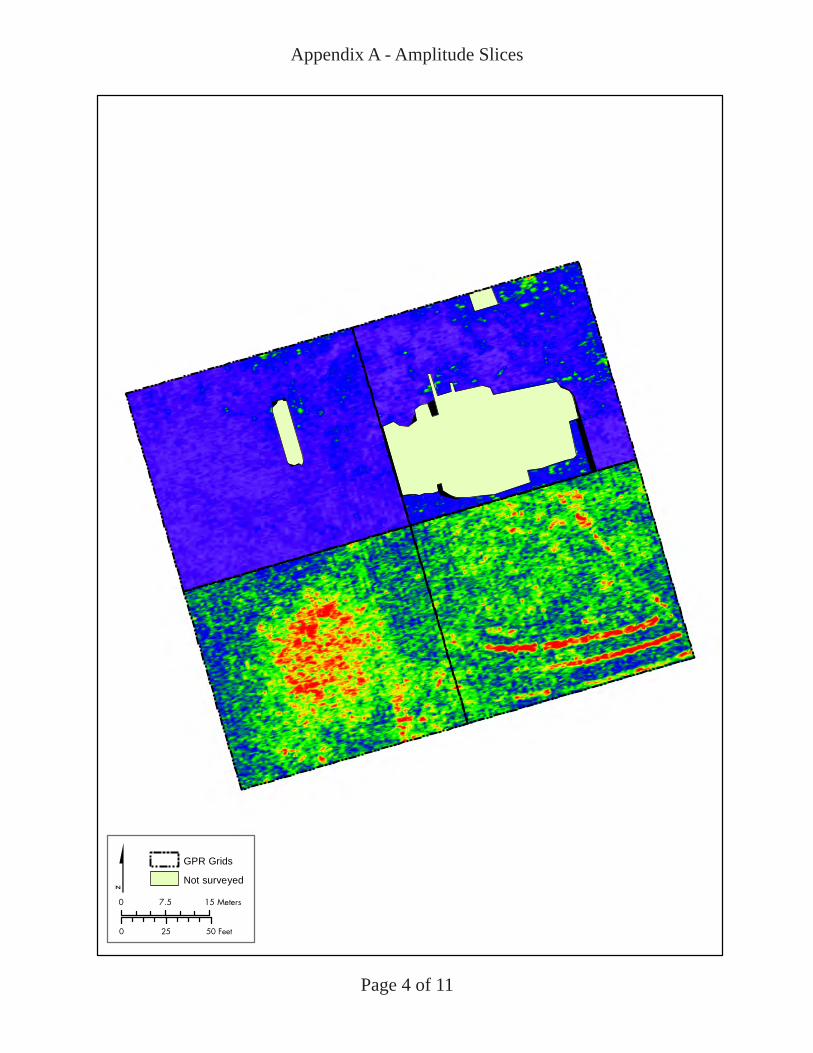
Appendix A - Amplitude Slices
Page 4 of 11
0 25 50 Feet
0 7.5 15 Meters$ GPR Grids
Not surveyed
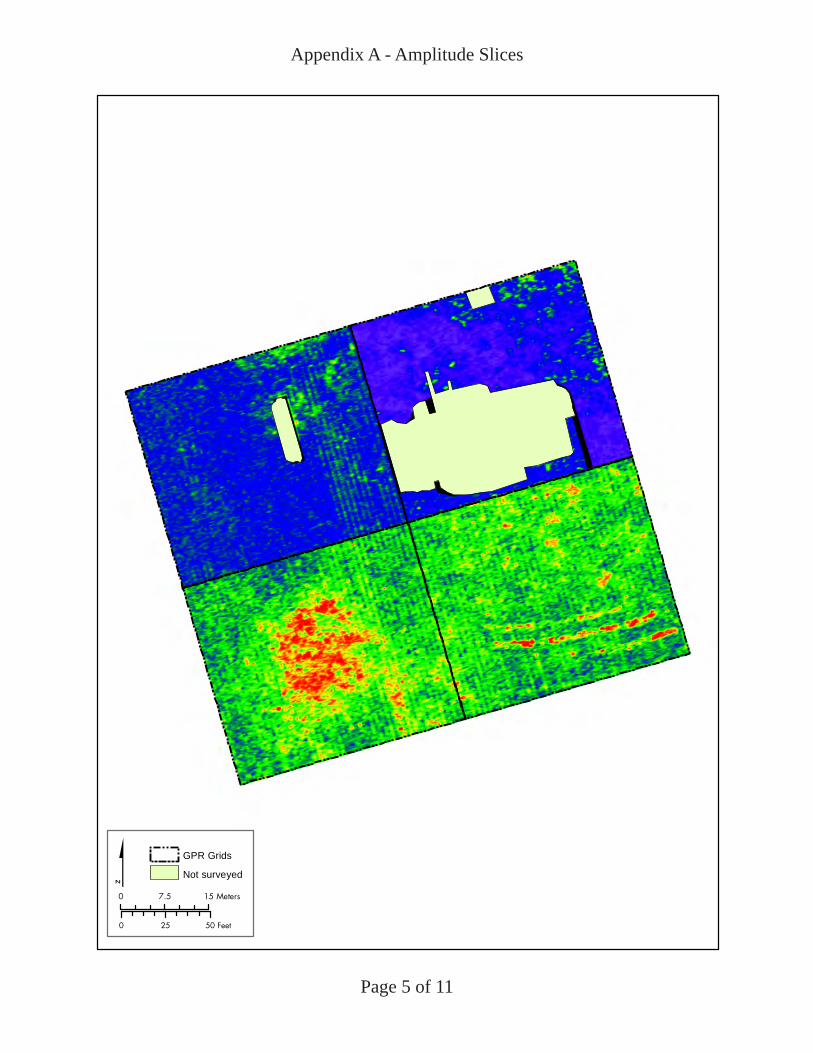
Appendix A - Amplitude Slices
Page 5 of 11
0 25 50 Feet
0 7.5 15 Meters$ GPR Grids
Not surveyed
Appendix A - Amplitude Slices
Page 6 of 11
0 25 50 Feet
0 7.5 15 Meters$ GPR Grids
Not surveyed
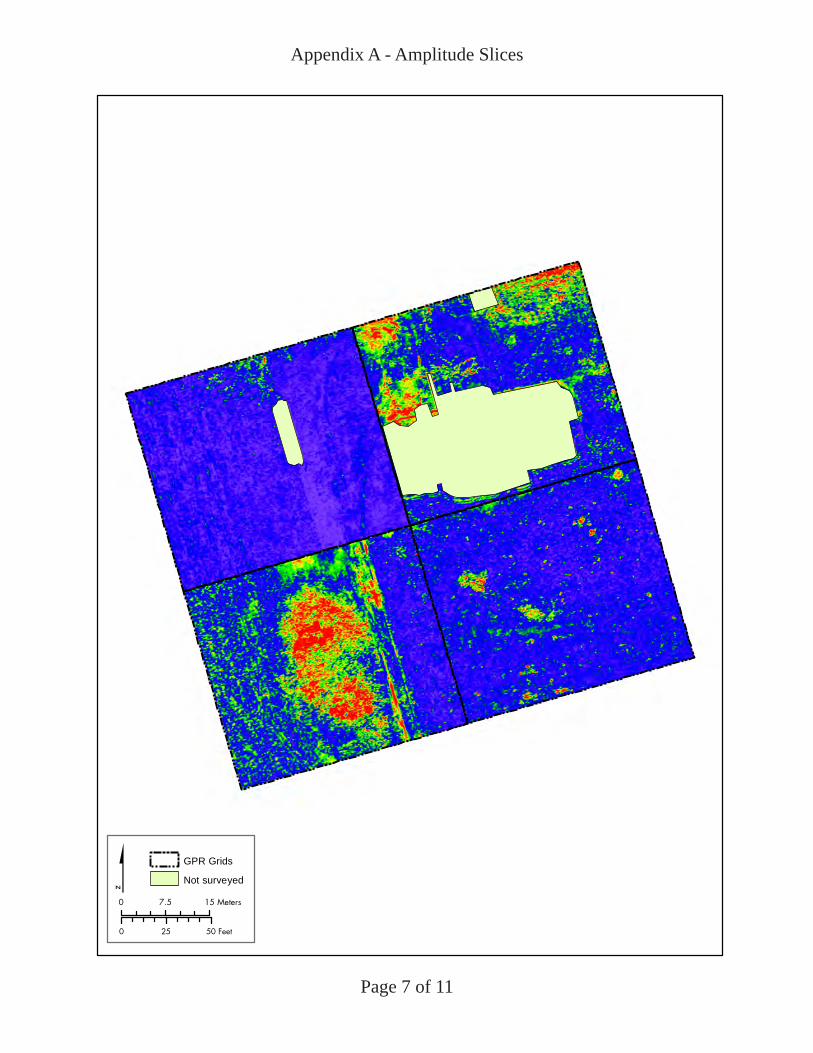
Appendix A - Amplitude Slices
Page 7 of 11
0 25 50 Feet
0 7.5 15 Meters$ GPR Grids
Not surveyed

Appendix A - Amplitude Slices
Page 8 of 11
0 25 50 Feet
0 7.5 15 Meters$ GPR Grids
Not surveyed
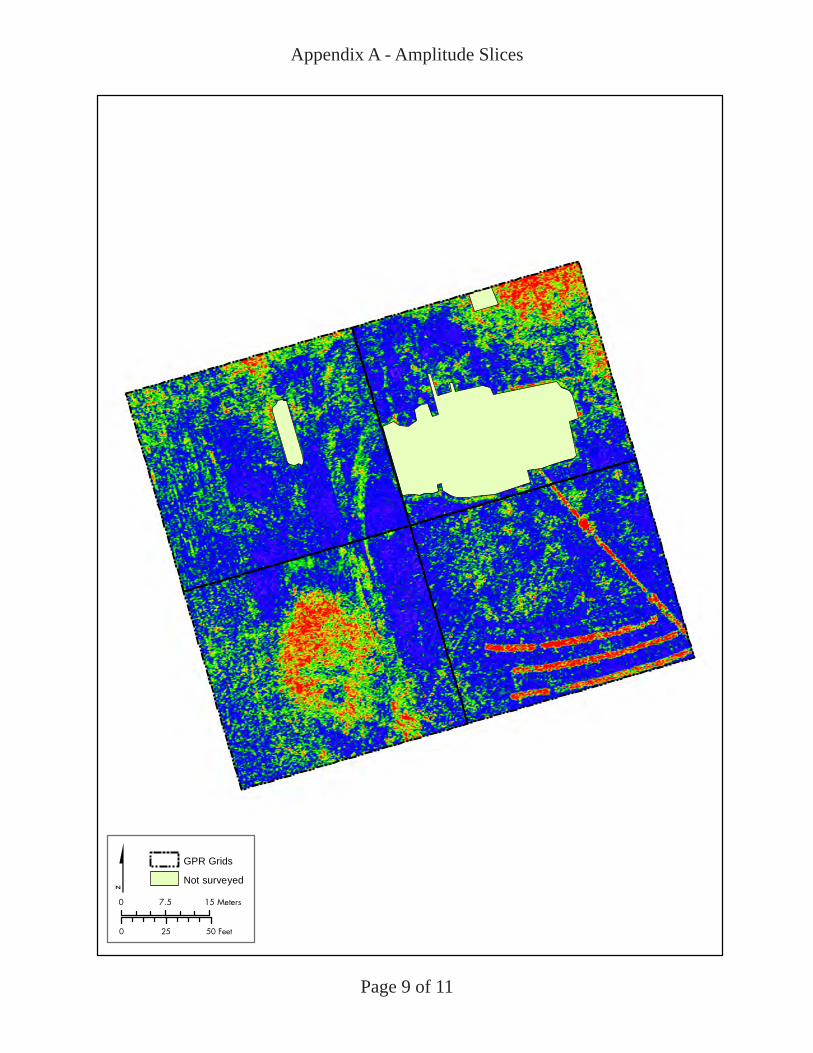
Appendix A - Amplitude Slices
Page 9 of 11
0 25 50 Feet
0 7.5 15 Meters$ GPR Grids
Not surveyed
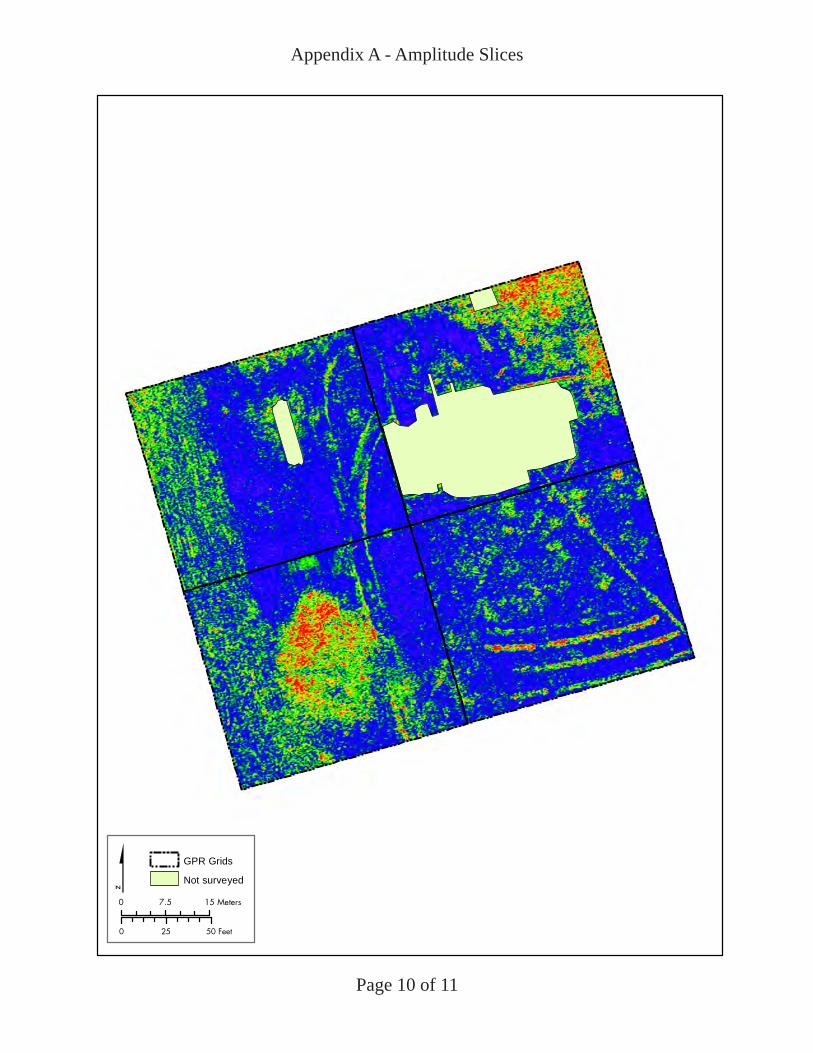
Appendix A - Amplitude Slices
Page 10 of 11
0 25 50 Feet
0 7.5 15 Meters$ GPR Grids
Not surveyed
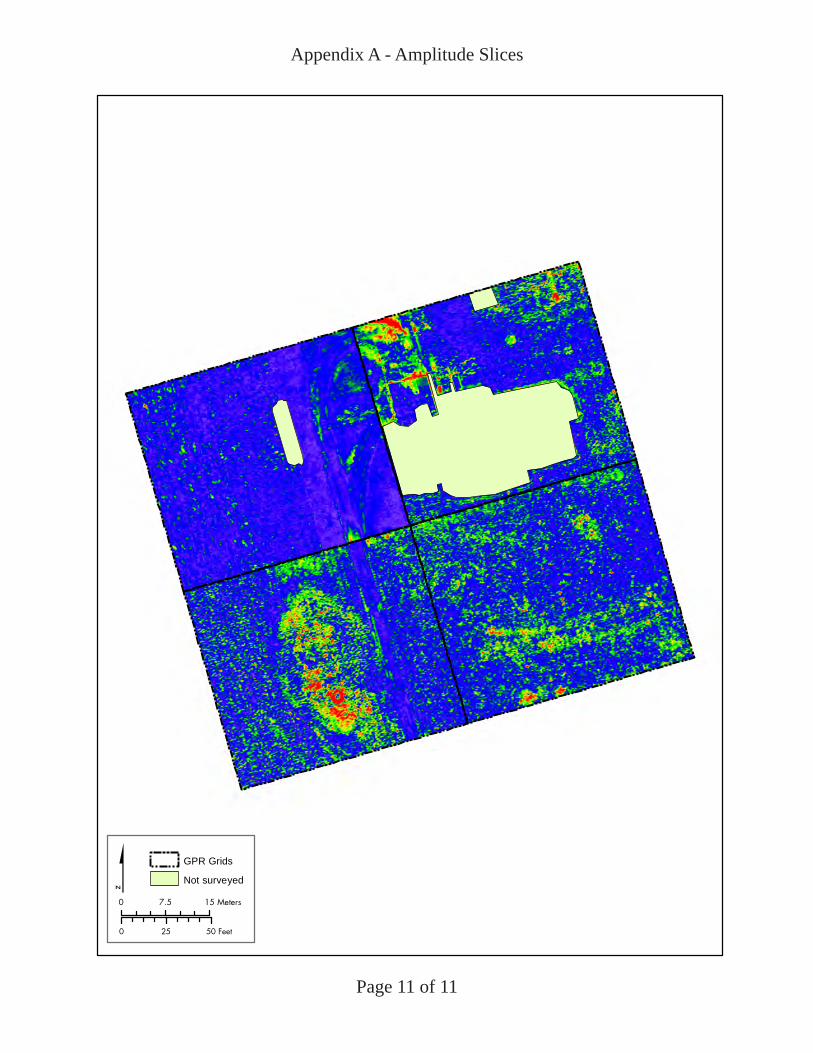
Appendix A - Amplitude Slices
Page 11 of 11
0 25 50 Feet
0 7.5 15 Meters$ GPR Grids
Not surveyed
