grid operations and planning report content • summary • november 2011 operations – peak...
TRANSCRIPT

Kent Saathoff Vice President of Grid Operations and System Planning
Grid Operations and Planning Report
Board of Directors Meeting December 12-13, 2011 ERCOT Public
2
Content
• Summary • November 2011 Operations
– Peak Demand: Actual vs. Forecast On-line Resources: Total at Peak and Wind
– CPS1 Monthly Performance – Historical Peak and Minimum Loads – Day-Ahead Load Forecast Performance – Reliability Unit Commitment (RUC) Capacity by weather zone – Generic Transmission Limits (GTLs) – Advisories, Watches and EEAs – Significant System Incidents
• Planning Activities – Summary – Generation Interconnection Requests – Wind Capacity – Winter 2011/2012 Preparations and Fuel Oil Status – Gas Curtailment Risk Study Status – Drought update – Black Start Unit Testing
December 12-13, 2011 ERCOT Public

3
Summary
• November 2011 Operations – The peak demand of 41,365 MW on November 28 was less than the mid-term
forecast peak of 43,160 MW and more than the October 2010 actual peak demand of 40,220 MW.
– Day-ahead load forecast error for November was 3.38%. – Advisory for Physical Responsive Capability (PRC) below 3000 MW issued 4
days. – No Watches for PRC under 2500 MW issued. – No Energy Emergency Alert (EEA) events issued.
• Planning Activities – 136 active generation interconnect requests totaling over 38,000 MW as
of November 30, 2011. Study has been suspended on 41 generation projects with a nameplate capacity totaling over 18,000 MW.
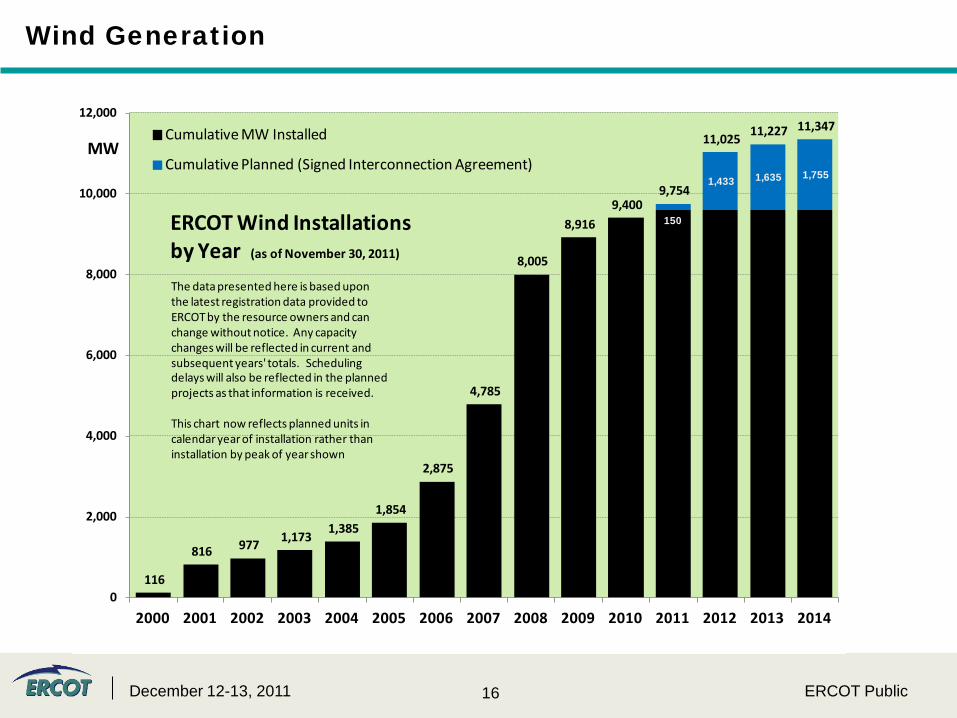
– 9,604 MW wind capacity on line November 30, 2011. – 7,371 MW accounting for 18% of ERCOT gas fueled generation has fuel
oil back-up capability going into the winter of 2011/2012.
ERCOT Public December 12-13, 2011

4
November 2011 Daily Peak Demand: Hourly Average Actual vs. Forecast, Wind Day-Ahead COPs & On-line Capacity at Peak
Note: All data are hourly averages during the peak load hour obtained from COPs, and EMMS.
ERCOT Public December 12-13, 2011
0
10,000
20,000
30,000
40,000
50,000
MW
Actual Peak LoadActual Online CapacityActual Wind OutputERCOT Load Day-Ahead ForecastWind Day-Ahead COPs
Peak Demand for the Month: 41,365 MW @ 11/28/11 HE 08:00

5
November 2011: Actual Wind Output plus Curtailments vs. Wind Day-Ahead COPs for All Hours
Note: QSEs must use the AWST 50% probability of exceedance forecast as the HSL in their COPs
ERCOT Public December 12-13, 2011
0
1000
2000
3000
4000
5000
6000
7000
8000
MW
Operating DayDaily Averaged Aggregated Wind Output Estimated Wind Curtailment Daily Averaged Day-Ahead COP HSL
% of Hours when Estimated Uncurtailed Wind Output >= COP HSLs (Target = 50%)
52%

6
November 2011 ERCOT’s CPS1 Monthly Performance
ERCOT Public December 12-13, 2011
100
110
120
130
140
150
160
170
100
110
120
130
140
150
160
170
CPS1
Aver
age
Monthly Average 12 Month Rolling Average
CPS1 12 Month Rolling Average = 147.22%
7
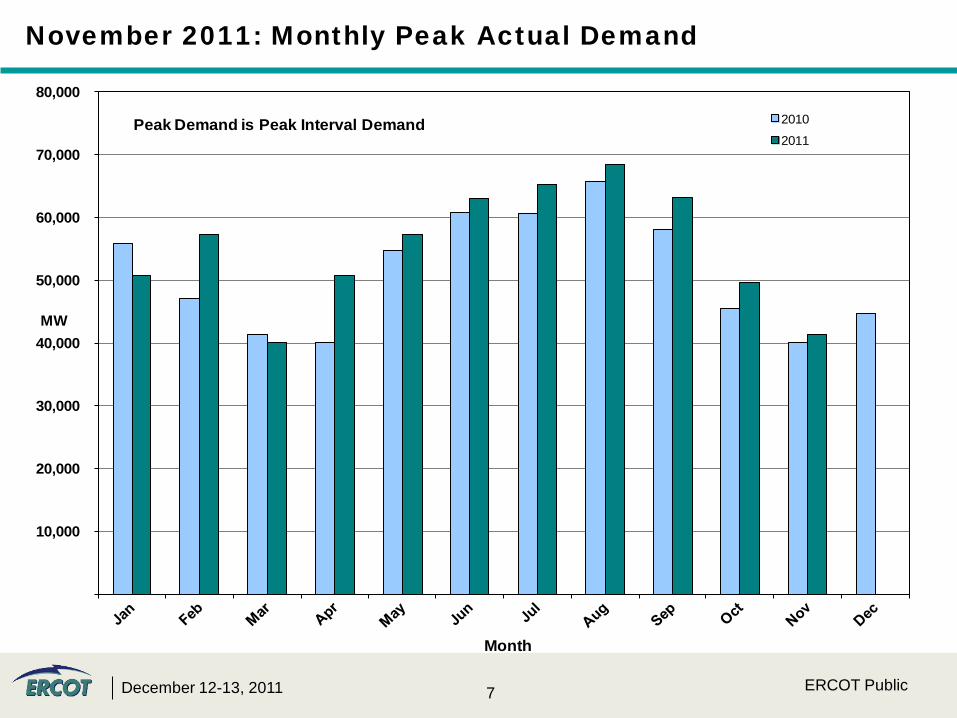
November 2011: Monthly Peak Actual Demand
ERCOT Public December 12-13, 2011
-
10,000
20,000
30,000
40,000
50,000
60,000
70,000
80,000
MW
Month
2010
2011Peak Demand is Peak Interval Demand

8
November 2011: Monthly Minimum Actual Demand
ERCOT Public December 12-13, 2011
-
5,000
10,000
15,000
20,000
25,000
30,000
35,000
40,000
MW
Month
2010
2011Minimum Demand is Valley Interval Demand

9
Day-Ahead Load Forecast Performance in November 2011
Mean Absolute Percent Error (MAPE) for ERCOT Mid-Term Load Forecast (MTLF) Run at 14:00 Day Ahead
2008 MAPE
2009 MAPE
2010 MAPE
2011 MAPE
November 2011 MAPE
Average Annual MAPE
3.30 3.11 2.83 2.82
3.38
Lowest Monthly MAPE
2.45 1.93 2.24 1.63 Lowest Daily MAPE
1.57 Nov – 30
Highest Monthly MAPE
4.99 4.11 3.79 3.55
Highest Daily MAPE
6.76
Nov – 24
ERCOT Public December 12-13, 2011
10
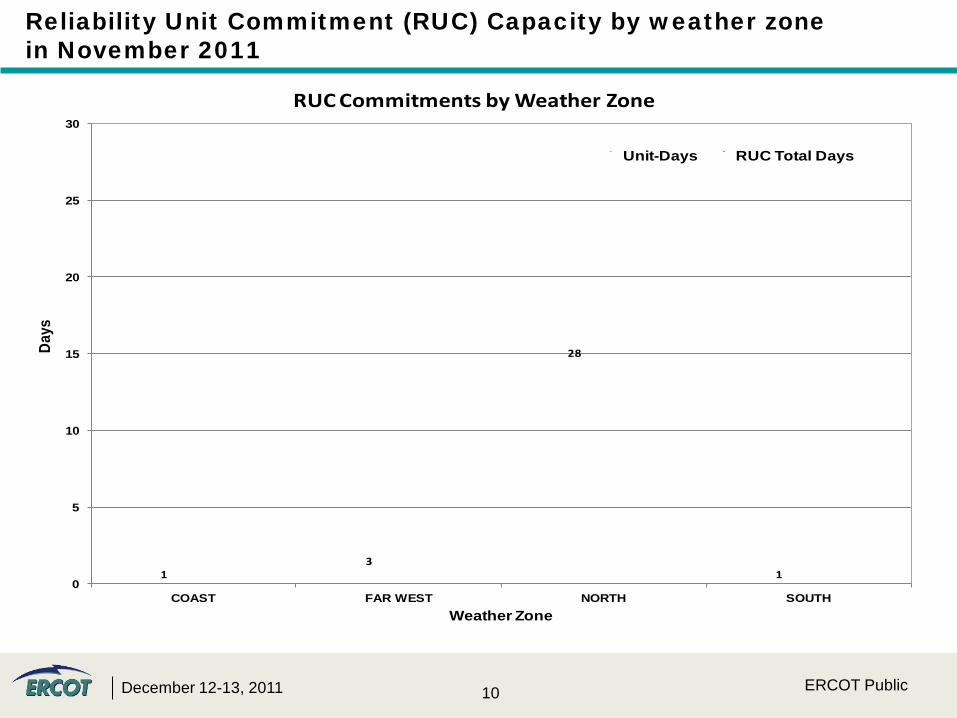
Reliability Unit Commitment (RUC) Capacity by weather zone in November 2011
ERCOT Public December 12-13, 2011
13
28
113
6
10
5
10
15
20
25
30
COAST FAR WEST NORTH SOUTH
Days
Weather Zone
RUC Commitments by Weather Zone
Unit-Days RUC Total Days
11
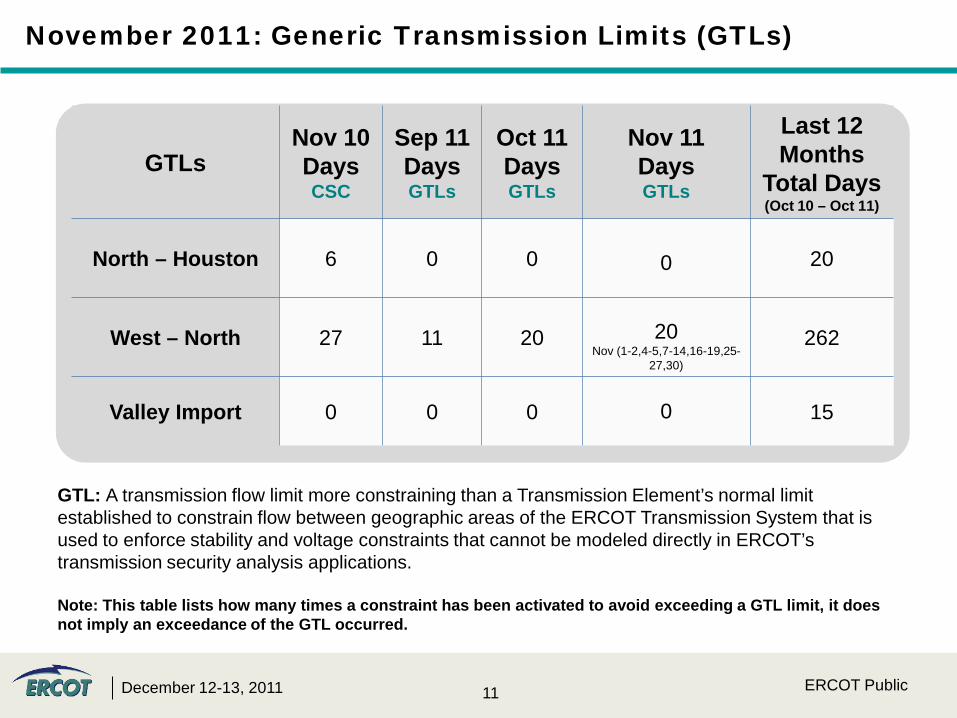
November 2011: Generic Transmission Limits (GTLs)
GTL: A transmission flow limit more constraining than a Transmission Element’s normal limit established to constrain flow between geographic areas of the ERCOT Transmission System that is used to enforce stability and voltage constraints that cannot be modeled directly in ERCOT’s transmission security analysis applications. Note: This table lists how many times a constraint has been activated to avoid exceeding a GTL limit, it does not imply an exceedance of the GTL occurred.
GTLs Nov 10 Days CSC
Sep 11 Days GTLs
Oct 11 Days GTLs
Nov 11 Days GTLs
Last 12 Months
Total Days (Oct 10 – Oct 11)
North – Houston 6 0 0
0
20
West – North 27 11 20
20 Nov (1-2,4-5,7-14,16-19,25-
27,30)
262
Valley Import 0 0 0
0
15
ERCOT Public December 12-13, 2011

12
Advisories and Watches in November 2011
• Advisories issued for Physical Responsive Capability (PRC) below 3000 MW. – Issued 4 Days
• Watches issued for Physical Responsive Capability (PRC) below 2500 MW. – None
• Transmission Watches – November 23th ERCOT issued a Transmission Watch for Wilbarger County for voltage stability due to the outage of
the Bowman Switch – Fisher road 345 KV line. – November 28th ERCOT issued a Transmission Watch due to a large change in the North – Houston interface limit
due to the outage of the TH Wharton – Zenith 345 KV line.
• Energy Emergency Alerts – None
ERCOT Public December 12-13, 2011

13
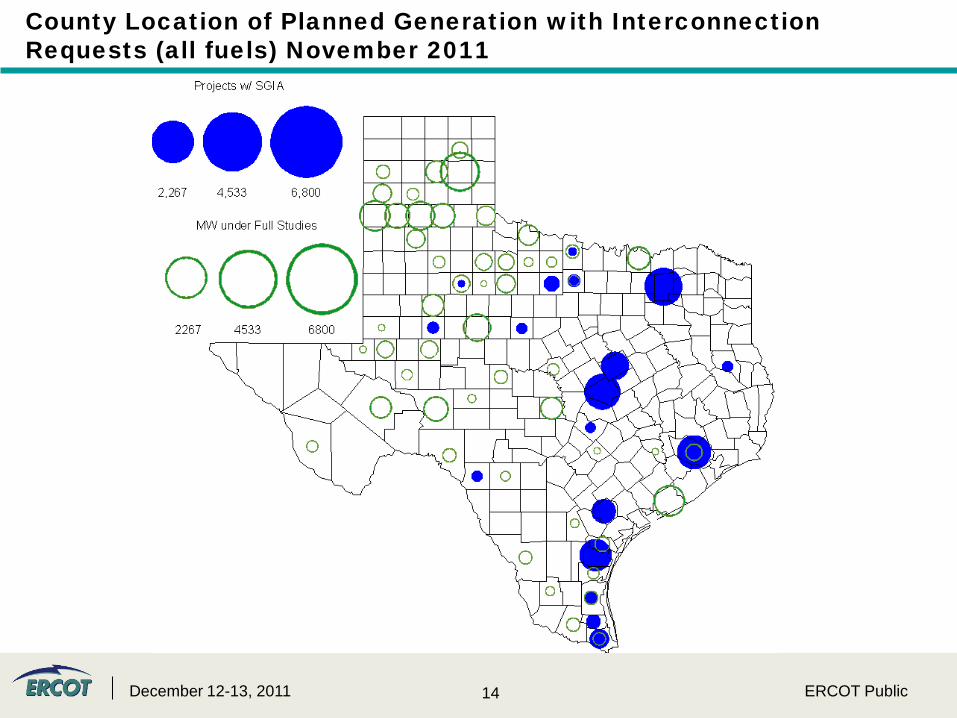
Planning Summary
• A comprehensive review by Transmission Service Providers of the status of each of their assigned generation interconnection studies has been completed. ERCOT has incorporated the results of this review into this month’s report.
• The details of this review will be covered as part of the CDR/SARA presentation.
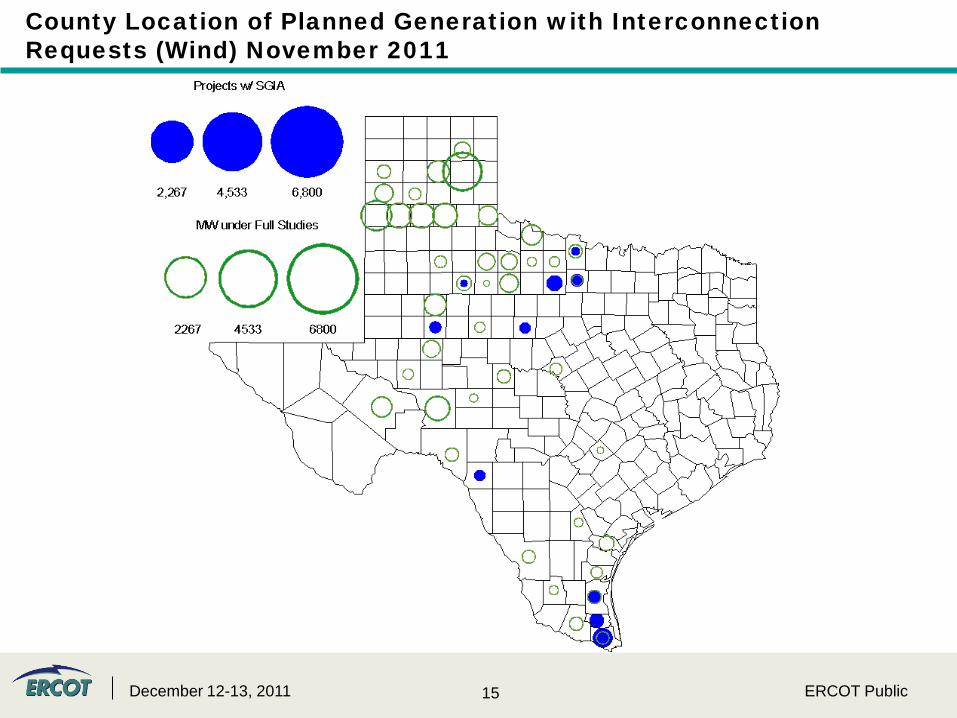
• ERCOT is currently tracking 136 active generation interconnection requests
totaling over 38,000 MW. This includes over 19,000 MW of wind generation.
• Study has been suspended on 41 generation projects with a nameplate capacity totaling over 18,000 MW.
• ERCOT is currently reviewing proposed transmission improvements with a total cost of $162.5 Million.
• Transmission Projects endorsed in 2011 total $594.9 Million.
December 12-13, 2011 ERCOT Public
14
County Location of Planned Generation with Interconnection Requests (all fuels) November 2011
December 12-13, 2011 ERCOT Public
15
County Location of Planned Generation with Interconnection Requests (Wind) November 2011
December 12-13, 2011 ERCOT Public
16
Wind Generation
150
1,433 1,635 1,755
116
816 977 1,173
1,385 1,854
2,875
4,785
8,005
8,916
9,400 9,754
11,025 11,227 11,347
0
2,000
4,000
6,000
8,000
10,000
12,000
2000 2001 2002 2003 2004 2005 2006 2007 2008 2009 2010 2011 2012 2013 2014
MWCumulative MW Installed
Cumulative Planned (Signed Interconnection Agreement)
ERCOT Wind Installations by Year (as of November 30, 2011)
The data presented here is based upon the latest registration data provided to ERCOT by the resource owners and can change without notice. Any capacity changes will be reflected in current and subsequent years' totals. Scheduling delays will also be reflected in the planned projects as that information is received.
This chart now reflects planned units in calendar year of installation rather than installation by peak of year shown
December 12-13, 2011 ERCOT Public

17
Generation Interconnection Study Activity by Fuel
0
50
100
150
200
250
300
0
20,000
40,000
60,000
80,000
100,000
120,000
Jan-
06Fe
b-06
Mar
-06
Apr-
06M
ay-0
6Ju
n-06
Jul-0
6Au
g-06
Sep-
06O
ct-0
6N
ov-0
6D
ec-0
6Ja
n-07
Feb-
07M
ar-0
7Ap
r-07
May
-07
Jun-
07Ju
l-07
Aug-
07Se
p-07
Oct
-07
Nov
-07
Dec
-07
Jan-
08Fe
b-08
Mar
-08
Apr-
08M
ay-0
8Ju
n-08
Jul-0
8Au
g-08
Sep-
08O
ct-0
8N
ov-0
8D
ec-0
8Ja
n-09
Feb-
09M
ar-0
9Ap
r -09
May
-09
Jun-
09Ju
l-09
Aug-
09Se
p-09
Oct
-09
Nov
-09
Dec
-09
Jan-
10Fe
b-10
Mar
-10
Apr-
10M
ay-1
0Ju
n-10
Jul-1
0Au
g-10
Sep -
10O
ct-1
0N
ov-1
0D
ec-1
0Ja
n-11
Feb -
11M
ar-1
1Ap
r-11
May
-11
Jun-
11Ju
l-11
Aug-
11Se
p-11
Oct
-11
Nov
-11
Proj
ect C
ount
MW
Cap
acity
MW Natural Gas MW Nuclear MW Coal MW Wind MW Solar * MW Biomass * MW Other Total # Projects # Projects Cancelled
* Prior to September 2008, Category "Other" included "Solar" and "Biomass"Projects in all phases of interconnection study are reflected in this graphProject cancellation tracking by month began in March 2008
Note: Suspended Projects are not included in this chart
December 12-13, 2011 ERCOT Public

18
Generation Interconnection Study Activity by Project Phase
0
20,000
40,000
60,000
80,000
100,000
120,000
0
50
100
150
200
250
300
350
400
Jan-
06Fe
b-06
Mar
-06
Apr
-06
May
-06
Jun-
06Ju
l-06
Aug
-06
Sep
-06
Oct
-06
Nov
-06
Dec
-06
Jan -
07Fe
b-07
Mar
-07
Apr
-07
May
-07
Jun-
07Ju
l-07
Aug
-07
Sep
-07
Oct
-07
Nov
-07
Dec
-07
Jan-
08Fe
b-08
Mar
-08
Apr
-08
May
-08
Jun-
08Ju
l-08
Aug
-08
Sep
-08
Oct
-08
Nov
-08
Dec
-08
Jan-
09Fe
b-09
Mar
-09
Apr
-09
May
-09
Jun-
09Ju
l-09
Aug
-09
Sep
-09
Oct
-09
Nov
-09
Dec
-09
Jan-
10Fe
b-10
Mar
-10
Apr
-10
May
-10
Jun-
10Ju
l-10
Aug
-10
Sep
-10
Oct
-10
Nov
-10
Dec
-10
Jan-
11Fe
b-11
Mar
-11
Apr
-11
May
-11
Jun-
11Ju
l-11
Aug
-11
Sep
-11
Oct
-11
Nov
-11
MW
Cap
acity
Proj
ect C
ount
# In-Service ** # Signed Interconnect Agreement # Projects Cancelled *** # Full Study Suspended
# Completed Full Study # in Full Study # Screening Study Complete # Initial Screening Study
MW Capacity Under Study * MW In Commercial Operation **
* Nameplate capacity will change across time due to additional projects, cancellations, expirations, adjustments from study results, and projects being placed in service.
** Having begun commercial operation since January 2006
*** Began tracking cancellations by month in March 2008
December 12-13, 2011 ERCOT Public
19
Winter Preparedness 2011
• Fuel Oil Status: – 49 units with 7,371 MW of generation have distillate or residual fuel oil
stored for the upcoming winter (18% of gas generation). – 36 units with 3000 MW can operate on 100% fuel oil at maximum capacity
for 2 days or more in case of Level 3 or total natural gas restrictions.
• Winter 2011 preparations – ERCOT has requested all generators provide an affidavit confirming
completion of winter weatherization by December 1, 2011. – ERCOT has reviewed Emergency Operations Plans for resources including
weatherization. – ERCOT has begin spot audits of winter preparedness and weatherization in
which it will perform site visits to review preparation. – ERCOT winter storm drill was conducted November 30 – December 1st with
42 QSEs and 16 Transmission Operators participating, involving a scenario similar to the February 2nd 2011 freeze event.
ERCOT Public December 12-13, 2011

20
Fuel Oil Backup – Winter 2011
December 12-13, 2011 ERCOT Public
21 ERCOT Public
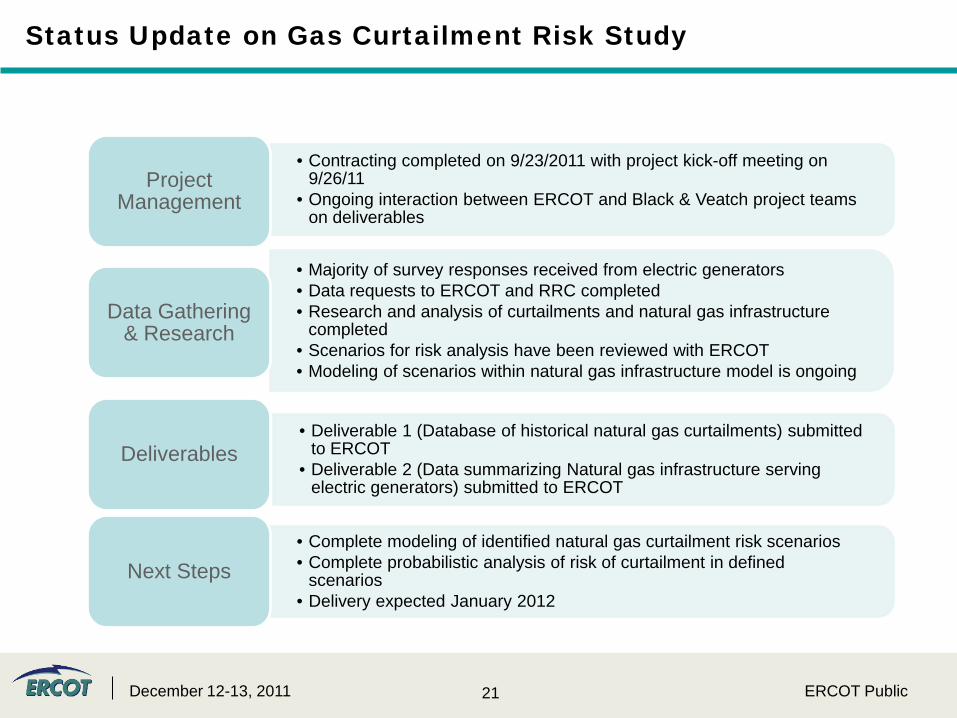
Status Update on Gas Curtailment Risk Study
December 12-13, 2011
• Contracting completed on 9/23/2011 with project kick-off meeting on 9/26/11
• Ongoing interaction between ERCOT and Black & Veatch project teams on deliverables
Project Management
• Majority of survey responses received from electric generators • Data requests to ERCOT and RRC completed • Research and analysis of curtailments and natural gas infrastructure
completed • Scenarios for risk analysis have been reviewed with ERCOT • Modeling of scenarios within natural gas infrastructure model is ongoing
Data Gathering & Research
• Deliverable 1 (Database of historical natural gas curtailments) submitted to ERCOT
• Deliverable 2 (Data summarizing Natural gas infrastructure serving electric generators) submitted to ERCOT
Deliverables
• Complete modeling of identified natural gas curtailment risk scenarios • Complete probabilistic analysis of risk of curtailment in defined
scenarios • Delivery expected January 2012
Next Steps

22
Drought Effect on Generation Update
• ERCOT has been periodically surveying generators during and since the summer to monitor the effect of drought on generation availability
• Based on most recent survey: – Current unavailability due to drought is only 24 MW
– If East Texas receives half of it’s normal winter/spring rainfall,
unavailability could go up to 434 MW by May
– If no significant rainfall received, unavailability is estimated to be as much as 3,044 MW by May
– Approximately 11,464 MW is dependent on water rights from sources at historically low levels
ERCOT Public December 12-13, 2011

23
Follow-up on Drought Effects
• Units which had informed ERCOT of concerns about drought impact upon operations have taken steps to improve physical access to water.
• TCEQ has notified ERCOT that it does not anticipate curtailing water rights to generation facilities.
• After discussion with TCEQ staff, ERCOT has concluded that additional analysis of physical limitations to surface water access for large power plants that are dependent upon surface water would be beneficial.
• ERCOT is preparing a second survey to gather information on generator water intake elevations, relevant lake elevations, etc. to perform basic projections of potential water access limitations for plants larger than 100 MW that utilize significant amounts of water.
December 12-13, 2011 ERCOT Public

24
Black Start Service Resource Qualification Testing
• Once selected as preliminary Black Start resource, each Black Start resource needs to perform and pass the test requirements outlined in Nodal Protocol Section 8.1.1.2.1.5. – Verify control communication path performance; – Verify primary and alternate voice circuits for receipt instructions; – Perform the “Basic Starting Test” – ability of the BSS Resource to start
itself without support from the ERCOT System; done annually – Perform the “Line-Energizing Test” – energizing transmission by the BSS
Resource; test valid for 3 years – Perform the “Load-Carrying Test” – must be able to supply power to load
and be stable for at least 30 minutes; done at least once every 5 years – Perform the “Next Start Resource Test” – ability to start up the next start
unit’s largest motor while remaining stable; test is repeated if a new next start unit is selected
December 12-13, 2011 ERCOT Public

25
Black Start Service Resource On-going Testing
• Protocol Section 3.14.2(4) allows ERCOT to schedule random testing or simulation, or both, to verify BSS is operable according to the ERCOT System restoration plan. Testing and verification must be done under established qualification criteria.
• Recently approved PRR 369 allows ERCOT to perform a Black Start Resource Availability Test on a quarterly basis unless the Black Start Resource successfully started and operated at its LSL or higher for at least 4 consecutive Settlement Intervals during the quarter.
• Black Start Resources that fail a quarterly Black Start Resource Availability Test are required to immediately update Availability Plans to show zero availability and will not receive Hourly Standby Fees for BSS effective the date of the failed test.
• The Black Start Resource may schedule a second test subject to ERCOT approval. If the second test is passed payment resumes.
• If the second test is failed the Black Start Resource is disqualified and ERCOT shall claw-back payments made since the Black Start Resources last successful test.
December 12-13, 2011 ERCOT Public