aviation forecastsbusiness.zlcms.com/core/files/business/uploads/files/master plan...general...
TRANSCRIPT

Spokane International Airport Master Plan (March 2014) 2-1
fgffgg
2.0 OVERVIEW
This chapter contains aviation activity forecasts for Spokane International Airport over a 20-year planning
horizon. Aviation demand forecasts are an important step in the master planning process. Ultimately,
they form the basis for future demand-driven improvements at the Airport, they provide data from which
to estimate future off airport impacts such as noise and traffic, and they are often incorporated by
reference into other studies and policy decisions. This chapter, which presents aviation activity forecasts
through 2030, is organized as follows:
1. Overview
2. Forecasting Approach
3. Airline Passenger Forecasts
4. Airline Operations Forecasts
5. Enplaned/Deplaned Cargo and Mail Forecasts
6. All Cargo Operations Forecasts
7. Based Aircraft Forecasts
8. Based Aircraft Fleet Mix
9. General Aviation Operations Forecasts
10. Instrument Operations Forecasts
11. Military Operations Forecasts
12. Peak Passenger Activity and Operations Forecasts
13. Forecast Summary and TAF Comparison
14. 50-Year Forecast
The Federal Aviation Administration’s
(FAA) National Plan of Integrated
Airport Systems (NPIAS) categorizes
Spokane International Airport as a
“Primary Small Hub Airport.” The NPIAS
defines a Primary Small Hub Airport as a
commercial service airport that enplanes
0.05 percent to 0.25 percent of total US
Passengers enplanements. The 2011-
2015 NPIAS reported that there are 72
small hub airports that together account
for 8% of all enplanements nationwide.
The NPIAS identifies existing and
proposed airports that are significant to
the national air transportation system. It
contains estimates of costs of airport
development projects eligible for federal
aid that are needed to meet aviation
demand over the next five years.
C H A P T E R 2
Aviation Forecasts
CHAPTER 2 AVIATION ACTIVITY FORECASTS
2-2 Spokane International Airport Master Plan (March 2014)
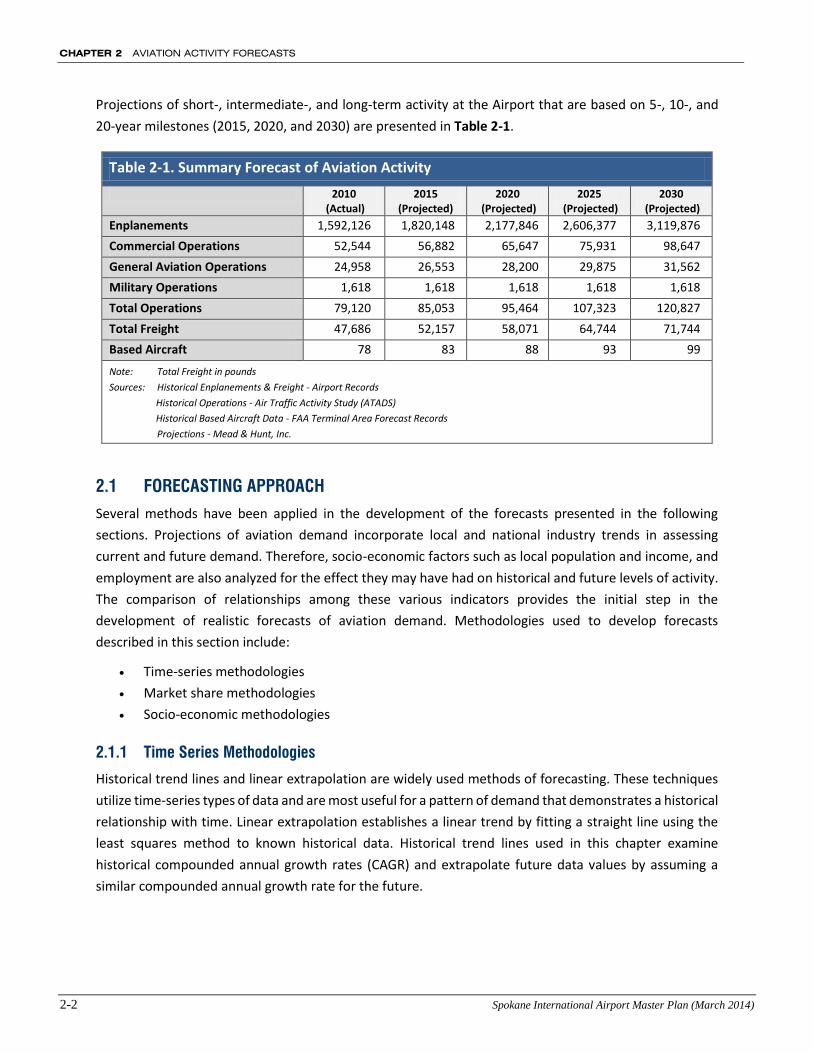
Projections of short-, intermediate-, and long-term activity at the Airport that are based on 5-, 10-, and
20-year milestones (2015, 2020, and 2030) are presented in Table 2-1.
Table 2-1. Summary Forecast of Aviation Activity
2010 (Actual)
2015 (Projected)
2020 (Projected)
2025 (Projected)
2030 (Projected)
Enplanements 1,592,126 1,820,148 2,177,846 2,606,377 3,119,876
Commercial Operations 52,544 56,882 65,647 75,931 98,647
General Aviation Operations 24,958 26,553 28,200 29,875 31,562
Military Operations 1,618 1,618 1,618 1,618 1,618
Total Operations 79,120 85,053 95,464 107,323 120,827
Total Freight 47,686 52,157 58,071 64,744 71,744
Based Aircraft 78 83 88 93 99
Note: Total Freight in pounds
Sources: Historical Enplanements & Freight - Airport Records
1. Historical Operations - Air Traffic Activity Study (ATADS)
2. Historical Based Aircraft Data - FAA Terminal Area Forecast Records
3. Projections - Mead & Hunt, Inc.
2.1 FORECASTING APPROACH
Several methods have been applied in the development of the forecasts presented in the following
sections. Projections of aviation demand incorporate local and national industry trends in assessing
current and future demand. Therefore, socio-economic factors such as local population and income, and
employment are also analyzed for the effect they may have had on historical and future levels of activity.
The comparison of relationships among these various indicators provides the initial step in the
development of realistic forecasts of aviation demand. Methodologies used to develop forecasts
described in this section include:
Time-series methodologies
Market share methodologies
Socio-economic methodologies
2.1.1 Time Series Methodologies
Historical trend lines and linear extrapolation are widely used methods of forecasting. These techniques
utilize time-series types of data and are most useful for a pattern of demand that demonstrates a historical
relationship with time. Linear extrapolation establishes a linear trend by fitting a straight line using the
least squares method to known historical data. Historical trend lines used in this chapter examine
historical compounded annual growth rates (CAGR) and extrapolate future data values by assuming a
similar compounded annual growth rate for the future.

AVIATION ACTIVITY FORECASTS CHAPTER 2
Spokane International Airport Master Plan (March 2014) 2-3
2.1.2 Market Share Methodology
Market share, ratio, or top-down models compare local levels of activity with a larger entity. Such
methodologies imply that the proportion of activity that can be assigned to the local level is a regular and
predictable quantity. This method has been used extensively in the aviation industry to develop forecasts
for the local level. It is most commonly used to determine the share of total national traffic activity that
will be captured by a particular region or airport. Historical data is examined to determine the ratio of
local airport traffic to total national traffic. The FAA develops national forecasts annually in its FAA
Aerospace Forecasts document. This data source is compared with historical levels of activity reported by
Spokane International Airport.
2.1.3 Socioeconomic Methodologies
Though trend line extrapolation and market share analysis may provide mathematical and formulaic
justification for demand projections, there are many factors beyond historical levels of activity that may
identify trends in aviation and impact on aviation demand locally. Socio-economic or correlation analysis
examines the direct relationship between two or more sets of historical data. Local conditions that are
examined in this chapter include population, per capita income, and total retail sales. Based upon the
observed and projected correlation between historical aviation activity and the socio-economic data sets,
future aviation activity projections are developed.
2.2 AIRLINE PASSENGER FORECASTS
Enplanements are defined as the activity of passengers boarding commercial service aircraft that depart
an airport. Enplanements include passengers on scheduled commercial service aircraft or un-scheduled
charter aircraft but not the airline crew.
Passenger enplanement data is provided to Airport management by commercial passenger service
carriers, who maintain data as they transport people to and from the facility. The FAA has estimated
figures on file called Terminal Area Forecasts (TAF) that are compared with the projections developed for
this Master Plan.
Forecasts that are developed for airport master plans and/or federal grants must be approved by the FAA.
It is the FAA’s policy, listed in AC 150/5070-6B, Airport Master Plans, that FAA approval of forecasts at
non-hub airports with commercial service should be consistent with the TAF. Master plan forecasts for
operations, based aircraft, and enplanements are considered to be consistent with the TAF if they meet
the following criteria:
a) Forecasts differ by less than 10 percent in the five-year forecast and 15 percent in the 10-year or
20-year period, or
b) Forecasts do not affect the timing or scale of an airport project, or
c) Forecasts do not affect the role of the airport as defined in the current version of FAA Order
5090.3, Field Formulation of the National Plan of Integrated Airport Systems.

CHAPTER 2 AVIATION ACTIVITY FORECASTS
2-4 Spokane International Airport Master Plan (March 2014)
This section examines data that pertains to passenger enplanements and describes enplanement
projections in the following subsections:
Enplanement history
FAA TAF enplanement data and projections
Method comparison and preferred projection methodology
Other forecasts have been examined and incorporated as part of this Master Plan Update such as the FAA
Terminal Aerospace Forecasts and the Long-Term Transportation Study (LATs) conducted by the State Of
Washington.
2.2.1 Enplanement History
Between 2000 and 2010, passenger enplanements at
Spokane International Airport have fluctuated (see
Table 2-2). Within this timeframe, annual passenger
enplanements have increased slightly from 1,530,884
to 1,592,126 a Compounded Annual Growth Rate
(CAGR) of 0.39 percent.
2.2.2 Federal Aviation Administration Forecast
The FAA records passenger enplanements for all
commercial service airports and releases its Terminal
Area Forecasts (TAF) annually. It should be noted that
annual data are based on the fiscal year rather than the
calendar year, so historical figures differ slightly from
the Airport’s records. The FAA’s historical records and
projections of passenger enplanements are shown in
Table 2-3.
Table 2-2. Passenger Enplanement History
Year Passenger Enplanements
2000 1,530,884
2001 1,441,356
2002 1,375,500
2003 1,395,268
2004 1,531,927
2005 1,600,258
2006 1,612,457
2007 1,739,883
2008 1,715,773
2009 1,527,955
2010 1,592,126
CAGR 2000-2010 0.39%
Notes: CAGR=Compounded Annual Growth Rate Source: Airport Records

AVIATION ACTIVITY FORECASTS CHAPTER 2
Spokane International Airport Master Plan (March 2014) 2-5
As shown in Table 2-3, the FAA projects strong, steady
growth in passenger enplanements at Spokane
International Airport through 2030. The TAF predicts
1,820,148 passenger enplanements in 2015, 2,177,846
in 2020, 2,606,377 in 2025, and 3,119,876 in 2030, a
CAGR of 3.42 percent.
2.2.3 Method Comparison and Preferred
Projection Methodology
In all, six methodologies were employed to develop
projections of passenger enplanements. These
methodologies are described in the following sections:
Trend Line Methodology
The trend line methodology is based on the assumption
that future trends will continue to mimic those of the
selected time period and that the factors that affect
those trends will continue to influence demand levels in
similar fashion. The establishment of a linear trend line
with historical data using the least squares
methodology typically serves as a baseline projection to
which other methodologies are compared.
Table 2-3. FAA Passenger Enplanements Terminal Area Forecast
Year Passenger Enplanements
2000 1,533,121
2001 1,469,518
2002 1,337,148
2003 1,362,770
2004 1,474,422
2005 1,565,505
2006 1,597,906
2007 1,689,153
2008 1,740,623
2009 1,492,710
2010 1,524,569
CAGR 2000-2010 -0.06%
2015 1,820,148
2020 2,177,846
2025 2,606,377
2030 3,119,876
CAGR 2010-2030 3.42%
Source: FAA Terminal Area Forecast May, 2011

CHAPTER 2 AVIATION ACTIVITY FORECASTS
2-6 Spokane International Airport Master Plan (March 2014)
Airport records for passenger enplanements are available from 1990 to 2010. During this time period,
annual passenger enplanements increased from 808,107 to 1,592,126, a CAGR of 3.45 percent. To project
future demand, a linear trend line is established using the least squares methodology and results in
1,967,035 passenger enplanements in 2015, 2,147,556 in 2020, 2,328,077 in 2025, and 2,508,597 in 2030,
a CAGR of 2.39 percent (see Table 2-4).
Table 2-4. Passenger Enplanement Forecasts Trend Line Methodology
Year Passenger Enplanements
1990 808,107
1991 795,080
1992 926,838
1993 1,167,865
1994 1,345,267
1995 1,492,956
1996 1,629,620
1997 1,519,386
1998 1,472,208
1999 1,519,836
2000 1,530,884
2001 1,441,356
2002 1,375,500
2003 1,395,268
2004 1,531,927
2005 1,600,258
2006 1,612,457
2007 1,739,883
2008 1,715,773
2009 1,527,955
2010 1,592,126
CAGR 1990-2010 3.45%
2015 1,967,035
2020 2,147,556
2025 2,328,077
2030 2,508,597
CAGR 2010-2030 2.30%
Source: Airport Records, Mead and Hunt

AVIATION ACTIVITY FORECASTS CHAPTER 2
Spokane International Airport Master Plan (March 2014) 2-7
Growth Rate Methodology
The growth rate methodology examines the percent change in activity between two points in time, and
assumes that future activity will change at this rate throughout the projection period. As noted previously,
there was a 3.45 percent annual increase in passenger activity between 1990 and 2010. This compound
annual growth rate is applied through years 2015, 2020, 2025, and 2030 and shown in Table 2-5.
As shown in Table 2-5, the growth rate
methodology projects 1,872,678 passenger
enplanements in 2015, 2,218,658 in 2020,
2,628,557 in 2025, and 3,114,186 in 2030.
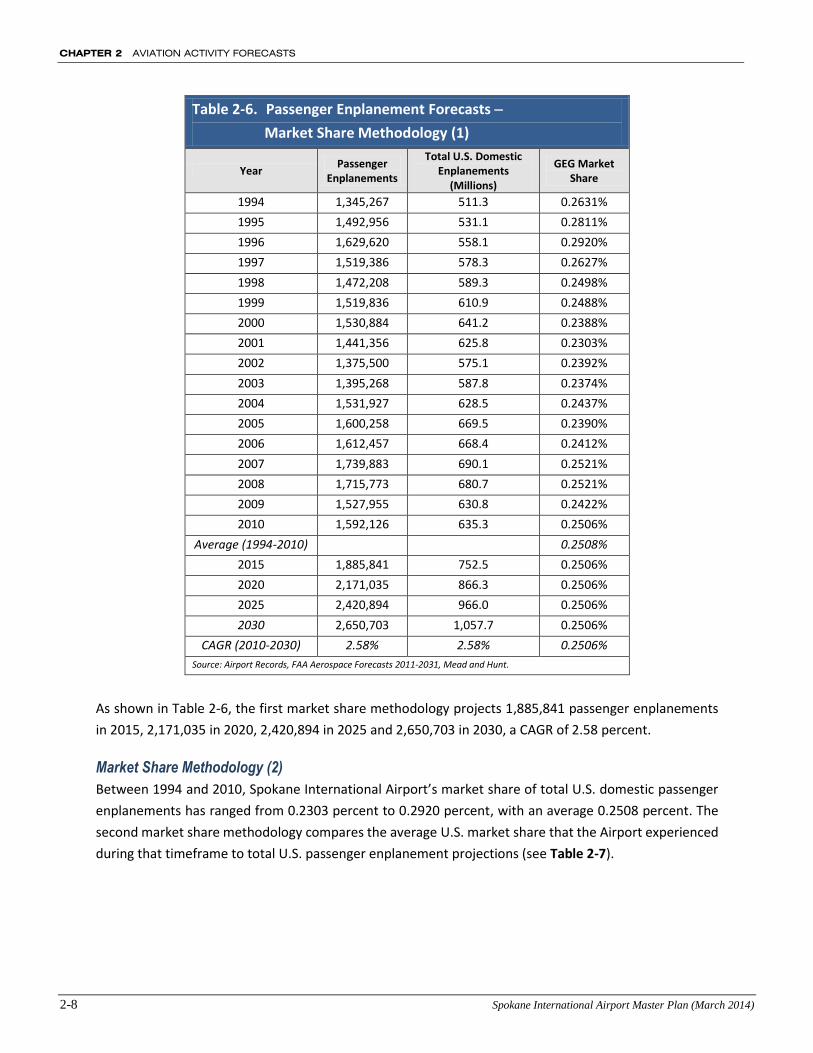
Market Share Methodology (1)
Market share methodology compares activity
levels at an airport to a larger geographical
region as a whole over a given length of time.
For the purposes of this Master Plan, two
market share methodology forecasts have been
developed that compare activity at Spokane
International Airport with total U.S. domestic
enplanements. U.S. enplanement data are
available dating to 1994. The first market share
methodology applies the Airport’s market
share in 2010 (0.2506 percent) to projections of
total U.S. domestic enplanement projections
described in the FAA Aerospace Forecasts 2011-
2031 (see Table 2-6).
Table 2-5. Passenger Enplanement Forecasts - Growth Rate Methodology
Year Passenger
Enplanements Growth Rate
1990 808,107
1991 795,080 -1.61%
1992 926,838 16.57%
1993 1,167,865 26.01%
1994 1,345,267 15.19%
1995 1,492,956 10.98%
1996 1,629,620 9.15%
1997 1,519,386 -6.76%
1998 1,472,208 -3.11%
1999 1,519,836 3.24%
2000 1,530,884 0.73%
2001 1,441,356 -5.85%
2002 1,375,500 -4.57%
2003 1,395,268 1.44%
2004 1,531,927 9.79%
2005 1,600,258 4.46%
2006 1,612,457 0.76%
2007 1,739,883 7.90%
2008 1,715,773 -1.39%
2009 1,527,955 -10.95%
2010 1,592,126 4.20%
CAGR (1990-2010) 3.45%
2015 1,872,678 3.45%
2020 2,218,658 3.45%
2025 2,628,557 3.45%
2030 3,114,186 3.45%
CAGR (2010-2030) 3.41%
Source: Airport Records, Mead and Hunt
CHAPTER 2 AVIATION ACTIVITY FORECASTS
2-8 Spokane International Airport Master Plan (March 2014)
Table 2-6. Passenger Enplanement Forecasts
Market Share Methodology (1)
Year Passenger
Enplanements
Total U.S. Domestic Enplanements
(Millions)
GEG Market Share
1994 1,345,267 511.3 0.2631%
1995 1,492,956 531.1 0.2811%
1996 1,629,620 558.1 0.2920%
1997 1,519,386 578.3 0.2627%
1998 1,472,208 589.3 0.2498%
1999 1,519,836 610.9 0.2488%
2000 1,530,884 641.2 0.2388%
2001 1,441,356 625.8 0.2303%
2002 1,375,500 575.1 0.2392%
2003 1,395,268 587.8 0.2374%
2004 1,531,927 628.5 0.2437%
2005 1,600,258 669.5 0.2390%
2006 1,612,457 668.4 0.2412%
2007 1,739,883 690.1 0.2521%
2008 1,715,773 680.7 0.2521%
2009 1,527,955 630.8 0.2422%
2010 1,592,126 635.3 0.2506%
Average (1994-2010) 0.2508%
2015 1,885,841 752.5 0.2506%
2020 2,171,035 866.3 0.2506%
2025 2,420,894 966.0 0.2506%
2030 2,650,703 1,057.7 0.2506%
CAGR (2010-2030) 2.58% 2.58% 0.2506%
Source: Airport Records, FAA Aerospace Forecasts 2011-2031, Mead and Hunt.
As shown in Table 2-6, the first market share methodology projects 1,885,841 passenger enplanements
in 2015, 2,171,035 in 2020, 2,420,894 in 2025 and 2,650,703 in 2030, a CAGR of 2.58 percent.
Market Share Methodology (2)
Between 1994 and 2010, Spokane International Airport’s market share of total U.S. domestic passenger
enplanements has ranged from 0.2303 percent to 0.2920 percent, with an average 0.2508 percent. The
second market share methodology compares the average U.S. market share that the Airport experienced
during that timeframe to total U.S. passenger enplanement projections (see Table 2-7).

AVIATION ACTIVITY FORECASTS CHAPTER 2
Spokane International Airport Master Plan (March 2014) 2-9
Table 2-7. Passenger Enplanement Forecasts Market Share Methodology (2)
Year Passenger
Enplanements
Total U.S. Domestic Enplanements
(Millions) GEG Market Share
1994 1,345,267 511.3 0.2631%
1995 1,492,956 531.1 0.2811%
1996 1,629,620 558.1 0.2920%
1997 1,519,386 578.3 0.2627%
1998 1,472,208 589.3 0.2498%
1999 1,519,836 610.9 0.2488%
2000 1,530,884 641.2 0.2388%
2001 1,441,356 625.8 0.2303%
2002 1,375,500 575.1 0.2392%
2003 1,395,268 587.8 0.2374%
2004 1,531,927 628.5 0.2437%
2005 1,600,258 669.5 0.2390%
2006 1,612,457 668.4 0.2412%
2007 1,739,883 690.1 0.2521%
2008 1,715,773 681.3 0.2519%
2009 1,527,955 631.3 0.2420%
2010 1,592,126 635.3 0.2506%
Average (1994-2010) 0.2508%
2015 1,887,533 752.5 0.2508%
2020 2,172,983 866.3 0.2508%
2025 2,423,066 966.0 0.2508%
2030 2,653,082 1,057.7 0.2508%
CAGR (2010-2030) 2.59% 2.58% 0.2508%
Source: Airport Records, Terminal Aerospace Forecasts 2010-2030, Mead and Hunt.
As shown in Table 2-7, the second market share methodology projects 1,887,533 passenger enplanements
in 2015, 2,172,983 in 2020, 2,423,066 in 2025 and 2,653,082 in 2030, a CAGR of 2.59 percent.
Socioeconomic Methodology – Population Variable
Local population can be a strong indicator of commercial aviation demand, particularly at small hub and
non-hub airports. The socioeconomic population variable methodology compares historical population
figures to passenger enplanements. Between 2000 and 2010, the population of Spokane County increased
from 427,083 to 474,627 a CAGR of 1.26 percent. Passenger enplanements increased by a CAGR of 0.39
percent during that timeframe. The average number of annual per capita enplanements from 2000-2010
was 3.493. This figure is applied to population projections provided by Woods and Poole and projects
1,764,119 passenger enplanements in 2015, 1,873,543 in 2020, 1,984,832 in 2025, and 2,096,938 in 2030,
a CAGR of 1.39 percent (see Table 2-8).

CHAPTER 2 AVIATION ACTIVITY FORECASTS
2-10 Spokane International Airport Master Plan (March 2014)
Table 2-8. Passenger Enplanement Forecasts Socioeconomic Methodology-Population Variable
Year Passenger
Enplanements Spokane County
Population Enplanements Per
Capita
2000 1,530,884 418,806 3.655
2001 1,441,356 422,780 3.409
2002 1,375,500 427,083 3.221
2003 1,395,268 430,991 3.237
2004 1,531,927 435,225 3.520
2005 1,600,258 440,431 3.633
2006 1,612,457 446,932 3.608
2007 1,739,883 456,004 3.815
2008 1,715,773 462,677 3.708
2009 1,527,955 468,635 3.260
2010 1,592,126 474,627 3.354
Average (2000-2010) 3.493
2015 1,764,119 505,051 3.493
2020 1,873,543 536,378 3.493
2025 1,984,832 568,239 3.493
2030 2,096,938 600,334 3.493
CAGR (2010-2030) 1.39% 1.18%
Source: Airport Records, Woods & Poole, Inc. Mead and Hunt.
Socioeconomic Methodology – Income Variable
Another socioeconomic factor that was examined was local income. Local economic conditions can impact
levels of passenger activity. It is assumed that one’s propensity toward air travel can be partially linked
with available income. Between 2000 and 2010, per capita income in Spokane County has increased from
$11,804 to $14,120, a CAGR of 1.81 percent. Enplanements per $1 of income have fluctuated during this
time period, therefore, the 2000-2010 average of 122.163 passenger enplanements per $1 of income is
applied to income projections supplied by Woods & Poole Economics, Inc. This methodology projects
1,940,354 passenger enplanements in 2015, 2,183,984 in 2020, 2,458,364 in 2025, and 2,765,747 in 2030,
a CAGR of 2.80 percent (see Table 2-9).
It should be noted that income figures are presented in 2004 dollars. These are “constant” dollars and
are used to measure the “real” change in earnings and income when inflation is taken into account.
Table 2-9. Passenger Enplanement Forecasts Socioeconomic Methodology-Income Variable

AVIATION ACTIVITY FORECASTS CHAPTER 2
Spokane International Airport Master Plan (March 2014) 2-11
Year Passenger
Enplanements
Spokane County Per Capita Income
($2004)
Enplanements Per $1 Income
2000 1,530,884 $11,804 129.687
2001 1,441,356 $11,765 122.508
2002 1,375,500 $11,844 116.136
2003 1,395,268 $11,956 116.704
2004 1,531,927 $12,184 125.737
2005 1,600,258 $12,323 129.864
2006 1,612,457 $12,904 124.956
2007 1,739,883 $13,451 129.353
2008 1,715,773 $13,662 125.584
2009 1,527,955 $13,827 110.508
2010 1,592,126 $14,120 112.756
Average (2000-2010) 123.104
2015 1,940,354 $15,883 122.163
2020 2,183,984 $17,878 122.163
2025 2,458,364 $20,124 122.163
2030 2,765,747 $22,640 122.163
CAGR (2010-2030) 2.80% 2.39%
Source: Airport Records, Woods & Poole, Inc. Mead and Hunt.
Preferred Projection Methodology
A comparison of projected enplanements using the methodologies described in previous sections is
shown in Table 2-10 and Chart 2-1. All of the methodologies anticipate that there will be an increase in
passenger demand over the next 30 years.
The FAA develops forecasts based on economic and political factors, as well as local, regional, and national
aviation industry trends. Spokane International Airport experienced 1,739,883 passenger enplanements
in 2007, an all-time record; but by 2010, enplanements at the Airport decreased by approximately nine
percent. Each of the methodologies examined to project levels of passenger activity showed an increase
in future enplanements, however, the recent decline in activity largely associated with national economic
volatility impacts some of the formulas that are used to develop these forecasts. Many could be
considered somewhat conservative when compared with projections of passenger demand developed by
the FAA, therefore, the preferred forecast for passenger enplanements is the TAF.

CHAPTER 2 AVIATION ACTIVITY FORECASTS
2-12 Spokane International Airport Master Plan (March 2014)
Table 2-10. Passenger Enplanement Forecasts Projection Comparison and Preferred Methodology
Year Passenger
Enplanements
2000 1,530,884
2001 1,441,356
2002 1,375,500
2003 1,395,268
2004 1,531,927
2005 1,600,258
2006 1,612,457
2007 1,739,883
2008 1,715,773
2009 1,527,955
2010 1,592,126
CAGR (2000-2010) 0.39%
Year FAA TAF
Summary Trend Line
Methodology Growth Rate Methodology
Market Share Methodology 1
Market Share Methodology 2
Population Variable
Income Variable
2015 1,820,148 1,967,035 1,872,678 1,885,841 1,887,533 1,764,119 1,940,354
2020 2,177,846 2,147,556 2,218,658 2,171,035 2,172,983 1,873,543 2,183,984
2025 2,606,377 2,328,077 2,628,557 2,420,894 2,423,066 1,984,832 2,458,364
2030 3,119,876 2,508,597 3,114,186 2,650,703 2,653,082 2,096,938 2,765,747
CAGR (2010-2030) 3.42% 2.30% 3.41% 2.58% 2.59% 1.39% 2.80%
Source: Airport Records, Terminal Aerospace Forecasts 2010-2030, Woods & Poole, Inc. Mead and Hunt.

AVIATION ACTIVITY FORECASTS CHAPTER 2
Spokane International Airport Master Plan (March 2014) 2-13
2.3 AIRCRAFT OPERATIONS FORECASTS
The following sections describe projections of aircraft operations. As with passenger enplanements,
several factors are taken into account when assessing demand in both commercial and non-commercial
operations. Forecasts have been developed for the following categories:
Air Carrier Fleet Mix
Commercial Operations
General Aviation Operations
Air Cargo Fleet Mix
Air Cargo Operations
Military Operations
2.3.1 Air Carrier Fleet Mix
National trends in aviation demand have been volatile in recent years. The events that occurred on
9/11/2001 had a significant impact on collective national travel behavior, and the economic recession that
began in 2008 has resulted in fewer passenger enplanements at several airports in the U.S. With recent
increases in aircraft operating costs, airlines have been forced to maximize fleet efficiency in order to
remain profitable, if not sustainable.
In many markets, air carriers are reducing or retiring less fuel efficient aircraft with regional and larger jets
that have more seats and lower operational costs per passenger. This trend is evident at Spokane
International Airport as the average number of seats per commercial departure has increased from 96.7
in 2006 to 100.6 in 2010.
Table 2-11 presents the historical and projected scheduled passenger fleet. As shown in Table 2-11,
commercial aircraft equipped with 40 or fewer seats have seen the proportion of annual operations
decline from 14.2 percent to 5.1 percent during this time, while aircraft equipped with 61-99 seats have
seen an increase of 29.9 percent to 40.5 percent. It is anticipated that smaller passenger aircraft use at
the Airport will continue to decline throughout the projection period, resulting in a corresponding increase
in larger aircraft, particularly in aircraft equipped with 100 or more seats.

CHAPTER 2 AVIATION ACTIVITY FORECASTS
2-14 Spokane International Airport Master Plan (March 2014)
Table 2-11. Scheduled Passenger Departures and Fleet Mix Projections
Seat Range
Typical Aircraft Historical - Departures Projected Departures
2006 2007 2008 2009 2010 2015 2020 2025 2030
Less than
40
Saab 340, 328Jet, ERJ 135,
Beech 1900, EMB 120, DHC-8
3,063
14.2%
1,683
7.0%
1,331
5.6%
1,068
5.5%
1,078
5.1%
1,068
4.7%
954
3.6%
928
3.0%
903
2.5%
40-60 CRJ 200, ERJ145 1,567
7.3%
3,223
13.4%
2,960
12.5%
1,450
7.4%
1,721
8.2%
1,591
7.0%
1,564
5.9%
1,299
4.2%
903
2.5%
61-99 Avro RJ, CRJ 700, CRJ 900,
EMB 170, EMB 175
6,436
29.9%
7,979
33.1%
8,343
35.1%
7,440
38.1%
8,510
40.5%
9,093
40.0%
10,603
40.0%
12,310
39.8%
14,299
39.6%
100-130 B717, DC9, EMB 190,
EMB 170, A 319
1,312
6.1%
875
3.6%
1,336
5.6%
1,269
6.5%
1,124
5.3%
1,250
5.5%
1,617
6.1%
2,227
7.2%
2,889
8.0%
131-150 A 320, MD 80, B737-5 8,428
39.1%
9,268
38.5%
8,750
36.8%
7,324
37.5%
7,469
35.5%
8,365
36.8%
10,073
38.0%
12,093
39.1%
14,588
40.4%
150 or
more B 737-8, B737-9, B757
746
3.5%
1,072
4.4%
1,046
4.4%
966
4.9%
1,125
5.4%
1,364
6.0%
1,696
6.4%
2,072
6.7%
2,528
7.0%
Total Scheduled Passenger Departures 21,561 24,100 23,766 19,517 21,027 22,732 26,507 30,929 36,110
Source: Historical Scheduled Departures and Average Seat Data – apgData, Mead and Hunt.
2.3.2 Commercial Operations Projections
Commercial operations can be either scheduled or un-scheduled. Typically, un-scheduled commercial
flights are chartered flights or air taxi flights. In recent years, the proportion of un-scheduled operations
at Spokane International Airport has decreased.
Scheduled Commercial Passenger Operations Projections
As mentioned previously, airlines are trending toward using larger, more fuel efficient aircraft. In many
markets, the use of larger aircraft is reducing the frequency of particular routes. Because of increasing
fuel and operational costs, air carriers must maintain higher passenger load factors to remain profitable.
Projections of scheduled commercial operations are based on enplanement projections described in
Section 2.3. At Spokane International Airport, the average number of seats per aircraft departure is
anticipated to increase from 100.6 in 2010, to 102.0 in 2015, 104.0 in 2020, 106.0 in 2025, and 108.0 in
2030. Passenger load factor is also anticipated to increase throughout the projection period, from 75.3
percent in 2010 to 78.5 percent in 2015, 79.0 percent in 2020, 79.5 percent in 2025, and 80.0 percent in
2030.
To calculate future scheduled commercial operations, the average number of seats per departure at the
Airport is multiplied by the passenger load factor. Projected passenger enplanements are divided by this
figure to obtain scheduled commercial passenger departures. It is assumed that the number of annual
commercial departures and arrivals will be the same; therefore departures are multiplied by two to
calculate projected scheduled commercial operations (see Table 2-12). As shown, 45,464 scheduled
commercial operations are projected in 2015, 53,015 in 2020, 61,858 in 2025, and 72,219 in 2030, a CAGR
of 2.74 percent.

AVIATION ACTIVITY FORECASTS CHAPTER 2
Spokane International Airport Master Plan (March 2014) 2-15
Table 2-12. Scheduled Commercial Operations
Year Enplanements Scheduled Passenger
Departures
Average Seats per Departure
Passenger Load
Factor
Scheduled Commercial Operations
2006 1,612,457 21,561 96.7 77.4% 43,122
2007 1,739,883 24,100 97.3 74.2% 48,200
2008 1,715,773 23,766 97.9 73.8% 47,532
2009 1,527,955 19,517 101.2 77.3% 39,034
2010 1,592,126 21,027 100.6 75.3% 42,054
CAGR (2006-2010) -0.32% -0.63% -0.63%
2015 1,820,148 22,732 102.0 78.5% 45,464
2020 2,177,846 26,507 104.0 79.0% 53,015
2025 2,606,377 30,929 106.0 79.5% 61,858
2030 3,119,876 36,110 108.0 80.0% 72,219
CAGR (2010-2030) 3.42% 2.74% 2.74%
Sources: Historical Enplanements - Airport Records Historical Scheduled Air Carrier Dep's and Avg Seat Data-OAG Airline Schedules form apgDat (Oct 2010) Projections - Mead & Hunt, Inc.
Unscheduled Commercial Passenger Operations Projections
Unscheduled flights typically fall into the charter or air taxi category. The overall proportion of
nonscheduled operations at Spokane International Airport has declined from 9.3 percent in 2006 to 2.2
percent in 2010. Although the number of annual un-scheduled operations is anticipated to increase
throughout the projection period, the proportion of total operations is expected to continue to decline.
Demand for un-scheduled flights can hinge on several factors and can be difficult to project. Between
2006 and 2010, annual un-scheduled operations declined from 5,487 to 1,150. According to the FAA
Aerospace Forecasts 2010-2030, the projected annual growth rate of the national general aviation and air
taxi fleet is expected to be 0.9 percent. It is assumed that un-scheduled operations at Spokane
International Airport will reflect this national trend, therefore, this figure is applied to the 2010 level of
1,150 operations and held constant throughout the projection period (see Table 2-13).

CHAPTER 2 AVIATION ACTIVITY FORECASTS
2-16 Spokane International Airport Master Plan (March 2014)
Table 2-13. Unscheduled Aircraft Operations
Year Total
Commercial Operations
Un-Scheduled Operations
% Unscheduled
2006 58,879 5,487 9.3%
2007 64,206 5,986 9.3%
2008 62,672 5,274 8.4%
2009 51,819 3,477 6.7%
52,544 1,150 2.2%
CAGR (2006-2009) -14.1%
2015 51,774 1,203 2.3%
2020 59,960 1,258 2.1%
2025 69,502 1,315 1.9%
2030 80,621 1,376 1.7%
CAGR (2009-2030) 2.16% 0.90%
Source: Airport Records, Official Airline Guide (OAG), Air Traffic Activity Data System (ATADS), FAA Aerospace Forecasts 2011-2031, Mead and Hunt.
As shown in Table 2-13, unscheduled aircraft operations are expected to increase to 1,203 in 2015, 1,258
in 2020, 1,315 in 2025, and 1,376 in 2030.
2.4 ENPLANED/DEPLANED CARGO
Air cargo is carried by both commercial passenger service carriers and by commercial air cargo service
carriers that do not have passenger service. Cargo is typically categorized as either mail or freight. The
total tonnage of annual cargo at Spokane International Airport has fluctuated significantly between 1995
and 2010. However, the Airport’s market share compared to total U.S. revenue ton miles has remained
fairly consistent (see Table 2-14). During that timeframe, the Airport’s market share was 0.00039 percent,
which is held constant throughout the projection period. Total U.S. cargo projection data are obtained
from the FAA Aerospace Forecast 2011-2031. This methodology projects 52,157 tons of annual cargo in
2015, 58,071 in 2020, 64,623 in 2025, and 71,744 in 2030, a CAGR of 2.06 percent.

AVIATION ACTIVITY FORECASTS CHAPTER 2
Spokane International Airport Master Plan (March 2014) 2-17
Table 2-14. Forecasts of Air Cargo
Year Total Air Cargo at
GEG (tons) Total U.S. Air Cargo (revenue ton miles)
GEG Market Share
1995 42,799.7 12,415,700,000 0.00034%
1996 48,516.9 12,781,700,000 0.00038%
1997 54,703.5 13,454,100,000 0.00041%
1998 59,281.5 13,828,100,000 0.00043%
1999 66,563.3 13,974,900,000 0.00048%
2000 67,264.3 14,698,700,000 0.00046%
2001 54,246.7 13,937,900,000 0.00039%
2002 53,274.9 12,967,400,000 0.00041%
2003 54,227.3 14,972,400,000 0.00036%
2004 57,335.9 16,340,900,000 0.00035%
2005 57,622.3 16,089,600,000 0.00036%
2006 57,369.3 15,710,500,000 0.00037%
2007 54,797.6 15,818,000,000 0.00035%
2008 52,076.2 14,410,500,000 0.00036%
2009 46,863.0 11,860,000,000 0.00040%
2010 47,686.3 12,848,000,000 0.00037%
Average Market Share % (1995-2010)
0.00039%
2015 52,157 13,454,000,000 0.00039%
2020 58,071 14,979,600,000 0.00039%
2025 64,623 16,669,800,000 0.00039%
2030 71,744 18,506,500,000 0.00039%
CAGR (2010-2030) 2.06% 2.14%
Source: Airport Records, FAA Aerospace Forecasts 2011-2031, Mead and Hunt
2.5 CARGO AIRCRAFT FLEET MIX PROJECTIONS
As mentioned in Section 2.5, cargo operations at Spokane International are conducted by both passenger
service and commercial cargo operators. In 2010, approximately 73 percent of air cargo operations were
conducted by smaller air taxi/commuter aircraft and 27 percent by commercial air carrier aircraft. In 2010,
there were 9,340 cargo operations and 47,686 tons of cargo shipped through Spokane International
Airport. This equates to 5.03 tons of cargo shipped per operation. Cargo operations by aircraft type are
shown in Table 2-15. It is assumed that per operation weight of 5.11 tons will remain constant throughout
the projection period and that the proportion of operations by aircraft will also remain constant. This
figure is applied to projections of total cargo at the Airport described in Section 2.5.

CHAPTER 2 AVIATION ACTIVITY FORECASTS
2-18 Spokane International Airport Master Plan (March 2014)
Table 2-15. Scheduled Air Cargo Operations
Cargo Aircraft 2010 Projected
Operations % 2015 2020 2025 2030
Cessna 208 Caravan 5,907 63.2% 6,461 7,193 8,005 8,887
Beech 18 C-185 459 4.9% 502 559 622 691
ATR42 452 4.8% 494 550 613 680
Air Taxi / Commuter Total 6,818 73.0% 7,457 8,303 9,240 10,258
B757-200
B767-300/300ER
28
142
0.3%
1.5%
31
155
34
173
38
192
42
214
A300 652 7.0% 713 794 884 981
A310 1,698 18.2% 1,857 2,068 2,301 2,555
ATR72 2 0.0% 2 2 3 3
Air Carrier Total 2,522 27.0% 2,758 3,071 3,418 3,794
Grand Total 9,340 10,216 11,374 12,657 14,052
CAGR (2010-2030) 2.06% Total Cargo (Tons) 47,686 52,157 58,071 64,623 71,744 Tons/Operation 5.11 5.11 5.11 5.11 5.11
Sources: Historical Total Airport Cargo Data - Airport Management, Historical Fleet Mix - OAG Airline Schedules form apgDat, Total U.S. Air Cargo (Revenue
Ton Miles) - FAA Aerospace Forecasts FY2011-2031
As shown, this methodology projects 10,216 cargo operations in 2015, 11,374 in 2020, 12,657 in 2025,
and 14,052 in 2030, a CAGR of 2.06 percent.
2.6 BASED AIRCRAFT FORECASTS
There are several factors that affect the number of aircraft at an airport. The overall cost to own and
operate an aircraft has increased significantly in recent years, which contributed to a slight decline in the
U.S. general aviation fleet since 2007, a trend that has also occurred at Spokane International Airport.
Since 1995 the number of based aircraft at the Airport has fluctuated significantly. Because of this, several
methodologies were used to develop based aircraft projections.

AVIATION ACTIVITY FORECASTS CHAPTER 2
Spokane International Airport Master Plan (March 2014) 2-19
Trend Line Methodology
The trend line methodology, which assumes that
historic trends will continue in the future, projects 105
based aircraft in 2015, 107 in 2020, 109 in 2025, and
111 in 2030, a CAGR of 1.76 percent (see Table 2-16).
Market Share Methodology
Spokane International Airport’s market share of the
total U.S. general aviation fleet has fluctuated by more
than 65 percent between 1995 and 2010 with 2008 and
2009 experiencing the lowest market annual market
shares during that timeframe. Because of this variation,
the market share methodology assumes that by 2030,
the Airport’s market share will return to its 1995-2010
average of 0.04668 percent (see Table 2-17).
Table 2-16. Based Aircraft Forecasts Trend Line Methodology
Year Based Aircraft
1995 85
1996 85
1997 97
1998 97
1999 97
2000 97
2001 117
2002 117
2003 117
2004 107
2005 113
2006 115
2007 110
2008 77
2009 77
2010 78
CAGR (1995-2010) -0.57
2015 105
2020 107
2025 109
2030 111
CAGR (2010-2030) 1.76%
Source: FAA TAF, Mead and Hunt

CHAPTER 2 AVIATION ACTIVITY FORECASTS
2-20 Spokane International Airport Master Plan (March 2014)
Table 2-17. Based Aircraft Forecasts Market Share Methodology
Year GEG Based
Aircraft Total U.S. Active
Aircraft GEG Market
Share
1995 85 188,089 0.04519%
1996 85 191,129 0.04447%
1997 97 192,414 0.05041%
1998 97 204,710 0.04738%
1999 97 206,530 0.04697%
2000 97 217,533 0.04459%
2001 117 211,446 0.05533%
2002 117 211,244 0.05539%
2003 117 209,606 0.05582%
2004 107 219,319 0.04879%
2005 113 224,350 0.05037%
2006 115 221,939 0.05182%
2007 110 231,606 0.04749%
2008 77 228,668 0.03367%
2009 78 223,920 0.03439%
2010 78 224,172 0.03479
Average (1995-2010) 0.4668%
2015 87 229,140 0.03777%
2020 97 237,795 0.04074%
2025 110 250,560 0.04371%
2030 125 267,055 0.04668%
CAGR (2010-2030) 2.37% 0.88%
Source: FAA TAF, FAA Aerospace Forecasts 2011-2031, Mead and Hunt.
As shown, the market share methodology projects 87 based aircraft in 2015, 97 in 2020, 110 in 2025 and
125 in 2030, a CAGR of 2.37 percent.
Socioeconomic Methodology – Income Variable
Income can often be a strong indicator of one’s propensity to own an aircraft. The socioeconomic income
variable methodology compares historical based aircraft at Spokane International Airport to per capita
income in Spokane County. According to data obtained by Woods and Poole, Inc. per capita income in
Spokane has increased from $11,804 in 2000 to $14,120 in 2010, a CAGR of 1.81 percent. During that
timeframe, based aircraft per $100 income decreased by nearly 50 percent. The 2010 figure of 0.55240
based aircraft per $100 income is applied to projections of per capita income and shown in Table 2-18.

AVIATION ACTIVITY FORECASTS CHAPTER 2
Spokane International Airport Master Plan (March 2014) 2-21
Table 2-18. Based Aircraft Forecasts Socioeconomic Methodology-Income Variable
Year Based Aircraft Spokane County Per
Capita Income ($2004)
Based Aircraft Per $100 Income
2000 97 $11,804 0.82173
2001 117 $11,765 0.99444
2002 117 $11,844 0.98785
2003 117 $11,956 0.97862
2004 107 $12,184 0.87823
2005 113 $12,323 0.91701
2006 115 $12,904 0.89118
2007 110 $13,451 0.81780
2008 77 $13,662 0.56359
2009 77 $13,827 0.56413
2010 78 $14,120 0.55240
Average (2000-2010) 0.84145
2015 88 $15,883 0.55240
2020 99 $17,878 0.55240
2025 111 $20,124 0.55240
2030 125 $22,640 0.55240
CAGR (2010-2030) 2.39% 2.39%
Source: FAA TAF, Mead and Hunt. Woods & Poole, Inc.
Socioeconomic Methodology – Population Variable
The socioeconomic population variable methodology compares historical based aircraft at the Airport
with the population of Spokane County. Between 2000 and 2010, the population of Spokane County
increased from 418,806 to 474,627. During that same timeframe, based aircraft per capita decreased from
0.00023 to 0.00016. The 2010 figure of 0.00016 based aircraft per capita is applied to population
projections of Spokane County and shown in Table 2-19.

CHAPTER 2 AVIATION ACTIVITY FORECASTS
2-22 Spokane International Airport Master Plan (March 2014)
Table 2-19. Based Aircraft Forecasts Socioeconomic Methodology-Population Variable
Year Based Aircraft Spokane County
Population Based Aircraft Per
Capita
2000 97 418,806 0.00023
2001 117 422,780 0.00028
2002 117 427,083 0.00027
2003 117 430,991 0.00027
2004 107 435,225 0.00025
2005 113 440,431 0.00026
2006 115 446,932 0.00026
2007 110 456,004 0.00024
2008 77 462,677 0.00017
2009 77 468,635 0.00016
2010 78 474,627 0.00016
Average (2000-2010)
2015 83 505,051 0.00016
2020 88 536,378 0.00016
2025 95 568,239 0.00016
2030 99 600,334 0.00016
CAGR (2010-2030) 1.18% 1.18%
Source: FAA TAF, Mead and Hunt. Woods & Poole, Inc.
As shown, the socioeconomic population variable methodology projects 83 based aircraft in 2015, 88 in
2020, 95 in 2025, and 99 in 2030, a CAGR of 1.18 percent.
Preferred Projection Methodology
A comparison of projected based aircraft using the methodologies described in previous sections is shown
in Table 2-20 and Chart 2-2. All of the methodologies anticipate that there will be an increase in passenger
demand over the next 30 years. Between 1995 and 2010 there was significant variation in the number of
based aircraft at Spokane International Airport.
In its Terminal Aerospace Forecasts, the FAA projects that the economy will recover and that the total U.S.
general aviation fleet will increase by 0.9 percent annually throughout the projection period. Increases in
cost of aircraft ownership and operation, combined with the economic downturn that began in 2008 has
contributed to a decrease in based aircraft at the Despite this, a slow, steady increase locally is also
anticipated. As such, local demand of based aircraft is assumed to be driven by population. Therefore, the
socioeconomic population variable methodology is the preferred forecast for based aircraft.

AVIATION ACTIVITY FORECASTS CHAPTER 2
Spokane International Airport Master Plan (March 2014) 2-23
Table 2-20. Based Aircraft Forecasts – Projection Comparison and Preferred Methodology
Year Based
Aircraft FAA TAF
Summary Trend Line
Methodology Market Share Methodology
Socioeconomic Methodology-
Population Variable
Socioeconomic Methodology-
Income Variable
1995 85 1996 85 1997 97 1998 97 1999 97 2000 97 2001 117 2002 117 2003 117 2004 107 2005 113 2006 115 2007 110 2008 77
2009 77
2010 78 CAGR (1995-2010) -0.57%
2015 82 105 87 83 88 2020 87 107 97 88 99 2025 92 109 110 93 111 2030 97 111 125 99 125
CAGR (2010-2030) 1.10% 1.76% 2.37% 1.18% 2.39%
Source: FAA TAF, FAA Aerospace Forecasts 2011-2031, Mead and Hunt.

CHAPTER 2 AVIATION ACTIVITY FORECASTS
2-24 Spokane International Airport Master Plan (March 2014)
2.7 BASED AIRCRAFT FLEET MIX
Historical based aircraft by type and the projected based aircraft fleet mix at Spokane International Airport
is shown in Table 2-21. As shown, in 2010 71 percent of the local fleet was comprised of single engine
aircraft, 24 percent multi-engine aircraft, and 4 percent jet aircraft. The FAA Aerospace Forecast 2011-
2031 projects that jet aircraft will see the most significant growth of any type of aircraft through 2030.
This is a trend that is also anticipated to occur locally as jet aircraft are expected to proportionally increase
by three percent by 2030. Conversely, single engine aircraft are expected to lose four percent of the local
fleet by 2030.
Table 2-21. Based Aircraft Fleet Mix Projections
Year Single Engine Multi Engine Jet Helicopter Other
# % # % # % # % Total
1995 49 58% 20 24% 2 2% 3 4% 11 13% 85
1996 49 58% 20 24% 2 2% 3 4% 11 13% 85
1997 62 64% 26 27% 2 2% 2 2% 5 5% 97
1998 62 64% 26 27% 2 2% 2 2% 5 5% 97
1999 62 64% 26 27% 2 2% 2 2% 5 5% 97
2000 62 64% 26 27% 2 2% 2 2% 5 5% 97
2001 77 66% 27 23% 3 3% 3 3% 7 6% 117
2002 77 66% 27 23% 3 3% 3 3% 7 6% 117
2003 77 66% 27 23% 3 3% 3 3% 7 6% 117
2004 67 63% 33 31% 2 2% 3 3% 2 2% 107
2005 69 61% 36 32% 2 2% 3 3% 3 3% 113
2006 73 63% 37 32% 2 2% 3 3% 0 0% 115
2007 68 62% 39 35% 2 2% 1 1% 0 0% 110
2008 54 70% 19 25% 3 4% 1 1% 0 0% 77
2009 54 71% 19 24% 3 4% 1 1% 0 0% 77
2010 55 71% 19 24% 3 4% 1 1% 0 0% 77
Projected
2015 58 70% 20 24% 4 5% 1 1% 0 0% 83
2020 62 70% 21 24% 4 5% 1 1% 0 0% 88
2025 63 68% 23 25% 6 6% 1 1% 0 0% 93
2030 66 67% 25 25% 7 7% 1 1% 0 99
CAGR (2010-2030)
0.94% 1.31% 4.1% 0.00% 0.00% 1.19%
Source: FAA TAF, FAA Aerospace Forecasts, Mead and Hunt.

AVIATION ACTIVITY FORECASTS CHAPTER 2
Spokane International Airport Master Plan (March 2014) 2-25
2.8 GENERAL AVIATION OPERATIONS FORECASTS
General aviation operations are those which are not categorized as commercial or military. General
aviation operations account for approximately 32 percent of all activity at Spokane International Airport.
Since 1995, general aviation activity has declined slightly, however, between 2000 and 2010 operations
have decreased by nearly 60 percent. Two methodologies were examined in determining projections of
general aviation demand.
Operations per Based Aircraft Methodology
As mentioned in Section 2.7, between 2000 and 2010 the number of based aircraft at Spokane
International Airport has declined. However, during the same timeframe, the number of general aviation
operations has remained relatively consistent (see Table 2-22). The average number of annual operations
per based aircraft between 2000 and 2010 was 351. This figure is applied to the projected number of
based aircraft as described in Section 2.7 and results in 26,553 general aviation operations in 2015, 28,200
in 2020, 29,875 in 2025, and 31,562 in 2030, a CAGR of 1.18 percent.
Table 2-22. General Aviation Operations Forecasts Operations Per Based Aircraft Methodology
Year Based Aircraft GA Operations Operations Per Based Aircraft
2000 97 43,547 449
2001 117 43,748 374
2002 117 43,044 368
2003 117 39,808 340
2004 107 32,195 301
2005 113 36,200 320
2006 115 34,806 303
2007 110 35,961 327
2008 77 30,521 396
2009 77 27,544 358
2010 78 24,958 320
Average (2000-2010) 351
2015 83 26,553 351
2020 88 28,200 351
2025 93 29,875 351
2030 99 31,562 351
CAGR (2010-2030) 1.18% 1.18%
Source: Airport Records, FAA TAF, Mead and Hunt.

CHAPTER 2 AVIATION ACTIVITY FORECASTS
2-26 Spokane International Airport Master Plan (March 2014)
Market Share Methodology
Between 2000 and 2009, Spokane International Airport’s market share of total U.S. general aviation
operations has declined by approximately 11 percent. Although local general aviation operations have
remained relatively steady during this timeframe, itinerant operations have declined significantly.
Because of this decline, the Airport’s 2009 market share of 0.939 percent is applied to total the number
of projected total U.S. general aviation operations described in the FAA Terminal Aerospace Forecasts
2011-2031 and shown in Table 2-23.
Table 2-23. General Aviation Operations Forecasts Market Share Methodology
Year GEG GA Operations Total U.S. Operations Market Share
2000 43,547 39,878,536 0.1092%
2001 43,748 37,626,472 0.1163%
2002 43,044 37,652,701 0.1143%
2003 39,808 35,524,020 0.1121%
2004 32,195 34,967,730 0.0921%
2005 36,200 34,146,832 0.1060%
2006 34,806 33,072,516 0.1052%
2007 35,961 33,131,959 0.1085%
2008 30,521 31,573,800 0.0967%
2009 27,544 27,999,600 0.0984%
2010 24,958 26,571,400 0.0939%
Average (2000-2010) 0.1048%
2015 25,375 27,015,000 0.0939%
2020 26,957 28,699,500 0.0939%
2025 28,662 30,515,100 0.0939%
2030 30,501 32,473,100 0.0939%
CAGR (2010-2030) 1.01% 1.01%
Source: Airport Records, FAA Aerospace Forecast 2011-2031, Mead and Hunt.
As shown, the market share methodology projects 25,375 general aviation operations in 2015, 26,957 in
2020, 28,662 in 2025, and 30,501 in 2030, a CAGR of 1.01 percent.

AVIATION ACTIVITY FORECASTS CHAPTER 2
Spokane International Airport Master Plan (March 2014) 2-27
Preferred Projection Methodology
General aviation activity can be affected my many variables, and the number of aircraft operations both
at Spokane International Airport and in the U.S. have declined in recent years. The Airport’s market share
of total U.S. general aviation operations declined by approximately 10 percent between 2000 and 2010.
During that same period, the number of operations per based aircraft remained relatively consistent.
Therefore, the operations per based aircraft methodology is the preferred methodology (as presented in
Table 2-24).
Table 2-24. General Aviation Operations Forecasts Projection Comparison and Preferred Methodology
Year GA
Operations FAA TAF
Summary
Operations Per Based Aircraft Methodology
Market Share Methodology
1995 28,248
1996 27,959
1997 33,571
1998 36,672
1999 41,114
2000 43,547
2001 43,748
2002 43,044
2003 39,808
2004 32,195
2005 36,200
2006 34,806
2007 35,961
2008 30,521
2009 27,544
2010 24,958
CAGR (1995-2010) -0.82%
2015 25,318 26,553 25,375
2020 26,707 28,200 26,957
2025 28,181 29,875 28,662
2030 29,747 31,562 30,501
CAGR (2010-2030) 0.88% 1.18% 1.01% Source: Airport Records, FAA TAF, FAA Aerospace Forecasts 2011-2031, Mead and Hunt.

CHAPTER 2 AVIATION ACTIVITY FORECASTS
2-28 Spokane International Airport Master Plan (March 2014)
2.9 INSTRUMENT OPERATIONS FORECASTS
Typically, instrument operations are conducted by commercial aircraft and by aircraft operating during
periods of inclement weather. Between 2000 and 2010, instrument operations at Spokane International
Airport increased from 67 percent of total operations to 75 percent. The 2010 figure is applied to the total
number of projected operations and results in 63,642 instrument operations in 2015, 71,433 in 2020,
80,307 in 2025, and 90,411 in 2030, a CAGR of 2.14 percent (see Table 2-25).
Table 2-25. Instrument Operations Projections
Year Total
Operations
Instrument Operations Visual Operations
Operations % Operations %
2000 117,759 78,527 67% 39,232 33%
2001 110,314 74,186 67% 36,128 33%
2002 108,029 68,990 64% 39,039 36%
2003 106,100 68,427 64% 37,673 36%
2004 99,034 67,182 68% 31,852 32%
2005 99,801 67,402 68% 32,399 32%
2006 95,628 66,022 69% 29,606 31%
2007 101,323 70,581 70% 30,742 30%
2008 95,190 68,768 72% 26,422 28%
2009 81,580 56,923 70% 24,657 30%
2010 79,120 59,203 75% 19,917 25%
CAGR (2000-2010)
-3.90% -6.65% -16.28%
2015 85,053 63,642 75% 21,410 25%
2020 95,464 71,433 75% 24,031 25%
2025 107,323 80,307 75% 27,017 25%
2030 120,827 90,411 75% 30,416 25%
CAGR (2010-2030)
2.14% 2.14% 2.14%
Source: Air Traffic Activity Data System, (ATADS), Mead and Hunt.

AVIATION ACTIVITY FORECASTS CHAPTER 2
Spokane International Airport Master Plan (March 2014) 2-29
2.10 LOCAL/ITINERANT OPERATIONS FORECASTS
Between 2000 and 2010, itinerant general aviation operations have comprised approximately 57 percent
of total operations at Spokane International Airport, while local operations have accounted for
approximately 43 percent of total operations. It is anticipated that this split will remain constant
throughout the projection period. A summary of projected local and itinerant general aviation operations
is shown in Table 2-26.
Table 2-26. Local/Itinerant Operations Forecasts
Year Total GA
Operations
Itinerant GA Local GA
Operations % Operations %
2000 43,547 27,628 63% 15,919 37%
2001 43,748 28,099 64% 15,649 36%
2002 43,044 24,579 57% 18,465 43%
2003 39,808 23,932 60% 15,876 40%
2004 32,195 19,838 62% 12,357 38%
2005 36,200 18,546 51% 17,654 49%
2006 34,806 19,132 55% 15,674 45%
2007 35,961 18,576 52% 17,385 48%
2008 30,521 16,296 53% 14,225 47%
2009 27,544 14,029 51% 13,515 49%
2010 24,958 14,121 57% 10,837 43%
Average (2000-2010) 57% 43%
2015 26,553 15,093 57% 11,459 43%
2020 28,200 16,029 57% 12,170 43%
2025 29,875 16,982 57% 12,893 43%
2030 31,562 17,941 57% 13,621 43%
CAGR (2010-2030) 1.18% 1.20% 1.15%
Source: Air Traffic Activity Data System, (ATADS), Mead and Hunt.

CHAPTER 2 AVIATION ACTIVITY FORECASTS
2-30 Spokane International Airport Master Plan (March 2014)
2.11 MILITARY OPERATIONS FORECASTS
Historically, military operations have comprised approximately two percent of total operations at Spokane
International Airport. It should be noted that Fairchild Air Force Base is located approximately four miles
from the Airport. Between 2000 and 2010, the number of annual military operations remained fairly
consistent between 1,156 and 2,529. Military operations are driven more by policy decisions than by
economic conditions, therefore military operations have been projected to remain consistent at their
2010 levels (see Table 2-27). As Shown the number of military operations at the Airport will remain flat
throughout the projection period.
Table 2-27. Military Operations Projections
Year Total Military
Operations
Itinerant Local
Operations % Operations %
2000 2,529 1,382 55% 1,147 45%
2001 1,966 1,289 66% 677 34%
2002 1,512 943 62% 569 38%
2003 1,868 1,120 60% 748 40%
2004 1,254 641 51% 613 49%
2005 1,567 1,123 72% 444 28%
2006 1,943 979 50% 964 50%
2007 1,156 578 50% 578 50%
2008 1,997 745 37% 1,252 63%
2009 2,217 708 32% 1,509 68%
2010 1,618 1,234 76% 384 24%
CAGR (2000-2010)
2015 1,618 1,234 76% 384 24%
2020 1,618 1,234 76% 384 24%
2025 1,618 1,234 76% 384 24%
2030 1,618 1,234 76% 384 24%
CAGR (2010-2030) 0.00% 0.00% 0.00%
Source: Air Traffic Activity Data System, (ATADS), Mead and Hunt.

AVIATION ACTIVITY FORECASTS CHAPTER 2
Spokane International Airport Master Plan (March 2014) 2-31
2.12 PEAK PASSENGER ACTIVITY AND OPERATIONS FORECASTS
Planning for facilities and equipment requirements is often based on peak periods of passenger and
aircraft activity. This section identifies monthly, daily, and hourly peaking characteristics for passenger
and aircraft activity at Spokane International Airport.
2.12.1 Peak Enplanements and Passenger Activity Forecasts
Monthly passenger enplanement data were obtained from the Airport and shown in Table 2-28. In 2008,
2009, and 2010, the average percent of passenger enplanements that occurred in peak month accounted
for 9.9 percent of total annual enplanements.
Table 2-28. Historical Peak Month Passenger Enplanements
Month 2008 Passenger Enplanements
% Annual 2009 Passenger Enplanements
% Annual 2010 Passenger Enplanements
% Annual
JAN 132,319 7.7% 112,666 7.4% 116,290 7.2%
FEB 133,690 7.8% 109,270 7.2% 106,078 6.6%
MAR 156,083 9.1% 134,890 8.8% 133,275 7.9%
APR 137,376 8.0% 113,013 7.4% 115,116 7.8%
MAY 148,245 8.6% 124,316 8.1% 127,405 8.2%
JUN 157,643 9.2% 136,699 8.9% 143,937 9.2%
JUL 168,844 9.8% 146,993 9.6% 156,860 10.1%
AUG 167,866 9.8% 147,241 9.6% 161,923 9.9%
SEP 131,771 7.7% 123,618 8.1% 134,159 8.2%
OCT 134,805 7.9% 126,338 8.3% 135,204 8.3%
NOV 120,974 7.1% 120,198 7.9% 124,059 7.9%
DEC 126,157 7.4% 132,713 8.7% 137,820 8.6%
Totals 1,715,773 100.0% 1,527,955 100.0% 1,592,126 100.0%
Source: Airport Records
It is assumed that peak monthly enplanements and deplanements will be equal, and that peak month
enplanements will continue to be 9.9 percent of annual activity. This figure is applied to projections of
passenger enplanements described in Section 2 and shown in Table 2-29.
Table 2-29. Peak Month Passenger Enplanements Forecasts
Year Projected Annual
Enplanements Peak Month
% Total
Peak Month
Enplanements Deplanements Total Activity
2015 1,820,148 9.9% 179,876 179,876 359,751
2020 2,177,846 9.9% 215,225 215,225 430,450
2025 2,606,377 9.9% 257,574 257,574 515,149
2030 3,119,876 9.9% 308,321 308,321 616,642
Source: Airport Records, Mead and Hunt.

CHAPTER 2 AVIATION ACTIVITY FORECASTS
2-32 Spokane International Airport Master Plan (March 2014)
As shown, the peak month of passenger activity (enplanements plus deplanements) is expected to reach
359,751 in 2015, 430,450 in 2020 515,149 in 2025, and 616,642 in 2030.
2.12.2 Peak Daily Passenger Activity Forecasts
It should be noted that planning for facility and equipment requirements is based on the probable demand
that may occur over time. Therefore, if planning is contingent on the absolute busiest periods of activity,
it can lead to overestimation, overspending, and inefficiencies. Daily peak activity figures are based on a
typical weekday during the peak month.
The average weekday during the peak month for passenger activity typically sees 64 commercial
departures and 64 arrivals. These account for approximately 14.9 percent of available weekly seats either
departing or arriving at the Airport (see Table 2-30).
Table 2-30. Peak Month Daily Activity
Day Departures Departing
Seats % Weekly
Total Arrivals
Arriving Seats
% Weekly Total
Mon 64 6,521 14.93% 64 6,521 14.92%
Tue 64 6,501 14.88% 64 6,519 14.92%
Wed 64 6,482 14.84% 64 6,464 14.79%
Thu 64 6,501 14.88% 64 6,501 14.88%
Fri 64 6,464 14.80% 64 6,464 14.79%
Sat 51 5,182 11.86% 52 5,270 12.06%
Sun 61 6,030 13.80% 54 5,960 13.64%
Total 432 43,681 426 43,699
Sources: Official Airline Guide (OAG) August, 2010 Schedule, Mead and Hunt.
It is assumed that the average peak month is 31 days long (4.4 weeks). Peak month
enplanements/deplanements are divided by the average number of weeks in the peak month to
determine the average number of weekly passenger enplanements/deplanements that occur in the peak
month. This figure is divided by the percent of weekly activity that occurs on a typical weekday and results
in the average number of daily enplanements/deplanements that occurs in the peak month (see Table 2-
31).
Table 2-31. Peak Month Average Day Passenger Activity
Year Peak Month
Enpl/Depl
Weeks in Peak
Month
Average Weekly
Enpl/Depl
% of Weekly Activity on Typical Weekday
Average Weekday Passengers
Enplaning Deplaning Enplanements Deplanements Total
2010 161,923 4.4 36,801 14.88% 14.87% 5,477 5,475 10,952
2015 179,876 4.4 40,881 14.88% 14.87% 6,084 6,082 12,166
2020 215,225 4.4 48,599 14.88% 14.87% 7,233 7,230 14,463
2025 257,574 4.4 58,162 14.88% 14.87% 8,656 8,653 17,309
2030 308,321 4.4 69,621 14.88% 14.87% 10,362 10,357 20,719
Sources: Airport Records, Official Airline Guide (OAG) August, 2010 Schedule, Mead and Hunt.

AVIATION ACTIVITY FORECASTS CHAPTER 2
Spokane International Airport Master Plan (March 2014) 2-33
2.12.3 Peak Hourly Passenger Activity Forecasts
The number of hourly arriving and departing seats during a typical weekday in the peak month is shown
in Chart 2-3.
Typically, peak hourly departing seats occurs between 1:00pm and 2:00pm, peak hourly arriving seats
occurs between 12:15pm and 1:15pm, and peak total arriving and departing seats occurs between
approximately 12:50pm and 2:00pm (see Table 2-32).
Table 2-32. Peak Hour Seats
Time of Day # of Seats Total Daily Seats % of Daily Seats in Peak Hour
Peak Hour Departing Seats (Enplanements)
13:00 to 14:00 878 6,482 13.5%
Peak Hour Arriving Seats (Deplanements)
12:15 to 13:15 875 6,464 13.5%
Peak Total Passengers
12:50 to 13:00 1,614 12,946 12.5%
Sources: Official Airline Guide (OAG) August, 2010 Schedule, Mead and Hunt.
The percentage of daily seats during peak hour is applied to the average daily passenger figures described
in Section 2.1.12, and shown in Table 2-33.

CHAPTER 2 AVIATION ACTIVITY FORECASTS
2-34 Spokane International Airport Master Plan (March 2014)
Table 2-33. Peak Hour Passenger Activity
Year
Average Day Passengers Peak Hour Passengers
Enplanements Deplanements Enplanements Deplanements Total Passengers
13.5% 13.5% 12.5%
2010 5,477 5,475 742 741 1,365
2015 6,084 6,082 824 823 1,517
2020 7,233 7,230 980 979 1,803
2025 8,656 8,653 1,172 1,171 2,158
2030 10,362 10,357 1,403 1,402 2,583
Sources: Airport Records, Official Airline Guide (OAG) August, 2010 Schedule, Mead and Hunt.
2.12.4 Passenger Activity Peaking Characteristics Summary
A summary of peaking characteristics described in the previous sections is described in Table 2-34.
Table 2-34. Peaking Characteristics Summary
Year Peak Factor Enplanements Deplanements Total Passenger
Activity
2010
Actual
Annual 1,592,126 1,592,126 3,184,252
Peak Month 161,923 161,923 323,846
Peak Month Avg. Weekday 5,477 5,475 10,952
Peak Hour Avg. Weekday 742 741 1,483
2015
Projected
Annual 1,820,148 1,820,148 3,640,296
Peak Month 179,876 179,876 359,751
Peak Month Avg. Weekday 6,084 6,082 12,166
Peak Hour Avg. Weekday 824 823 1,647
2020
Projected
Annual 2,177,846 2,177,846 4,355,692
Peak Month 215,225 215,225 430,450
Peak Month Avg. Weekday 7,233 7,230 14,463
Peak Hour Avg. Weekday 980 979 1,958
2025
Projected
Annual 2,606,377 2,606,377 5,212,754
Peak Month 257,574 257,574 515,149
Peak Month Avg. Weekday 8,656 8,653 17,309
Peak Hour Avg. Weekday 1,172 1,171 2,344
2030
Projected
Annual 3,119,876 3,119,876 6,239,752
Peak Month 308,321 308,321 616,642
Peak Month Avg. Weekday 10,362 10,357 20,719
Peak Hour Avg. Weekday 1,403 1,402 2,806
Sources: Airport Records, Official Airline Guide (OAG) August, 2010 Schedule, Mead and Hunt.

AVIATION ACTIVITY FORECASTS CHAPTER 2
Spokane International Airport Master Plan (March 2014) 2-35
2.12.5 Peak Operations Forecasts
Historical monthly operations are shown in Table 2-35. In 2008 and 2009, the peak month accounted for
an average of approximately 9.7 percent of total operations at Spokane International Airport.
Table 2-35. Historical Peak Month Aircraft Operations
Month 2008 Aircraft Operations
% Annual 2009 Aircraft Operations
% Annual 2010 Aircraft Operations
% Annual
Jan 7,262 7.7% 6,007 7.4% 5,840 7.2%
Feb 7,399 7.8% 5,687 7.0% 5,489 6.7%
Mar 7,880 8.3% 7,078 8.7% 6,491 8.0%
Apr 8,662 9.1% 7,671 9.4% 6,388 7.8%
May 9,069 9.6% 7,526 9.2% 7,087 8.7%
Jun 9,366 9.9% 7,450 9.2% 7,086 8.7%
Jul 9,460 10.0% 7,246 8.9% 7,405 9.1%
Aug 8,207 8.7% 6,831 8.4% 7,284 8.9%
Sep 7,640 8.1% 7,144 8.8% 7,402 9.1%
Oct 8,231 8.7% 6,914 8.5% 7,130 8.8%
Nov 5,888 6.2% 5,674 7.0% 5,555 6.8%
Dec 5,647 6.0% 6,169 7.6% 5,963 7.3%
Totals 94,711 100.0% 81,397 100.0% 79,120 7.2%
Source: Air Traffic Activity Data System, (ATADS), Mead and Hunt.
To project peak month operations, the 9.59 percent 2008-2010 peak month average of total operations
is applied to annual operations projections described in previous sections of this document. That figure is
divided by the number of days in the peak month, 31, to determine the average number of daily
operations in peak month. July was the peak month for aircraft operations in 2010, which was primarily
fueled by an increase in general aviation and military operations compared with other months. The FAA
Enhanced Traffic Management System Counts (ETMSC) database notes that the average number of
aircraft operations in the peak hour for each individual day in July was 10.98 percent of the total daily
operations. This figure is applied to the average number of projected daily operations in peak month to
project peak hour operations (see Table 2-36).

CHAPTER 2 AVIATION ACTIVITY FORECASTS
2-36 Spokane International Airport Master Plan (March 2014)
Table 2-36. Peak Aircraft Operations Forecasts
Year Annual
Operations Peak Month %
Peak Month Operations
Peak Month Avg. Day Operations
Peak Hour %
Peak Hour Operations
2015 85,053 9.59% 8,157 263 10.98% 29
2020 95,464 9.59% 9,156 295 10.98% 32
2025 107,323 9.59% 10,293 332 10.98% 36
2030 120,827 9.59% 11,588 374 10.98% 41
CAGR (2009-2030) 2.04% 2.26% 2.10% 1.82%
Sources: Airport Records, Official Airline Guide (OAG) August, 2010 Schedule, FAA Enhanced Traffic Management Systems Counts (ETMSC), Mead and Hunt.
2.13 FORECAST SUMMARY AND FAA TAF COMPARISON
Passenger and aircraft activity at the Spokane International Airport has fluctuated in recent history. This
is not an uncommon theme at many U.S. airports as economic uncertainty and increased travel costs have
impacted travel behavior. Despite rapid increases in fuel cost, airline bankruptcies, system-wide route
restructuring, and aircraft fleet overhauls, the forecasts developed for this Master Plan Update suggest
positive growth in passenger enplanements, the number of based aircraft, and total aircraft operations at
the Airport over the next 20 years.
The FAA templates for summarizing and documenting airport planning forecasts and for comparing
projections with the FAA TAF Forecasts are presented in Tables 2-37 and Table 2-38.

AVIATION ACTIVITY FORECASTS CHAPTER 2
Spokane International Airport Master Plan (March 2014) 2-37
Spokane International Airport
A. Forecast Levels and Growth Rates
Specify base year: 2009
2010 2015 2020 2025 2030
Base Yr.
Level
Base Yr. +
5yr.
Base Yr. +
10yrs.
Base Yr. +
15yrs.
Base Yr. +
20yrs.
Base
Yr. +
5yr.
Base
Yr. +
10yrs.
Base
Yr. +
15yrs.
Base
Yr. +
20yrs.
Passenger Enplanements
TOTAL Air Carrier & Commuter 1,592,126 1,820,148 2,177,846 2,606,377 3,119,876 2.3% 2.9% 3.1% 3.3%
Operations
Itinerant
Air carrier 38,976 45,464 53,015 61,858 72,219 2.6% 2.8% 2.9% 3.0%
Commuter/air taxi 13,568 11,418 12,632 13,973 15,428 -2.8% -0.6% 0.2% 0.6%
Total Commercial Operations 52,544 56,882 65,647 75,831 87,647 1.3% 2.0% 2.3% 2.5%
General aviation 14,121 15,093 16,029 16,982 17,941 1.1% 1.2% 1.2% 1.1%
Military 1,234 1,234 1,234 1,234 1,234 0.0% 0.0% 0.0% 0.0%
Local
General aviation 10,837 11,459 12,170 12,893 13,621 0.9% 1.1% 1.1% 1.1%
Military 384 384 384 384 384 0.0% 0.0% 0.0% 0.0%
TOTAL OPERATIONS 79,120 85,053 95,464 107,323 120,827 1.2% 1.7% 1.9% 2.0%
Instrument Operations 59,203 63,642 71,433 80,307 90,411 1.2% 1.7% 1.9% 2.0%
Peak Hour Operations 28 29 32 36 41 0.5% 1.3% 1.6% 1.8%
Cargo/mail (enplaned+deplaned tons) 47,686 52,157 58,071 64,623 71,744 1.5% 1.8% 1.9% 2.0%
Based Aircraft
Single Engine (Nonjet) 55 58 62 63 66 0.9% 1.0% 0.9% 0.9%
Multi Engine (Nonjet) 19 20 21 23 25 0.8% 1.0% 1.3% 1.2%
Jet Engine 3 4 4 6 7 5.6% 3.6% 4.0% 4.0%
Helicopter 1 1 1 1 1 0.0% 0.0% 0.0% 0.0%
Other 0 0 0 0 0 0.0% 0.0% 0.0% 0.0%
TOTAL 78 83 88 93 99 1.0% 1.1% 1.1% 1.1%
B. Operational Factors
Base Yr.
Level
Base Yr. +
5yr.
Base Yr. +
10yrs.
Base Yr. +
15yrs.
Base Yr. +
20yrs.
Average aircraft size (seats)
Air carrier & Commuter 100.6 102.0 104.0 106.0 108.0
Average enplaning load factor
Air carrier & Commuter 75.3% 78.5% 79.0% 79.5% 80.0%
GA operations per based aircraft 320 320 320 320 320
CAGR = Compound Annual Growth Rate
Average CAGR
Table 2-36. FAA Template for Summarizing and Documenting Airport Planning ForecastsTable 2-37. FAA Template for Summarizing and Documenting Airport Planning Forecasts

CHAPTER 2 AVIATION ACTIVITY FORECASTS
2-38 Spokane International Airport Master Plan (March 2014)
Spokane International Airport
Airport AF/TAF
Year Forecast TAF (% Difference)
Passenger Enplanements
Base Yr. Level 2010 1,592,126 1,524,569 4.4%
Base Yr. + 5yr. 2015 1,820,148 1,820,148 0.0%
Base Yr. + 10yrs. 2020 2,177,846 2,177,846 0.0%
Base Yr. + 15yrs. 2025 2,606,377 2,606,377 0.0%
Base Yr. + 20yrs. 2030 3,119,876 3,119,876 0.0%
Commercial Operations
Base Yr. Level 2010 52,544 52,078 0.9%
Base Yr. + 5yr. 2015 56,882 59,618 -4.6%
Base Yr. + 10yrs. 2020 65,647 67,568 -2.8%
Base Yr. + 15yrs. 2025 75,831 76,588 -1.0%
Base Yr. + 20yrs. 2030 87,647 86,834 0.9%
Total Operations
Base Yr. Level 2010 79,120 79,229 -0.1%
Base Yr. + 5yr. 2015 85,053 86,405 -1.6%
Base Yr. + 10yrs. 2020 95,464 95,744 -0.3%
Base Yr. + 15yrs. 2025 107,323 106,238 1.0%
Base Yr. + 20yrs. 2030 120,827 118,050 2.4%
NOTES: TAF data is on a U.S. Government fiscal year basis (October through September).
Airport Forecast is on a calendar year basis.
Table 2-37. FAA Template for Comparing Airport Planning and TAF Forecasts Table 2-38. FAA Template for Comparing Airport Planning and TAF Forecasts

AVIATION ACTIVITY FORECASTS CHAPTER 2
Spokane International Airport Master Plan (March 2014) 2-39
2.14 50-YEAR FORECAST
The 50-year forecast of projected demand takes the preferred forecasts and projects them out to 2050
using the straight-line growth methodology. There are several assumptions going in to the 50-year
forecasts including how GEG will have the facilities in place to meet the expected demand, and that
market conditions will not impact the demand for air travel in a substantially different way than they do
today. The 50-year forecast is presented in Table 2-39.
Table 2-39. Summary Forecast of Aviation Activity - 50 Year Forecast
2010 2015 2020 2025 2030 2050
(Actual) (Projected) (Projected) (Projected) (Projected) (Projected)
Enplanements 1,592,126 1,820,148 2,177,846 2,606,377 3,119,876 8,558,097
Commercial Operations 52,544 56,882 65,647 75,931 98,647 253,761
General Aviation Operations 24,958 26,553 28,200 29,875 31,562 44,885
Military Operations 1,618 1,618 1,618 1,618 1,618 1,618
Total Operations 79,120 85,053 95,464 107,323 120,827 300,264
Total Freight 47,686 52,157 58,071 64,744 71,744 132,397
Based Aircraft 78 83 88 93 99 142
Note: Total Freight in pounds
Sources: Historical Enplanements & Freight - Airport Records
1. Historical Operations - Air Traffic Activity Study (ATADS)
2. Historical Based Aircraft Data - FAA Terminal Area Forecast Records
3. Projections - Mead & Hunt, Inc.
Methodology for evaluating airfield capacity and delay is discussed in Chapter 3. The existing airfield at
GEG has an annual service volume of 215,000 operations. AC 150/5060-5 shows that the ultimate
configuration of GEG with two parallel runways (or two parallel with a crosswind) will have an airfield
capacity of 305,000 operations, assuming that the fleet mix remains similar. The 50-year projection –
which forecasts for unconstrained growth (not impacted by other influences such as gate space, passenger
demand, and airline business decisions/aircraft choice) anticipates 300,264 operations in 2050. This will
put GEG at near capacity, but not over capacity.
50-year forecast projections should be viewed with caution as there are so many unknowns that can
influence actual demand. Navigation technologies, such as required navigation performance, can reduce
separation minimums and increase capacity. The FAA’s NextGen initiative includes a shift away from
ground-based radio technologies and transitions aircraft navigation technologies to GPS satellites. This
shift is expected to improve airport capacity as pilots and controllers operate with improved situational
awareness.

CHAPTER 2 AVIATION ACTIVITY FORECASTS
2-40 Spokane International Airport Master Plan (March 2014)
It is likely that the ultimate airport configuration, combined with improved navigation technologies, will
increase GEG’s capacity beyond what is indicated in AC 150/5060-5. This AC was written in 1983 and is in
the process of being updated. Considering the risks associated with the accuracy of 50-year year
projections and the many unknowns about technologies and socioeconomic conditions in the future, and
that the 50-year projection places GEG close to ASV with the ultimate airfield configuration, it would be
prudent to assume that GEG will likely be able to accommodate the 50-year demand using the ultimate
runway configuration.
The 50-year forecast demonstrates that the ultimate airfield configuration will provide sufficient capacity
for aviation growth at GEG. It is not expected that additional property will be needed to enhance airfield
capacity. Property releases that do not impacted planned pavement, NAVAID, and building development
will likely not reduce future capacity at GEG.