greywater – treatment and reuse - ecosan club
TRANSCRIPT

Sustainable Sanitation
P r a c t i c eIssue 1. 10/2009
Combined greywater treatment
using a membrane bioreactor
Greywater ‐ treatment and reuse
Household greywater treatment
for peri‐urban areas ‐ Kenya Greywater use in peri‐urban
households ‐ Uganda Greywater treatment in
apartment building ‐ Austria
Combined greywater reuse andrainwater harvesting in an office building ‐ Austria

Impressum published by /Medieninhaber, Herausgeber und Verleger
EcoSan Club Schopenhauerstr. 15/8 A‐1180 Vienna Austria www.ecosan.at
Editors /Redaktion Elke Müllegger, Günter Langergraber, Markus Lechner • EcoSan Club
Journal Manager /Journal Management Isabelle Pavese
Contact /Kontakt [email protected]
Disclaimer /Haftungsausschluss
Viewpoints expressed in the articles do not necessarily reflect the views of EcoSan Club or the editors and should not be acted upon without independent consideration and professional advice. EcoSan Club and the editors will not accept responsibility for any loss or damage suffered by any person acting or refraining from acting upon any material contained in this publication. Die in den Artikeln vertretenen Standpunkte entsprechen nicht notwendigerweise der Haltung und Ansichten des EcoSan Clubs oder des Redaktionsteamsr. Der praktischen Anwendung dargestellter Inhalte muss eine unabhängige Begutachtung und professionelle Beratung vorausgehen. EcoSan Club und das Redaktionsteam haften in keiner Weise für Schäden (Sachschaden oder Personenschaden), die durch die Anwendung, oder Nichtanwendung der in dieser Publikation vermittelten Inhalte, entstehen.
Reproduction /Reproduktion Permission is granted for reproduction of this material, in whole or part, for education, scientific or development related purposes except those involving commercial sale, provided that full citation of the source is given. Cover photo excluded. Die Reproduktion, Übernahme und Nutzung der Inhalte von SSP, vollständig oder teilweise, für Bildungszwecke, für die Wissenschaft und im Zusammenhang mit Entwicklung ist unter Voraussetzung der vollständigen Quellenangabe gestattet und erwünscht. Titelbild ausgenommen.
aim and scope /Offenlegung der Blattlinie gemäß § 25, Abs. 4 Mediengesetz Sustainable Sanitation Practice (SSP) aims to make available high quality information on practical experiences with sustainable sanitation systems. For SSP a sanitation system is sustainable when it is not only economically viable, socially acceptable and technically and institutionally appropriate, but it should also protect the environment and the natural resources. SSP is therefore fully in line with SuSanA, the Sustainable Sanitation Alliance (www.susana.org). • SSP targets people that are interested in sustainable sanitation systems and the practical approach to it. • Articles are published after blind review only. • Sustainable Sanitation Practice is published quarterly. It is available for free on www.ecosan.at/ssp. Sustainable Sanitation Practice (SSP) hat zum Ziel praxisrelevante Information in hoher Qualität im Zusammenhang mit „sustainable sanitation“ bereit zu stellen. „sustainable“ also nachhaltig ist ein Sanitärsystem für SSP wenn es wirtschaftlich machbar, soziokulturell akzeptiert, technisch als auch institutionell angemessen ist und die Umwelt und deren Ressourcen schützt. Diese Ansicht harmoniert mit SuSanA, the Sustainable Sanitation Alliance (www.susana.org). • SSP richtet sich an Personen, die sich für die praktische Umsetzung von „sustainable sanitation“ interessieren. • Artikel werden nur nach einer Begutachtung veröffentlicht. • Sustainable Sanitation Practice erschient vierteljährlich, kostenlos unter: www.ecosan.at/ssp.
Information on the publisher /Offenlegung gemäß § 25 Mediengesetz
publisher: EcoSan Club, Schopenhauerstr. 15/8, A‐1180 Vienna, Austria • chairperson: Günter Langergraber • website: http://www.ecosan.at/ • scope: EcoSan Club was funded as a non profit association in 2002 by a group of people active in research and development as well as planning and consultancy in the field of sanitation. The underlying aim is the realisation of ecological concepts to close material cycles in settlements. Medieninhaber: EcoSan Club, Schopenhauerstr. 15/8, A‐1180 Vienna, Austria • Obmann: Günter Langergraber • Gegenstand des Vereins: Der EcoSan Club wurde 2002 als gemeinnütziger Verein von einer Gruppe von Personen gegründet, die in Forschung, Entwicklung, Planung und Beratung in der Siedlungshygiene ‐ Sammlung, Behandlung oder Beseitigung flüssiger und fester Abfälle aus Siedlungen ‐ tätig waren und sind. Das Ziel des EcoSan Clubs ist die Umsetzung kreislauforientierter Siedlungshygienekonzepte (EcoSan Konzepte) zu fördern, um einen Beitrag zum Schutz der Umwelt zu leisten.
Cover Photo /Titelbild © fotolia. http://de.fotolia.com
Sustainable Sanitation Practice 2 issue 1 /2009

Editorial With Sustainable Sanitation Practice (SSP) we try to make available high quality information on practical experiences with available sustainable sanitation systems. SSP should fill a gap that we have identified in the last few years in which sustainable sanitation has become an important issue that is discussed among many disciplines. For SSP a sanitation system is sustainable when it is not only economically viable, socially acceptable and technically and institutionally appropriate, but it should also protect the environment and the natural resources. SSP is therefore fully in line with SuSanA, the Sustainable Sanitation Alliance (www.susana.org). SSP is planned to be published quarterly, it will be available online from the journal homepage at the EcoSan Club website (www.ecosan.at/ssp/) for free. Thematic issues shall tackle selected fields of sustainable sanitation systems. Issue 1 is dedicated to "Greywater". Five contributions showing results from projects, in which members of the EcoSan Club Austria have been involved. The papers highlight experiences from East Africa, the Middle East and Europe. Each manuscript has been reviewed by two reviewers. By following this procedure we think that we could meet our expected quality standards. Greywater is wastewater generated from domestic processes such as dish washing, laundry and bathing, i.e. the part of the wastewater that was not in contact with human excreta. The general quality of greywater can be characterised by low contents of nutrients (nitrogen and phosphorus) and low microbiological contamination (indicator organisms and pathogens). Greywater can be treated effectively and is a good quality source to be reused for various purposes. However, if greywater is not treated and discharged in the environment it can cause serious problems. Greywater issues are therefore an important part within sustainable sanitation systems. The second issue is currently under preparation. The topic of Issue 2 will be "Successful models for operation and maintenance of sanitation systems" and will be published in January 2010. For this issue also experiences from outside EcoSan Club Austria will be presented. We would like to invite all interested persons to contribute articles to SSP, be available as reviewers and/or suggest topics for future issues. If you are interested and want to contribute as author and/or reviewer please contact for further details the responsible person for the SSP editorial office, Ms. Isabelle Pavese (Email: [email protected]). We think that only with this participatory approach it will be possible to target the content of SSP towards the expectations of the readers. With best regards, Günter Langergraber, Markus Lechner, Elke Müllegger EcoSan Club Austria (www.ecosan.at/ssp)
Content:
- Combined greywater reuse and rainwater harvesting in an office building in Austria: analyses of practical operation.............................................................................. 4
- Household greywater treatment for peri‐urban areas of Nakuru Municipality, Kenya.......................................................................................................................... 10
- Greywater use in peri‐urban households in Kitgum, Uganda....................................................................... 16
- Greywater treatment in apartment building in Austria................................................................................ 25
- Combined greywater treatment using a membrane bioreactor .................................................................. 30
Sustainable Sanitation Practice 3 issue 1 /2009
Sustainable Sanitation Practice 4 issue 1 /2009
Combined greywater reuse and rainwater harvesting in an office building in Austria: analyses of practical operation
Authors: Weissenbacher, Müllegger
Abstract The combined system of greywater treatment and reuse in a multi storey office building has been investigated over one year of operation. The system consists of an indoor constructed wetland, rainwater harvesting and water saving measures. The analyses covered quantitative and qualitative aspects like the water saving potential and physico‐chemical and microbiological parameters. The existing system has been compared to three other water use scenarios by the calculation of capital cost (investments, re‐investments) and operating costs (materials, labour and energy). The results showed that the system was capable to fulfil the physico‐chemical requirements suggest by different guidelines but could not ensure the hygienic quality for all operating conditions. In comparison to a conventional system the combined system was capable to reduce the fresh water demand by more than 60%. The economic comparison revealed that the installed system is more expensive than rainwater harvesting only but cheaper than greywater treatment only. The difference to the conventional system was mainly due to the additional labour costs for maintenance and operation. Non‐monetary benefits like the positive effect of indoor water treatment on the climate of the building have to be considered within the overall evaluation of such systems.
Introduction Modern water use concepts for buildings aim on saving natural resources ensuring minimum emissions like carbon dioxide and wastewater. Beside the ecological benefits, economic but also additional benefits arise: using the internal water cycle as a visible design element and improving the climate within the building at the same time. In contrast to easily accountable benefits like reduced freshwater consumption the former are more difficult to account for. Nevertheless, they have to be considered to allow a broader application of so called ‘green technologies’. A broad application of such technologies would be an important contribution to freshwater conservation. Before looking for alternative water sources, the first thing to consider is water saving measures. Nowadays, a variety of sanitary equipment to reduce the daily water consumption is available. Low flush toilettes and dry urinals have become common in many public and commercial buildings. Alternatives for fresh water sources are rainwater harvesting and reuse of separated and treated wastewater streams like greywater (wastewater of non‐toilet origin). Rainwater harvesting is dependent on the availability of sufficient precipitation. Collection and storage of rainwater is more or less common for single
households. The use of treated greywater for applications with lower water quality requirements like irrigation and toilette flushing is not new. Water reuse via greywater has been integrated as component of innovative building concepts since decades (Nolde, 1999). Although, the composition of greywater is different to domestic wastewater in terms of organics, nutrients and microbiological contamination, the treatment concepts applied mainly originate from wastewater treatment (Eriksson et al., 2009; Li et al., 2009). The applied systems vary from extensive biological treatment such as constructed wetlands (CWs) to more sophisticated methods (Knerr et al., 2008). Within the planning process, the three options of water saving, rainwater harvesting and greywater reuse
overall project:
NASPA
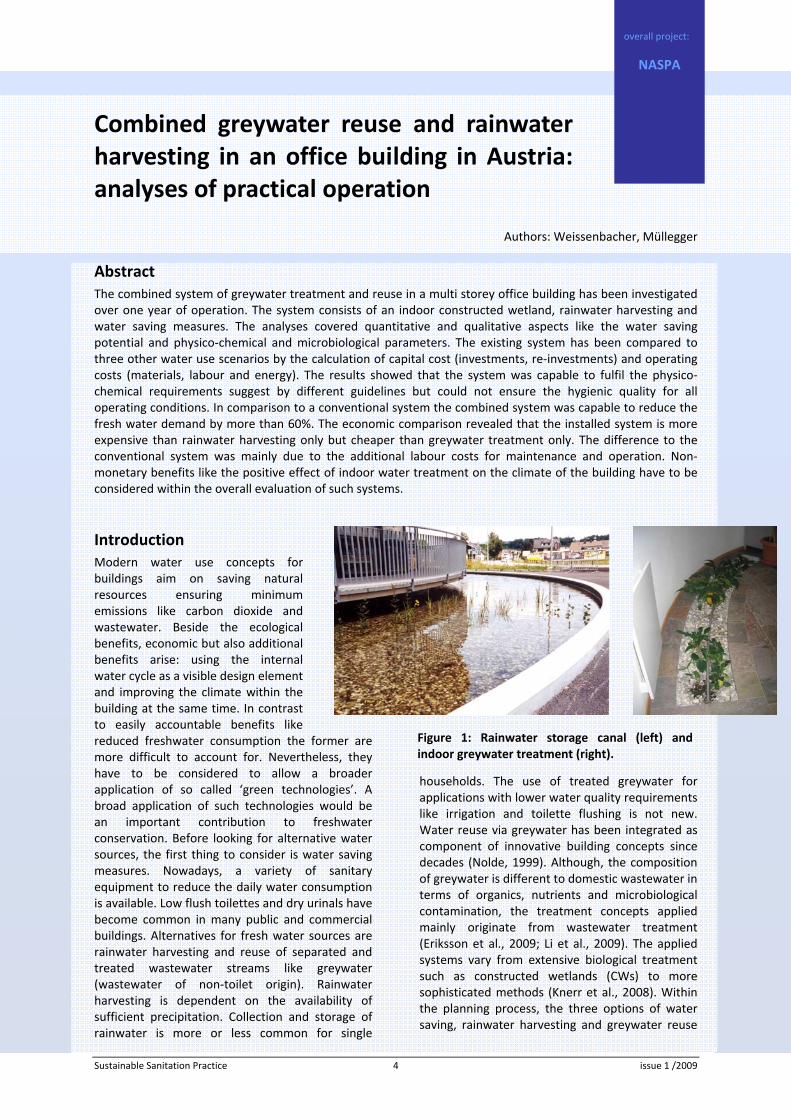
Figure 1: Rainwater storage canal (left) and indoor greywater treatment (right).

Greywater reuse in office building
Sustainable Sanitation Practice 5 issue 1 /2009
can be applied as single solutions or in combination. The users expect safe and clean water use at the same standard as with conventional systems. The question is how the applied alternative concepts reach these requirements (Reinoso et al., 2008). This paper attempts to describe the results of the analyses of one year operation of a combined system of water saving, rainwater harvesting and greywater reuse in a multi storey office building in Austria. According to the requirements for treated greywater stated by Nolde (1999), the aspects of hygienic safety, aesthetics, environmental impact and economic feasibility have been investigated.
Materials and methods The investigated building is a three story office building with a total floor space of 2090 m2 and roof area of 460 m2. The building is workplace for nine fulltime and five half‐time employees. Water is also used for the affiliated car wash and garage. Beside the normal operation, the building serves also as venue for conferences and meetings. The building has been constructed under the Austrian standards for green housing with energy consumption below 10 kWh per square meter and year. Construction was finished in 2003. It is connected to the public water supply and sewer system. The integrated water concept of the building comprises the following components:
‐ Water saving measures: Low flush toilets and dry urinals
‐ Rainwater harvesting: Roof collection and outdoor storage in an open canal (Figure 1, left)
‐ Greywater treatment: In‐door CW treatment (Figure 1, right)
Quantitative and qualitative measurements Treated greywater and rainwater is mixed in the water storage tank for non‐potable use (16 m3) and partly circulated over the indoor‐CW to avoid odour. Also the rainwater stored out‐door was circulated via a separate line. The scheme of the combined treatment system is shown in Figure 2. Water flow was measured continuously at the sampling points Q1‐07 over a period of one year. Additionally, the following parameters were analysed at the sampling points Q5, Q7 and Q8 (Figure 2):
‐ Organics: BOD5, COD, TOC. ‐ Nutrients: Total Nitrogen, Ammonium, Nitrite, Nitrate, Total phosphorus.
‐ Microbiological parameters: Total coliforms, E.coli, Enterococci.
‐ Suspended matter: Total suspended solids. ‐ On‐site parameters: Dissolved oxygen (DO), Electrical conductivity, Redox potential, pH and Temperature.
The lab analyses were carried out during three different sampling periods with monthly grab sampling (during one year), daily grab sampling (for one week) and 2h mixed samples (for two days). The applied indoor‐ greywater treatment is a vertical flow sub surface CW with a surface area of 3 m2. The configuration of the CW was 10 cm top layer of coarse gravel, 60 cm main layer (1 ‐4 mm) and 20 cm drainage layer. The inflow was intermitted at a flow rate of 15 L/min for one minute every eight minutes (100 L/h). The system was sparesly planted with Philodendron sp. and Spathiphyllun sp.
Economic analyses The economic analyses are based on a dynamic cost calculation using an overall interest rate of three percent for a life span of the system of 25 years and 12 years for mechanical and electrical equipment, respectively (LAWA, 2005). The analyses comprised investment costs, re‐investment costs and operation and maintenance costs. The latter cover energy costs, labour and material costs. Data was collected by interviews
Figure 2: Scheme of the combined greywater and rainwater system. Quantitative measurements have been carried out at points Q1 to Q7, qualitative sampling at points Q5, Q7 and Q8, respectively.
Greywater reuse in office building
Sustainable Sanitation Practice 6 issue 1 /2009
with the responsible operator. To compare the existing system with other possible options, the estimated costs of the system components reported at the planning stage have been used. The following planning scenarios were investigated:
‐ Conventional system ‐ Greywater treatment and reuse only ‐ Rainwater harvesting only ‐ Combined system (existing)
It is important to mention that the water saving measures have been considered as option for every planning scenario since the water consumption patterns directly influence the economics of the different variants. The economic benefit of water saving was calculates based on the local tariffs for public drinking water supply and wastewater disposal. For the calculation of labour costs, standard costs for technicians in Austria have been used.
Results and Discussion
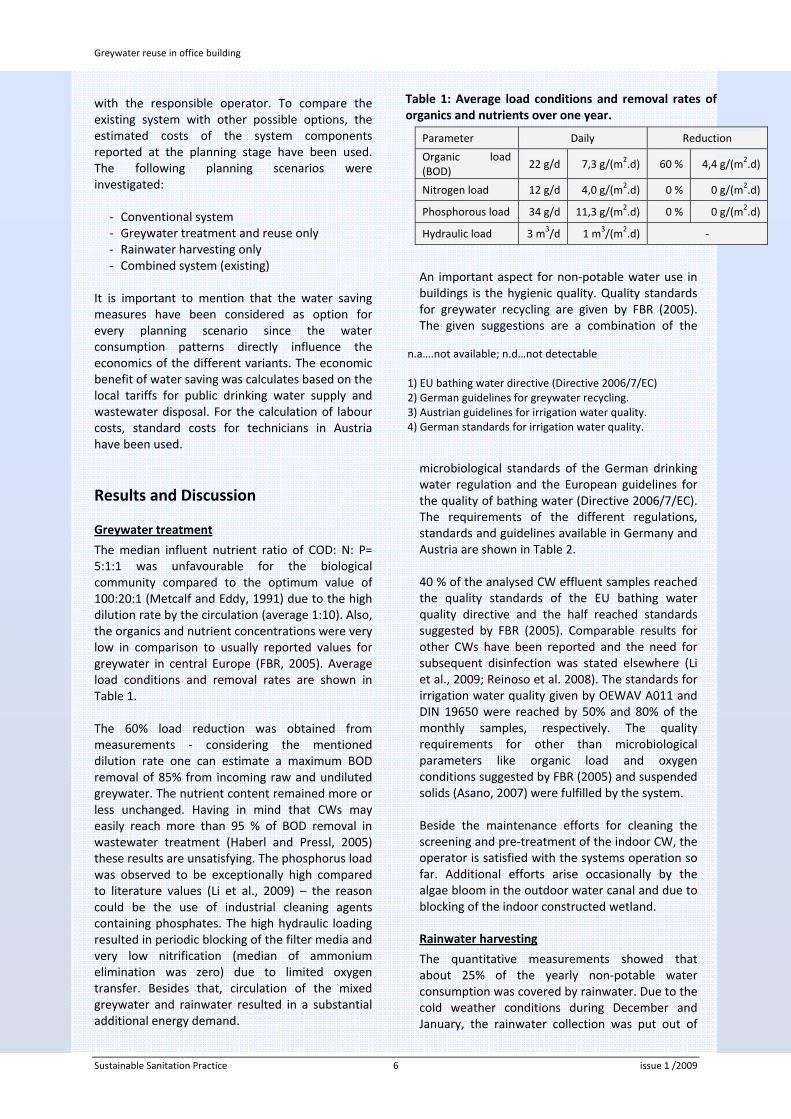
Greywater treatment The median influent nutrient ratio of COD: N: P= 5:1:1 was unfavourable for the biological community compared to the optimum value of 100:20:1 (Metcalf and Eddy, 1991) due to the high dilution rate by the circulation (average 1:10). Also, the organics and nutrient concentrations were very low in comparison to usually reported values for greywater in central Europe (FBR, 2005). Average load conditions and removal rates are shown in Table 1. The 60% load reduction was obtained from measurements ‐ considering the mentioned dilution rate one can estimate a maximum BOD removal of 85% from incoming raw and undiluted greywater. The nutrient content remained more or less unchanged. Having in mind that CWs may easily reach more than 95 % of BOD removal in wastewater treatment (Haberl and Pressl, 2005) these results are unsatisfying. The phosphorus load was observed to be exceptionally high compared to literature values (Li et al., 2009) – the reason could be the use of industrial cleaning agents containing phosphates. The high hydraulic loading resulted in periodic blocking of the filter media and very low nitrification (median of ammonium elimination was zero) due to limited oxygen transfer. Besides that, circulation of the mixed greywater and rainwater resulted in a substantial additional energy demand.
An important aspect for non‐potable water use in buildings is the hygienic quality. Quality standards for greywater recycling are given by FBR (2005). The given suggestions are a combination of the
microbiological standards of the German drinking water regulation and the European guidelines for the quality of bathing water (Directive 2006/7/EC). The requirements of the different regulations, standards and guidelines available in Germany and Austria are shown in Table 2. 40 % of the analysed CW effluent samples reached the quality standards of the EU bathing water quality directive and the half reached standards suggested by FBR (2005). Comparable results for other CWs have been reported and the need for subsequent disinfection was stated elsewhere (Li et al., 2009; Reinoso et al. 2008). The standards for irrigation water quality given by OEWAV A011 and DIN 19650 were reached by 50% and 80% of the monthly samples, respectively. The quality requirements for other than microbiological parameters like organic load and oxygen conditions suggested by FBR (2005) and suspended solids (Asano, 2007) were fulfilled by the system. Beside the maintenance efforts for cleaning the screening and pre‐treatment of the indoor CW, the operator is satisfied with the systems operation so far. Additional efforts arise occasionally by the algae bloom in the outdoor water canal and due to blocking of the indoor constructed wetland.
Rainwater harvesting The quantitative measurements showed that about 25% of the yearly non‐potable water consumption was covered by rainwater. Due to the cold weather conditions during December and January, the rainwater collection was put out of
Parameter Daily Reduction Organic load (BOD) 22 g/d 7,3 g/(m2.d) 60 % 4,4 g/(m2.d)
Nitrogen load 12 g/d 4,0 g/(m2.d) 0 % 0 g/(m2.d)
Phosphorous load 34 g/d 11,3 g/(m2.d) 0 % 0 g/(m2.d)
Hydraulic load 3 m3/d 1 m3/(m2.d) ‐
Table 1: Average load conditions and removal rates of organics and nutrients over one year.
n.a….not available; n.d…not detectable 1) EU bathing water directive (Directive 2006/7/EC) 2) German guidelines for greywater recycling. 3) Austrian guidelines for irrigation water quality. 4) German standards for irrigation water quality.

Greywater reuse in office building
Sustainable Sanitation Practice 7 issue 1 /2009
0
50
100
150
200
250
300
350
400
450
Septe
mbe
r
Octob
er
Novem
ber
Decem
ber
Janu
ary
Febru
ary
Mar
chApr
ilM
ayJu
ne July
Augus
t
Ave
rag
e w
ate
r co
nsu
mp
tio
n [
L/d
ay]
service during those two months. During this time period potable water was added to the storage tank for non potable use by back feeding (Figure 2). The circulation of rainwater in the out‐door canal resulted in additional energy consumption.
Water saving potential The water balance resulted in total water consumption of 145 m3 per year and a drinking water consumption of 83 m3 per year. The average water consumption was about 20 L per employee and day which is 20 % below the standard amount of 25 L given by the German guidelines for office buildings (VDI 3807). The combined greywater and rainwater use leads to an overall reduction of potable water demand of more than 60%. Since the wastewater discharge tariffs are linked to the drinking water consumption, this reduction also reduces the wastewater fees significantly. The daily drinking water consumption was 240 L/d (median) and the daily non‐potable water consumption was 320 L/d (median). During
conferences and meetings, the drinking water consumption
and hence the greywater
production was increased up to 2300 L/d. The
monthly averages of the daily water consumption are shown in Figure 3. The results confirm the
assumptions of the system design (300 l/d estimated for non‐potable use). The non‐potable use showed no significant yearly variation (Figure 4). This was not unexpected since no non‐potable water has been used for irrigation during the observations.
Economics Three additional system scenarios have been calculated to compare the costs and benefits of the existing system to other technical options. The scenarios can be described as follows:
‐ Scenario 0 (a/b): Conventional system. ‐ Scenario 1 (a/b): Combined rainwater harvesting ‐ greywater reuse system (existing).
‐ Scenario 2 (a/b): Greywater reuse system. ‐ Scenario 3 (a/b): Rainwater harvesting system.
Parameter Bathing water Non‐potable water Irrigation water
1) EU‐Dir. 2) FBR 3) OEWAV A011 4) DIN 19650
E. Coli /100ml <1,000 <1,000 <2,000 <2,000
Enterococci/100ml <400 n.a. <1,000 ‐
Salmonella /100ml n.a. n.a. n.a. n.d.
Coliforms /100ml n.a. <10,000 n.a. n.a.
Pseudomonas Aeruginosa /100ml n.a. <100 n.a. n.a.
Table 2: Summary of microbiological parameters suggested for different applications.
Figure 4: Average daily non‐potable water consumption over one year.
0
50
100
150
200
250
300
350
400
450
Septe
mbe
r
Octobe
r
Novem
ber
Decem
ber
Janu
ary
Febru
ary
Mar
chApr
ilM
ayJu
ne July
Augus
t
Ave
rag
e w
ater
co
nsu
mp
tio
n [
L/d
ay]
Figure 3: Average daily potable water consumption overone year.

Greywater reuse in office building
Sustainable Sanitation Practice 8 issue 1 /2009
As mentioned above, water saving measures have been considered for every technical option (sub scenarios (a) with and scenarios (b) without water saving measures). The capital value represents the total project costs at the start of operation. Savings due to lower water supply and disposal fees have been considered separately using an interest rate of 2.5%. The results in Table 3 show that the conventional solution is not the cheapest. The difference between the conventional scenario and the existing system lies with the relatively high personal costs for operation and maintenance. The low operating costs and medium investment costs lead to the good result for rainwater harvesting. Energy costs for pumping are relatively high when circulation of rainwater or treated greywater is necessary but low in comparison to labour costs for maintenance. Nevertheless, energy demands should be reduced as far as possible to foster the sustainable character of non‐potable water use systems. Further, the results indicate that greywater reuse only or rainwater harvesting only result in a higher drinking water demand and lower water saving potential. The influence of the water saving measures is evident for the scenarios 0 and 2. The influence on scenario 3 is relatively low, because the water saving measured impact the drinking water demand only in months without sufficient rainfall (winter months in Austria). The existing system showed the highest potential for water saving. Only about one third of the conventional scenario was consumed. The capital value of the installed system is more than 20,000 € higher than the cheapest scenario (rainwater harvesting). For the comparison of scenarios for decision making it is necessary to include non‐monetary aspects into the evaluation. The positive effect of indoor treatment plants of the buildings climate and the company’s reputation as green player may change the results above.
Conclusions Summarizing the main results from above, the following conclusions can be given:
‐ The removal performance of the indoor greywater treatment system in terms of organic matter and nutrients was below the reported performance of other comparable systems, but the required quality of the mixed non‐potable water for the physico‐chemical parameters was sufficient according to various guidelines. The required reduction of microbiological parameters could not be ensured for all operating conditions.
‐ The aesthetics of the non‐potable water was sufficient for all operating conditions, the use of mixed greywater and rainwater did not lead to any disorders over five years of operation.
‐ It was shown that the combined system of water saving, greywater reuse and rainwater harvesting leads to the highest fresh water savings. The existing combination allows a freshwater consumption of only one third of a conventional system.
‐ A comparison of the capital costs of the existing combined system to three additional water use scenarios shows that the existing system is more expensive than rainwater harvesting but cheaper than greywater reuse only. The difference to a conventional concept is rather low and the additional costs are mainly due to the high labour costs for operation and maintenance. Non‐monetary benefits like the positive climatic effect for the building can be also accounted for the installed system.
Within five years of practical experience, the system fulfilled the expectations of the operator of this multi storey office building. Drawbacks are the
Scenarios Investments €
Re‐Investments
€
Operating costs €/a
Drinkingwater demand m3/a
Capital value €
0 a‐ Conventional 9,100 1,500 1,500 145 36,900
0 b‐ Conventional 8,400 900 1,700 170 38,000
1 a‐ Combined 17,300 3,100 2,200 62 47,400
1 b‐ Combined 16,600 2,500 2,200 62 43,400
2 a‐ Greywater 16,740 3,100 2,300 73 49,100
2 b‐ Greywater 16,000 2,500 2,400 104 52,000
3 a‐ Rainwater 13,750 2,500 1,200 83 28,800
3 b‐ Rainwater 13,000 1,920 1,200 88 25,900
Table 3: Comparison of the costs and the water savingpotentials of the different water use scenarios (life span 25years, re‐investment period 12 years, interest rate 3% p.a.).

Greywater reuse in office building
Sustainable Sanitation Practice 9 issue 1 /2009
high energy demand of the greywater treatment system due to the circulation and the related adverse influence on the treatment performance and filter permeability. Dilution and intensive circulation over the constructed wetland should be avoided. Acknowledgements This work has been funded by the Austrian Federal Ministry of Agriculture, Forestry, Environment and Water Management (BMLFUW) within the project “Sustainable Sanitation – Practical Application (NASPA)”; Duration: February 2007 ‐ July 2009. References Asano T. (2007): Milestones in the reuse of municipal
wastewater. Proceedings of water supply and sanitation for all, Berching, Germany, pp.295‐306.
Eriksson E., Andersen H.R., Toke S. Madsen T.S, Ledin A. (2009): Greywater pollution variability and loadings. Ecological Engineering 35, 661–669.
FBR (2005): Hinweisblatt 2005 – Grauwasser Recycling. Planungsgrundlagen und Betriebshinweise. Fachvereinigung Betriebs und Regenwassernutzung, Darmstadt, Germany [in German].
LAWA (2005): Leitlinien zur Durchführung dynamischer Kostenvergleichsrechnungen (KVR‐Leitlinien). Länderarbeitsgemeinschaft Wasser, Berlin, Germany.
Li F., Wichmann K., Otterpohl R. (2009): Review of the technological approaches for grey water treatment and reuses. Science of the Total Environment 407, 3439–3449.
Knerr H, Engelhart, Hansen J, Sagawe G. (2008): Separated grey‐ and blackwater treatment by the KOMPLETT water recycling system — a possibility to close domestic water cycle. Proceeding of Sanitation Challenge: New Sanitation Concepts and Models of Governance, Wageningen, The Netherlands, pp.260‐269.
Metcalf and Eddy, Inc (1991): Wastewater engineering — treatment, disposal and reuse. In: Tchobanoglous G, Burton FL, editors. McGraw‐Hill series in water resources and environmental engineering. 3rd edition. New York, USA.
Nolde E. (1999): Greywater reuse systems for toilet flushing in multi‐storey buildings — over ten years experience in Berlin. Urban Water 1, 275–84.
Pressl A. und Haberl R. (2005): Übersicht und Vergleich von Kleinkläranlagen. Wiener Mitteilungen, Band 194, D1‐ D32 [in German].
Reinoso R., Torresa L.A., Bécares E. (2008): Efficiency of natural systems for removal of bacteria and pathogenic parasites from wastewater. Science of the Total Environment 395, 80‐86.
Name: Elke MülleggerOrganisation: EcoSan Club, Town, Country: Austria
Name: Norbert Weissenbacher Organisation: University of Natural Resources and Applied Life Sciences, Vienna; Institute for Sanitary Engineering and Water Pollution Control
Town, Country: Austria Corr.: [email protected]

Greywater reuse in office building
Sustainable Sanitation Practice 10 issue 1 /2009
Technical detail: - subsurface horizontal flow constructed wetlands with septic tank for pre‐treatment (cleaning 4
times/year); 2m² surface area, gravity flow; fine gravel (D60=3,5mm) is used for the filter body; Hydraulic loading rate is 50 mm/d
overall project:
Household greywater treatment for peri‐urban areas of Nakuru Municipality, Kenya
Within the EU funded ROSA‐project (Resource oriented Sanitation concepts in peri‐urban areas in Africa) different greywater treatment pilot systems were implemented and assessed in Nakuru municipality.
Authors: Raude, Mutua, Chemelil, Kraft, Sleytr
Abstract Within the EU funded project ROSA (Resource oriented Sanitation concepts in peri‐urban areas in Africa) a baseline survey was carried out to asses the current greywater disposal situation, the quantity and quality of greywater in the peri urban areas of Nakuru, Kenya. It was found out that most of the produced greywater is not used, not reused and not treated although contaminated with nutrients and bacteria. Therefore there is a big demand for adequate treatment systems which are implemented within the ROSA project and presented in this article.
Introduction Around the entire world, insufficient access to safe water and basic sanitation has led to more deaths than in military conflicts. According to estimates by UNDP (2006), for every single minute, over 3 children lose their lives due to diseases related to unsafe water and poor sanitation. The World Health Organization (WHO) attributes 13‐17% mortality from diarrhoea for children less than 5 years of age. Safe water and basic sanitation must be regarded as a basic human right and should therefore be accessible and affordable to all (MWI, 2007). To achieve the UN Millennium Development Goals (MDGs) and the national strategy in the Economic Recovery Strategy for Wealth and Employment Creation (ERS‐WEC), it is important to address sanitation challenges in urban and peri‐urban areas. Kenya faces serious challenges with regard to water and sanitation services. Despite the efforts of investments provided in the past years by the government and development partners, existing facilities have continued to deteriorate and have also failed to meet the demand of the equally increasing population (MWI, 2007). These challenges are particularly severe in many rural and rapidly growing settlements of urban poor where over 60% of the urban populations live. With a population growth of about 8% in the low income urban settlements
(MWI, 2007), many unplanned structures still continue to be built. Greywater (wastewater stream from kitchen, laundry, sinks, bath‐tubs and showers) produced by the average household is the largest in volume. When freshly released, it contains a relatively lower number of potentially harmful compounds. Consequently, it is often discharged untreated into a watercourse or any available empty space under the assumption that serious damage might not result. These practices however present potential risks of transmission of a large number of water‐related diseases. Hence, there is need for proper management of aquatic resources and also of the pollutants. A sensible management strategy involves analysis of the composition of greywater and creating a barrier through quality improvement before reuse or safe disposal. Therefore in this study greywater was characterized in quantity and quality to define, design and build adequate treatment options.
Current situation in Nakuru Nakuru municipality in Kenya, where centralised sewerage connection is inadequate, faces a serious challenge of sustainable access to safe wastewater disposal in the unplanned settlements. In such areas, safe wastewater disposal can be achieved by

Household greywater treatment ‐ Nakuru
Sustainable Sanitation Practice 11 issue 1 /2009
66.9
29
3 1.10
10
20
30
40
50
60
70
80
Empty space Septic/Pit-latrine Cleaning Pit-latrine Others
Disposal Method
Per
cen
tag
e D
isp
osa
l/U
se
in‐situ separation of domestic wastewater in various streams (grey, yellow, beige, brown and black water) at the source of generation and handling each stream individually. Beige water is anal cleansing water; yellow water is wastewater stream made up of urine and flush water. Black water is a combination of brown and yellow water which is also referred to as night soil while brown water is wastewater stream composed of faeces and flush water. Source separation allows for adequate treatment of different wastewater flows according to their characteristics. The generated amount of greywater is influenced by factors such as existing water supply services and infrastructure, number of household members, age distribution, lifestyle characteristics etc. (Morel and Diener, 2006). It greatly varies as a function of these dynamics of the households. Table 1 shows daily produced greywater amounts per household in 4 selected areas in Nakuru. Greywater is disposed of in any open spaces available, plastic paper filled storm water drains (Figure 1) or sometimes re‐used with limited pre‐treatment.
Figure 1: Greywater disposal to storm water drain in Nakuru
Table 1: Calculated amount of produced greywater per household (Kraft, 2009)
Sampling area Daily water use
[l/d] Greywater produced
[l/d]
Kaptembwo 85 64
Kwa Rhonda 90 67
Mwariki 97 72
Lake View 77 57
The common practice in the investigated settlements is to dispose greywater in septic tanks and pit‐latrines (29 %) as presented in Figure 2. As a result, most pit‐latrines emit foul smell and are full of flies. However, though to a limited extend (3 %) greywater is reused for cleaning pit‐latrines thus increasing the problem even further. This common practice has resulted in a major environmental and public health concern to the residents. The choice of technology in these areas for basic wastewater management is a household decision because
ownership and acceptance by the household is a key to sustainable greywater treatment. Decentralized wastewater treatment systems range in size from individual on‐site systems serving one household to shared facilities serving about 40 households or public facilities for several households sharing one sanitary facility. However, there is need to develop different treatment options to offer technical solutions in order to reduce health and environmental risks as a result of domestic greywater pollution. This work proposed promoting resources‐oriented sanitation, where available nutrients in the effluent can be utilized while reducing environmental pollution. This can drastically reduce fertilizer usage whose price is beyond the reach of urban farmers. Resources‐oriented sanitation that also includes greywater and solid waste management offers economically, ecologically sustainable and
Figure 2: Main greywater disposal practice in the investigated areas of Nakuru

Household greywater treatment ‐ Nakuru
Sustainable Sanitation Practice 12 issue 1 /2009
culturally acceptable systems that aim at closing the natural nutrient and water cycle. This can be achieved through best sanitation management practices aimed at improving public health and general environment. Since good hygiene and adequate sanitation are pre‐requisites for good health, safe disposal or reuse of greywater can be a solution to achieving good hygiene. Population density however presents itself as a challenge since sanitation related health risks are high in densely populated urban areas. Furthermore, the unplanned settlement structures, like most of the peri urban areas inhibit the integration of sanitation systems. As a result, sewerage connections become technically impossible to construct and sometimes to operate leading to current greywater disposal methods in use that involve emptying in any available open space including roads and foot paths. For safe disposal, greywater can be treated by subjecting it to an on‐site treatment system such as the household based constructed wetland at Lake View settlement (Figure 3) and Crater View Secondary School in Nakuru Municipality, Kenya.
Figure 3: Lake View settlement area To address this problem a horizontal‐sub‐surface flow constructed wetland (HSSF CW) was established at Lake View and Crater View Secondary School through the support of ROSA project (Langergraber et al, 2008). Within this project a survey to identify and characterise greywater generation and disposal habits in Nakuru provided the basis for designing and implementing resource‐oriented greywater treatment systems. In Table 2 the mean values for the following physico‐chemical and bacteriological parameters are given: Temperature, pH, Dissolved Oxygen (DO), 5‐day Biochemical Oxygen Demand (BOD5), electrical conductivity (EC), salinity, Total Dissolved Solids (TDS), turbidity, Total Suspended Solids (TSS), organic‐ and inorganic content, total phosphorus, ortho‐phosphohate, ammonia‐
nitrogen (NH4‐N), nitrate‐nitrogen (NO3‐N), nitrite‐nitrogen (NO2‐N)and Faecal Coliforms (FC) of 59 greywater samples (24 samples from kitchen, 25 samples from laundry, 10 samples from combined greywater and additional five source water samples). All methods used for the greywater analyses were according to the Manual for Water Quality Analysis, Egerton University, Kenya (Oduor, 2008) Table 2: Summary of the greywater and source water characteristics (median values) (Kraft, 2009)
n.d. ..not detectable
Piloting area‐ Nakuru Municipality Nakuru municipality is on the floor of Great Eastern branch of the Rift Valley and the fourth largest city in Kenya. It is also the administrative headquarters of Rift Valley province and a hub of the province’s commercial activities. The town lies between latitude 0° 10’ and 0° 20’ South and longitude 36° 10’ East and at 1859 m above sea level (MCN et al., 1999). It covers an area of 290 km² of which Nakuru National park takes 188 km² leaving 102 km² to town functions. The population is estimated at 450,000 people (MCN et al., 1999). This municipality like many other urban centres in Kenya has experienced a rapid population growth
Parameter Unit Kitchen Laundry Combined Source
Amount l/d 5.5 56 65.5 87.5
Temperature °C 20.7 20.0 18.3 23.4
pH 8.1 9.4 8.4 7.0
DO mg/l 2.17 3.98 1.16 3.50
BOD5 mg/l 445 449 455 13
EC µS/cm 974 1365 1247 323
Salinity g/l 0.45 0.50 0.55 0.20
TDS mg/l 800 993 981 223
TSS mg/l 1255 1090 775 2.00
Org. content mg/l 1200 870 545 1.60
Inorg. content mg/l 80 260 220 n. d.
TP mg/l 7.59 9.02 8.28 0.04
SRP mg/l 3.82 2.77 4.96 0.05
NH4‐N mg/l 2.13 5.29 7.32 n. d.
NO3‐N mg/l 3.68 2.44 1.97 3.49
NO2‐N mg/l 2.63 8.61 2.71 n. d.
FC log cfu/ 100ml
7.05 5.49 7.04 1.19

Household greywater treatment ‐ Nakuru
Sustainable Sanitation Practice 13 issue 1 /2009
thus exerting pressure on existing water and wastewater management facilities.
Implementation of greywater treatment options
Results from Table 1 and Table 2 were used as a guide in developing site specific greywater quality improvement systems ideal for the high density population, low income peri‐urban settlements. Table 3 presents some of the considerations in design and construction of the HSSF CW system at Crater View Secondary School and Lake View residential area. The design of the wetland was based on the rule of thumb such as the Austrian and German design standards (ÖNORM B 2505, 2008, and DIN A‐262, 2006, respectively) without considering and quantifying the processes occurring inside such filters in detail. More recently, however, efforts have been made to understand and quantify processes in pilot facilities (Langergraber, 2008). To avoid creating another environmental problem in form of malaria mosquito breeding sites, horizontal subsurface flow (HSSF) constructed wetland (CW) system was chosen and water surface maintained at 15‐30 cm
below the ground level. To sensitize a wider group from Nakuru Municipality, the pilots were established at one residential area (Lake View) and a secondary school (Crater View). Development of a greywater treatment system involved consideration of institutional and social issues in addition to technical factors. These issues influenced controlled decision making during the planning and preliminary design stages. Also, it involved using a guide to project development after Reeds et al. (1995) involving characterization of greywater by defining the volume and composition to be treated. Concept feasibility which involves determining if any of the natural systems are compatible with site conditions and requirements for greywater treatment.
Figure 4: Greywater disposal in Nakuru
Figure 5 Greywater disposal in Nakuru Figure 6: Greywater sampling
No Name Description
1 Pre‐treatment Two chamber ( 0.25 & 0.75 m³) litter trap, coarse organic matter; grease trap of cleaning interval not more than 4 times/yr
2 Surface area Horizontal sub‐surface flow constructed wetland (HSSF CW); length = 2m, width = 1m 3 Inlet Stone distributor; slotted pipe for greywater distribution, inlet depth = 0.86m 4 Treatment volume Fine gravel (D60 = 3.5mm, Cu = 1.8); initial porosity = 40%; with an average wetted
depth of 0.875m; Hydraulic conductivity was 17m/day 5 Outlet Outlet depth = 0.9m; variable effluent outlet height 6 Flow Flow rate is set at 1m3/day; hydraulic loading rate (HLR) is 500mm/day 7 Other design
considerations bottom slope of 1‐2%; gravel media; geo membrane liner of 1mm thickness
8 Filter material Building sand cheap and locally available (3‐8mm grain‐size) 9 Plants Vetiver grass (Vetiveria zizanioides) 10 Retention time 2 days 11 Cost Treatment system including hand‐wash facility Euros 1, 500
Table 3: Design details

Household greywater treatment ‐ Nakuru
Sustainable Sanitation Practice 14 issue 1 /2009
Figure 7: Washing facility‐ Crater View Secondary School
Figure 8: James and Laura – sampling at the HSSF CWs
Results and discussion The removal rates of the HSSF CW based on an average percentage pollutant reduction are presented in Table 4: BOD5 99.7%, TSS 97%, TP 88.%, NH4‐N 97% and FC 18% . Sampling commenced four months later after the plants had established. This greywater treatment system was designed with a retention period of less than 48 hours in the settling tank. However, water flow from a nearby borehole through the washing facility was highly variable. The variability was caused by pumping power fluctuations as a result of blackouts and power rationing affecting the entire country. Low electricity output occasioned by low water levels in the hydro‐power stations influenced the systems. Consequently, greywater turned septic due to longer storage periods in the settling tanks. A fence had to be built around the site to avoid possible health risks for students that wanted to investigate the system by digging holes into the filter bed and to protect the plants from being eaten by animals.
The general reaction from the school community was positive though with some disappointments. They had a very high expectation of using the effluent for irrigation in the school kitchen garden but due to its high bacterial contamination the outflow of the pilot system could not be recommended for save use. In consecutive studies it is planned to adapt the greywater treatment systems to improve the effluent quality so it can be used safely.
Conclusion Based on these results and further piloting, HSSF CWs are a promising technology in urban and peri‐urban areas that are not served by the central sewer system. Within Nakuru municipality, many poor households are unable to access wastewater collection, transport and treatment services that could save the lives of children and adults from water related ailments. Unless these services reach the poorest, universal coverage will not be achieved. New sanitation policies and initiatives often pay little attention to the greywater handling systems. Population growth and urbanization are a major challenge and present themselves as the main obstacle in integrating sanitation in these settlements. Meanwhile, urban residents continue to suffer from poor sanitation. High child mortality due to poor hygienic conditions is a harsh illustration of the inequalities in society. Generally, problems of poverty are inextricably linked with those of water; its availability, proximity, quantity and quality. The combination of safe drinking water and hygienic sanitation facilities as presented in this case of household based greywater treatment is a pre‐condition for good health and success in the fight against poverty, hunger, child deaths and gender inequality. This is also one way of unlocking the billions of people locked in the cycle of poverty and diseases worldwide. Thus, piloting is a tool that helps mobilize community members towards collective action and empowers them to take further action in the future. The outcomes illustrate what communities can achieve by undertaking further initiatives for their own environmental management.
Parameter EC Salinity DO TDS BOD5 TSS TP FC NH4+
Units μS/cm g/l mg/l mg/l mg/l mg/l mg/l Log 10 FC/100ml mg/l
Influent 1929 1.0 3.01 1257 104.0 255 2.43 4.97 3.17
Effluent 1644 0.8 0.08 1084 0.33 9 0.29 4.09 0.09
Reduction [%] 14 20 ‐ 14 99.7 97 88 18 97
Table 4: Results from influent – effluent laboratory sample analysis

Household greywater treatment ‐ Nakuru
Acknowledgements The work is carried out within the project ROSA (Resource‐Oriented Sanitation concepts for peri‐urban areas in Africa; Contract No. 037025‐GOCE; duration: 1.10.2006 – 31.3.2010), a Specific Target REsearch Project (STREP) funded within the EU 6th Framework Programme, Sub‐priority "Global Change and Ecosystems". The authors are grateful for the support. References DWA‐A 262 (2006): Grundsätze für Bemessung, Bau und Betrieb
von Pflanzenkläranlagen mit bepflanzten Bodenfiltern zur biologischen Reinigung kommunalen Abwassers. Arbeitsblatt, DWA ‐ Deutsche Vereinigung für Wasserwirtschaft, Abwasser und Abfall e.V., Hennef, Germany [in German].
Kraft, L. (2009): Characterisation of Greywater from peri‐urban areas in Nakuru, Kenya. Master theses; BOKU University, Vienna, Austria.
Langergraber, G. (2008): Modeling of Processes in subsurface flow constructed wetlands‐ A review. Vadoze Zone Journal 7(2), 830‐842.
Langergraber, G., Meinzinger, F., Lechner, M., de Brujne, G., Sugden, S., Niwagaba, C.B., Mashauri, D., Mutua, B.M., Teklemariam, A., Achiro, I., Kiarie, S.C., Laizer, J.T., Ayele, W. (2008): The ROSA project – A new approach to sustainable sanitation in Eastern African cities. Proceedings of the 6th IWA World Water Congress, 8‐12 September 2008, Vienna, Austria. (CD‐ROM, paper 664279)
MCN, (1999): Municipal Council Nakuru Strategic Structure Plan. Action Plan for Sustainable Urban Development of Nakuru town and its Environs, Volume 1. GoK, Nakuru, Kenya.
Morel A. and Diener, S. (2006): Greywater Management in Low and Middle‐Income Countries, Review of different treatment systems for households or neighbourhoods. Sandec (Swiss Federal Institute of Aquatic Science and Technology (Eawag): Dübendorf, Switzerland.
MWI (2007): Ministry of Water and Irrigation. Awareness Raising and Marketing Strategies. Accelerating Access to Sanitation. East African Regional Conference, 27‐28 November 2007, Nairobi, Kenya.
Mathew Chemelil Organisation: Department of Agricultural Engineering, Egerton University
Town, Country: Egerton, Kenya e‐mail: [email protected].
[email protected], [email protected]
Benedict Mutua, Name: James Raude,
Town, Country: Vienna, Austria e‐mail: [email protected],
Name: Laura Kraft, Kirsten Sleytr Organisation: University of Natural Resources and Applied Life Sciences, Vienna; Institute for Sanitary Engineering and Water Pollution Control
Odour, S.O. (2008): Manual for Water Quality Analysis. Egerton University, Njoro, Kenya
ÖNORM B 2505 (2005): Bepflanzte Bodenfilter (Pflanzenkläranlagen) – Anwendung, Bemessung, Bau und Betrieb (Subsurface‐flow constructed wetlands – Application, dimensioning, installation and operation). Österreichisches Normungsinstitut, Vienna, Austria [in German].
Reed, S.C; Crites, R. W; and Middlebrooks, E.J (1995): Natural systems for waste management and treatment. McGraw‐Hill, New York, USA.
UNDP (2006): United Nations Development Program, Environment and Energy. http://www.undp.org/water (last access: 01.10.2009).
Sustainable Sanitation Practice 15 issue 1 /2009

Household greywater treatment ‐ Nakuru
Sustainable Sanitation Practice 16 issue 1 /2009
Technical detail:
greywater tower gardens; poles (wooden, iron bars or fence posts) and shading material surrounding the soil and a central stone‐packed drain; vegetables (e.g. tomatoes, spinach) are planted into slits of the shading material in the soil;
overall project:
Greywater use in peri‐urban households in Kitgum, Uganda
Authors: Kulabako, Kinobe, Mujunga, Olwenyi, Sleytr
Abstract In this study, undertaken within the ROSA project (Resource oriented Sanitation concepts in peri‐urban areas in Africa), an understanding of greywater characteristics is created to demonstrate a low cost reuse option involving direct application of untreated greywater to small so called “greywater towers” at household level in peri‐urban settlements in Kitgum Town Council. It can be concluded that greywater towers provide a simple method to treat and use greywater for gardening.
Introduction Urbanization in cities of the developing world like Uganda is virtually synonymous with formation of dense human settlements inhabited by the poor, lack of adequate safe drinking water, lack or inadequate sanitation (excreta, greywater and solid waste) and generally a degraded environment. The high populations living under such conditions are subject to health risks. With the increasing demand for freshwater, it is of paramount importance that water consumption shifts towards one, which promotes consumption of adequate amounts of water of acceptable quality. However, this shift requires that alternative sources of water are identified. Experiences elsewhere in the world including several arid and semi‐arid countries indicates that greywater can be a cost effective alternative source of water (Morel and Diener, 2006). Greywater is water coming from cloth washers, bathtubs, showers, kitchen sinks and dishwashers and comprises between 50 to 80% of residential wastewater (Al‐Jayyousi, 2003). Governments allocate substantial amounts of money to develop, treat and transport water resources. On the other hand, more money is spent to collect wastewater, treat it and then transport it to distant places for potential uses. To address the externalities of this paradigm, attention is to be focused on small‐scale and on‐site treatment of wastewater/greywater. In Uganda, very few households particularly in the peri‐urban settlements are connected to the sewerage system. In Kampala, the capital city of Uganda < 7% of the city’s households are
connected to the sewerage system with the majority using on‐site sanitation systems while in Kitgum Town Council (KTC), a semi‐arid town in Northern Uganda, on‐site sanitation systems predominate (ROSA, 2007). In the peri‐urban areas of Kitgum town like in most cities of developing countries, greywater is disposed of, untreated onto the ground and into open storm water drains. The unsanitary disposal results in creation of malaria mosquito breeding grounds, smelly stagnant waters, children falling ill after playing in the wastewater, etc. (ROSA, 2007). The majority of the communities in the peri‐urban settlements of KTC do not reuse the greywater and yet frequently experience water supply shortages following power outages (pumping from the central water supply stalls) and have an inadequate number of boreholes (ROSA, 2007). According to Imhof and Muhlemann (2005), the main barrier for wider and faster dissemination of suitable greywater management systems at household level in the developing countries, is the lack of knowledge and experience. Scientific knowledge is sparse regarding greywater characteristics allowing its reuse. This study, undertaken within the ROSA project (Langergraber et al., 2008), seeks to create an understanding of greywater characteristics and demonstrate a low cost reuse option involving direct application to small gardens at household level in peri‐urban settlements in KTC.

Household greywater use‐ Kitgum
Sustainable Sanitation Practice 17 issue 1 /2009
Background The project ROSA (Resource‐Oriented Sanitation concepts for peri‐urban areas in Africa, Langergraber et al., 2008) promotes resource‐oriented sanitation concepts as a route to sustainable and ecological sound sanitation in order to meet the UN Millennium Development Goals (MDGs). The project is undertaken in four pilot cities in East Africa namely Arba Minch (Ethiopia), Nakuru (Kenya), Arusha (Tanzania) and Kitgum (Uganda). These cities have a population from several 10,000 up to 500,000 inhabitants and share common problems, e.g. they are situated in rather dry regions resulting in lack of water, have relatively high population growth rates and poor sanitation facilities, if available at all. Kitgum district is located in Northern Uganda, 452 km from Kampala. The district has experienced civil war characterized with death, abduction, rape, and destruction of social infrastructures and displacement of the people for the last two decades. As a result of this instability, poor sanitation and lack of safe water are the biggest problems encountered in Kitgum. The project study area KTC is the districts headquarter and commercial center of Kitgum district. The town council has an area of 30 km2 with a population of 62,000 inhabitants spread over 11 parishes and 36 villages. The area includes urban, peri urban and rural typical settlement structures in terms of housing and population density.
Material and methods
Research baseline
To ascertain the baseline situation in the study area regarding greywater reuse practices (if any), a review of available publications and or reports was undertaken. Additionally, interviews were held with 38 households within Kitgum Town Council area.
Identification and sensitisation of study households
The characterization of greywater and installation of greywater towers was limited to selected households in Pondwongo village in KTC. Pondwongo was selected because it is a semi‐arid area with water scarcity problems necessitating alternative water sources for agriculture. The selection of the study households involved consultations with the town council authorities, community leaders and local residents by the research team. Seven households categorized as i) high class: households with iron roofed houses with cemented floors and plastered walls; ii) medium class: households with iron roofed houses,
could lack cement and/or not plastered and, and iii) low class: households with grass thatched were selected. The selected households were sensitized on how greywater could be utilised through agriculture and the associated potential benefits (Figure 1).
Figure 1 Sensitisation of the households by the research team
For greywater treatment the technology of greywater towers (as described in Crosby, 2005) was selected as it is a simple, innovative system, which uses greywater for growing vegetables on a small footprint (<1 m2) and can be easy self constructed with a few and local materials. Further more it is easy to operate and maintain.
Setting up of the greywater towers
3 greywater towers were set up at each of the selected households. At one household, a control tower garden was set up in exactly the same way as the greywater tower. It was also planted with the same vegetables, but with the only difference that it was being fed with groundwater and not with greywater. Greywater towers are a user friendly and innovative way of using greywater for gardening in low and middle income countries and have been implemented for example in Kenya, South Africa and Ethiopia. The study households were trained by the research team on how to set up the greywater towers as well as on the operation and maintenance aspects of these for effective performance. When setting up a greywater tower garden, a circle was marked out on the ground with a diameter as that of the shade cloth (Figure 2a). This circle was dug out to form the bottom layer of the tower garden. Side wooden poles (2m high) were planted firmly into the bottom following which a shade cloth was tied around the poles to make a cylinder (Figure 2b). The sides of the shade cloth were then rolled cylinder out before back filling (Figure 2c).

Household greywater use‐ Kitgum
Sustainable Sanitation Practice 18 issue 1 /2009
g h f e
a c d b
i kj
Figure 2 Setting up of a tower garden at one of the households in KTC
The back fill consisted of a mixture of three parts of soil, two parts of animal manure and one part of ash to provide facility. The different parts were measured out by volume using a bucket (Figure 2d). The backfill was then well mixed before applying it (Figure 2e). A bucket with its bottom removed was placed at the bottom in the middle of the tower (Figure 2f). Stones were carefully packed in the bucket in such a way that did not permit fast flow of the water through (Figure 2g). The sides of the bucket were back filled with the soil mixture (Figure 2h). The bucket was then partially pulled out leaving the stones in position. The bucket was placed again and filled with stones and sides back filled (Figure 2i). This was repeated for each soil layer until the top layer of the tower garden (Figure 2j and Figure 2k).
Operation of the greywater towers
Greywater towers were operated in such a way that greywater from the bathroom and laundry
was applied on a daily basis. On average each greywater tower could receive about 3 litres of greywater per day. Over the weekend, the greywater towers were splashed with 2 buckets (about 10litres) of clean water to wash away the soap. Selected vegetables such as tomatoes and onions were planted on the greywater towers. The control tower garden received about 3 litres of groundwater per day that was used by the household for domestic purposes.
Greywater sample collection and analysis
Samples were collected from 6 households every two to three weeks from 3 greywater streams (kitchen, laundry and bathroom) for a period of 6 months. Physico‐chemical and bacteriological analyses of the greywater were determined for the selected parameters: pH, Dissolved Oxygen (DO), Electrical conductivity (EC), Temperature, Total Dissolved Solids (TDS), Turbidity, Chemical Oxygen Demand (COD), 5‐day Biochemical Oxygen Demand (BOD5), Ammonia‐Nitrogen (NH3‐N), Ortho
Household greywater use‐ Kitgum
Sustainable Sanitation Practice 19 issue 1 /2009
Phosphorus, Total Phosphorus, Sodium Adsorption Ratio (SAR) and E. Coli. The parameters pH, DO, EC and Temperature were determined in‐situ using a calibrated multi‐parameter meter (Quanta‐Hydrolab). Samples for physico‐chemical and bacteriological analyses were collected in acid rinsed and steriled bottles respectively, stored in a cool box at 4
oC and transported for analysis to the Public Health and Environmental Engineering Laboratory at Makerere University in Kampala. Prior to the analysis for ortho and total phosphorus, and ammonia nitrogen. The samples
were filtered through a 1.2 m Whatman glass microfibre filter paper (GF/C). COD was determined using the Closed Reflux, Titrimetric method (APHA/AWWA/WEF, 1998). BOD5 was determined by pressure difference within a closed system (BOD5 CW7000 direct reading apparatus) according to the instrument manual. Total phosphorus was determined using the ascorbic acid method with persulfate digestion while Ortho phosphorus was measured using the ascorbic acid method (APHA/AWWF/WEF, 1998). NH3‐N was determined using the Direct Nesslerization method (APHA/AWWF/WEF, 1998). Potassium, sodium, calcium and magnesium were determined using atomic absorption spectrometry (Perkin‐Elmer 2380). Sodium Adsorption ratio was calculated from the measured concentrations of sodium, calcium and magnesium ions (Alit et al., 2006). E.Coli determination was according to the membrane filtration technique using Chromocult agar (APHA/AWWF/WEF, 1998).
Soil sample collection and analysis
To ascertain the impact of the greywater on the soils, soil samples were collected at each household initially prior to greywater application and analyzed for pH, organic matter content, nitrogen, phosphorus and potassium. After the application of greywater, soil samples from the greywater towers were later picked on a monthly basis for a period of 3 months and analysed for the same parameters at the Soil Science Laboratory at Makerere University, Kampala, according to analytical techniques in Okalebo (2002). pH was measured using the electrode method in a soil‐water suspension using a 1:2.5 (w/v) ratio, organic matter determination was according to the Walkley and Black Method, Total nitrogen was analysed using the Kjeldahl method, potassium was determined by flame photometry method while measurement of phosphorus was according to the Bray method (Okalebo, 2002). Given the close proximity of the households in the area, the soils used in the greywater towers were loam soils.
Plant measurements
To assess the impact of greywater application on plant growth, measurements at two households with greywater towers and the control were taken. This involved measurements of stems, leaves, number of seeds, number of leaves, and length of internodes.
Results
Greywater reuse
A review of the baseline study report (ROSA, 2007) indicated that there was no greywater reuse in the study area. The generated greywater is either disposed of in open places (68%) and or open channels traversing the area and where possible, in soak pits by 21% of the households (ROSA, 2007). These findings were corroborated by the interview findings in this study with the majority of the respondent households, 61% and 76% disposing of kitchen and laundry wastewater respectively on the ground. Most of the respondent households (71%) discharge their bathroom wastewater into soak pits. Interestingly, a few respondent households (11%) pour their kitchen greywater into the gardens. Interviews with the locals indicated that they were not aware of any greywater disposal best practices but expressed willingness to reuse greywater if taught how. Responses from the study households indicated that they had no objection to having the demonstration units for greywater reuse (greywater towers) set up at their homes.
Amount of greywater produced
The generation of grey water by households is directly related to the consumption of water. Of the 38 households interviewed, the majority (63%) use 3 to 5 jerrycans of water daily for domestic cores including drinking. Given that each jerrycan holds 20 liters, about 60 to 80 liters of water are used daily for washing kitchen utensils, laundry, bathing and drinking by each household. Since no wastewater enters the sewers in Paradwong parish in KTC, the quantity of greywater generated daily per household may be estimated to be 80% of the water consumption (Punimia, 1998). This means that approximately 48 to 64 liters of grey water are being produced on a daily basis by each household in Ktigum town council. As a result of the water scarcity in the region the quantity of greywater produced is low. The greywater quality generated by these households is therefore highly polluted (section 4.3) as small quantities of water are used for a number of domestic purposes before eventual disposal, as observed in informal settlements worldwide (Armitage et al., 2009).

Household greywater use‐ Kitgum
Sustainable Sanitation Practice 20 issue 1 /2009
Physicochemical characteristics of the greywater
The characteristics of the greywater from the different sources (n=35) are presented in Figure 3. The results depict some variation of the measured parameters between source types. The greywater is moderately alkaline with the laundry water having pH values that fall outside the effluent discharge standards (i.e. 6‐8, NEMA 1999) but is in line with the range observed elsewhere (i.e. 8‐10, Eriksson et al., 2002). The high pH values of the laundry water may be due to the alkalinity of the detergents and or soaps that are used (Christova‐Boal et al., 1996). However, given the pH range for other greywater types, the alkalinity of the freshwater used in the area which is primarily groundwater, may also be important (ROSA, 2007). The SAR is higher in laundry water followed by bathroom and kitchen water in that order. The high laundry SAR values may be a result of the type of detergents or soaps used. Long term application of water with a high SAR can be detrimental to the hydraulic conductivity and physical properties of soils and associated plant systems (Wiel‐Shafran et al., 2006). Most commercially available bathroom/laundry products are currently manufactured using various types and quantities of sodium salts. Hence given the SAR values of the greywater validates the need to apply freshwater to the greywater towers as a control measure against soil damage (clogging). The temperature is relatively highest for bathroom waters with the kitchen and laundry waters having almost similar average values. The probable explanation for this discrepancy is that waters for bathing purposes particularly in the mornings are warmed up. All the greywater source types exhibit high turbidity, with mean values greater than the stipulated national effluent discharge standard (i.e. >100 NTU, NEMA 1999). The laundry waters have the highest turbidity most likely due to more soap use compared to that in the kitchen and bathroom. During sample analysis the laundry greywater was blue in colour with a cloudy appearance which was thought to result from more soap use. Turbidity in these wastewaters may also be related to the presence of high content of suspended solid material in the wastewaters (Eriksson et al., 2002). Here, possible high suspended solid material content is found in laundry water followed by bathroom water. The likely explanation may be the dirty laundry and bathing by the children who were the majority in the households visited. The average TDS content of kitchen and bathroom greywater sources are generally within the national effluent discharge standards (i.e. <1000 mg/l, NEMA 1999) which is not the case with the values occurring in laundry water. The total dissolved solids content of the greywater
types follows a similar trend to that of electrical conductivity with laundry exhibiting higher values (Figure 3). All the greywater sources have mean phosphorus levels with in the national effluent discharge standards (i.e. < 5 and 10 mg/l for Ortho and Total‐P, respectively) as indicated in Figure 3. The total phosphorus levels indicate that phosphorus containing detergents are used (i.e. > 3mg/l, WHO, 2006). Despite this, phosphorus when disposed to the greywater tower is not a problem since it is a plant nutrient. However, problems may accrue if the soils become phosphate saturated resulting in leaching to the groundwater and or to run‐off to a surface water source. The ammonia nitrogen levels for the greywater obtained here, are higher than values cited in other studies in the developed countries with the greywater in these cases considered light (Birks and Hills, 2007; Eriksson et al., 2002). The greywater types exhibit high mean BOD5 and COD values well above the national effluent discharge standards (i.e. >30 mg BOD5/l and 100 mg COD/l). The high COD in Kitchen greywater is in line with the high COD values recorded for the developed countries (Travis et al., 2008). Laundry greywater exhibits the highest BOD5 values followed by kitchen greywater.
Bacteriological characteristics of greywater
E.coli were used to characterize the bacteriological quality of the greywater from the 3 sources. There was not much variation in the E.coli results for the different greywater source types with the bathroom greywater having less E.coli counts compared to the other 2 sources (Table 1). The bacteriological counts of the greywater sources is similar to that of raw sewage as observed for greywater discharging from informal settlements (Carden et al., 2007). The high E.coli counts exhibited in the kitchen greywater may be due to the sources of water used which are mainly open streams and waters from River Pager, given the limited availability of boreholes. According to a water quality survey by Oxfam, Environmental Researchers and KTC Health Department and Water Sector in January 2007, sampled streams and rivers had E. Coli counts of ≥ 100 cfu/100ml. It was noted that the counts are most likely higher in the wet season given the poor environmental sanitation in the area. Additionally, the children who frequently wash kitchen utensils have dirty and contaminated fingers.

Household greywater use‐ Kitgum
Sustainable Sanitation Practice 21 issue 1 /2009
Figure 3 Characteristics of greywater from different sources in Kitgum Town Council (bars
represent mean values standard deviation; n ≥ 35)
Table 1 Bacteriological quality (E.Coli) of the greywater source types (n = 8; Log 10 E.coli/100 ml)
Greywater source Average value Range
Kitchen 8.42 <0‐ 9.32
Bathroom 7.50 <0‐ 8.24
Laundry 8.53 <0‐ 9.40
Soil Characteristics
The initial characteristics of the soils at the study households prior to application of greywater are presented in Table 2. The results indicate largely alkaline soils with high phosphorus contents (> 15
mg/kg, Landon, 1991) and low nitrogen, potassium and organic matter. The phosphate decrease in the soils following greywater application may be attributed to plant uptake as indicated by the healthy appearance of these (Figure 4). Despite the high ammonia‐nitrogen levels in the greywater (Figure 3), the nitrogen cont t in the soils following greywater application are hardly affected. This may be attributed to uptake by plants and also to a less degree the relatively high pH values (pH>7) leading to ammonia volatilization and loss to the atmosphere as nitrogen (Zimmo et al., 2003).
enb

Household greywater use‐ Kitgum
Sustainable Sanitation Practice 22 issue 1 /2009
Plant growth Observations and Measurements
The observations of the planted vegetables are shown in Figure 4. The observations revealed healthy growth of the planted vegetables. Plant measurement results carried out at 2 households (A & B) and control greywater towers are presented in Table 3. The results show that the tomato and onion plants receiving greywater at household B generally performed well compared to those that received the groundwater (control). The relatively lower performance by the plants in the greywater towers at household A may have been a result of the poor operation. Also it suffices to point out that during growth, the vegetables in most of the greywater towers were attacked by pests, leading to stunted growth and or death.
Community perceptions and challenges to greywater reuse using greywater towers
Informal interviews held with the locals in
Paradwong village in Kitgum Town Council reveal that they currently have knowledge of the greywater tower and would want to have one at their homes. A walk through the area, revealed fifteen additional households that set up greywater towers after seeing the benefits associated with the study units. Additionally, more households have set up small gardens of vegetables on their land and are applying greywater directly to the plants. Where vegetables have been harvested from the greywater towers, the households have converted the area into small gardens irrigated with greywater (Figure 5). The use of the greywater towers had some challenges as observed and reported by the residents. Little greywater is produced particularly
from laundry since 1) many of the households do not wash their clothes on a daily basis and 2) the general water scarcity in Kitgum. The shade cloth
used was attacked by roaming animals in the area and tore within two months. Here, some protection fences had to be installed around the
greywater towers. The planted vegetables were attacked by pests and diseases implying the need for pest control.
Figure. 5 Area around greywater towers used as a small garden and planted with pumpkins.
Table 2 Soil chemical characteristics at the study households prior
to and after application of greywater (Average valuesSD; initial: n = 7; after application: n=14)
Initial After application
Conclusions ‐ Greywater is poorly managed in Kitgum Town Council with the largest population of the community (68%) pouring the greywater onto the ground while 21% dispose their greywater into drain channels and soak pits. Very few (11%) pour this wastewater into the garden.
Parameter
pH 9.060.85 8.790.66 Nitrogen (%) 0.0860.021 0.0850.015 Phosphorus (mg/kg) 21.897.80 19.7920.82 Potassium (meq/100g dry soil) 2.520.90 2.220.83 Organic matter (%) 1.610.53 1.550.42
a b
Figure 4 (a) Growth of tomatoes (on top) and onions (in the sides (b) flowering of tomatoe plants
Table 3 Plant measurements Control A B
Tomatoes
Length of 1st Stem (cm) 3 3 3.4
Length of 1st leaf (cm) 43.3 27.2 37.5
Length of leaflet (cm) 10.4 8 11.7
No of flowers 16 7 18
No of seeds 1 5 5
Length of inter‐node (cm) 14.5 17.2 18
No of branches 4 4 7
Onions
No of leaves 9 10 8
Length of leaf (cm) 8.7 15 19

Household greywater use‐ Kitgum
Sustainable Sanitation Practice 23 issue 1 /2009
‐ The main sources of greywater in the area are laundry, bath areas and kitchen.
‐ Laundry water except for temperature generally had the highest mean values of the parameters assessed followed by kitchen and bathroom greywater.
‐ The effect of greywater application on the soil characteristics was not significant with respect to potassium, organic matter and nitrogen content. However there was a slight decrease in phosphorus content.
‐ Tomato and onion plants grown in the greywater towers thrived with the greywater. However, they were attacked by pests.
Recommendations ‐ Given the greywater characteristics presented in this study, greywater should be properly managed to prevent contamination of the environment and disease prevalence.
‐ Given the positive response to the application of greywater in gardens in Kitgum Town Council, there is need to increase sensitization of the community people on greywater reuse and associated benefits to scale up this reuse option.
‐ There is need for research to ascertain the bacteriological quality of the leafy crops to assure safety.
‐ The hydraulic load of a greywater tower should be ascertained so as to guide the number of gardens needed for a particular quantity of the generated greywater for optimum performance.
Acknowledgements The work is carried out within the project ROSA (Resource‐Oriented Sanitation concepts for peri‐urban areas in Africa; Contract No. 037025‐GOCE; duration: 1.10.2006 – 31.3.2010), a Specific Target REsearch Project (STREP) funded within the EU 6th Framework Programme, Sub‐priority "Global Change and Ecosystems". The authors are grateful for the support.
References Alit, W., Zeev, R., Noam, W., Eilon, A., Amit, G. (2006). Potential
changes in soil properties following irrigation with surfactant‐rich greywater. Ecological Engineering 26, 348‐354.
Al‐Jayyousi, O.R. (2003). Greywater reuse: towards sustainable management. Desalination 156, 181‐192.
Armitage, N.P., Winter, K., Spiegel, A., Kruger, E. (2009). Community‐focused greywater management in two informal settlements in South Africa. Water Science and Technology 59(12): 2341‐2350.
APHA/AWWA/WEF (1998): Standard methods for the examination of water and wastewater. 20th edition, American Public Health Association, American Water Works Association, Water Environment Federation Publication, Washington, D.C., USA.
Birks, R., Hills, S. (2007). Characterisation of indicator organisms and pathogens in Domestic greywater for recycling. Environmental Monitoring Assessment 129, 61‐69.
Carden, K., Armitage, N., Winter, K., Sichone, O., Rivett, U., Kahonde, J. (2007). The use and disposal of greywater in the non‐sewered areas of South Africa: paper 1‐Quantifying the greywater generated and assessing its quality. Water SA 33(4), 425‐432.
Christova‐Boal, D., Eden, R.E., McFarlane, S. (1996). An investigation into greywater reuse for urban residential properties. Desalination 106, 391‐397.
Crosby, C. (2005): Food from Used Water: Making the Previously Impossible Happen. URL: http://www.dwaf.gov.za/Events/WaterWeek/2005/Documents/WaterWheelJan05d.pdf [Accessed on 31.03.2007].
Eriksson, E., Auffarth, K., Henze, M., Ledin, A. (2002). Characteristics of grey wastewater. Urban Water 4, 85‐104.
Imhof, B. and Muhlemann J. (2005). Greywater treatment on household level in developing countries‐A state of the art review. Department of Environmental Sciences at the Swiss Federal Institute of Technology (ETH), Zürich, Switzerland.
Landon, J.R. (ed.) (1991). A Handbook for soil survey and agricultural land evaluation in the tropics and subtropics. Longman Scientific and Technical Group Ltd, Hong Kong, PR China.
Langergraber, G., Meinzinger, F., Lechner, M., de Brujne, G., Sugden, S., Niwagaba, C.B., Mashauri, D., Mutua, B.M., Teklemariam, A., Achiro, I., Kiarie, S.C., Laizer, J.T., Ayele, W. (2008): The ROSA project – A new approach to sustainable sanitation in Eastern African cities. Proceedings of the 6th IWA World Water Congress, 8‐12 September 2008, Vienna, Austria. (CD‐ROM, paper 664279)
Morel A. and Diener, S. (2006). Greywater Management in Low and Middle‐Income Countries,Review of different treatment systems for households or neighbourhoods. Sandec (Swiss Federal Institute of Aquatic Science and Technology (EAWAG), Dübendorf, Switzerland.
NEMA, (1999). Environmental standards and preliminary environment impact assessment for water quality and discharge of effluent into water/land in Uganda. National Environment Management Authority, Kampala, Uganda.
Okalebo, R. (2002). Laboratory methods of soil and plant analysis. A working manual, 2nd Edition, Nairobi, Kenya.
Punimia, A. (1998). Wastewater Engineering (Including Air Pollution). Environmental Engineering‐2. Laxmi Publications (P) Ltd., New Delhi, India.
ROSA (2007).Baseline study of Kitgum Town Council. Makerere University ROSA Staff, Kampala, Uganda.
Travis, M.J., Weisbrod, N., Gross, A. (2008). Accumulation of oil and grease in soils irrigated with greywater and their potential role in soil water repellency. Science of the Total Environment 394, 68‐74.

Household greywater use‐ Kitgum
Wiel‐Shafran, A., Ronen, Z., Weisbrod, N., Adar, E., Gross, A. (2006). Potential changes in soil properties following irrigation with surfactant‐rich greywater. Ecological Engineering 26, 348‐354.
WHO (2006). WHO guidelines for the safe use of wastewater, excreta and greywater, Volume IV Exctreta and greywater use in agriculture. World Health Organisation, Geneva, Switzerland.
Zimmo, O.R., van der Steen, N.P., Gijzen, H.J. (2003) Comparison of ammonia volatilisation rates in algae and duckweed‐based waste stabilisation ponds treating domestic wastewater. Water Research 37(19), 4587–4594.
.
Sustainable Sanitation Practice 24 issue 1 /2009
Name: R. Kulabako, J. Kinobe, J. Mujunga S. Olwenyi Organisation: Department of Civil Engineering, Makerere University
Town, Country: Kampala, Uganda [email protected], e‐mail: [email protected], [email protected], [email protected]
Name: K. SleytrOrganisation: University of Natural Resources and Applied Life Sciences, Vienna; Institute for Sanitary Engineering and Water Pollution Control
Town, Country: Vienna, Austria e‐mail: [email protected]

Household greywater use‐ Kitgum
Sustainable Sanitation Practice 25 issue 1 /2009
overall project:
NASPA
Greywater treatment in apartment building in Austria
Pilot system built in water rich Austria to reduce potable water consumption
Authors: Regelsberger, Regelsberger, Platzer
Abstract with summary of technical data In an apartment house with 9 apartments and a total of 14 inhabitants a separate greywater collection system, treatment and distribution plumbing was implemented as part of a comprehensive water scheme also comprising water saving, rainwater harvesting, on‐site treatment of water and reuse for toilet flushing, landscape irrigation and groundwater recharge. The greywater is treated in a Pontos SBR, which includes UV disinfection and a storage tank. The treated water has a good quality for its intended purpose of toilet flushing. Compared with nationwide average supply and treatment volumes per day the scheme allows to save approximately 65 litres of potable water and around 40 litres of wastewater per capita and day.
DescriptionA dilapidated complex of farm buildings, comprising the farm house, the stable, a barn and other annexes was to be refurbished and transformed into apartments. The farm lies in Pöllau in Styria in the South‐East of Austria, a hilly region with a mild climate and a relatively even rainfall distribution with an average rainfall of 800 mm per year, average monthly rainfall varying between 31 mm in January and 126 mm in July (at Graz). The concept used for the refurbishment of the apartment house (Pöllau 18, Figure 1) aims at overall sustainability. This concept comprises construction materials and construction physics aspects, energy for heating and water. The concept extends to the surroundings of the house with the plan to convert a vineyard to biological farming. Three buildings comprise 9 apartments, with 14 inhabitants at the end of the monitoring period, a
function room for events, a common wine cellar and office space. As far as possible materials from the previously existing buildings, especially bricks, were reused. The old structures were rebuilt with adapted techniques, including the vaulted ceiling of the function room. Thorough insulation and special windows adapted to the traditional architecture but with triple glazing ensure low energy demand and high quality of living conditions. The energy supply relies on 100 % renewable sources with a 42 kW (60 m²) solar collector and a 50 kW wood chip boiler for space and water heating. Local farmers provide the wood chips. Energy contained in greywater is also recycled into the space heating system. A 17 m² photovoltaic system is generating part of the electric power needed. As far as possible the energy supply is CO2 neutral. Heat is distributed to the building complex
Figure 1: The building

Greywater treatment in apartment building‐ Austria
Sustainable Sanitation Practice 26 issue 1 /2009
1 for effluent water temperatures above 12°C
from the central heating room via a 2‐conduit network and decentralised heat transfer stations in the apartments and other heat consumers. Despite the relative water richness auf the region and Austria in general the owner also wanted a sustainable water concept for the complex, partly to match the sustainable energy concept, but also to reduce dependency on centralised supply infrastructure and operation cost to a possible minimum. Water is supplied from three sources, the village water mains, rainwater from the roofs and recycled greywater from the bathrooms. The wastewater treatment comprises a septic tank followed by a constructed wetland, which treats the wastewater on site for infiltration into the ground or, at a later stage, possibly irrigation. Thus an example of a comprehensively ecological housing estate was created, combining local traditions and modern solutions and making use of a range of available techniques in contrast to usually one single solution relying on centralised systems only.
Water system The potable water supply comes from the communal water mains. Due to the high location of the house the water is distributed with a booster pump. Potable water supply is supplemented by a rainwater harvesting system collecting water from 580 m² of roof surface with a total storage volume of 42 m³. The rainwater is used for laundry, a fire fighting reserve, landscaping and irrigation of a wine yard. For laundry two common highly efficient washing machines are provided, where the water is externally heated from the central heating system through a heat transfer station for each washing machine. The fire fighting reserve was necessary as the apartment buildings are located at the end of a branch of the water mains, which is not able to supply a sufficient flow for fire fighting. The overflow of the tanks fills a pond where it is infiltrated into the ground. Additionally greywater from the bathrooms is collected separately and treated for reuse in a PONTOS Aquacycle 1500, a sequencing batch reactor (SBR) with a capacity of 1000 l/d. It comprises a two step biological treatment with bacteria growing on a fixed bed of foam cubes, a UV‐lamp for disinfection of the treated greywater before storage, and a buffer tank with a volume of 600 litre. The treated greywater is used for toilet flushing. In case of greywater shortage the toilet flushing needs are first covered from the available rainwater before eventually switching to potable
water if the rainwater is exhausted. Switching from one water source to another is done automatically. The energy contained in the greywater is recycled into the heating system via a cross flow stainless steel greywater heat exchanger with a total surface of 2,60 m² and a capacity of 28 l/min (ThermoCycle WGR 355, Forstner Speichertechnik GmbH), which is approximately equivalent to 4 showers. The heat exchanger is interposed in the main greywater collector.
Figure 2: PONTOS Aquacycle 1500, SBR greywater treatment The blackwater and excess greywater are treated in a train comprising a 3‐chamber septic tank of 7,5 m³, a vertical subsurface flow constructed wetland and a surface infiltration area. The constructed wetland has a length of 26,6, a width of 4,7 and a depth of 1,1 m. It is fed in batches from a feeding chamber located downstream of the septic tank and comprising a special “pipe valve” acting as a float and intermittent outlet device. No pumps or electronic devices are needed, which leads to a robust system and simple operation and maintenance. The treatment is designed for 25 population equivalents. This is the planned final population of the complex but was not reached during the monitoring period. The outlet of the plant has to comply with Austrian regulations for small plants (Table 1). It is planned to use the treated wastewater for fertigation of agricultural crops. Table 1: Austrian effluent standards for small wastewater treatment plants (less than 50 people equivalent, 1.AEVkA, 1996).
Parameter Limit
BSB5 (mg O2/l) 25
CSB (mg O2/l) 90
TOC (mg /l) 30
NH4‐N (mg/l) 1 10

Greywater treatment in apartment building‐ Austria
Sustainable Sanitation Practice 27 issue 1 /2009
31 l23%
30 l22%
55 l41%
19 l14%
Kitchen, other
Bath
Toilet flushing
Laundry, outdoors
Austria so far has no specific regulations concerning the implementation of greywater systems or quality criteria for greywater. There are however guidelines of professional bodies, which give some indications concerning the implementation, e.g. supply pipes and taps have to be clearly marked as supplying non‐potable water. As for greywater quality, depending on the intended use, guidelines for specific types of water uses, e.g. for irrigation water, for bathing water, can serve as a rule for a minimum quality of the treated wastewater. Guidelines for the use of excreta and greywater in agriculture exist from the WHO (2006) but are not yet applied in Austria. Directive 2006/7/EC from the European Union “concerning the management of bathing water quality” is often referred to for the quality requirements of greywater used for domestic purposes. The “bathing water directive” provides quality criteria for prolonged full‐body water contact. In the present case the treated greywater is used for toilet flushing. It must not be assumed that toilet flushing leads to prolonged full‐body water contact. It hardly leads to any water contact. Thus the requirements of Directive 2006/7/EC may not apply. Instead of protection of users from chemical or microbial hazards, the most important issues to take into consideration are technical durability of the greywater supply system, i.e. no unacceptable deposits in pipes, and sensorial aspects of the water and the toilet, e.g. turbidity, odour, colour of the water and possible deposits in the toilet bowl. After completion of the first stage refurbishment of the buildings a monitoring of the water scheme was started. This comprised flow measurements to allow a water balance and water quality measurements of the various water flows including raw and treated greywater. The monitoring was partly constrained by the progressive moving in of inhabitants, the number reaching 14 only towards the end of the monitoring period. An extension of the monitoring is planned.
Cost The following system costs are real costs of the implementation. The greywater treatment and the related plumbing added up to just below 11.000 Euro. The wastewater collection and treatment under the present configuration was built for 20.500 Euro (Table 2). The costs of the rainwater harvesting are equivalent to those of the greywater system, even though there is no treatment included. However the reservoirs comprise the fire fighting volume. A detailed assessment of the cost for mains with a sufficient capacity for fire fighting was not made
but the remoteness of the building suggests the cost would have been comparable. The rainwater harvesting system, which is comprising an infiltration pond, is also part of the drainage scheme, thus serving a third purpose besides providing extra water and storing the fire fighting reserve. The costs for the standard plumbing are not available unfortunately. Therefore no comparison of the costs for overall plumbing to the additional greywater collection and distribution system can be made. Table 2: Investment cost of various components of the water system (excluding VAT)
In the present case the constructed wetland for the treatment of black water was built applying the standard Austrian dimensioning rule of 5 m² per person, without taking into consideration the reduced hydraulic and carbon load due to the greywater scheme. If the reduced hydraulic load were taken as the key dimensioning parameter the constructed wetland could have been built with 3 m² per person and would have cost an estimated 14.400 Euro.
Results One target of the monitoring was to determine whether and to which extend water saving measures and greywater systems would contribute to water saving. A normal person in Austria uses 135 litres of potable water per day. About 120 litres of these become wastewater.
Cost Information Cost basis 2005
Rainwater harvesting system (tank, plumbing, pump) € 13.000
Greywater heat exchanger Prototype
Greywater recycling system (SBR, plumbing) € 10.900
Constructed wetland for black water treatment € 20.500
Figure 3: Average Austrian domestic water consumption per capita and day, for different consumption categories, total is 135 l/(c.d) (BMLFUW, 2009)

Greywater treatment in apartment building‐ Austria
Sustainable Sanitation Practice 28 issue 1 /2009
An inhabitant at Pöllau 18 uses 107 litres of water per day. However 24 l of these are greywater and 13 are rainwater, so that only 70 l are potable water from the mains. That is almost down to half from the average figure or a yearly saving of about 24.000 litres for every person. The respective consumptions in the category bathroom are 55 and 34 l/(c.d). This reduction by almost 40 % is probably due both to water saver fittings and a water conscious behaviour of the inhabitants. While the reduction also has an impact on the available volume of greywater, in the present case this has no consequences, as the volume of service water needed is less than the greywater collected. Additionally the next available water source is rainwater, where there is no shortage under the given circumstances. If this were not the case, e.g. due to further service water uses, it would have been possible to add the laundry runoff to the greywater. ( Figure 4) Somehow astonishing is the comparative consumption in the “kitchen and other” category. This category is formed because at Pöllau 18 its water consumption is computed from the total potable demand minus the greywater produced in the bathroom. This amount of water should cover the demand at the kitchen and cleaning plus any other use of water from the mains, which should be rather limited. Yet the consumption is 36 litres per capita and day compared to 19 litres for Austrian average. The reason for this discrepancy cannot be explained with the available
data and will have to be investigated in a further monitoring phase. The amount of wastewater leaving the building is also down to 76 litres per capita and day, from the average 120, which corresponds to a 37 % reduction. (Figure 5) Quality data for the raw greywater are given in Table 3. With a COD of just above 70 the raw greywater is rather less polluted than literature states for greywater from shower and bath (Eriksson et al., 2002). The COD/BOD5 ratio of around 1.25 suggests the greywater is easily biodegradable. This is confirmed by the good
Average Median Standard deviation Max Min
COD (mg O2/l) 72.4 75.0 34.4 118.0 10.4
BOD5 (mg O2/l) 58.3 53.5 32.5 105.0 17.0
NH4‐N (mg/l) 2.4 1.3 2.8 6.9 <0.5
Ntot (mg/l) 10.6 5.3 15.7 49.0 1.1
Ptot (mg/l) 0.7 0.6 0.3 1.2 <0.5
E. coli (CFU/100 ml) 6.3E+06 0.33E+06 12E+06 35E+06 n.d.
Average Median Standard deviation Max Min
COD (mg O2/l) 13.2 12.4 8.3 40.9 9.2
BOD5 (mg O2/l) 2.7 1.9 3.0 12.0 1.1
NH4‐N (mg/l) <0.5 <0.5 1.1 <0.5
Ntot (mg/l) 3.2 2.8 1.2 5.8 1.7
Ptot (mg/l) 0.4 0.4 0.2 0.7 0.2
E. coli (CFU/100 ml) 145 n.d .1 308 1000 n.d.
36 l34%
34 l32%
24 l22%
13 l12%
Kitchen, other
Bath
Toilet flushing
Laundry, outdoors
Figure 4: Water flows at Pöllau 18.
Figure 5: Water consumption at the apartment house Pöllau 18 per capita and day, for the same categories as in Figure 3, total is 107 l/(c.d)
Table 3: Raw greywater quality (Sample size =8;n.d. = not detectable)
Table 4: Service water quality (Sample size =11; n.d. = not detectable, 1in 8 samples)

Greywater treatment in apartment building‐ Austria
elimination of carbon as shown in Table4. The nutrient content is particularly low in this greywater. This may not always be the case, e.g. if there are babies or if the households use any detergent with some phosphorus.
Acknowledgements This work has been funded by the Austrian Federal Ministry of Agriculture, Forestry, Environment and Water Management (BMLFUW) within the project “Sustainable Sanitation – Practical Application (NASPA)”; Duration: February 2007 ‐ July 2009. The already low concentration of nitrogen is
further reduced from 10 to 3 mg/l in average. Almost all ammonium is denitrified or at least oxidised. The treated service water looks clean, colourless and has no particular odour.
References: AEVkA (1996): 1. Abwasseremissionsverordnung für
kommunales Abwasser (Austrian regulation for emissions from domestic wastewater). BGBl.210/1996, Vienna, Austria [in German].
This SBR greywater treatment leads to water, which is well suited for purposes but direct consumption, e.g. toilet flushing, in the household. The water and wastewater savings are substantial and could help reduce the pressure on water resources especially in water scarce regions. In future implementations of such systems the cost of the greywater scheme could be partly offset by the corresponding savings made on the wastewater treatment. Any savings go automatically to the developer in the case of decentralised wastewater schemes implemented by the developer himself. In other cases this may not be achievable. If water saving measures or greywater systems are implemented upstream of centralised sewerage and wastewater treatment schemes appropriate tariffs or subsidies will be needed to transfer at least part of the overall economic advantage to the developer.
BMLFUW (2008): Wasser in Österreich / Basisinfos / Trinkwasser und Wasserversorgung http://wasser.lebensministerium.at/article/articleview/60323/1/14151/ (date of visit 25 June 2009) [in German]
Eriksson, E., Auffarth, K., Henze, M., Ledin, A. (2002): Characteristics of grey wastewater. Urban Water 4, 85–104
EC (2006): DIRECTIVE 2006/7/EC of the European Parliament and of the COUNCIL of 15 February 2006 Concerning the Management of Bathing Water Quality and Repealing Directive 76/160/EEC, Official Journal of the European Union L64 / 37 ‐ 51, 4.3.2006
WHO (2006): WHO Guidelines for the Safe Use of Wastewater, Excreta and Greywater in Agriculture and Aquaculture. 2
nd
edition. World Health Organisation, Geneva, Switzerland.
The investment costs are higher for the more complex scheme, than if a water mains connexion and a constructed wetland for wastewater treatment were implemented. However, in future such systems a more detailed knowledge of the wastewater produced will allow to reduce the size of the wastewater treatment and thus reduce the cost accordingly, thus reducing the gap between the two schemes while still maintaining the level of sustainability and autonomy. Further investigations have to be made concerning the possible size reduction of constructed wetlands, or any wastewater treatment for that matter, in case of a greywater scheme treating part of the wastewater flow. For this purpose more data are needed concerning the hydraulic and organic load reduction at the inlet to the wastewater treatment due to the greywater scheme. This should lead to the critical parameter for the dimensioning of the wastewater treatment.
e‐ mail: [email protected] Town, Country: Gleisdorf, Austria
Organisation: Institute for sustainable technologies (AEE INTEC)
Christian Platzer Barbara Regelsberger, Name: Martin Regelsberger, While domestic water demand has a very high
priority, the potential of on‐site recycling to guarantee a sufficient water supply should not be neglected. The saved water remains available for other purposes in potable water quality.
Sustainable Sanitation Practice 29 issue 1 /2009

Greywater treatment in apartment building‐ Austria
Sustainable Sanitation Practice 30 issue 1 /2009
Combined greywater treatment using a membrane bioreactor
Author: Sellner
Abstract The daily fresh water consumption can easily be reduced by using greywater from showers, bath tubes and wash basins, when substituting drinking water e.g. for toilet flushing, garden irrigation, cleaning purposes or industrial cooling‐ processes. The ecological and economic advantages of the GEP‐ Watermanager open up new possibilities of an intelligent water management. It combines a greywater‐ recycling‐ plant with rainwater management, drinking water management, a booster station and a remote control module. Based on a modular construction concept the GEP‐ Watermanager is operated as a membrane bioreactor with submerged ultra filtration membranes for precious process water. The attained output values after the recycling process are substantially below the strict limits set by the EU bathing water regulation. The little footprint and optimised energy consumption of the GEP‐ Watermanager accompanied by high filtration performance offers new interesting alternatives for in‐ building solutions for a decentralized water management.
The GEP‐ Watermanager Since 1992 the German company GEP Umweltechnik GmbH develops and distributes solutions for an optimised water management. The first satisfying success in developing a secure in house greywater plant, based on a membrane bioreactor, took place in 2002. This was the hour of birth of the GEP‐ Watermanager WME 4 – recycling with BioMembranTechnologie® (BMT®). In the meantime the process of improvement and development moved strongly forward and today
GEP is able to offer fully automated, remote monitored and high efficient greywater plants for in‐ and outdoor installations. The GEP‐Watermanager is designed as a modular construction and allows building contractors and engineers a wide scope of design possibilities. The classical layouts of greywater plants by GEP are shown in Table1 in association with their main specific parameters.
Table1: GEP‐ Watermanager ‐ main specific parameters

Combined greywater treatment using a membrane bioreactor
Sustainable Sanitation Practice 31 issue 1 /2009
Figure 1: Principel flow chart of the GEP‐ Watermanager
Greywater
Overflow
Tap Aeration
Backflush
Membrane filter
pre‐treated greywater
Permeat/Effluent
potable water
RainwaterTap
Overflow
Process water
The principle flow chart of GEP‐ Watermanager is shown in Figure1. First of all the separately collected greywater from showers, bathtubs and wash basins pass through a screen with a mesh size of 0.35 mm. The solids will be removed and automatically flushed into the sewer (Figure2). The pre‐treated greywater flows into the first greywater tank, where bacteria with the help of artificially supplied oxygen begin to degrade the organic substances contained in the greywater. After a short interval of sedimentation and flotation the biological treatment continues in the BMT®‐ Bioreactor with the biological aerobic
degradation. The BMT®‐ control panel monitors and calculates permanently the optimal hydraulic retention time for high biological removal performance to achieve a long storable and odourless process water. Due to the low organic loading rates in greywater (≤ 0,1 kg COD/kg/d) (Paris and Schlapp, 2009) and the high solid retention time in the BMT
®‐ Bioreactor the growing rate of biomass is limited too (MLSS≈ 1‐5 mg/l) (Sellner, 2009). As a consequence the growing rate of biomass is low and the period of removing sludge in the tanks is once in a year or even longer. After the biological treatment the heart of the GEP‐ Watemanager, the submerged ultra‐ filtration starts its work in the BMT®‐Bioreactor. The European patented MicroClear®‐filter represents a true physical barrier which blocks all germs and suspended matters (Figure 3). The minute pores of only 50 nm exceed the requirements of the EU bathing water guideline 2006/7/EG (2006) and even the DIN 19650 (1999) class 2 requirements for irrigation water. The optimised aeration (with continuously‐rising, fine air bubbles spaced at intervals) ensures a permanent self‐ cleaning effect on the filter plates that reduces the need of chemical cleaning to an absolute minimum. In combination with a low negative pressure (0.1 bar) during the filtration process (Figure 4) and a relaxing period (aeration without filtration) the membranes lifetime achieve terms of 8 to 24 months. If the filter should be dirty, it is simply replaced by a filter that has been
Figure 2: The GEP‐ TridentMAX, a screen with an mesh size of 0.35 mm separating the raw greywater from the solid ingredients

Combined greywater treatment using a membrane bioreactor
Sustainable Sanitation Practice 32 issue 1 /2009
Figure 3: Particle size and filtration spectrum for MicroClear® filters
thoroughly cleaned. This permits to have a lifetime of up to 10 years per filter. The result of this unique and safe process is a nutrient‐poor, odourless, purified process water for further applications. In Table 2 the results of a nine week measurement in a student dormitory are shown. In addition to that the process water qualities guaranteed by GEP, according to the information sheet (FBR‐Hinweisblatt H201, 2005), will be mentioned there as well.
The process water will be stored in a process water tank until its delivery by a booster‐ system to its consumers. In case of a lack of process water the requested amount of water will be automatically substituted by drinking water according to DIN EN 1717 (2001). The control of the GEP‐ Watermanger provides user friendly completely automated and remotely operated maintenance of a high technology greywater treatment plant. It is possible to observe, to evaluate and to control the GEP‐ Watermanager entirely from the office or control centre. Hence the best moment to change the filter can be detected which economizes real maintenance and operation costs. The GEP‐Watermanager is quite more than an ordinary greywater treatment plant. At the same time it can be operated without any problems with drinking water, greywater, process water and rainwater. In the opinion of GEP the bonding of greywater‐ recycling and rainwater harvesting is currently the most sustainable manner of decentralized water management.
Figure 4: Operation method of filtration with the MicroClear®
For this reason the GEP‐ Watermanager is composed of systems by greywater management, rainwater management, drinking water management, booster station and remote control module. The convincing modular concept and the flexibility in tank versions allow building contractors and engineers the greatest scope for designing their own individual GEP‐ Watermanager according to the current circumstances.
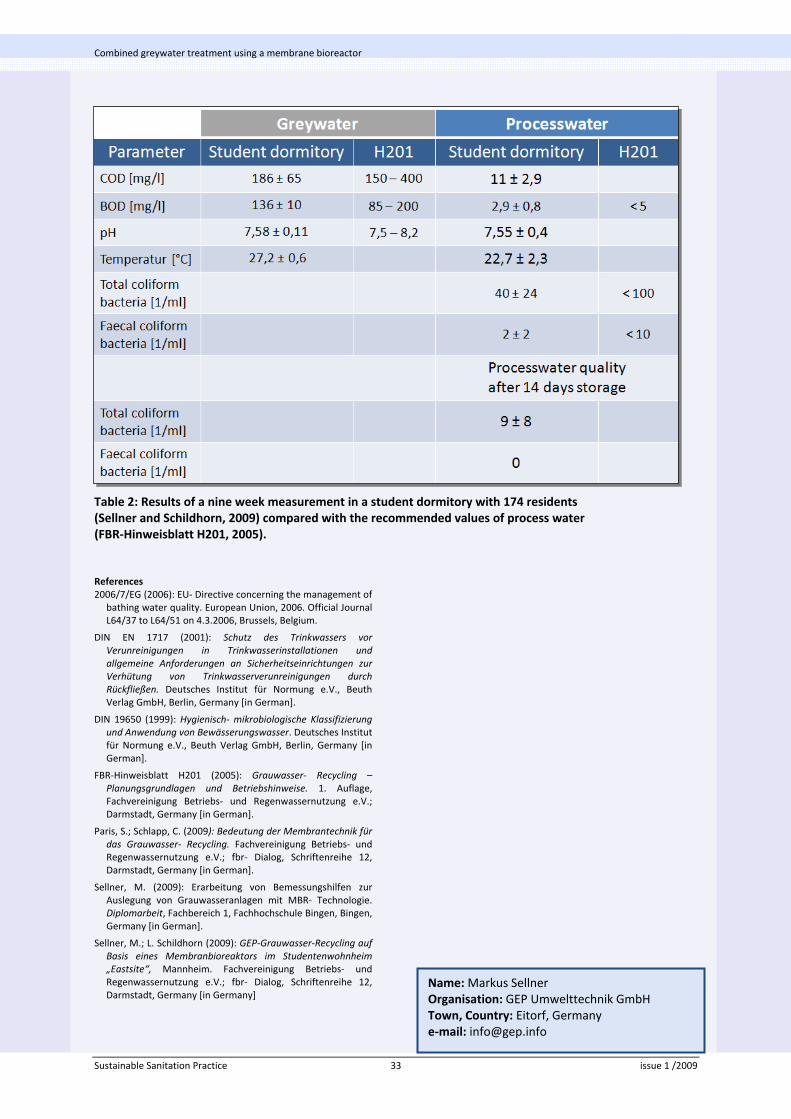
Combined greywater treatment using a membrane bioreactor
Table 2: Results of a nine week measurement in a student dormitory with 174 residents (Sellner and Schildhorn, 2009) compared with the recommended values of process water (FBR‐Hinweisblatt H201, 2005).
References 2006/7/EG (2006): EU‐ Directive concerning the management of
bathing water quality. European Union, 2006. Official Journal L64/37 to L64/51 on 4.3.2006, Brussels, Belgium.
DIN EN 1717 (2001): Schutz des Trinkwassers vor Verunreinigungen in Trinkwasserinstallationen und allgemeine Anforderungen an Sicherheitseinrichtungen zur Verhütung von Trinkwasserverunreinigungen durch Rückfließen. Deutsches Institut für Normung e.V., Beuth Verlag GmbH, Berlin, Germany [in German].
DIN 19650 (1999): Hygienisch‐ mikrobiologische Klassifizierung und Anwendung von Bewässerungswasser. Deutsches Institut für Normung e.V., Beuth Verlag GmbH, Berlin, Germany [in German].
FBR‐Hinweisblatt H201 (2005): Grauwasser‐ Recycling – Planungsgrundlagen und Betriebshinweise. 1. Auflage, Fachvereinigung Betriebs‐ und Regenwassernutzung e.V.; Darmstadt, Germany [in German].
Paris, S.; Schlapp, C. (2009): Bedeutung der Membrantechnik für das Grauwasser‐ Recycling. Fachvereinigung Betriebs‐ und Regenwassernutzung e.V.; fbr‐ Dialog, Schriftenreihe 12, Darmstadt, Germany [in German].
Sellner, M. (2009): Erarbeitung von Bemessungshilfen zur Auslegung von Grauwasseranlagen mit MBR‐ Technologie. Diplomarbeit, Fachbereich 1, Fachhochschule Bingen, Bingen, Germany [in German].
Sellner, M.; L. Schildhorn (2009): GEP‐Grauwasser‐Recycling auf Basis eines Membranbioreaktors im Studentenwohnheim „Eastsite“, Mannheim. Fachvereinigung Betriebs‐ und Regenwassernutzung e.V.; fbr‐ Dialog, Schriftenreihe 12, Darmstadt, Germany [in Germany]
Name:Markus SellnerOrganisation: GEP Umwelttechnik GmbH
Town, Country: Eitorf, Germany e‐mail: [email protected]
Sustainable Sanitation Practice 33 issue 1 /2009

Sustainable Sanitation Practice 34 issue 1 /2009