small-scale systems for greywater reuse and...
TRANSCRIPT
Small-scale Systems for Greywater Reuse and Disposal
A Case Study in Ouagadougou
Orianna Courtney Eklund
Linda Tegelberg
Arbetsgruppen för Tropisk Ekologi Minor Field Study 151 Committee of Tropical Ecology ISSN 1653-5634 Uppsala University, Sweden
June 2010 Uppsala
Small-scale Systems for Greywater Reuse and Disposal
A Case Study in Ouagadougou
Orianna Courtney Eklund Linda Tegelberg
Master thesis in Aquatic and Environmental Engineering Department of Earth Sciences, Air, Water and Landscape Sciences, Uppsala University Supervisors: Sahar Dalahmeh, Håkan Jönsson, Dr. Amah Klutze and Linus Dagerskog

i
ABSTRACT Small-scale Systems for Greywater Reuse and Disposal A Case Study in Ouagadougou
Orianna Courtney Eklund and Linda Tegelberg
Greywater, e.g. wastewater from kitchen, bathroom and shower sources, discarded untreated on the street is a common problem in urban and peri-urban environments in low-income countries; it damages infrastructure and becomes a health risk due to mosquito breeding and pathogen growth. In water scarce areas, ecological sanitation greywater disposal systems that reuse the greywater to grow plants have been popular as they offer safer disposal methods and can lead to reduced water stress and increased food security. This work aimed at evaluating two such systems – vertical gardens and mulch beds – that were implemented as an alternative to current greywater disposal practices in low-income households in Ouagadougou, Burkina Faso. Literature on greywater reuse and disposal systems and risks connected with greywater irrigation were studied as well as relevant site-specific parameters. Experiments were carried out on two new vertical gardens in addition to soil analyses, interviews and observations in households where vertical gardens and mulch beds had been in use for several months The major problem with the tested systems was the buildup of a water column in the vertical garden and of standing water in the mulch bed due to overloading and poor dimensioning, which results in anaerobic conditions, a large sludge production and clogging of systems. Other problems in the vertical gardens included direct contact between potentially contaminated greywater and plants and poor water reuse potential. In both cases, it was not advised that the implemented systems continue to be recommended. Suggested improvements for a vertical garden included separated application inlet for greywater and a different design to reduce clogging and increase the water reuse. An improved, larger mulch bed was also suggested. An alternate system, combining primary filtration and horizontal gardening was suggested, but needs further evaluation. Considering the conditions in Ouagadougou and the experienced problems with the implemented systems, it was recommended that leach pits might be the most viable option for greywater disposal until a better functioning and properly dimensioned greywater reuse and disposal system can be found. Keywords: Greywater, greywater reuse, irrigation, vertical garden, mulch bed, ecological sanitation, Burkina Faso, Ouagadougou Department of Energy and Technology, Swedish University of Agricultural sciences, Box 7070, SE - 750 07 Uppsala, Sweden. ISSN 1401-5765.

ii
REFERAT Småskaliga system för återanvändning och hantering av gråvatten En fallstudie i Ouagadougou
Orianna Courtney Eklund och Linda Tegelberg
Ett vanligt problem i städer i dagens utvecklingsländer är att obehandlat gråvatten – avloppsvatten från bad, disk och tvätt – kastas rakt ut på gatan. Vattensamlingarna förstör infrastrukturen och utgör en hälsorisk eftersom de erbjuder en perfekt miljö för myggor och patogener att föröka sig i. I områden med vattenbrist kan system för återanvändning av gråvatten till bevattning av växter erbjuda en säkrare hantering av gråvattnet och samtidigt bidra till minskad vattenbrist och tryggad livsmedelsförsörjning. Syftet med studien var att utvärdera två sådana system – vertikala odlingar och rotzonsfilter med komposttäckning– som testats i Ouagadougou, Burkina Faso. System för återanvändning och hantering av gråvatten samt risker förknippade med bevattning med gråvatten studerades i litteratur tillsammans med platsspecifika parametrar. Experiment utfördes på två nybyggda vertikala odlingar utöver jordanalyser, intervjuer och observationer i hushåll som använt vertikala odlingar och rotzonsfilter i flera månader. Det största problemet med de testade systemen var att de inte var dimensionerade för stora vattenbelastningar. Det resulterade i anaeroba förhållanden i systemen, och en stor slamproduktion, genom anaerob nedbrytning, som satte igen systemen. Andra problem med de vertikala odlingarna var bland annat direktkontakt mellan potentiellt kontaminerat gråvatten och växterna samt dåligt vattenutnyttjande. Inget av de testade systemen kunde rekommenderas för fortsatt implementering. Förbättringar av vertikala odlingar så som separat applicering av gråvatten samt ny design för att undvika igensättning och öka vattenåtervinningen föreslogs. Ett förbättrat rotzonsfilter med större area rekommenderades också. Men trots föreslagna förbättringar är dessa system kanske inte de bästa alternativen för Ouagadougou. Ett alternativt system som kombinerar filtrering med en anslutande horisontal odling föreslogs vara en bättre lösning som bör utredas närmare. Med hänsyn till förutsättningarna i Ouagadougou och de identifierade problemen med de implementerade systemen kan det hända att stenkistor är den bästa lösningen för hantering av gråvatten såvida inte ett väl dimensionerat och billigt alternativ kan utvecklas. Nyckelord: Burkina Faso, ekologisk sanitet, gråvatten, BDT-vatten, återanvändning, bevattning, vertikal odling, rotzonsfilter, komposttäckning, Ouagadougou Institutionen för Energi och Teknik, Sveriges lantbruksuniversitet, Box 7070, SE - 750 07Uppsala, Sverige. ISSN 1401-5765.
iii
RÉSUMÉ Les systems pour réutilisasion et l’élimination des eaux grises á petite échelle Une etude de case à Ouagadougou
Orianna Courtney Eklund and Linda Tegelberg
Un problème fréquent aux villes dans les pays en voie de développement est que les eaux grises usées non purifiées - qui viennent de la lessive, de la douche et de la vaisselle - qui sont jetées directement dans les rues. Ces accumulations d‘eau détruisent l‘infrastructure et posent un problème pour la santé publique car elles créent un environnement où les moustiques et les pathogènes peuvent facilement se multiplier. Des systèmes qui réutilisent les eaux grises usées pour arroser les plants offrent un meilleur traitement des eaux usées mais peuvent aussi réduire le manque d‘eau, garantissant l‘approvisionnement des produits alimentaires aux endroits qui sont aujourd‘hui aux prises avec le manque d‘eau. L‘objet de ce mémoire était d‘analyser deux systèmes pour traiter les eaux grises usées - les jardins verticaux et les lits de mulch – qui ont étés testés à Ouagadougou, Burkina Faso. Les systèmes de réutilisation et de traitement des eaux grises usées et les risques associées à l‘arrosage avec ces eaux ont été étudiés dans la littérature actuelle. Hors des expériences sur deux nouveaux jardins verticaux, nous avons fait des analyses du sol, des interviews et des observations dans les ménages qui utilisent les jardins verticaux et les lits de mulch depuis plusieurs mois. Le plus grand problème avec les systèmes examinés était qu‘ils n‘étaient pas faits avec des dimensions capable de traiter une aussi grande charge d‘eau. En conséquence, les systèmes ont construit une condition anaérobique et une grande production du limon qui a bouchée les systèmes. D‘autres problèmes avec les jardins verticaux étaient, par exemple, le contacte direct entre l‘eau usée, potentiellement contaminée, et les plantes, aussi bien qu‘une mauvaise réutilisation de l‘eau. Aucun système ne pouvait être recommandé pour une continuation d‘implémentation. Pour améliorer des jardins verticaux, nous avons proposé l‘application séparée des eaux grises usées et une nouvelle conception pour éviter la bouchée des systèmes et d‘augmenter la réutilisation de l‘eau. Encore une autre proposition était de mettre en place un lit de mulch plus grand.
Malgré ces changements proposés, c‘est possible que ces systèmes ne soient pas les meilleures alternatives pour Ouagadougou. Un système qui peut combiner le filtrage avec un jardin horizontal a été proposé comme une meilleure solution qui devrait être plus analysée. Il faut aussi faire attention aux égards à Ouagadougou et les problèmes qui sont identifiés avec les systèmes actuellement implémentés. C‘est possible que les puisards soient la meilleure solution pour le traitement des eaux grises usées si aucune alternative correctement dimensionné et moins cher ne peut être trouvé.
Ministère de l’Énergie et de la Technologie, l’Université suédoise de l’agriculture, Box 7070, SE - 750 07Uppsala, Suède. ISSN 1401-5765.

iv
PREFACE This work compromises 30 ETCS within the Master of Science in Aquatic and Environmental Engineering program at Uppsala University, Sweden. Fieldwork was carried out at the Centre Régional de l‘Eau et l‘Assainissement à faible coût (CREPA) in Ouagadougou, Burkina Faso as a Minor Field Study (MFS) financed by the Swedish International Development Agency (SIDA). Sahar Dalahmeh, PhD student at the Department of Energy and Technology, Swedish University of Agricultural Sciences, was the supervisor. The subject reviewer was Håkan Jönsson, professor at the Department of Energy and Technology, Swedish University of Agricultural Sciences. Supervisors in Burkina Faso included Dr. Amah Klutze and Linus Dagerskog, both at CREPA.
This thesis will be included in Project Greywater as a part of CREPA‘s Regional Ecological Sanitation Program, which focuses on research to find EcoSan solutions for reuse of urine, fecal matter, greywater and organic kitchen waste in agriculture and through this provide a link between sanitation and agriculture. Special thanks to everyone at CREPA who helped us with our work including, but not limited to, Cheick Tidiane Tandia, Dr. Amah Klutze, Linus Dagerskog, Jean Marc Yofe and Halidou Koanda. We very much enjoyed the opportunity to work with you.
We would also like to express our gratitude to people in Ouagadougou who helped us with our work, including Richard Zoundi and Roger Baro at the Laboratoire National de l‘Eau et l‘Assainissement, without whom it would not have been possible to carry out some of our tests. Thanks to our translator Judith Héléme Kaborè and to Zachari Tompodi who took us around to the households and helped us build two vertical gardens and thanks to Dominigue who always helped us with the experiments. Thanks to our friend and information supplier Peter Hansen at United Nations Development Program, and a special thanks to our husband and brother Johannes Eklund who helped us in numerous ways during his visit. Thanks also to everyone in Ouagadougou who were not directly involved with our work, but who helped it indirectly by making our time there more enjoyable. For help with our work here in Sweden, we would like to thank Sahar Dalahmeh, Håkan Jönsson, Mats Larsbo and Abraham Joel at the University of Agricultural Sciences and Allan Rodhe, Uppsala University. We appreciate all the time you took to answer our questions. Thanks also to the Department for Tropical Ecology, Uppsala University for making it possible for us to do this MFS. Special thanks also to Sofia Anderson for introducing Linda to Linus , which made all this happen. Lastly, thanks to friends and family for all your support!

v
Though all work in this thesis was developed together, Linda Tegelberg had the main responsibility for Sections 2.2.3, 3, 4, 6.1.3-6.1.5 and 6.2.3, while Orianna Courtney Eklund had the main responsibility for Section 2 (minus 2.2.3), 6.1.2 and 6.2.2. All other sections were written together. Uppsala, May 2010 Orianna Courtney Eklund & Linda Tegelberg Copyright © Orianna Courtney Eklund, Linda Tegelberg and the Department of Energy and Technology, Swedish University of Agricultural Sciences (SLU). UPTEC W 10 020, ISSN 1401-5765 Printed at the Department of Earth Sciences, Geotryckeriet, Uppsala University, Uppsala 2010.
vi
POPULÄRVETENSKAPLIG SAMMANFATTNING Småskaliga system för återanvändning och hantering av gråvatten En fallstudie i Ouagadougou Mer än en tredjedel av världens befolkning har inte tillräckligt med vatten för det dagliga behovet och i takt med att invandringen till städerna ökar, kommer den andelen att bli större. Eftersom majoriteten av allt färskvatten går åt till att producera mat, ger vattenbrist även direkta konsekvenser i livsmedelsförsörjningen. I områden med brist på vatten är det därför viktigt att hitta lösningar för att effektivt använda vatten som finns tillgänglig. Detta görs bland annat genom återanvändning av avloppsvatten som bevattningsvatten. Exempel på sådana lösningar är småskaliga system för återanvändning av gråvatten. Gråvatten är avloppsvatten som inte innehåller toalettvatten, med andra ord vatten från bad, disk och tvätt och kallas också BDT-vatten. Gråvattenåtervinning bidrar inte bara till minskad vattenbrist och tryggad livsmedelsförsörjning utan erbjuder även en säker hantering av gråvattnet, något som annars inte alltid är givet i många delar av världen. Ett vanligt problem i dagens utvecklingsländer är att obehandlat gråvatten kastas rakt ut på gatan, till följd av dåligt utvecklad infrastruktur för avloppsvatten. Vattensamlingarna förstör hus och gator och utgör en hälsorisk då de erbjuder en perfekt miljö för myggor och patogener att föröka sig i. Speciellt påtagligt är detta problem i städerna, där tät befolkning resulterar i stora mängder producerat gråvatten per ytenhet. Så det ser ut i Ouagadougou, huvudstad i Burkina Faso som är ett av världens fattigaste länder. Där har det nationella kontoret för vatten och sanitet sedan många år drivit ett projekt (PSAO) som har till syfte att förbättra de sanitära förutsättningarna i huvudstaden, bland annat genom lokala lösningar för hantering gråvatten på tomten. Deras rekommendation till hushållen är att installera stenkistor. Men att installera en stenkista är dyrt och inte en realistisk möjlighet för många hushåll i Ouagadougou. Med anledning av detta, startade en regional organisation, CREPA, ett projekt som syftar till att hitta billiga, produktiva och sanitära system för återanvändning av gråvatten till bevattning på hushållsnivå. Två system – vertikala odlingar och rotzonsfilter – ansågs kunna uppfylla kraven och implementerades i ett pilotprojekt i början av 2009. Syftet med den här studien var att utvärdera dessa två implementerade system med avseende på teknisk funktion, underhållsbehov samt effekter på jord och växter för att bestämma deras framtida tillämpbarhet i Ouagadougou. System för återanvändning och hantering av gråvatten samt risker förknippade med bevattning med gråvatten studerades i litteratur jämte platsspecifika parametrar såsom klimat, vattentillgång och nuvarande hantering av avloppsvatten. Utvärderingen baserades, utöver litteraturstudierna, på observationer och intervjuer i fem hushåll som under några månader använt vertikala odlingar samt ett hushåll med två rotzonsfilter. Från samtliga system analyserades jorden med avseende på pH och elektrisk konduktivitet, då dessa parametrar är
vii
kända för att påverkas av gråvattenbevattning och det, i sin tur, påverkar växternas hälsa. För att bättre kunna analysera de vertikala odlingarna, byggdes två nya system på vilka diverse experiment utfördes för att bland annat kunna uppskatta hur mycket ett sådant system kan belastas och för att se om vattnet verkligen blev tillgängligt för växterna. Förutom systemspecifika analyser utfördes ytterligare experiment för att se vad bevattning med gråvatten kan ha för effekt på växter och jord. Flera problem identifierades med de implementerade systemen. Gemensamt var att systemen blev överbelastade, vilket resulterade i vattenmättade förhållanden i systemen. Detta ledde till att det organiska materialet i gråvattnet bröts ner ofullständigt av anaeroba mikroorganismen, vilket gav en ökad produktion av slam jämfört med om nedbrytningen skett med tillgång till syre. Slammet satte igen systemen och minskade deras kapacitet ytterligare och ledde även till ökat underhållsbehov. Bortsett från att trädet i en av de två rotzonsfiltrena höll på att dö på grund av överbelastning kunde inga direkta problem med varken plant- eller jordhälsa urskiljas. Däremot verkade återanvändningen av vatten inte vara tillräcklig i de vertikala odlingarna för att dessa skulle kunna producera ordentligt med grönsaker året om. Under regnperioden växter det friskt men under torrperioden dog växterna om inte extra vatten tillsattes direkt på plantjorden. Fortsatt användning av de implementerade systemen kunde inte rekommenderas. Ett ytterligare problem med rotszonsfiltrena var att det var svårt att få tag på organisk material i Ouagadougou samt att det var svårt för hushållen att skilja organiskt material från exempelvis plast, vilket resulterade i att systemen var fulla av skräp. Förbättringar som kan eliminera de identifierade problemen föreslogs, men trots det bedöms dessa förbättrade system inte att uppfylla CREPAs mål för ett billigt, produktivt och sanitärt system som kan användas i större skala i Ouagadougou. Rotzonsfiltren skulle ta upp alldeles för mycket plats och investerings- och underhållskostnaden för en förbättrad vertikal odling skulle troligtvis bli högre än den för en stenkista. För de vertikala odlingarna innefattade förbättringarna en något ändrad design för att öka återanvändningen av det applicerade gråvattnet och minska risken för patogenöverföring till växterna till följd av direktkontakt med potentiellt kontaminerat vatten. Den nya designen skulle även ge en bättre rening av organiskt material innan vattnet infiltrerades i plantjorden och därmed skulle risken för igensättning minska. För bättre resultat med rotzonsfilter skulle en större yta krävas vilket dessvärre även fordrar mycket större mängder organiskt material. En helt ny systemdesign, med ett filter anslutet till en horisontalodling, föreslogs också. Detta system antas kunna uppfylla CREPAs mål men måste dock dimensioneras, testas och utvärderas innan några sådana slutsatser kan dras. Innan detta är gjort och med hänsyn till förutsättningarna i Ouagadougou och de identifierade problemen med de implementerade systemen kan det hända att stenkistor är den bästa lösningen för hantering av gråvatten. Även om de inte återanvänder vattnet till produktion av mat så löser de effektivt problemet med vatten som kastas direkt ut på gatan utan en ökad hälsorisk för användaren.

viii
ix
ABBREVIATIONS AND DEFINITIONS BOD Biological oxygen demand COD Chemical oxygen demand CREPA Centre Régional de l‘Eau et l‘Assainissement (Regional Center for Water and
Sanitation) EC Electrical conductivity. Unit of measurement is dS/m = 1000 µS/cm fCFA franc Comminauté Financière en Afrique. Burkina Faso‘s national currency.
1000 fCFA is 1.52 € (CIA, 2010) MB Mulch bed ONEA l‘Office National de l‘Eau et l‘Assainissement (National Office for Water and
Sanitation) PSAO Plan Stratégique l‘Assainissement de la ville de Ouagadougou (Strategic Plan
for Management of Wastewater in Ouagadougou) SAR Sodium adsorption ratio TDS Total dissolved solids VG Vertical garden. VG 1-5 presents five vertical gardens that had been in use in
households since early 2009, while VG A and VG B are two vertical gardens built specifically for this thesis.
Box plots Also called box and whisker plots. According to Minitab 15 Statistical Software, the upper whisker ―extends to the maximum data point within 1.5 box heights from the top of the box‖, while the lower whisker ―extends to the minimum data point within 1.5 box heights from the bottom of the box‖. The top line of the range box indicates the upper quartile (75%), the middle line in the range box is the median and the bottom line of box is the lower quartile (25%). Stars (*) indicate outliers that are greater than or less than the upper or lower whiskers. Ecological sanitation (EcoSan) According to Esrey et al. (1998) EcoSan solutions are ―sustainable, closed-loop systems‖ which treat and reuse human waste products, both excreta and other wastewater sources, often for agricultural purposes. Food security was defined during the World Food Summit 1996 as ―the right of everyone to have access to safe and nutritious food, consistent with the right to adequate food and the fundamental right of everyone to be free from hunger‖ (FAO, 1996).
Greywater According to Morel & Diener (2006) greywater is defined as wastewater from kitchen, laundry and bathroom sources, that is non-toilet wastewater, meaning wastewater that does not contain urine or feces. Primary treatment According to Pettygrove & Asano (1985), primary treatment is used to remove larger particle and fats from the greywater. Secondary treatment Treatment used to remove pathogens, organic matter and other pollutants in greywater (Pettygrove & Asano, 1985).

x
Wastewater By WHO (2006) defined as ―liquid waste discharged from homes, commercial premises and similar sources to individual disposal systems or to municipal sewer pipes". Water quality refers to physical, chemical and microbiological characteristics of the water.
Water scarcity According to UN-Water (2006) a country experiences water scarcity if the annual water supplies are less than 1 000 m3 per person. Water stress According to UN-Water (2006) a country experiences water stress if the annual water supplies are less than 1 700 m3 per person.

xi
TABLE OF CONTENTS ABSTRACT ................................................................................................................................ i
REFERAT .................................................................................................................................. ii
RÉSUMÉ ................................................................................................................................... iii
PREFACE ................................................................................................................................. iv
POPULÄRVETENSKAPLIG SAMMANFATTNING ............................................................ vi
ABBREVIATIONS AND DEFINITIONS ............................................................................... ix
TABLE OF CONTENTS .......................................................................................................... xi
1 INTRODUCTION .............................................................................................................. 1
1.1 PROJECT BACKGROUND ....................................................................................... 2
1.2 OBJECTIVES .............................................................................................................. 4
1.2.1 Limitations ........................................................................................................... 4
1.3 THESIS LAYOUT ...................................................................................................... 4
2 LITERATURE STUDY ..................................................................................................... 5
2.1 GREYWATER ............................................................................................................ 5
2.1.1 General characteristics ......................................................................................... 5
2.2 GREYWATER DISPOSAL AND REUSE SYSTEMS .............................................. 7
2.2.1 Designing a greywater reuse and disposal system ............................................... 8
2.2.2 Using greywater for irrigation ............................................................................ 14
2.2.3 Small-scale greywater systems ........................................................................... 23
2.2.4 Assessment of a greywater system ..................................................................... 28
3 OUAGADOUGOU .......................................................................................................... 30
3.1 GENERAL ................................................................................................................. 30
3.2 WATER SUPPLY ..................................................................................................... 31
3.3 GREYWATER PRACTICES .................................................................................... 32
3.3.1 Recommended leach pits by ONEA ................................................................... 33
3.4 URBAN AGRICULTURE ........................................................................................ 33
4 PROJECT GREYWATER ............................................................................................... 34
4.1 THE BASELINE STUDY ......................................................................................... 35
4.1.1 The study area .................................................................................................... 35
4.1.2 From water source to greywater disposal ........................................................... 35
4.1.3 Perceptions on current greywater disposal ......................................................... 37
xii
4.2 GREYWATER CHARACTERIZATION ................................................................. 37
4.3 PILOT TESTING ...................................................................................................... 37
4.3.1 Implemented vertical garden .............................................................................. 38
4.3.2 Implemented mulch bed ..................................................................................... 40
5 METHODS ....................................................................................................................... 42
5.1 SYSTEMS IN PRACTICE ........................................................................................ 42
5.2 ELECTRICAL CONDUCTIVITY AND pH ANALYSIS ....................................... 42
5.2.1 Sampling methodology ...................................................................................... 43
5.2.2 Analysis .............................................................................................................. 44
5.2.3 Statistical analysis .............................................................................................. 44
5.3 HYDRAULIC LOADING RATE ............................................................................. 44
5.4 WATER LOADING CAPACITY IN A VERTICAL GARDEN ............................. 45
5.5 POROSITY AND PORE VOLUME IN A VERTICAL GARDEN ......................... 46
5.5.1 Center core and bottom gravel layer .................................................................. 46
5.5.2 Plant soil ............................................................................................................. 46
5.6 PLANTING A VERTICAL GARDEN ..................................................................... 47
5.7 GREYWATER AS IRRIGATION WATER ............................................................ 48
5.8 EFFECT OF GREYWATER ON SOIL .................................................................... 49
5.8.1 Single ring falling head infiltrometer ................................................................. 50
6 RESULTS ......................................................................................................................... 51
6.1 VERTICAL GARDENS ............................................................................................ 51
6.1.1 Vertical gardens in practice ................................................................................ 51
6.1.2 Electrical conductivity and pH ........................................................................... 57
6.1.3 Hydraulic loading rate ........................................................................................ 61
6.1.4 Water loading capacity ....................................................................................... 62
6.1.5 Porosity and pore volume ................................................................................... 62
6.1.6 Planting a vertical garden ................................................................................... 63
6.2 MULCH BEDS .......................................................................................................... 64
6.2.1 Mulch beds in practice ....................................................................................... 64
6.2.2 Electrical conductivity and pH ........................................................................... 66
6.2.3 Hydraulic loading rate ........................................................................................ 68
6.3 EFFECT OF GREYWATER ON PLANTS AND SOIL .......................................... 68
6.3.1 Greywater as irrigation water ............................................................................. 68
xiii
6.3.2 The effect of greywater on soil........................................................................... 71
7 DISCUSSION .................................................................................................................. 73
7.1 VERTICAL GARDENS ............................................................................................ 73
7.1.1 System assessment ............................................................................................. 73
7.1.2 Assessment of health risk ................................................................................... 82
7.1.3 Environmental aspects ........................................................................................ 83
7.1.4 Socio-cultural aspects ......................................................................................... 84
7.1.5 Economical aspects ............................................................................................ 84
7.1.6 Concluded advantages and disadvantages .......................................................... 86
7.2 MULCH BEDS .......................................................................................................... 86
7.2.1 System assessment ............................................................................................. 86
7.2.2 Assessment of health risk ................................................................................... 89
7.2.3 Environmental aspects ........................................................................................ 89
7.2.4 Socio-cultural aspects ......................................................................................... 89
7.2.5 Economical aspects ............................................................................................ 89
7.2.6 Concluded advantages and disadvantages .......................................................... 90
7.3 EFFECTS OF GREYWATER ON PLANTS AND SOIL ........................................ 90
7.3.1 Greywater as irrigation water ............................................................................. 90
7.3.2 The effect of greywater on soil........................................................................... 91
8 SUGGESTED IMPROVEMENTS AND ALTERNATE SYSTEMS ............................. 92
8.1 REQUIREMENTS AND CONSIDERATIONS FOR A GREYWATER REUSE SYSTEM IN OUAGADOUGOU ........................................................................................ 92
8.2 IMPROVEMENTS TO THE IMPLEMENTED SYSTEMS .................................... 94
8.2.1 Improved vertical garden ................................................................................... 94
8.2.2 Improved mulch bed ........................................................................................... 96
8.3 ALTERNATE SYSTEMS ......................................................................................... 97
8.3.1 Filter garden ....................................................................................................... 97
8.3.2 Leach pits ......................................................................................................... 100
9 CONCLUSIONS ............................................................................................................ 102
10 REFERENCES ............................................................................................................... 103
APPENDIX A ........................................................................................................................ 114
APPENDIX B ........................................................................................................................ 117
APPENDIX C ........................................................................................................................ 119
APPENDIX D ........................................................................................................................ 124

xiv
APPENDIX E ......................................................................................................................... 132
APPENDIX F ......................................................................................................................... 133
APPENDIX G ........................................................................................................................ 134

1
1 INTRODUCTION More than one third of the world‘s population is affected by water scarcity today and this number is projected to increase in the future as populations grow and urban areas expand (FAO, 2007; WHO, 2009). Since the majority of freshwater is used for food production (FAO, 2007), water scarcity in an area also directly influences food security. In areas experiencing water shortage it has therefore become important to invest in integrated water resource management and to try to find new ways to produce food with less freshwater. Due to this, new water management alternatives have started to emerge in an effort to minimize the effects of water scarcity and increase food security using low-cost solutions. One such solution is the reuse of greywater. Greywater is wastewater that does not contain water from the toilet, and is therefore believed to be safer for reuse without the extensive treatment that is required of wastewater containing high levels of fecal matter. Currently, small-scale, low-cost greywater disposal systems that reuse greywater for plant irrigation are gaining popularity in many parts of the world (Center for the Study of the Built Environment, 2003). These systems are considered to be a way of closing the loop, which is a reoccurring idea in ecological sanitation (EcoSan) solutions. In this way, otherwise wasted greywater and possible nutrients in that water are reused, which can lead to improved food security and poverty alleviation (SEI, 2009). Such solutions are also a step on the way to accomplishing two of the Millennium Development Goals, set up by the United Nations to meet the needs of the world‘s poorest: MDG 1 End Poverty and Hunger and MDG 7 Ensure Environmental Sustainability (UN, 2008). The increased interest in safe greywater reuse as a component of integrated water resource management and sustainable development is not only caused by the need for increased food security and improved water management, but is also due in part to another large problem: improper disposal of greywater in urban and peri-urban areas. Wastewater sewage piping to low and middle-income households is often lacking in urban and peri-urban areas in low-income countries. High population density also limits the space available for systems that can properly dispose of and treat wastewater (Ridderstolpe, 2004; Winblad & Simpson-Hébert, 2004). Because of this, greywater is often discarded untreated on the streets outside of households. Consequently, puddles of greywater are left standing where they will become anaerobic and develop unpleasant smells in as little as 24 hours, if infiltration into the soil is slow (Morel & Diener, 2006; Murphy, 2006; Winblad & Simpson-Hébert, 2004; Ridderstolpe, 2004). According to Morel & Diener (2006), Ayers & Westcot (1985) and Murphy (2006), this standing water not only damages the surround buildings and streets, but also poses a health risk as the puddles can increase mosquito breeding, which can in turn result in a heighten risk for malaria and other mosquito-borne diseases in the area. The puddles also become a perfect environment for bacteria and pathogen growth (Morel & Diener, 2006; Murphy, 2006). This can pose a significant increase in health risks if animals or children come in contact with the water or if nearby freshwater sources are contaminated with it.

2
Increased population growth and the resulting increase in produced wastewater are expected to increase the magnitude of problems associated with greywater disposal and water scarcity. Because of this, finding properly functioning small-scale, low-cost greywater reuse and disposal systems for urban areas is an important part in future water management plans and a step along the path to alleviating these types of problems.
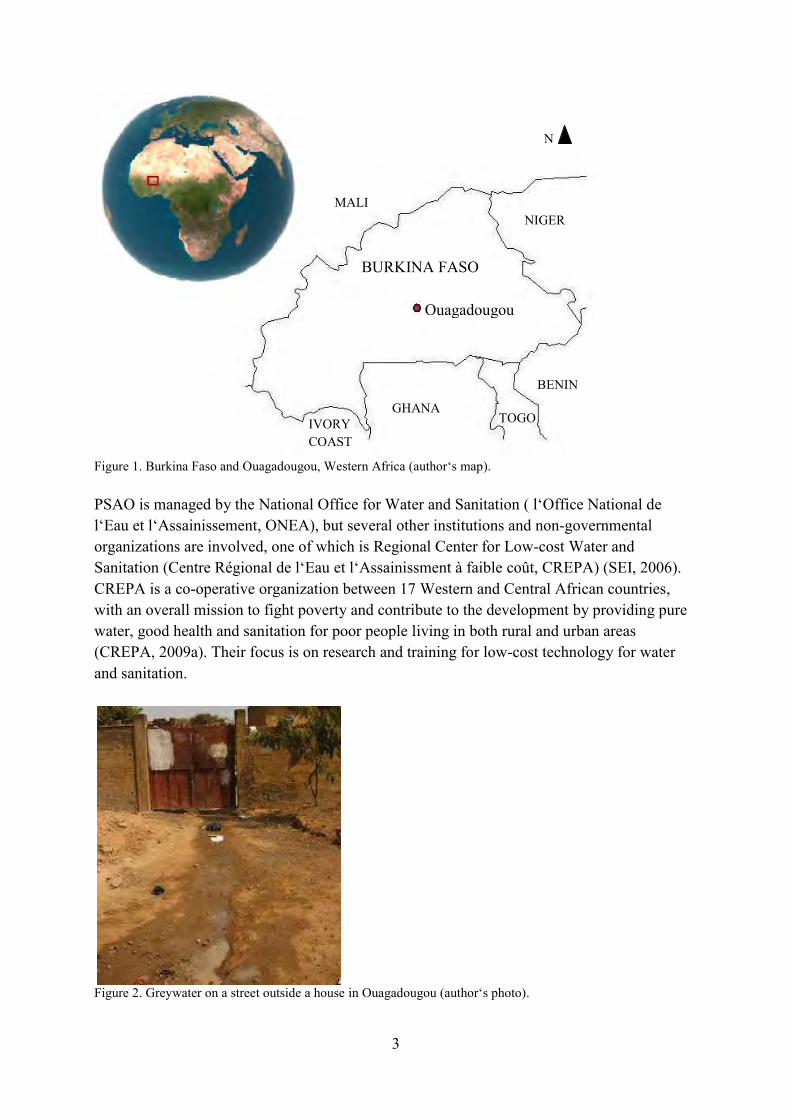
1.1 PROJECT BACKGROUND A typical example of the situation mentioned above is the country Burkina Faso. Burkina Faso is situated in the inland of Western Africa, in the transitional zone between the tropical green forests along the Atlantic Ocean coast in the south and the arid Sahara desert in the north (Figure 1). It is among the poorest countries in the world, ranked 177 out of 182 countries in United Nations‘ Human Development Index (UNDP, 2009). Of the 15.7 million people in the country, almost every second Burkinabe lives on less than one US dollar a day and the average life expectancy is less than 50 years (CIA, 2010; SIDA, 2009a). Burkina Faso is part of the Sudano-Sahelian belt, which is experiencing continual problems with desertification (World Bank, 2006). The country is also water stressed and is on the brink of experiencing water scarcity; annual water supplies in 2003 were 1 024 m3 per person (Earthtrends, 2003b). In addition to incomplete water sources, economical and technical constraints limit the availability of the existing waters (SP/CONAGESE, 2002). The majority of the people are crop or cattle farmers, but the soils are poor and crop failure is common (SIDA, 2009a; UNICEF, 2005). Despite several years of effort to reduce famine and malnutrition, the country still struggles with food insecurity. Due to the fact that the urban growth rate between 1980 and 2000 was 6.6%, almost three times higher than the world average (Earthtrends, 2003b), problems related to water stress and food security in the country and its urban areas are expected to be a critical problem in the future. Alternative urban agriculture solutions will be vital in the future to supply food to the growing population (WHO, 2006). In the country‘s capital, Ouagadougou, most households, especially low-income households, are not attached to any piping system for wastewater and lack other options for greywater management. As a result of this, greywater is often thrown out on the streets (Figure 2), where it becomes a health hazard and destroys infrastructure. An ongoing integrated program for hygiene and sanitation for the city of Ouagadougou was established in 1992 with the purpose of coping with this and other problems. The objectives of this program, outlined in the Strategic Plan for Management of Wastewater in Ouagadougou (Plan Stratégique l‘Assainissement de la ville de Ouagadougou , PSAO), is to improve sanitation conditions of the city (SEI, 2006). Three components are included in the program: on-site sanitation for households, school sanitation facilities and off-site sanitation.
3
Figure 1. Burkina Faso and Ouagadougou, Western Africa (author‘s map). PSAO is managed by the National Office for Water and Sanitation ( l‘Office National de l‘Eau et l‘Assainissement, ONEA), but several other institutions and non-governmental organizations are involved, one of which is Regional Center for Low-cost Water and Sanitation (Centre Régional de l‘Eau et l‘Assainissment à faible coût, CREPA) (SEI, 2006). CREPA is a co-operative organization between 17 Western and Central African countries, with an overall mission to fight poverty and contribute to the development by providing pure water, good health and sanitation for poor people living in both rural and urban areas (CREPA, 2009a). Their focus is on research and training for low-cost technology for water and sanitation.
Figure 2. Greywater on a street outside a house in Ouagadougou (author‘s photo).
TOGO
N
Ouagadougou
BURKINA FASO
NIGER MALI
IVORY COAST
GHANA
BENIN
4
As part of CREPA‘s Regional Ecological Sanitation Program, which focuses on research to find EcoSan solutions for reuse of urine, fecal matter, greywater and organic kitchen waste in agriculture, and in line with PSAO, Project Greywater was initialized in 2008. The project aims at finding on-site reuse systems for greywater management that are low-cost, productive, easily maintainable and hygienically safe (Kando, 2008; Yofe 2008). Initially, a major study on water usage patterns, current greywater disposal practices and site specific greywater characteristics was carried out. In the beginning of 2009 two different types of greywater systems that reuse greywater to irrigate plants, called vertical gardens and mulch beds, were built to test the technology at the household level. Since then, there had been little follow up on the systems to evaluate their performance and determine if they are suitable to promote to the population at large in Ouagadougou.
1.2 OBJECTIVES The objective of this thesis was to evaluate the vertical gardens and mulch beds that had been implemented in Project Greywater. The evaluation was done with respect to technical performance, soil and plant health and system requirements in order to determine the future applicability of these systems in Ouagadougou. If necessary, proposals should be made on ways to improve the design or on suggestions for alternate systems that might be more suitable for the conditions in Ouagadougou.
1.2.1 Limitations In this thesis, the reuse efficiency of the systems is analyzed but the level of greywater treatment that each system achieves is not evaluated. Other important aspects to consider when constructing and assessing a greywater reuse systems, such as socio-cultural, economical and environmental aspects and assessment of health risk, are only briefly evaluated.
1.3 THESIS LAYOUT A literature study on greywater, greywater reuse and disposal systems and greywater reuse as irrigation water is presented in Chapter 2. Chapter 3 discusses background information on Ouagadougou in general and from a water and wastewater perspective. In Chapter 4 results and research prior to this thesis, done by CREPA in Project Greywater, are presented. The assessment of the implemented systems was based on a combination of literature studies, presented in Chapter 2, 3 and 4, and fieldwork completed in Ouagadougou. The methods for the fieldwork are explained in Chapter 5 and the results are presented in Chapter 6. An assessment of the implemented systems is included in the Discussion in Chapter 7, as well as interpretation of other results that were not system specific, but rather done with the goal to see the effects of greywater irrigation. The thesis ends with suggestions for improvements to the implemented systems as well as suggestions on other systems that could be plausible in Ouagadougou, presented in Chapter 8.
5
2 LITERATURE STUDY Included in this section is a review of information about greywater and greywater reuse and disposals systems that was collected during the course of this thesis. Information that is included is not only relevant for useful interpretations of this study‘s results, but also for future subprojects in CREPA‘s Project Greywater. Many different aspects of greywater and greywater reuse are touched upon, but with focus on information that is relevant to CREPA‘s goals for Project Greywater (Section 1.1).
2.1 GREYWATER Greywater is generally defined as household wastewater that does not come from a toilet, meaning that it is wastewater that does not contain urine or feces (Morel & Diener, 2006). While it generally makes up 50% to 80% of a household's wastewater (Ludwig, 2003), the quantity of greywater produced by a household depends above all on practices of the household in question. A household‘s practices are directly influenced by the amount of freshwater available and the cost and supply route of that freshwater, as well as the number of people living in the household, their ages and gender and the living conditions in the nearby area (Murphy, 2006; Mungai, 2008).
The quality, e.g. level of contamination, of greywater varies depending on the household‘s water habits and the chemicals used (Winblad & Simpson-Hébert, 2004). Freshwater shortages and conservation will not only reduce the quantity of greywater produced, but also the quality of it, resulting in greywater that is more concentrated due to less dilution (Murphy, 2006; Morel & Diener, 2006). Just as greywater quality and quantity varies from household to household, it likewise varies within a household depending on the source of the specific greywater. Due to this, greywater is generally divided into three different types: kitchen, bathroom and laundry. These different types, along with their general characteristics are outlined in Table 1.
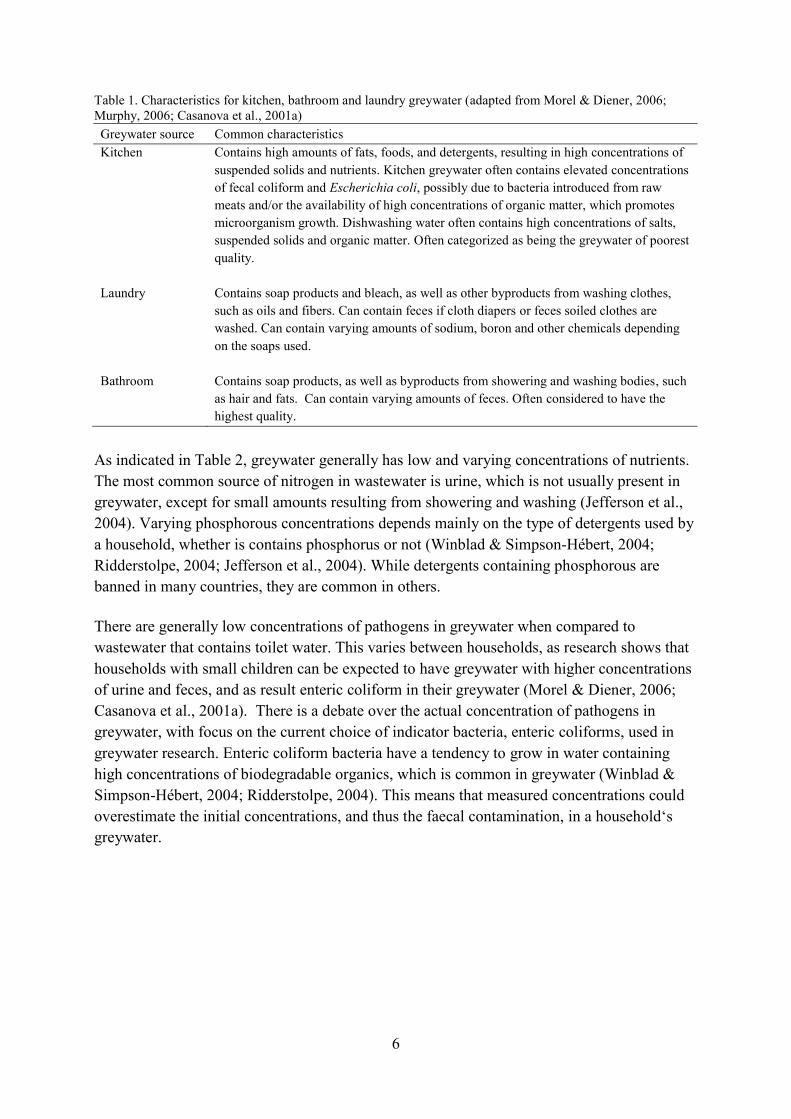
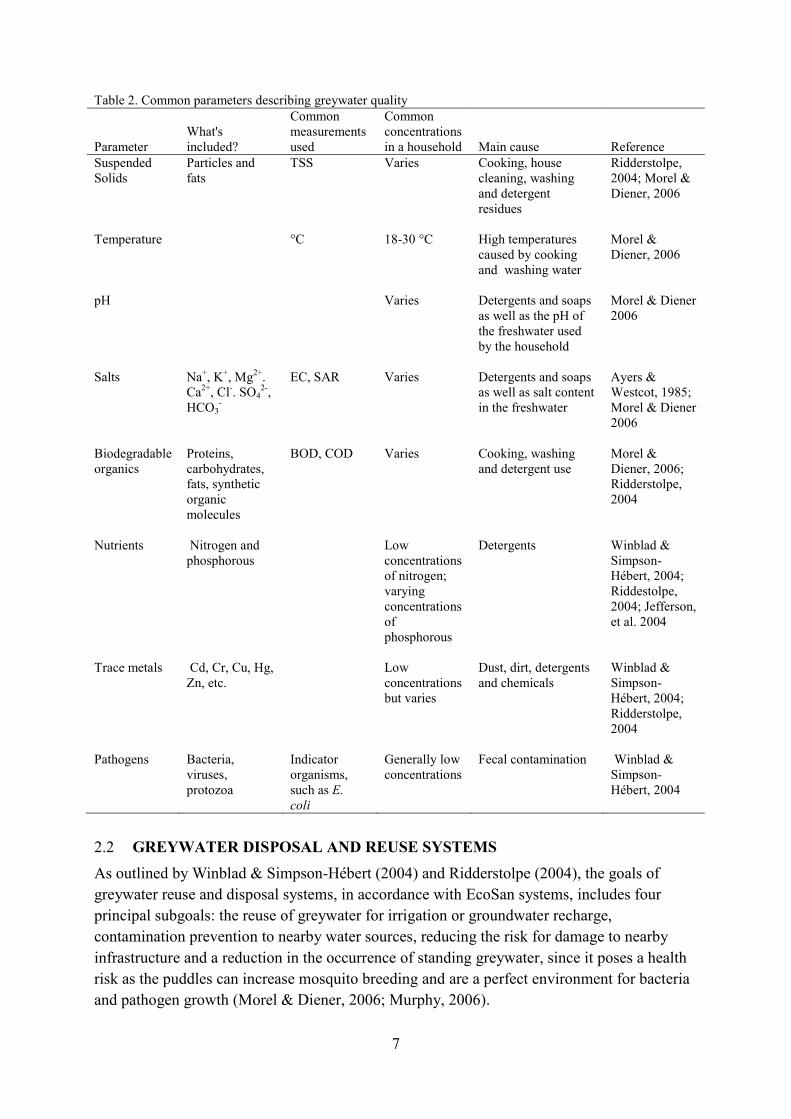
2.1.1 General characteristics As described above, greywater varies from source to source, often making it difficult to characterize. Nevertheless, understanding the characteristics of a household‘s greywater is crucial in order to decide what types of disposal and reuse systems can be implemented. The characteristics presented in Table 2 are generally examined when the greywater quality from a source is studied. Suspended solids, temperature, pH, salts, biodegradable organics, nutrients and heavy metals are considered to be physiochemical characteristics, while pathogens are microbiological.
6
Table 1. Characteristics for kitchen, bathroom and laundry greywater (adapted from Morel & Diener, 2006; Murphy, 2006; Casanova et al., 2001a) Greywater source Common characteristics Kitchen Contains high amounts of fats, foods, and detergents, resulting in high concentrations of
suspended solids and nutrients. Kitchen greywater often contains elevated concentrations of fecal coliform and Escherichia coli, possibly due to bacteria introduced from raw meats and/or the availability of high concentrations of organic matter, which promotes microorganism growth. Dishwashing water often contains high concentrations of salts, suspended solids and organic matter. Often categorized as being the greywater of poorest quality.
Laundry Contains soap products and bleach, as well as other byproducts from washing clothes, such as oils and fibers. Can contain feces if cloth diapers or feces soiled clothes are washed. Can contain varying amounts of sodium, boron and other chemicals depending on the soaps used.
Bathroom Contains soap products, as well as byproducts from showering and washing bodies, such as hair and fats. Can contain varying amounts of feces. Often considered to have the highest quality.
As indicated in Table 2, greywater generally has low and varying concentrations of nutrients. The most common source of nitrogen in wastewater is urine, which is not usually present in greywater, except for small amounts resulting from showering and washing (Jefferson et al., 2004). Varying phosphorous concentrations depends mainly on the type of detergents used by a household, whether is contains phosphorus or not (Winblad & Simpson-Hébert, 2004; Ridderstolpe, 2004; Jefferson et al., 2004). While detergents containing phosphorous are banned in many countries, they are common in others.
There are generally low concentrations of pathogens in greywater when compared to wastewater that contains toilet water. This varies between households, as research shows that households with small children can be expected to have greywater with higher concentrations of urine and feces, and as result enteric coliform in their greywater (Morel & Diener, 2006; Casanova et al., 2001a). There is a debate over the actual concentration of pathogens in greywater, with focus on the current choice of indicator bacteria, enteric coliforms, used in greywater research. Enteric coliform bacteria have a tendency to grow in water containing high concentrations of biodegradable organics, which is common in greywater (Winblad & Simpson-Hébert, 2004; Ridderstolpe, 2004). This means that measured concentrations could overestimate the initial concentrations, and thus the faecal contamination, in a household‘s greywater.
7
Table 2. Common parameters describing greywater quality
Parameter What's included?
Common measurements used
Common concentrations in a household Main cause Reference
Suspended Solids
Particles and fats
TSS Varies Cooking, house cleaning, washing and detergent residues
Ridderstolpe, 2004; Morel & Diener, 2006
Temperature °C 18-30 °C High temperatures caused by cooking and washing water
Morel & Diener, 2006
pH Varies Detergents and soaps as well as the pH of the freshwater used by the household
Morel & Diener 2006
Salts Na+, K+, Mg2+. Ca2+, Cl-. SO4
2-, HCO3
-
EC, SAR Varies Detergents and soaps as well as salt content in the freshwater
Ayers & Westcot, 1985; Morel & Diener 2006
Biodegradable organics
Proteins, carbohydrates, fats, synthetic organic molecules
BOD, COD Varies Cooking, washing and detergent use
Morel & Diener, 2006; Ridderstolpe, 2004
Nutrients Nitrogen and phosphorous
Low concentrations of nitrogen; varying concentrations of phosphorous
Detergents Winblad & Simpson-Hébert, 2004; Riddestolpe, 2004; Jefferson, et al. 2004
Trace metals Cd, Cr, Cu, Hg, Zn, etc.
Low concentrations but varies
Dust, dirt, detergents and chemicals
Winblad & Simpson-Hébert, 2004; Ridderstolpe, 2004
Pathogens Bacteria, viruses, protozoa
Indicator organisms, such as E. coli
Generally low concentrations
Fecal contamination Winblad & Simpson-Hébert, 2004
2.2 GREYWATER DISPOSAL AND REUSE SYSTEMS As outlined by Winblad & Simpson-Hébert (2004) and Ridderstolpe (2004), the goals of greywater reuse and disposal systems, in accordance with EcoSan systems, includes four principal subgoals: the reuse of greywater for irrigation or groundwater recharge, contamination prevention to nearby water sources, reducing the risk for damage to nearby infrastructure and a reduction in the occurrence of standing greywater, since it poses a health risk as the puddles can increase mosquito breeding and are a perfect environment for bacteria and pathogen growth (Morel & Diener, 2006; Murphy, 2006).
8
While there are a number of different greywater systems, it is important to design and build a system that fits the location where it is to be used. The coming sections therefore include information that is relevant to greywater disposal and reuse systems in an urban setting. Reusing greywater as irrigation water will be a central part of the theory discussed below, with specific focus on the effects of greywater irrigation. Lastly, an overview of various implemented systems and information needed to asses a system is presented.
2.2.1 Designing a greywater reuse and disposal system There are a number of factors to consider when designing a system for greywater disposal and reuse, ranging from the quality of the greywater to the destined end use of the treated water. Treated greywater may be a potentially valuable resource for reuse, but it is important to design a system that has the best chance of succeeding in the intended environment. The goal is to have a functioning, reliable system, e.g. minimal clogging, leakage and maintenance, which successfully treats greywater without increasing the risk to human health or the environment. To achieve this, different steps and parts of a greywater system need to be understood. This includes site characteristics, greywater source, greywater collection, greywater treatment, end use and system requirements (Center for the Study of the Built Environment, 2003; Pettygrove & Asano, 1985; USEPA, 2004). Discussed below is an overview of these six relevant steps and parts, along with an overview of the important facts and theory relevant to each part. Site characteristics
Site-specific factors should be examined before deciding if and which type of greywater system is best suited for a region. This includes having a working knowledge of the hydrological and meteorological conditions there, as well as of soil types, relevant laws and regulations and local habits and traditions (Ludwig, 2003; Winblad & Simpson-Hébert, 2004). Population size and the available living space per person also affect the quality and quantity of greywater that is produced and actively restrict the size and type of system that can be used (Drangert, 2004). Meteorological information, such as average seasonal temperatures, rainfall and potential evapotranspiration are needed to estimate the environmental conditions that the system will be subjected to. For example, potential evapotranspiration will affect the amount of applied water that can be used by plants, and therefore affect the dimensioning of systems. Other conditions such as the amount of freshwater available and the cost of this water are also important as they will directly affect the quality and quantity of greywater that is produced by a household.
Information regarding topography, soil and geology should be evaluated (Pettygrove & Asano, 1985). The topography of an area can give an indication if possible future system problems such as runoff and flooding can develop. Soil types vary drastically from place to place, and the different characteristics, e.g. texture, structure, pH, salinity and infiltration rate, must be known if a system is to function properly and not endanger the nearby environment
9
(Pettygrove & Asano, 1985). The distance to the groundwater and nearby surface waters is necessary to judge the risk for pollution that can result from using a system.
Existing laws regarding wastewater treatment and disposal must also be taken into consideration. Socio-cultural aspects are important, as they will determine acceptance of a system and the way it is used. For example, current methods of greywater disposal will affect how the future user of the system will utilize the system. As always, positive public opinion is the key to success for a reuse system (Toze, 2006b).
Greywater source
The long-term effects of a system, both on the soil and plants in the system and on the environment near the system, are directly affected by the greywater being treated or disposed of in the system. Therefore, a good knowledge of the quality and quantity of greywater being disposed of is necessary in order to create a safe, functioning system. Since greywater quality and quantity generally varies during a typical year (Roesner et al., 2006), the goal is to design a system that can manage these fluctuations well.
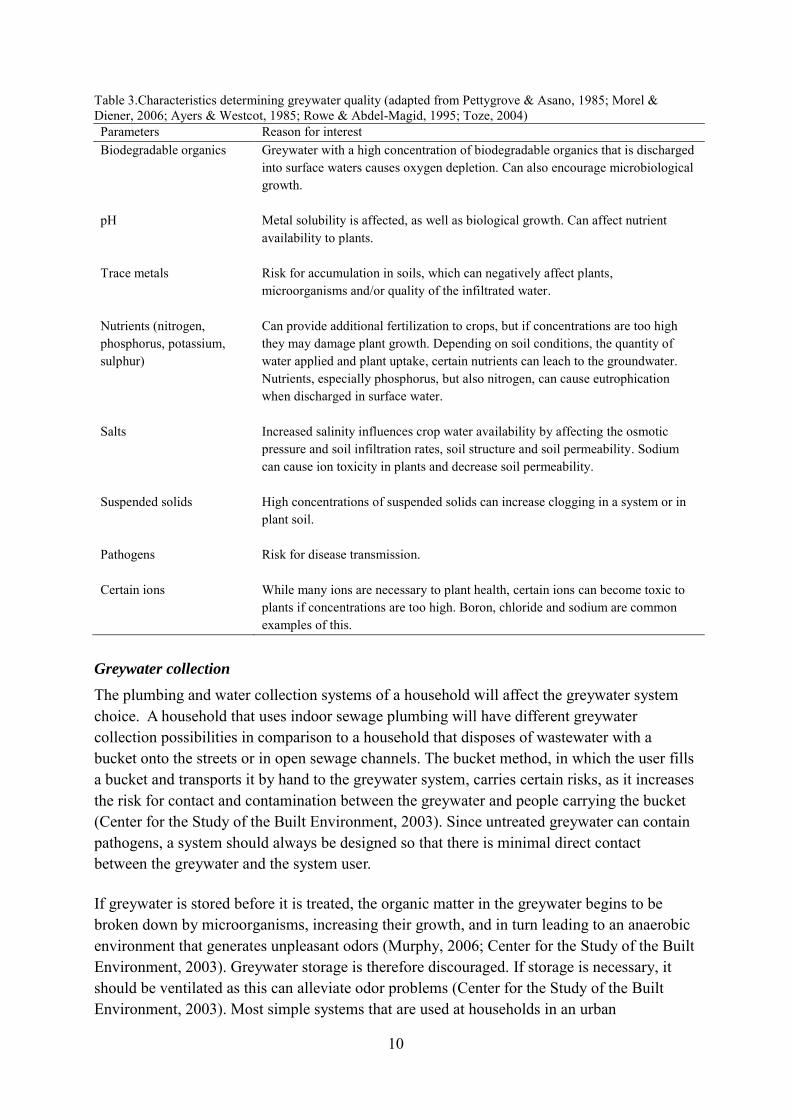
Characteristics determining greywater quality are shown below in Table 3. See also Section 2.1.1 for more general information on the characteristics and Section 2.2.2 for more specific information pertaining to their resulting risks. Due to the varying quality of greywater from different sources, the greywater quality is general looked at for each individual source, e.g. kitchen, laundry, bathroom, as a way of determining if one or more sources of greywater should be excluded. This can be beneficial if it is necessary to increase the quality of greywater being introduced into a system that reuses the treated water for irrigation. For example, the concentrations of harmful chemicals in detergents, including boron, chloride, peroxides and petroleum distillates, will fluctuate depending on the type of detergents used by the household (Center for the Study of the Built Environment, 2003), which varies depending on the source.
The quantity of available greywater will determine the size of the greywater reuse system and the amount of plants that can be irrigated, along with the amount of freshwater that is necessary when greywater quantities are low. There are two ways to deal with fluctuating water quantities when designing a greywater irrigation system. This first is to dimension the irrigation requirement for the amount of precipitation that falls during the rainy season plus the greywater that is generated by the household. In this case the household will have to use freshwater during drier parts of the year to compensate for the lack of rainfall. The second is to divert the treated greywater during the rain period, thereby reducing the amount of water that is coming into the system (Murphy, 2006). Whichever of these options is chosen, a system should be designed to take care of unexpected high greywater input situations without flooding or leaking (Center for the Study of the Built Environment, 2003). The size of the greywater system is commonly determined based on the hydraulic loading rate, which is measured in L/m2/h and describes the amount of water applied over a surface area per hour (Ridderstolpe, 2004).
10
Table 3.Characteristics determining greywater quality (adapted from Pettygrove & Asano, 1985; Morel & Diener, 2006; Ayers & Westcot, 1985; Rowe & Abdel-Magid, 1995; Toze, 2004) Parameters Reason for interest Biodegradable organics
Greywater with a high concentration of biodegradable organics that is discharged into surface waters causes oxygen depletion. Can also encourage microbiological growth.
pH
Metal solubility is affected, as well as biological growth. Can affect nutrient availability to plants.
Trace metals
Risk for accumulation in soils, which can negatively affect plants, microorganisms and/or quality of the infiltrated water.
Nutrients (nitrogen, phosphorus, potassium, sulphur)
Can provide additional fertilization to crops, but if concentrations are too high they may damage plant growth. Depending on soil conditions, the quantity of water applied and plant uptake, certain nutrients can leach to the groundwater. Nutrients, especially phosphorus, but also nitrogen, can cause eutrophication when discharged in surface water.
Salts Increased salinity influences crop water availability by affecting the osmotic pressure and soil infiltration rates, soil structure and soil permeability. Sodium can cause ion toxicity in plants and decrease soil permeability.
Suspended solids
High concentrations of suspended solids can increase clogging in a system or in plant soil.
Pathogens
Risk for disease transmission.
Certain ions While many ions are necessary to plant health, certain ions can become toxic to plants if concentrations are too high. Boron, chloride and sodium are common examples of this.
Greywater collection
The plumbing and water collection systems of a household will affect the greywater system choice. A household that uses indoor sewage plumbing will have different greywater collection possibilities in comparison to a household that disposes of wastewater with a bucket onto the streets or in open sewage channels. The bucket method, in which the user fills a bucket and transports it by hand to the greywater system, carries certain risks, as it increases the risk for contact and contamination between the greywater and people carrying the bucket (Center for the Study of the Built Environment, 2003). Since untreated greywater can contain pathogens, a system should always be designed so that there is minimal direct contact between the greywater and the system user.
If greywater is stored before it is treated, the organic matter in the greywater begins to be broken down by microorganisms, increasing their growth, and in turn leading to an anaerobic environment that generates unpleasant odors (Murphy, 2006; Center for the Study of the Built Environment, 2003). Greywater storage is therefore discouraged. If storage is necessary, it should be ventilated as this can alleviate odor problems (Center for the Study of the Built Environment, 2003). Most simple systems that are used at households in an urban
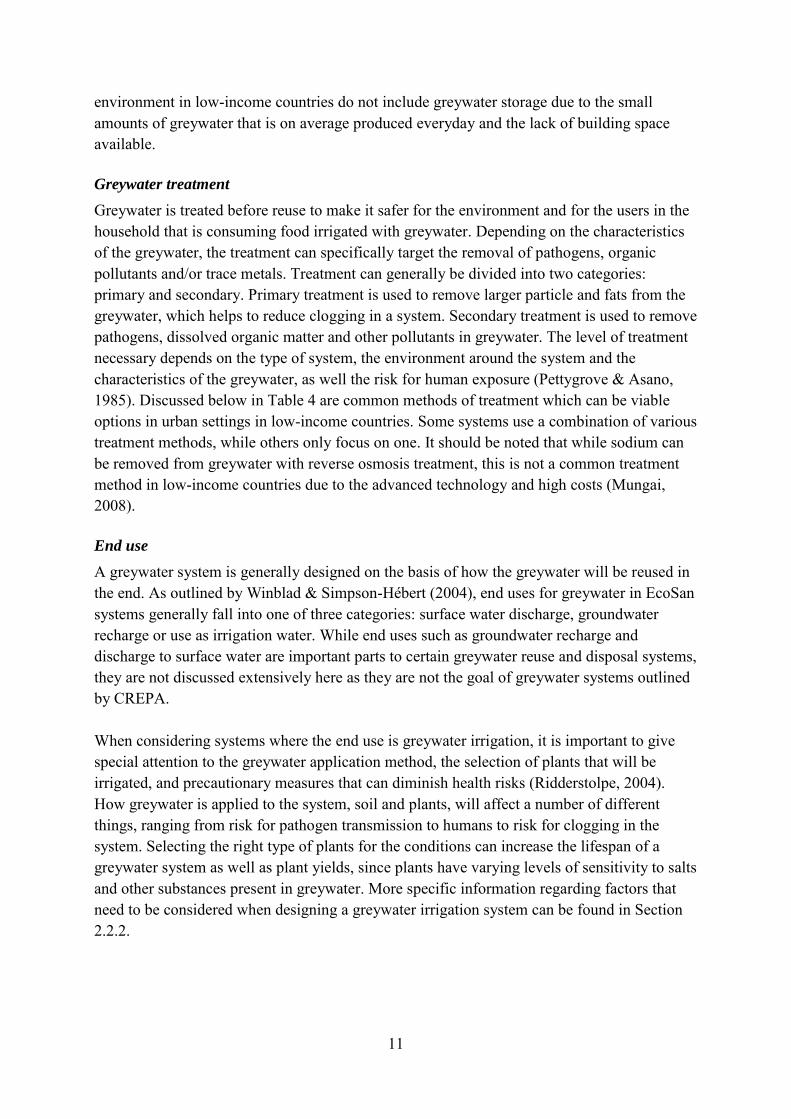
11
environment in low-income countries do not include greywater storage due to the small amounts of greywater that is on average produced everyday and the lack of building space available.
Greywater treatment
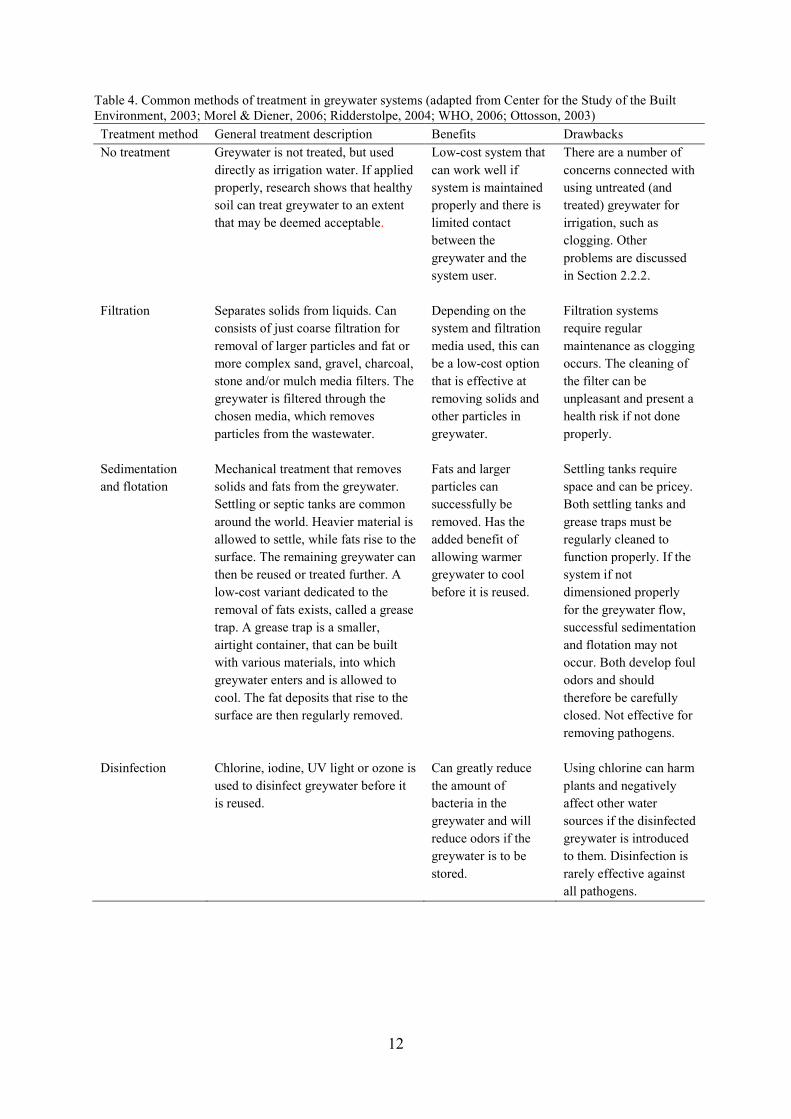
Greywater is treated before reuse to make it safer for the environment and for the users in the household that is consuming food irrigated with greywater. Depending on the characteristics of the greywater, the treatment can specifically target the removal of pathogens, organic pollutants and/or trace metals. Treatment can generally be divided into two categories: primary and secondary. Primary treatment is used to remove larger particle and fats from the greywater, which helps to reduce clogging in a system. Secondary treatment is used to remove pathogens, dissolved organic matter and other pollutants in greywater. The level of treatment necessary depends on the type of system, the environment around the system and the characteristics of the greywater, as well the risk for human exposure (Pettygrove & Asano, 1985). Discussed below in Table 4 are common methods of treatment which can be viable options in urban settings in low-income countries. Some systems use a combination of various treatment methods, while others only focus on one. It should be noted that while sodium can be removed from greywater with reverse osmosis treatment, this is not a common treatment method in low-income countries due to the advanced technology and high costs (Mungai, 2008).
End use
A greywater system is generally designed on the basis of how the greywater will be reused in the end. As outlined by Winblad & Simpson-Hébert (2004), end uses for greywater in EcoSan systems generally fall into one of three categories: surface water discharge, groundwater recharge or use as irrigation water. While end uses such as groundwater recharge and discharge to surface water are important parts to certain greywater reuse and disposal systems, they are not discussed extensively here as they are not the goal of greywater systems outlined by CREPA. When considering systems where the end use is greywater irrigation, it is important to give special attention to the greywater application method, the selection of plants that will be irrigated, and precautionary measures that can diminish health risks (Ridderstolpe, 2004). How greywater is applied to the system, soil and plants, will affect a number of different things, ranging from risk for pathogen transmission to humans to risk for clogging in the system. Selecting the right type of plants for the conditions can increase the lifespan of a greywater system as well as plant yields, since plants have varying levels of sensitivity to salts and other substances present in greywater. More specific information regarding factors that need to be considered when designing a greywater irrigation system can be found in Section 2.2.2.
12
Table 4. Common methods of treatment in greywater systems (adapted from Center for the Study of the Built Environment, 2003; Morel & Diener, 2006; Ridderstolpe, 2004; WHO, 2006; Ottosson, 2003) Treatment method General treatment description Benefits Drawbacks No treatment Greywater is not treated, but used
directly as irrigation water. If applied properly, research shows that healthy soil can treat greywater to an extent that may be deemed acceptable.
Low-cost system that can work well if system is maintained properly and there is limited contact between the greywater and the system user.
There are a number of concerns connected with using untreated (and treated) greywater for irrigation, such as clogging. Other problems are discussed in Section 2.2.2.
Filtration Separates solids from liquids. Can consists of just coarse filtration for removal of larger particles and fat or more complex sand, gravel, charcoal, stone and/or mulch media filters. The greywater is filtered through the chosen media, which removes particles from the wastewater.
Depending on the system and filtration media used, this can be a low-cost option that is effective at removing solids and other particles in greywater.
Filtration systems require regular maintenance as clogging occurs. The cleaning of the filter can be unpleasant and present a health risk if not done properly.
Sedimentation and flotation
Mechanical treatment that removes solids and fats from the greywater. Settling or septic tanks are common around the world. Heavier material is allowed to settle, while fats rise to the surface. The remaining greywater can then be reused or treated further. A low-cost variant dedicated to the removal of fats exists, called a grease trap. A grease trap is a smaller, airtight container, that can be built with various materials, into which greywater enters and is allowed to cool. The fat deposits that rise to the surface are then regularly removed.
Fats and larger particles can successfully be removed. Has the added benefit of allowing warmer greywater to cool before it is reused.
Settling tanks require space and can be pricey. Both settling tanks and grease traps must be regularly cleaned to function properly. If the system if not dimensioned properly for the greywater flow, successful sedimentation and flotation may not occur. Both develop foul odors and should therefore be carefully closed. Not effective for removing pathogens.
Disinfection Chlorine, iodine, UV light or ozone is used to disinfect greywater before it is reused.
Can greatly reduce the amount of bacteria in the greywater and will reduce odors if the greywater is to be stored.
Using chlorine can harm plants and negatively affect other water sources if the disinfected greywater is introduced to them. Disinfection is rarely effective against all pathogens.
13
System requirements
System requirements refer to a number of different components ranging from required user participation to costs and energy requirements for both the construction and maintenance of a system. An important part of designing a greywater system is being able to judge the level of engagement the user feels willing to give to the system. Certain systems require more extensive education and maintenance to keep working properly, which might not be plausible in all areas and with all households. Costs and socio-cultural factors will also affect a user‘s willingness and eagerness to operate and care for a system.
Maintaining a system is crucial not only for insuring that the intended lifespan of a system is achieved, but also system efficiency. The user of a system therefore needs to be educated in regards to several aspects of the system, including basic maintenance and monitoring. Knowledge on how improper operation of a system can be prevented is important in user education. Skills that are necessary must be included and targeted at those family members who will primarily use the system. Information regarding controlling greywater at its source, e.g. by affecting the amounts and types of chemicals used, should also be part of the system education, as this can positively affect the performance of the system and reduce concentrations of heavy metals, phosphorous, BOD and organic pollutants in the resulting greywater (Winblad & Simpson-Hébert, 2004; Ridderstolpe, 2004). System monitoring by the user should be encouraged, as signs such as clogging, smells, insect breeding or leakage can indicate problems with treatment or soil health.
Clogging and the growth of biofilms, due to sometimes high concentration of organic matter and microorganisms, is common in systems (NSW HEALTH, 2000), which can decrease treatment efficiency and drastically shorten system lifespan. In all greywater systems, there will be a buildup of an active biofilm of microorganisms on the surfaces. This biofilm slows down the movement of water and provides biological degradation of organic matter, which enhances the treatment efficiency (USEPA, 2006). If the system is overloaded continuously, an accumulation of organic matter and suspended solids will form in and around the biofilm. This accumulation is a result of insufficient anaerobic digestion of the organic matter and reduces the hydraulic conductivity of the system by clogging the pores, which further enhances the risk of overloading (USEPA, 2006; Eliasson, 2002). Constant overloading of a system can severely reduce the lifespan of a system. Proper dimensioning and design reduces the risk for water saturation and by that, anaerobic conditions, but it is also necessary to include proper maintenance and prevention instructions in the user education. This can further decrease the risk and effect of clogging and overloading. By eliminating the garbage, BOD and suspended solids in the greywater before it enters the soil, the risk for clogging can be minimized (USEPA, 2002; USEPA, 2006). If clogging occurs, the system needs to be allowed to rest, in order to aerate and restore hydraulic capacity. By this, 70-80 % of the infiltration capacity of the soil can recover. The resting time depends on the grain size and finer materials recover slower (USEPA, 2006). It is therefore important that users are educated properly, so that they can monitor for signs of clogging and act accordingly for their specific system.
14
Aside from user education and operation, costs are a major factor when considering a system. The equipment needed and the potential expenses must be weighed against the conditions in the area to determine system feasibility. The cost of a system and the amount of money that is available to build and maintain a system will ultimately decide what type of systems and the level of greywater treatment that can be implemented (Blumenthal et al., 2000).
2.2.2 Using greywater for irrigation In areas experiencing water shortage, wastewater is becoming an important water resource for irrigation (Blumenthal et al., 2000). Irrigating crops with greywater as part of a reuse and disposal system allows households the opportunity to grow plants during times when water is not readily available, leading to less water stress and increased food security. Greywater irrigation systems also reuse plant nutrients present in the greywater, which would otherwise be wasted (Ludwig, 2003; Madungwe & Sakuringwa, 2007; Mungai, 2008, Murphy, 2006).
Systems that include greywater irrigation often utilize the plants and soil to help to treat the greywater (Ludwig, 2003; Murphy, 2006). The soil is seen as a type of filter that can, in some cases, treat the greywater. Systems that incorporate soil filters are said to be efficient at removing suspended solids, organic material and nutrients, as well as pathogens from greywater (Winblad & Simpson-Hébert, 2004; Madungwe & Sakuringwa, 2007). In such systems, the soil affects the amount of water that can be applied and the level of treatment. Infiltration should not be too fast, as the contact time between the greywater and the soil can be too short to achieve sufficient treatment, and if infiltration is too slow, water puddles can form at the soil surface and the system becomes anaerobic. If the soil that is being irrigated with greywater is healthy and suitable, e.g. proper texture (not too course or too fine), biologically active, and unsaturated, then it can effectively treat greywater by filtration, adsorption, chemical reactions and microbial processes (Ludwig, 2003; Morel & Diener, 2006).
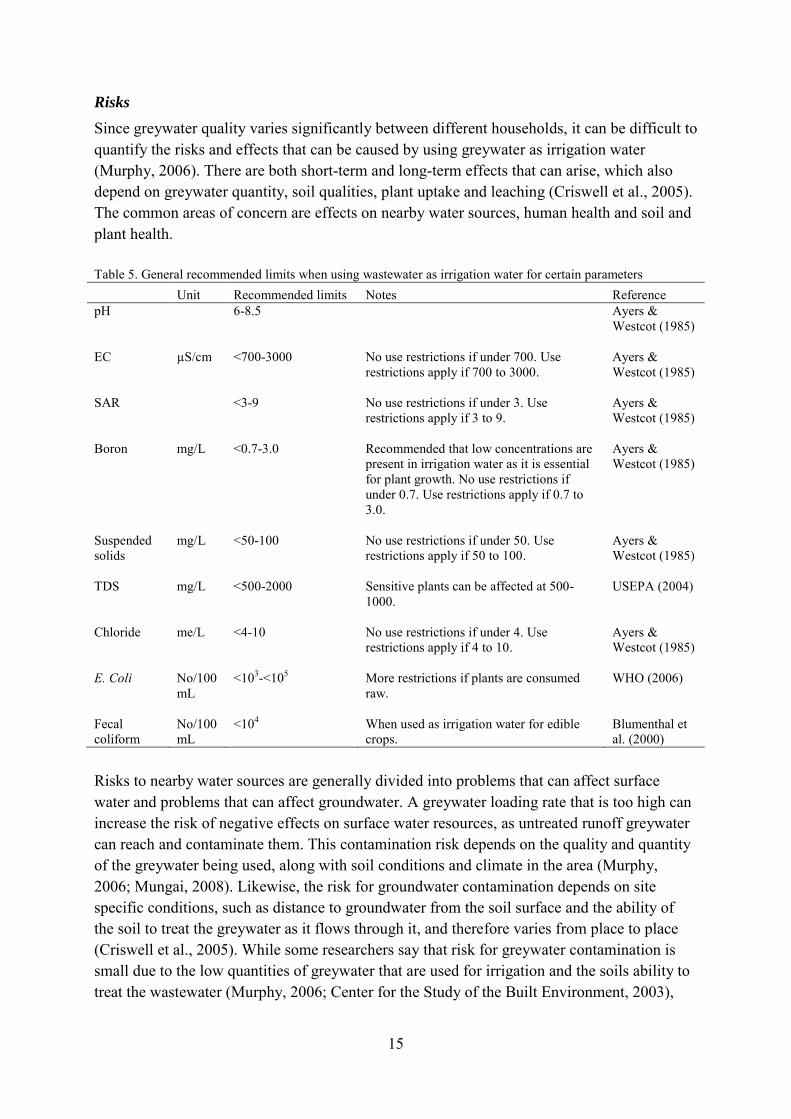
Greywater quality will largely determine if greywater irrigation is plausible and/or if greywater treatment is needed before being used as irrigation water. Listed below in Table 5 are the recommended limits for certain physiochemical and microbiological characteristics in wastewater that is to be used as irrigation water.
Depending on the given conditions, reusing greywater is not always a viable option. Untreated greywater that is reused can pose a public health risk, and can negatively affect plants, soil and existing groundwater and aquifers (Center for the Study of the Built Environment, 2003). Presented below are critical risks and problems that can commonly arise from greywater irrigation. Based on the possible problems that can arise, points that should be taken into consideration when using greywater irrigation are outlined below.
15
Risks
Since greywater quality varies significantly between different households, it can be difficult to quantify the risks and effects that can be caused by using greywater as irrigation water (Murphy, 2006). There are both short-term and long-term effects that can arise, which also depend on greywater quantity, soil qualities, plant uptake and leaching (Criswell et al., 2005). The common areas of concern are effects on nearby water sources, human health and soil and plant health. Table 5. General recommended limits when using wastewater as irrigation water for certain parameters Unit Recommended limits Notes Reference pH 6-8.5 Ayers &
Westcot (1985)
EC µS/cm <700-3000 No use restrictions if under 700. Use restrictions apply if 700 to 3000.
Ayers & Westcot (1985)
SAR <3-9 No use restrictions if under 3. Use restrictions apply if 3 to 9.
Ayers & Westcot (1985)
Boron mg/L <0.7-3.0 Recommended that low concentrations are present in irrigation water as it is essential for plant growth. No use restrictions if under 0.7. Use restrictions apply if 0.7 to 3.0.
Ayers & Westcot (1985)
Suspended solids
mg/L <50-100 No use restrictions if under 50. Use restrictions apply if 50 to 100.
Ayers & Westcot (1985)
TDS mg/L <500-2000 Sensitive plants can be affected at 500-1000.
USEPA (2004)
Chloride me/L <4-10 No use restrictions if under 4. Use restrictions apply if 4 to 10.
Ayers & Westcot (1985)
E. Coli No/100 mL
<103-<105 More restrictions if plants are consumed raw.
WHO (2006)
Fecal coliform
No/100mL
<104 When used as irrigation water for edible crops.
Blumenthal et al. (2000)
Risks to nearby water sources are generally divided into problems that can affect surface water and problems that can affect groundwater. A greywater loading rate that is too high can increase the risk of negative effects on surface water resources, as untreated runoff greywater can reach and contaminate them. This contamination risk depends on the quality and quantity of the greywater being used, along with soil conditions and climate in the area (Murphy, 2006; Mungai, 2008). Likewise, the risk for groundwater contamination depends on site specific conditions, such as distance to groundwater from the soil surface and the ability of the soil to treat the greywater as it flows through it, and therefore varies from place to place (Criswell et al., 2005). While some researchers say that risk for greywater contamination is small due to the low quantities of greywater that are used for irrigation and the soils ability to treat the wastewater (Murphy, 2006; Center for the Study of the Built Environment, 2003),

16
there are others that stress that the risks are not fully studied and understood yet (Gerba & Smith, 2005).
The largest risk to human health depends on pathogens concentrations in the greywater. The amount of different viruses, bacteria and protozoa in the water, the effectiveness of treatment and the level of contact between the system user and the contaminated water, soil and system all factor in as does the possible contamination of crops sold to consumers.
Good soil and plant health are crucial to both the proper system function and its lifespan. Soil that is irrigated with greywater can change due to the addition of chemicals, salts, nutrients and organic matter from the greywater. A change to the physical conditions of the soil may in turn cause effects on the microorganisms and chemistry in the soil (Roesner et al., 2006), both negatively and positively. Plants can show varying levels of damage, ranging from leaf burn to crop failure depending on chemicals, salts and trace metals in the greywater and their accumulation in the soil.
Reviewed below are the most common and critical problems that can arise as a result of greywater irrigation.
Salinity and sodicity One of the most critical problems that can arise, which can cause permanent damage to the soil if it is not managed, is the salinization of the soil. High concentrations of salts such as Na+, K+, Ca2+, Mg2+ and Cl- can diminish soil health, or decrease plant growth and yields as a result of specific ion toxicity and osmotic effects (USEPA, 2004; Pettygrove & Asano, 1985). An accumulation of salt in soils occurs when the concentration of salts being applied to the soil via greywater irrigation is higher than the amount of salts leaving or being leached out of the soil (Pettygrove & Asano, 1985). A breakdown of soil salinity classification based on measured electrical conductivity (EC) is presented in Table 6.
Problems with salt accumulation in soil can be worse in warmer climates, where increased water needs in combination with high evapotranspiration rates are common. Studies have found salt accumulation in soils that have been irrigated with greywater for several decades. Mungai (2008) measured a soil salt accumulation in greywater irrigated plots in Kenya that was 569% higher than control plots. An accumulation of salts can result in a decrease in the soil‘s capability to absorb and hold water (Center for the Study of the Built Environment, 2003; Murphy, 2006; Mungai, 2008).
High concentrations of Na+ ions in greywater can lead to sodicity in soils. While saline soils are defined as having an EC > 4000 µS/cm, sodium absorption rate (SAR) < 13 and pH > 8.5, sodic soils have an EC < 4000 µS/cm and a SAR > 13 and pH < 8.5 (Brady & Weil, 1996). Sodic soils are generally of poorer quality. When there are high concentrations of sodium in a soil, the negatively charged clay colloids swell and disperse. This in turn breaks up soil aggregates and the resulting particles clog pores in the soil, which results in a hardened soil surface and decreased soil infiltration (Brady & Weil, 1996; Ayers & Westcot, 1985; Toze, 2006a; Mungai, 2008; Barker-Reid et al., 2009).
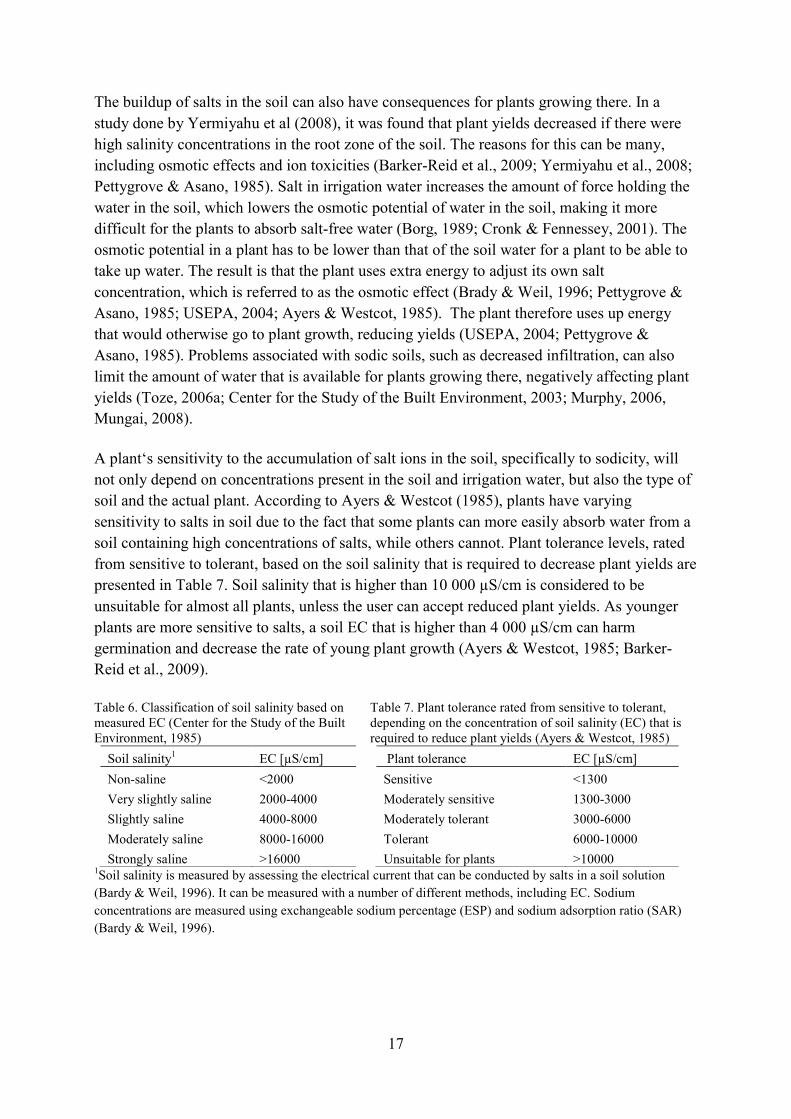
17
The buildup of salts in the soil can also have consequences for plants growing there. In a study done by Yermiyahu et al (2008), it was found that plant yields decreased if there were high salinity concentrations in the root zone of the soil. The reasons for this can be many, including osmotic effects and ion toxicities (Barker-Reid et al., 2009; Yermiyahu et al., 2008; Pettygrove & Asano, 1985). Salt in irrigation water increases the amount of force holding the water in the soil, which lowers the osmotic potential of water in the soil, making it more difficult for the plants to absorb salt-free water (Borg, 1989; Cronk & Fennessey, 2001). The osmotic potential in a plant has to be lower than that of the soil water for a plant to be able to take up water. The result is that the plant uses extra energy to adjust its own salt concentration, which is referred to as the osmotic effect (Brady & Weil, 1996; Pettygrove & Asano, 1985; USEPA, 2004; Ayers & Westcot, 1985). The plant therefore uses up energy that would otherwise go to plant growth, reducing yields (USEPA, 2004; Pettygrove & Asano, 1985). Problems associated with sodic soils, such as decreased infiltration, can also limit the amount of water that is available for plants growing there, negatively affecting plant yields (Toze, 2006a; Center for the Study of the Built Environment, 2003; Murphy, 2006, Mungai, 2008).
A plant‘s sensitivity to the accumulation of salt ions in the soil, specifically to sodicity, will not only depend on concentrations present in the soil and irrigation water, but also the type of soil and the actual plant. According to Ayers & Westcot (1985), plants have varying sensitivity to salts in soil due to the fact that some plants can more easily absorb water from a soil containing high concentrations of salts, while others cannot. Plant tolerance levels, rated from sensitive to tolerant, based on the soil salinity that is required to decrease plant yields are presented in Table 7. Soil salinity that is higher than 10 000 µS/cm is considered to be unsuitable for almost all plants, unless the user can accept reduced plant yields. As younger plants are more sensitive to salts, a soil EC that is higher than 4 000 µS/cm can harm germination and decrease the rate of young plant growth (Ayers & Westcot, 1985; Barker-Reid et al., 2009).
Table 6. Classification of soil salinity based on measured EC (Center for the Study of the Built Environment, 1985)
Soil salinity1 EC [µS/cm] Non-saline <2000 Very slightly saline 2000-4000 Slightly saline 4000-8000 Moderately saline 8000-16000 Strongly saline >16000
Table 7. Plant tolerance rated from sensitive to tolerant, depending on the concentration of soil salinity (EC) that is required to reduce plant yields (Ayers & Westcot, 1985)
Plant tolerance EC [µS/cm] Sensitive <1300 Moderately sensitive 1300-3000 Moderately tolerant 3000-6000 Tolerant 6000-10000 Unsuitable for plants >10000
1Soil salinity is measured by assessing the electrical current that can be conducted by salts in a soil solution (Bardy & Weil, 1996). It can be measured with a number of different methods, including EC. Sodium concentrations are measured using exchangeable sodium percentage (ESP) and sodium adsorption ratio (SAR) (Bardy & Weil, 1996).

18
While poor plant growth and damage to the plant leaves are common side effects of high salinity in irrigation water and soil, these side effects are often only visible after a longer period of exposure (Ayers & Westcot, 1985). The effects to plants that can occur as a result of sodium ion toxicity are discussed below.
Ion toxicity Ions that are commonly mentioned when discussing the risk for ion toxicity are chloride, boron and sodium, which most often are present in greywater due to the choice of household detergents (Pettygrove & Asano, 1985). Ion toxicity occurs when these ions are absorbed by plants as they take up water from the soil and accumulate in high enough concentrations in the leaves of the plants to cause negative side effects (Ayers & Westcot, 1985). Plant yields can decrease as a result of ion toxicity, but the level of harm caused depends on the sensitivity of the plant, the irrigation water quality and quantity and time. Chloride is not absorbed in soil and can therefore easily be accumulated in a plant. Common symptoms of chloride ion toxicity include various types of leaf damage, such as leaf burn, which often start at the leaf tip (Ayers & Westcot, 1985). While chloride ion toxicity is not a problem with vegetables and grain plants, it can cause problems for stone and citrus fruits (Pettygrove & Asano, 1985). While boron is essential for plant growth, it becomes toxic at concentrations just a little higher than those that are required. For example, 0.2 mg boron per liter irrigation water is often required for good plant growth while 1 to 2 mg boron per liter can cause negative effects (Ayers & Westcot, 1985). The amount of boron that can be absorbed by plants varies and is dependent on soil pH, with maximum uptake at pH 9 (Rowe & Abdel-Magid, 1995). High concentrations of boron in the root zone of the soil can reduce plant yields since an accumulation of boron in plants inhibits plant growth, as well as causing other symptoms such as premature leaf drop, leaf burn and branch dieback (Yermiyahu et al., 2008; Pettygrove & Asano, 1985; Ayers & Westcot, 1985). Yermiyahu et al (2008) found that while damage due to high concentrations of boron was not visible in short-term experiments, it was in the longer experiments. Boron accumulation and problems associated with it may take awhile to appear in a system. Common symptoms of sodium ion toxicity are various forms of leaf damage along the edges of the leaf (Ayers & Westcot, 1985).
Pathogens The transmission route for most pathogens is fecal to oral. Fecal matter that has made its way into the greywater, can reach humans again through direct contact with the greywater, by contact with parts of a system that have had contact with the greywater (e.g. the soil) or by consuming plants that have been in contact with the greywater. The risk for contamination depends on a number of factors: the concentration of pathogens in the influent greywater, the level of treatment that the greywater receives and the handling of the greywater and the plants that are irrigated with it (Blumenthal et al., 2000; Toze, 2006a; Casanova et al., 2001a; Finley et al., 2009). Generally fecal coliform, fecal streptococci and Escherichia coli are used as
19
indicator organisms to determine the concentration of pathogens in greywater and in soil watered with greywater. As discussed in Section 2.1.1, and like reports by Roesner et al. (2006), Finley et al (2008),Winblad & Simpson-Hérbert (2004) and Roesner et al. (2006) indicate, more information regarding the best suited indicator organism for pathogen detection in greywater, as well as guidelines, is needed before the real risks of greywater irrigation to human health can be quantified. Therefore, WHO (2006) promotes a risk assessment methodology instead.
Casanova et al. (2001a) found significant increases in fecal coliform concentrations in soils that had been irrigated with greywater compared to those irrigated with freshwater. The amount of pathogens in the soil depends on the amount in the greywater that is used for irrigation, the amount of greywater that is applied to the soil, and the survival rate of the pathogens once they are there. Casanova et al. (2001a) also found varying concentrations of fecal coliform in the soil depending on the time of year, which may be an indication of the effect of weather on pathogens survival in soil. Pathogens have varying survival rates in soil, ranging from days to a year for bacteria, from days to months for viruses, and up to 10 days for protozoa (Rowe & Abdel-Magid, 1995; Gerba & Smith, 2005). Their survival depends on the pathogen in question as well as a number of different soil characteristics, such as organic matter, soil texture, pH, permeability, soil moisture, the amount of other microorganisms present, temperature and cation-exchange capacity (Keswick & Gerba, 1980; Rowe & Abdel-Magid, 1995).
The potential effects on plants are important due to the fact that it is these irrigated plants that are to be consumed by the household. The type of vegetable, e.g. root vegetable, leafy vegetable, vegetable with close soil contact, vegetables with limited soil contact, will influence the resulting pathogen contact between them and the greywater, as indicated by a study done by Finley et al. (2009). Direct contact with greywater and plants should always be avoided. Pathogens have varying maximum survival rates on plants, ranging from six months for bacteria, to two months for viruses and up five days for protozoa (Gerba & Smith, 2005). Pathogen survival on plants depends on irrigation application method, the type of plants and the amount of contact between plants and soil (Rowe & Abdel-Magid, 1995). The surface of the plant, e.g. hairy or textured, will also affect pathogen survival and the risk for transmissions due to the fact that the pathogens can hide in the texture on the plant, which protects them (WHO, 2006). While the survival of pathogens on plants and in soil varies, it is affected by common factors. Sunlight and dry heat are known to shorten the survival of pathogens on plants and in soils (NSW HEALTH, 2000).
If there is a large concentration of pathogens in the greywater and they are not removed by treatment or filtration in the soil, there is a risk that surface water and aquifers may become contaminated (Murphy, 2006; Roesner et al., 2006). Groundwater contamination, as noted above, is influenced by the quantity of greywater that is applied to the soil and the distance to the groundwater (Criswell et al., 2005), as well as the pathogen‘s rate of survival in the soil.
20
pH Soil pH affects soil characteristics such as plant nutrient availability and soil bacteria health. The effects that arise as a result of irrigating with greywater depend on the pH of the greywater, as well as the pH and buffering capacity of the soil (Criswell et al., 2005). Since soil is generally buffered against pH, it can take awhile before the pH in irrigation water will affect the soil. The sensitivity of plants to pH changes in soil varies. Plant nutrients, such as nitrates and phosphates, are most readily accessible when the soil pH is around 5.5 to 6.5 (Center for the Study of the Built Environment, 2003). When pH is less than 5, soil bacteria also become more inactive and aluminum becomes more mobile in the soil, which can cause aluminum toxicity (Brady & Weil, 1996). Alkaline soils, e.g. soils with pH greater than 7, can be caused by high concentrations of sodium, potassium or calcium salts in irrigation water (Center for the Study of the Built Environment, 2003), which often come from detergents used by the households. When the soil pH becomes greater than 8, necessary plant minerals such as iron become inaccessible to the plants. In such alkaline soil it is common that symptoms due to too much sodium and boron toxicity began to appear (Center for the Study of the Built Environment, 2003). Abnormal pH values may indicate that ion toxicity problems, or a nutritional imbalance, are present in the soil (Ayers & Westcot, 1985).
Miscellaneous Large greywater quantities applied to the soil, in combination with evaporation, can cause a buildup of chemicals in the soil and on crops (USEPA, 2004). This accumulation depends on degradation rate of the chemicals, interactions with soil particles, as well as the amount that is taken up by plants and the amount that is leached (Roesner et al., 2006; Criswell et al., 2005).
Trace elements supplied in amounts that exceed the uptake of the plants growing there will leach or accumulate, which can in the long-term contaminate the soil. According to Ayers & Westcot (1985), it is common that 85% of trace elements, including but not limited to arsenic, aluminum, cadmium, iron and copper, that enter the soil from irrigation water accumulate there, often near the surface. Since heavy metals do not degrade, there is an increased risk that they will accumulate in the soil (Toze, 2006a; Criswell et al., 2005). Accumulation of certain elements in the soil can lead to accumulation in plants. There is also a risk that they can be leached and transported to groundwater (Pettygrove & Asano, 1985).
The addition of nutrients by greywater irrigation can be both beneficial and harmful, depending on the total dose applied. If nitrogen and phosphorus are the limiting growth factors in a soil, then the addition of them from greywater can increase growth (Roesner et al., 2006; Toze, 2006a). Excess nitrogen can on the other hand negatively affect plant yields and quality (USEPA, 2004; Ayers & Westcot, 1985). Plant sensitivity to nutrients varies and depends on the growth stage of the plant. Nutrients and organic matter may cause problems over the long-term if they build up in the soil and cause clogging (Roesner et al., 2006; USEPA, 2004).
21
Reducing Risks
In order to reduce the environmental and health risks discussed above, a number of different steps can be taken when implementing a greywater disposal and reuse system. Many problems that can occur as a result of greywater irrigation are due to the quality of the greywater being used. Educating households and helping them improve their chemicals and detergent usage patterns can greatly improve greywater quality, and in this way, diminish the risk for these problems (Criswell et al., 2005; Barker-Reid et al., 2009; Ludwig, 2003; Madungwe & Sakuringwa, 2007). This is not always plausible in all situations and/or areas, but should be taken into consideration.
It is recommended by Murphy (2006) that greywater from households with children, due to the increased risk of feces in the resulting greywater, should not be used for irrigation. This advice is not easy to follow, or even good advice, in many low-income countries where most households have children, and the greywater, if not used, will often be disposed of on open ground, which increases risks for contamination to both humans and the environment. Instead, a system that minimizes contact between the users and the greywater should be used (Center for the Study of the Built Environment, 2003). This requires proper irrigation techniques and greywater application methods to minimize human contact with contaminated water.
It is also important to build a system that can handle the quantities of greywater that are produced and applied to the system so as to avoid standing water and the problems that can be caused by it, which were discussed in Section 1 (Center for the Study of the Built Environment, 2003; Ludwig, 2004, Murphy, 2006).
The effect of greywater on soil greatly depends on the soil (Criswell et al., 2005). The soil should have the right texture, not too coarse, or the water will run through too fast, and not to fine, or the soil might not receive enough aeration. There is little scientific research done on the health of soil due to greywater irrigation over a long period of time (Roesner et al., 2006), but greywater irrigation should not be limited to one small area as this can lead to an accumulation of damaging chemicals and salts in this area (Center for the Study of the Built Environment, 2003). The problem with the buildup of salts in soil irrigated with greywater is especially difficult in developing countries, where the money and technology for techniques required to remove salts from greywater does not exist and very little relevant research is available for the prevalent conditions (Mungai, 2008; Ayers & Westcot, 1985).
Some negative effects of greywater irrigation, such as the accumulation of salts and other pollutants, can be offset by leaching (Barker-Reid et al., 2009; Murphy, 2006, Ludwig, 2003; Center for the Study of the Built Environment, 2003; Mungai, 2008; Ayers & Westcot, 1985). While salts are water soluble and can be effectively leached from the plant root zone, other ions can be more difficult. Boron, for example, generally requires three times more water to leach when compared to sodium and chloride (Ayers & Westcot, 1985). Since leaching should never be done to the extent that soil aeration is negatively affected, it may be more advantageous in such cases to control the amounts of boron entering the greywater at its source, e.g. choice of detergents.
22
Leaching salts from soil is only required if the irrigation water has high concentrations of salts and the plants that are being irrigated are salt sensitive and showing signs of damage. The amount of leaching required can be calculated based on the salinity of the irrigation water and the amount of salinity in the soil that the irrigated crop can endure before crop yields are reduced (Ayers & Westcot, 1985). Leaching may occur naturally in the soil every year if crop water demand is less than the sum of rain and irrigations water during the rainy season (Roesner et al., 2006; Ayers & Westcot, 1985). Salts and other chemicals that are leached out can with time reach other water sources (Murphy, 2006), which should be taken into consideration and investigated. If leaching is to be done, it is necessary that the distance from the ground to the water table is known. If the water table rises, due to excess leaching water, and enters the root zone of the plant, the ground water can increase the concentrations of salts if it contains salts (USEPA, 2004; Ayers & Westcot, 1985).
Another way of counteracting the negative effects caused by high concentrations of sodium is by adding organic matter or gypsum to the soil (Mungai, 2008; Ayers & Westcot, 1985). Organic matter such as mulch can improve the infiltration rate of a soil, and counteract the negative effects that are caused by irrigating with water with high concentrations of SAR. Mulch does need to be replenished every year to be effective (Ayers & Westcot, 1985). Soil dispersion caused by high sodium concentrations occur when the sodium to calcium ratio is higher than three to one. Negative effects to soil structure and infiltration caused by sodium can therefore be offset by adding calcium in the form of gypsum or lime (USEPA, 2004; Ayers & Westcot, 1985; Pettygrove & Asano, 1985). Lime can be used to increase low soil pH (Ayers & Westcot, 1985; Brady & Weil, 1996).
While leaching and the addition of organic matter and/or gypsum can decrease the risk of negative effects of salts, the plants that are chosen for use in a system are also an important factor to consider, as proper plant selection will help achieve the best success rate for a system under the given conditions (Ayers & Westcot, 1985; Criswell et al., 2005; Madungwe & Sakuringwa, 2007). For example, salt sensitive plant should be avoided if the irrigation water is known to have high EC. Plant with that are tolerant to moderately sensitive to soil salinity, such as cabbage, squash, ground nuts, spinach and tomatoes, should be used instead of sensitive plants like carrots, onions, okra, beans, mango and lemon trees (USEPA, 2004; Murphy, 2006).
Improper irrigation application techniques, where plants come in direct contact with greywater containing salts and chemicals, can cause further harm to plants such as leaf burning or ion accumulation (Barker-Reid et al., 2009; USEPA, 2004). Whatever types of plants or irrigation techniques that are chosen, the user should refrain from irrigating plants only with greywater (Center for the Study of the Built Environment, 2003). The USEPA, in their 2004 Guidelines for Irrigation with Wastewater, note that even low concentrations of salt and chemicals in wastewater irrigation water can harm young plants, and should therefore be avoided until the plants have matured. Also, due to the risk for buildup of chemicals in the soil, plants in confined pots should not be watered with greywater (Center for the Study of the Built Environment, 2003). Crops that are watered with greywater must be examined regularly for signs of damage so that greywater irrigation can be stopped or decreased (Murphy, 2006).
23
Murphy (2006) also advise that households be educated in irrigation management, including information of soil and plant types that work with greywater irrigation, before using such a system. While there are no known cases of harm to human health due to reuse of greywater (Center for the Study of the Built Environment, 2003), certain precautionary measures are necessary to help reduce health risks to people in a household where greywater is used to irrigate vegetables and fruits. Animals and children should be kept away from the greywater and contact between them and the system should be minimal. Direct contact between the greywater and plants (splashing or spraying) should be avoided, especially to parts of the plants that will be consumed (Barker-Reid et al., 2009; Murphy, 2006; Ludwig, 2003; Center for the Study of the Built Environment, 2003), as this is also one potential transmission route for pathogens to humans. The Center for the Study of the Built Environment (2003) recommends that plants that have edible parts below the ground should not be used in greywater systems. Health risks can be greatly reduced when harvesting food by washing, disinfecting, peeling and cooking vegetables and fruits before consuming them (Ludwig, 2003; Murphy, 2006; Center for the Study of the Built Environment, 2003; Barker-Reid et al., 2009). Plants should, if possible, not be irrigated with greywater directly before they are to be harvested and consumed. Barker-Reid et al (2009) recommends a several day time period between irrigation with greywater and consuming the crops.
2.2.3 Small-scale greywater systems A variety of small-scale systems are used for greywater management in different parts of the world. The systems included in this section are low-cost systems that have been used and tested in low and middle-income countries.
Leach pit
A leach pit is a pit with open walls that allows infiltration of the disposed water into the ground, as shown in Figure 3 (UNEP, 2002a). It can be filled with stones or gravel, thought this is not required. A stone filled pit has a larger percolation area, which can be desirable when the permeability in the surrounding soil is low. The walls closest to the ground are reinforced and the pit is sealed with a lid. As with any other system, the pit has to be dimensioned so that it can receive all produced wastewater, which is why sizes vary greatly depending on household practices. While leach pits work well in soils with high permeability, they are not recommended if the permeability of the surrounding soil is too low (UNEP, 2002a). The treatment in leach pits is considered to be natural purification in the soil as wastewater flows, before it finally recharges the groundwater aquifer. It is therefore important that the vertical distance between the bottom of the leach pit and the groundwater is large enough. Leach pits are generally not recommended nowadays, due to their high hydraulic loads and the often insufficient vertical distance to the groundwater.

24
Figure 3. A leach pit (author‘s figure).
Sand filter
In most sand filters, the water flows vertically due to gravitation through a container filled with sand. Application can be made manually or by using a pump. Depending on the grain size, the water flows rapidly (rapid sand filtration) or slowly (slow sand filtration) through the system. Slow sand filters uses filter material with a grain size of 0.15 to 0.35 mm and are used as a secondary treatment to reduce pathogen concentrations, while rapid sand filters usually use filter material with a grain size of 0.4 to 12.0 mm and are used as primary treatment (Rowe & Abdel-Magid, 1995). Regardless the type of sand filter, the filtering efficiency of the system decreases with time because of collection of particles in the void space (gradual clogging) and the growth of biofilm of the grains (Rowe & Abdel-Magid, 1995). As a result of clogging, water has to be applied with increased pressure to retain the initial filtration rate. If increased pressure cannot be accomplished, the filtration rate is reduced and the system eventually has to be cleaned.
Mulch bed
Mulch beds are among the simplest greywater reuse systems (Morel & Diener, 2006). An irrigation trench is dug around a tree or in rows along a bush or crop field and filled with mulch (Figure 4) (Ridderstolpe, 2004; Morel & Diener, 2006). Greywater is applied directly onto the mulch. According to Ridderstolpe (2004) this can be done without any pretreatment, while Morel & Diener (2006) suggests that the greywater should undergo primary treatment before application.
Inlet Solid wall
Open wall
Infiltration
Infiltration Infiltration
Minimum distance of 1-2 m between bottom of leach pit and ground water
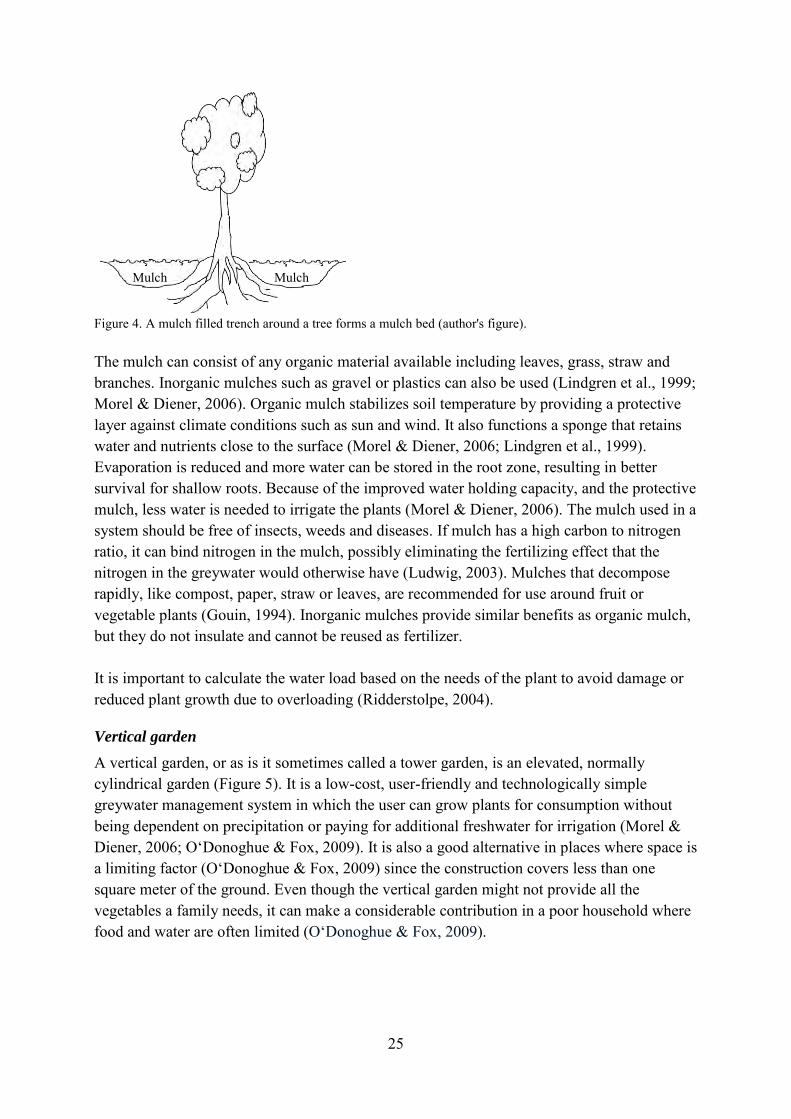
25
Figure 4. A mulch filled trench around a tree forms a mulch bed (author's figure). The mulch can consist of any organic material available including leaves, grass, straw and branches. Inorganic mulches such as gravel or plastics can also be used (Lindgren et al., 1999; Morel & Diener, 2006). Organic mulch stabilizes soil temperature by providing a protective layer against climate conditions such as sun and wind. It also functions a sponge that retains water and nutrients close to the surface (Morel & Diener, 2006; Lindgren et al., 1999). Evaporation is reduced and more water can be stored in the root zone, resulting in better survival for shallow roots. Because of the improved water holding capacity, and the protective mulch, less water is needed to irrigate the plants (Morel & Diener, 2006). The mulch used in a system should be free of insects, weeds and diseases. If mulch has a high carbon to nitrogen ratio, it can bind nitrogen in the mulch, possibly eliminating the fertilizing effect that the nitrogen in the greywater would otherwise have (Ludwig, 2003). Mulches that decompose rapidly, like compost, paper, straw or leaves, are recommended for use around fruit or vegetable plants (Gouin, 1994). Inorganic mulches provide similar benefits as organic mulch, but they do not insulate and cannot be reused as fertilizer. It is important to calculate the water load based on the needs of the plant to avoid damage or reduced plant growth due to overloading (Ridderstolpe, 2004).
Vertical garden
A vertical garden, or as is it sometimes called a tower garden, is an elevated, normally cylindrical garden (Figure 5). It is a low-cost, user-friendly and technologically simple greywater management system in which the user can grow plants for consumption without being dependent on precipitation or paying for additional freshwater for irrigation (Morel & Diener, 2006; O‘Donoghue & Fox, 2009). It is also a good alternative in places where space is a limiting factor (O‘Donoghue & Fox, 2009) since the construction covers less than one square meter of the ground. Even though the vertical garden might not provide all the vegetables a family needs, it can make a considerable contribution in a poor household where food and water are often limited (O‘Donoghue & Fox, 2009).
Mulch Mulch
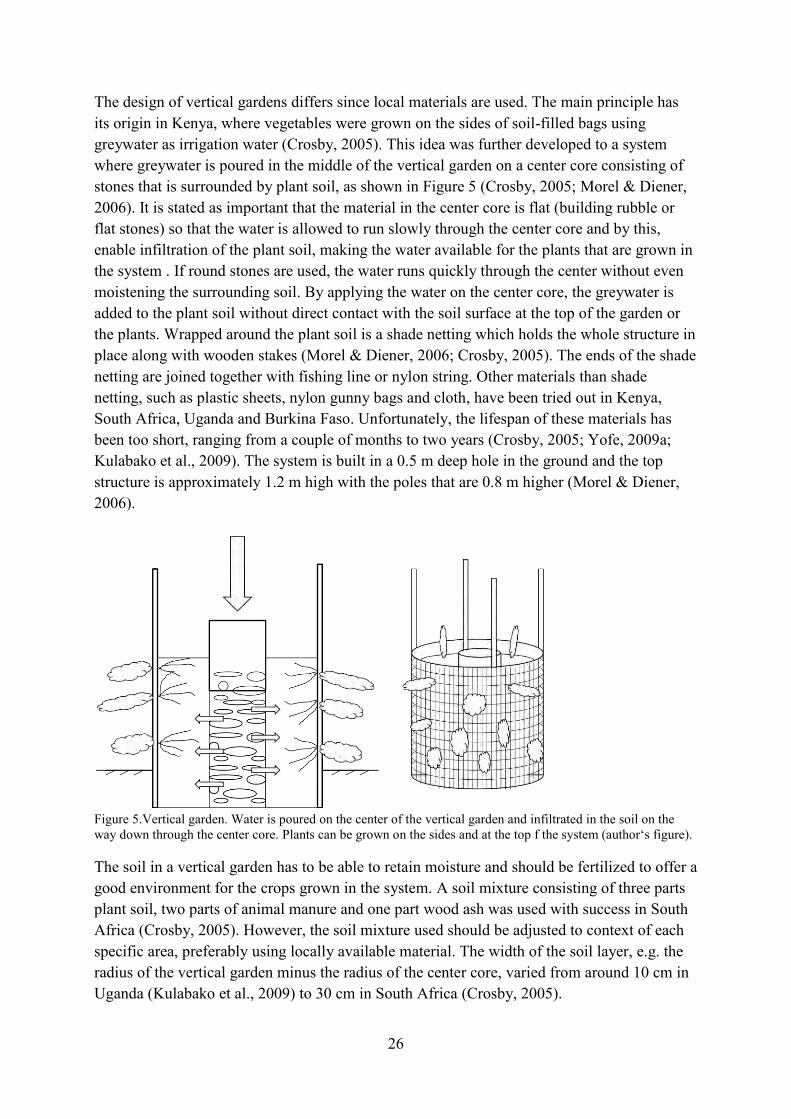
26
The design of vertical gardens differs since local materials are used. The main principle has its origin in Kenya, where vegetables were grown on the sides of soil-filled bags using greywater as irrigation water (Crosby, 2005). This idea was further developed to a system where greywater is poured in the middle of the vertical garden on a center core consisting of stones that is surrounded by plant soil, as shown in Figure 5 (Crosby, 2005; Morel & Diener, 2006). It is stated as important that the material in the center core is flat (building rubble or flat stones) so that the water is allowed to run slowly through the center core and by this, enable infiltration of the plant soil, making the water available for the plants that are grown in the system . If round stones are used, the water runs quickly through the center without even moistening the surrounding soil. By applying the water on the center core, the greywater is added to the plant soil without direct contact with the soil surface at the top of the garden or the plants. Wrapped around the plant soil is a shade netting which holds the whole structure in place along with wooden stakes (Morel & Diener, 2006; Crosby, 2005). The ends of the shade netting are joined together with fishing line or nylon string. Other materials than shade netting, such as plastic sheets, nylon gunny bags and cloth, have been tried out in Kenya, South Africa, Uganda and Burkina Faso. Unfortunately, the lifespan of these materials has been too short, ranging from a couple of months to two years (Crosby, 2005; Yofe, 2009a; Kulabako et al., 2009). The system is built in a 0.5 m deep hole in the ground and the top structure is approximately 1.2 m high with the poles that are 0.8 m higher (Morel & Diener, 2006).
Figure 5.Vertical garden. Water is poured on the center of the vertical garden and infiltrated in the soil on the way down through the center core. Plants can be grown on the sides and at the top f the system (author‘s figure). The soil in a vertical garden has to be able to retain moisture and should be fertilized to offer a good environment for the crops grown in the system. A soil mixture consisting of three parts plant soil, two parts of animal manure and one part wood ash was used with success in South Africa (Crosby, 2005). However, the soil mixture used should be adjusted to context of each specific area, preferably using locally available material. The width of the soil layer, e.g. the radius of the vertical garden minus the radius of the center core, varied from around 10 cm in Uganda (Kulabako et al., 2009) to 30 cm in South Africa (Crosby, 2005).
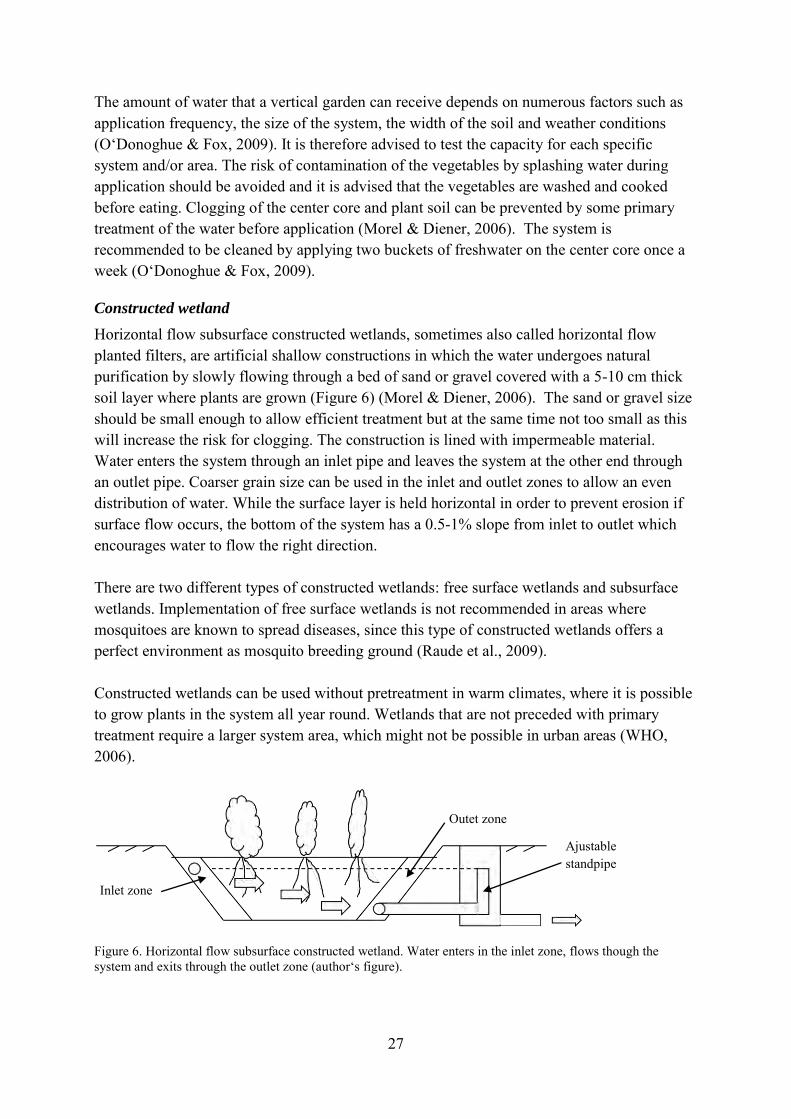
27
The amount of water that a vertical garden can receive depends on numerous factors such as application frequency, the size of the system, the width of the soil and weather conditions (O‘Donoghue & Fox, 2009). It is therefore advised to test the capacity for each specific system and/or area. The risk of contamination of the vegetables by splashing water during application should be avoided and it is advised that the vegetables are washed and cooked before eating. Clogging of the center core and plant soil can be prevented by some primary treatment of the water before application (Morel & Diener, 2006). The system is recommended to be cleaned by applying two buckets of freshwater on the center core once a week (O‘Donoghue & Fox, 2009).
Constructed wetland
Horizontal flow subsurface constructed wetlands, sometimes also called horizontal flow planted filters, are artificial shallow constructions in which the water undergoes natural purification by slowly flowing through a bed of sand or gravel covered with a 5-10 cm thick soil layer where plants are grown (Figure 6) (Morel & Diener, 2006). The sand or gravel size should be small enough to allow efficient treatment but at the same time not too small as this will increase the risk for clogging. The construction is lined with impermeable material. Water enters the system through an inlet pipe and leaves the system at the other end through an outlet pipe. Coarser grain size can be used in the inlet and outlet zones to allow an even distribution of water. While the surface layer is held horizontal in order to prevent erosion if surface flow occurs, the bottom of the system has a 0.5-1% slope from inlet to outlet which encourages water to flow the right direction. There are two different types of constructed wetlands: free surface wetlands and subsurface wetlands. Implementation of free surface wetlands is not recommended in areas where mosquitoes are known to spread diseases, since this type of constructed wetlands offers a perfect environment as mosquito breeding ground (Raude et al., 2009). Constructed wetlands can be used without pretreatment in warm climates, where it is possible to grow plants in the system all year round. Wetlands that are not preceded with primary treatment require a larger system area, which might not be possible in urban areas (WHO, 2006).
Figure 6. Horizontal flow subsurface constructed wetland. Water enters in the inlet zone, flows though the system and exits through the outlet zone (author‘s figure).
Inlet zone
Outet zone
Ajustable standpipe
28
2.2.4 Assessment of a greywater system An overall system assessment, with focus on technical factors, the soil and plant health in the system, and system requirements, is done to evaluate an implemented system. Other important characteristics which ought to be included are health risks, as well as a variety of environmental, socio-cultural and economical aspects (WHO, 2006). When the function of a system is evaluated, technical factors are important to document, as they often describe how the system is working. The treatment method should be studied and considered in comparison to problems that are documented to help determine if changes might be needed (USEPA, 2004). For example if there is a lot of clogging in the system, and no primary treatment for removing fats and oils or food residues, then introducing a pretreatment, such as coarse filtration should be considered. Treatment efficiency should be determined, to see if it is as high as expected (WHO, 2006). If it has decreased with time, certain maintenance measures might need to be taken. Other factors such as the water application method are also examined, as improper application can increase the risk for pathogen transmission between the system and user, as well as lead to problems with clogging (WHO, 2006). Factors that are required for a system to work properly should also be assessed (WHO, 2006). User behavior, such as what types of maintenance performed, should be documented to compare with what types of maintenance that normally needs to be done. If problems such as clogging are occurring, the required amount of maintenance per year should be determined so that the user knows how much work is necessary to keep the system running at the highest treatment efficiency. The dimensions of the system in comparison to the quantities of greywater that are being applied should also be noted, and compared with any signs of overloading as this could indicate that the system is not dimensioned properly (Ridderstolpe, 2004). Risks and hazards as a result of system use should be identified (WHO, 2006). The system should be modified to avoid observed risks or precautionary actions that are needed to prevent them should be included in the user education programs of future system (USEPA, 2004). The soil and plant health of the system should be tested. Soil salinity should be tested as an increase in soil salinity and the resulting problems are considered to be one of the greatest risks of greywater irrigation (Pettygrove & Asano, 1985). Plants, and possibly plant yields, should be inspected for signs of damage that may indicate soil problems such as ion toxicity. The health risks resulting from system use are important to evaluate. The level of pathogen treatment in the system should be evaluated, as well as possible pathogen transmissions pathways resulting from system use. Health risks can often be compared to the total risk from all exposures in the same area in order to give perspective. The level of tolerable risk to human health in the end must be decided by local officials (WHO, 2006). Nevertheless, systems should not drastically increase the risk for pathogen transmission.

29
The amount of damage to the surrounding environment and soil types should also be evaluated, with focus on the risk for damage to nearby water sources. This risk should be weighted up against risks that existed with previous greywater disposal methods (Murphy, 2006). Socio-cultural aspects in respect to system use and acceptance should be assessed to determine if the system is suitable for the intended users. Systems should be designed so that they do not differ drastically from cultural norms and local water usage/disposal patterns, as this may result in the abandoned use of a system. Systems should also be design with local laws regarding health, sanitation and wastewater regulations in mind (USEPA, 2004). Special attention should be given to who the primary users of the system are, which varies depending on the country, as this will affect aspects of the system design and the degree of maintenance and work that will be done on the system in the future. User education should be targeted on these main users (WHO, 2006). The actual price for the system needs to be determined to decide if the system is economically viable. This includes building costs as well as future maintenance (Rowe & Abdel-Magid, 1995). Replacement material should be easy to get, and within the cost range of the user. A cost-benefit analysis can be used in some cases to determine if the system pays off during its lifespan (WHO, 2006). If a system is too expensive to build and maintain in relationship to the water saved and the food produced, it is possible that other options should be considered (Ludwig, 2003). In the end, an overall assessment of a system must be put in the context of the place where it will be used and the potential users (WHO, 2006). Once the system is put in this context, ideas on how it can be improved or if its use should be discontinued can be determined. Programs and procedures for future management and for users should be based on problems found during the system assessment.
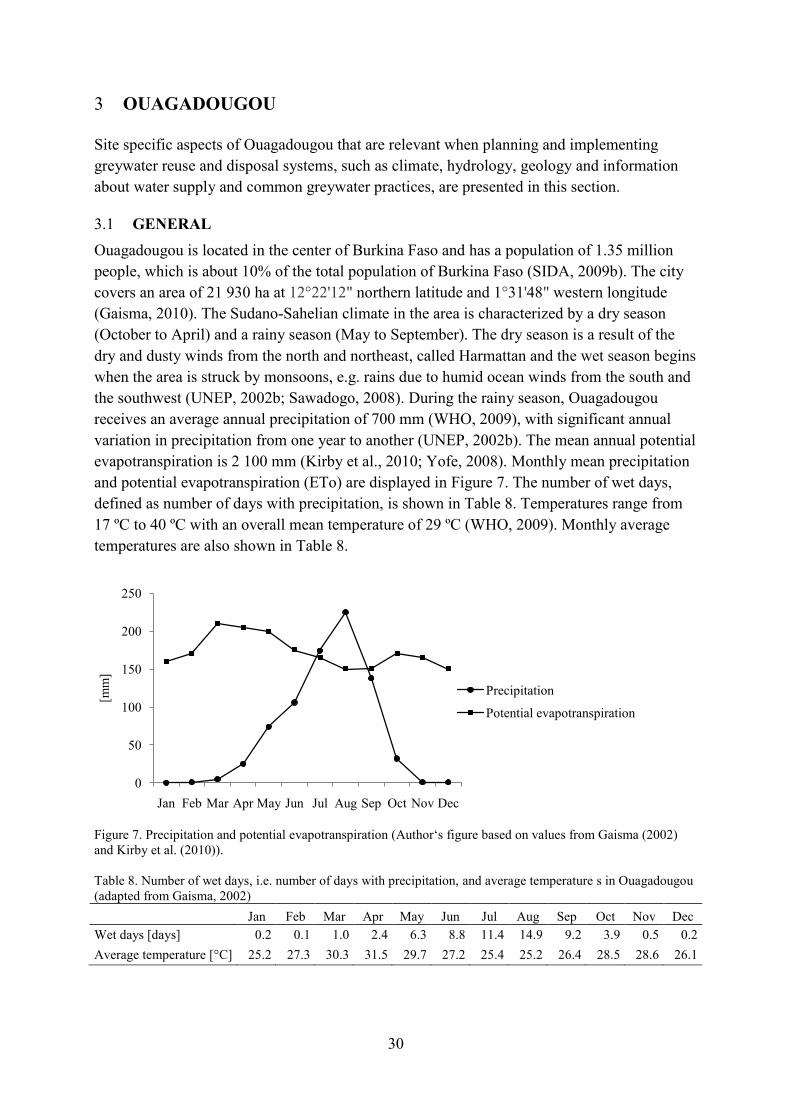
30
3 OUAGADOUGOU Site specific aspects of Ouagadougou that are relevant when planning and implementing greywater reuse and disposal systems, such as climate, hydrology, geology and information about water supply and common greywater practices, are presented in this section.
3.1 GENERAL Ouagadougou is located in the center of Burkina Faso and has a population of 1.35 million people, which is about 10% of the total population of Burkina Faso (SIDA, 2009b). The city covers an area of 21 930 ha at 12°22'12" northern latitude and 1°31'48" western longitude (Gaisma, 2010). The Sudano-Sahelian climate in the area is characterized by a dry season (October to April) and a rainy season (May to September). The dry season is a result of the dry and dusty winds from the north and northeast, called Harmattan and the wet season begins when the area is struck by monsoons, e.g. rains due to humid ocean winds from the south and the southwest (UNEP, 2002b; Sawadogo, 2008). During the rainy season, Ouagadougou receives an average annual precipitation of 700 mm (WHO, 2009), with significant annual variation in precipitation from one year to another (UNEP, 2002b). The mean annual potential evapotranspiration is 2 100 mm (Kirby et al., 2010; Yofe, 2008). Monthly mean precipitation and potential evapotranspiration (ETo) are displayed in Figure 7. The number of wet days, defined as number of days with precipitation, is shown in Table 8. Temperatures range from 17 ºC to 40 ºC with an overall mean temperature of 29 ºC (WHO, 2009). Monthly average temperatures are also shown in Table 8.
Figure 7. Precipitation and potential evapotranspiration (Author‘s figure based on values from Gaisma (2002) and Kirby et al. (2010)). Table 8. Number of wet days, i.e. number of days with precipitation, and average temperature s in Ouagadougou (adapted from Gaisma, 2002)
Jan Feb Mar Apr May Jun Jul Aug Sep Oct Nov Dec Wet days [days] 0.2 0.1 1.0 2.4 6.3 8.8 11.4 14.9 9.2 3.9 0.5 0.2 Average temperature [°C] 25.2 27.3 30.3 31.5 29.7 27.2 25.4 25.2 26.4 28.5 28.6 26.1
0
50
100
150
200
250
Jan Feb Mar Apr May Jun Jul Aug Sep Oct Nov Dec
[mm
]
Precipitation
Potential evapotranspiration
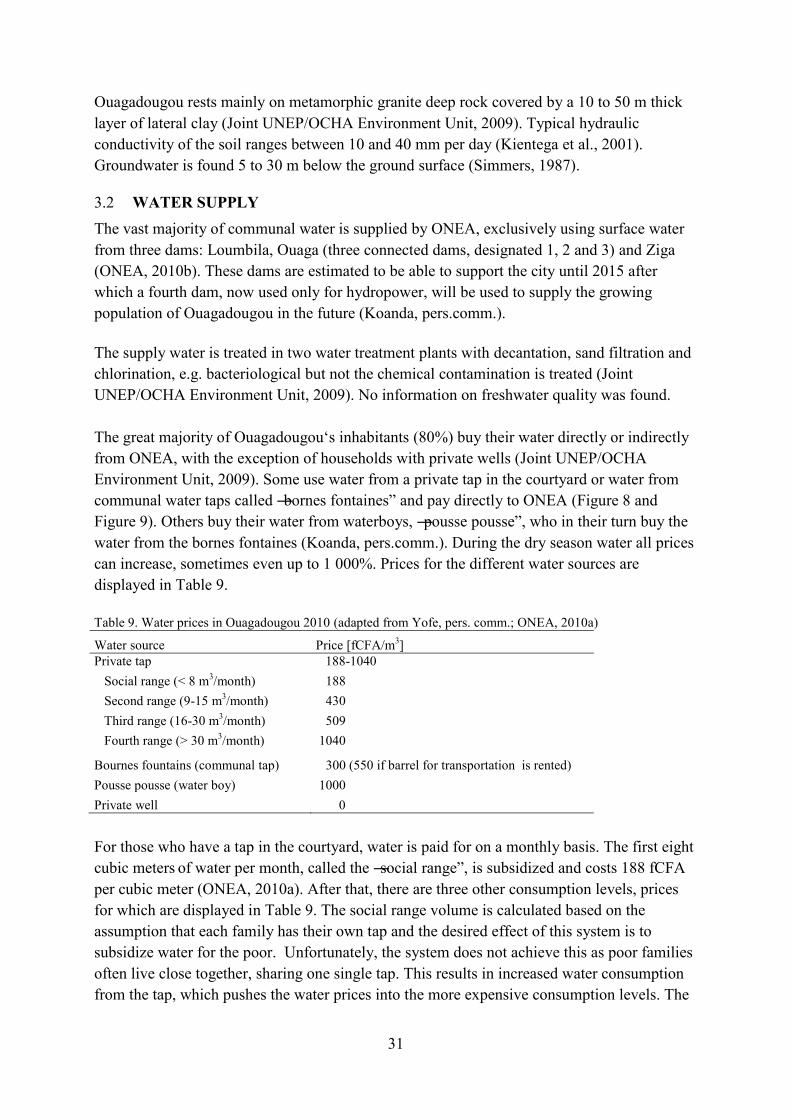
31
Ouagadougou rests mainly on metamorphic granite deep rock covered by a 10 to 50 m thick layer of lateral clay (Joint UNEP/OCHA Environment Unit, 2009). Typical hydraulic conductivity of the soil ranges between 10 and 40 mm per day (Kientega et al., 2001). Groundwater is found 5 to 30 m below the ground surface (Simmers, 1987).
3.2 WATER SUPPLY The vast majority of communal water is supplied by ONEA, exclusively using surface water from three dams: Loumbila, Ouaga (three connected dams, designated 1, 2 and 3) and Ziga (ONEA, 2010b). These dams are estimated to be able to support the city until 2015 after which a fourth dam, now used only for hydropower, will be used to supply the growing population of Ouagadougou in the future (Koanda, pers.comm.). The supply water is treated in two water treatment plants with decantation, sand filtration and chlorination, e.g. bacteriological but not the chemical contamination is treated (Joint UNEP/OCHA Environment Unit, 2009). No information on freshwater quality was found. The great majority of Ouagadougou‘s inhabitants (80%) buy their water directly or indirectly from ONEA, with the exception of households with private wells (Joint UNEP/OCHA Environment Unit, 2009). Some use water from a private tap in the courtyard or water from communal water taps called ―bornes fontaines‖ and pay directly to ONEA (Figure 8 and Figure 9). Others buy their water from waterboys, ―pousse pousse‖, who in their turn buy the water from the bornes fontaines (Koanda, pers.comm.). During the dry season water all prices can increase, sometimes even up to 1 000%. Prices for the different water sources are displayed in Table 9. Table 9. Water prices in Ouagadougou 2010 (adapted from Yofe, pers. comm.; ONEA, 2010a)
Water source Price [fCFA/m3] Private tap Social range (< 8 m3/month) Second range (9-15 m3/month) Third range (16-30 m3/month) Fourth range (> 30 m3/month)
188-1040 188 430 509
1040
Bournes fountains (communal tap) 300 (550 if barrel for transportation is rented) Pousse pousse (water boy) 1000 Private well 0
For those who have a tap in the courtyard, water is paid for on a monthly basis. The first eight cubic meters of water per month, called the ―social range‖, is subsidized and costs 188 fCFA per cubic meter (ONEA, 2010a). After that, there are three other consumption levels, prices for which are displayed in Table 9. The social range volume is calculated based on the assumption that each family has their own tap and the desired effect of this system is to subsidize water for the poor. Unfortunately, the system does not achieve this as poor families often live close together, sharing one single tap. This results in increased water consumption from the tap, which pushes the water prices into the more expensive consumption levels. The
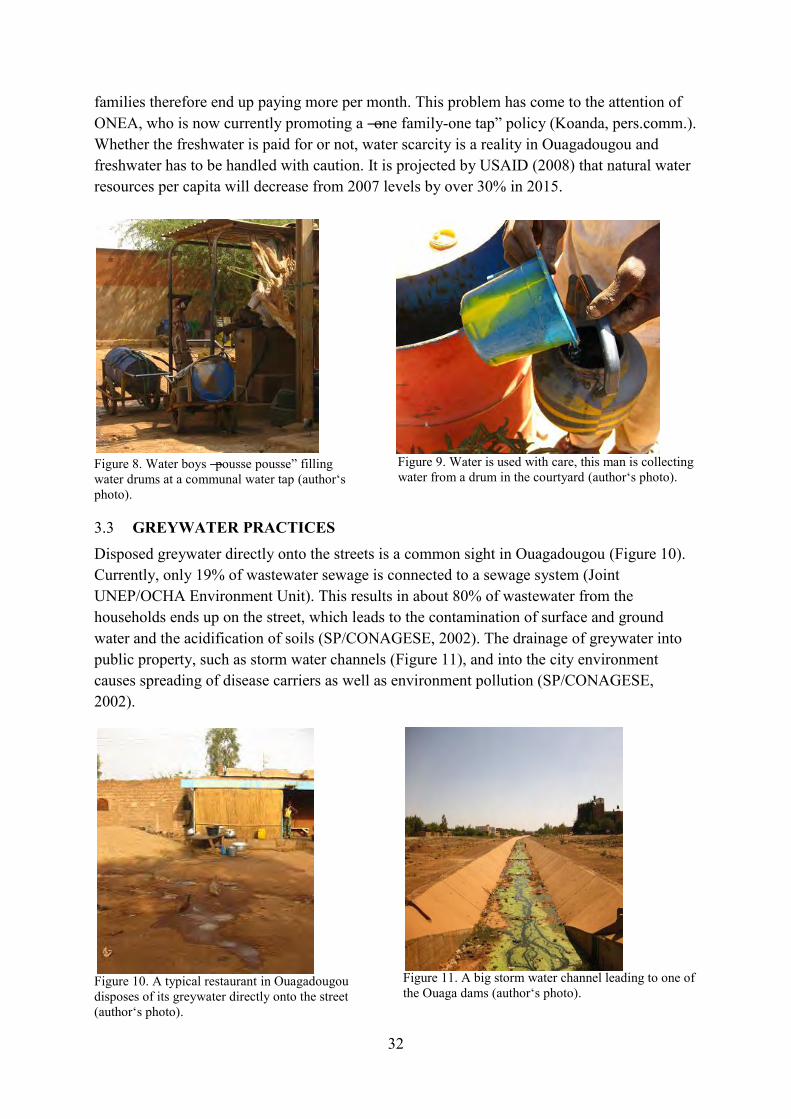
32
families therefore end up paying more per month. This problem has come to the attention of ONEA, who is now currently promoting a ―one family-one tap‖ policy (Koanda, pers.comm.). Whether the freshwater is paid for or not, water scarcity is a reality in Ouagadougou and freshwater has to be handled with caution. It is projected by USAID (2008) that natural water resources per capita will decrease from 2007 levels by over 30% in 2015.
Figure 8. Water boys ―pousse pousse‖ filling water drums at a communal water tap (author‘s photo).
Figure 9. Water is used with care, this man is collecting water from a drum in the courtyard (author‘s photo).
3.3 GREYWATER PRACTICES Disposed greywater directly onto the streets is a common sight in Ouagadougou (Figure 10). Currently, only 19% of wastewater sewage is connected to a sewage system (Joint UNEP/OCHA Environment Unit). This results in about 80% of wastewater from the households ends up on the street, which leads to the contamination of surface and ground water and the acidification of soils (SP/CONAGESE, 2002). The drainage of greywater into public property, such as storm water channels (Figure 11), and into the city environment causes spreading of disease carriers as well as environment pollution (SP/CONAGESE, 2002).
Figure 10. A typical restaurant in Ouagadougou disposes of its greywater directly onto the street (author‘s photo).
Figure 11. A big storm water channel leading to one of the Ouaga dams (author‘s photo).
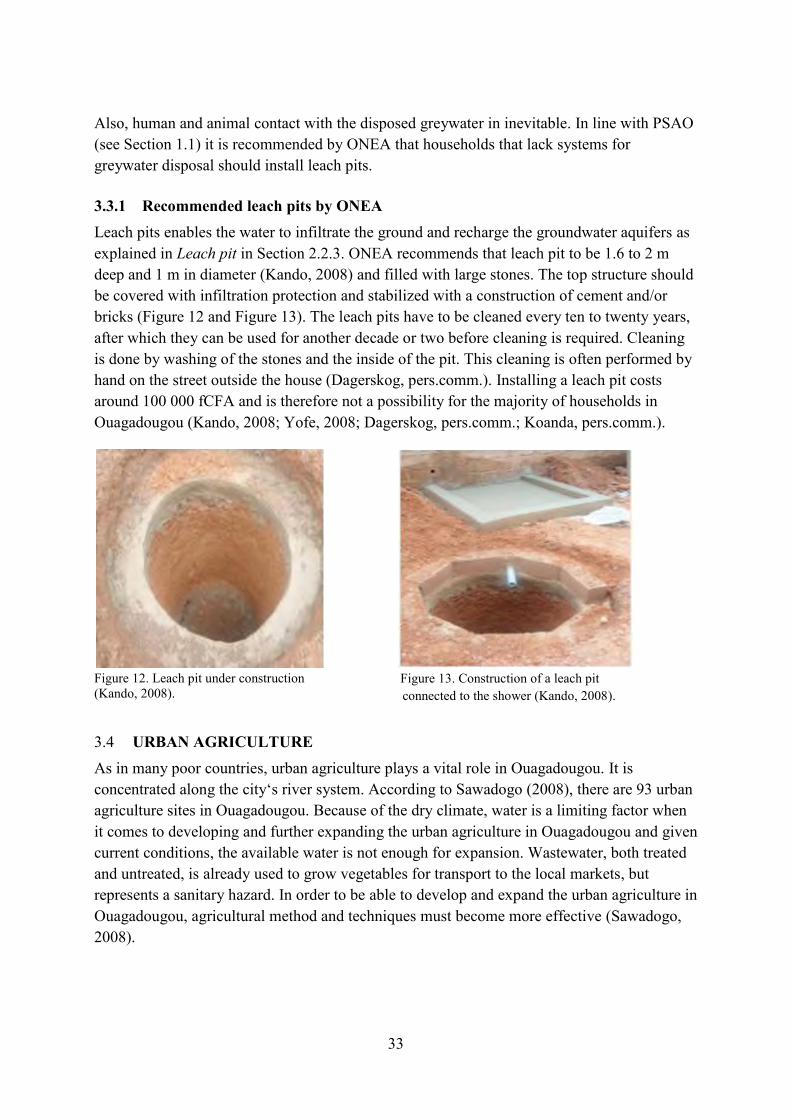
33
Also, human and animal contact with the disposed greywater in inevitable. In line with PSAO (see Section 1.1) it is recommended by ONEA that households that lack systems for greywater disposal should install leach pits.
3.3.1 Recommended leach pits by ONEA Leach pits enables the water to infiltrate the ground and recharge the groundwater aquifers as explained in Leach pit in Section 2.2.3. ONEA recommends that leach pit to be 1.6 to 2 m deep and 1 m in diameter (Kando, 2008) and filled with large stones. The top structure should be covered with infiltration protection and stabilized with a construction of cement and/or bricks (Figure 12 and Figure 13). The leach pits have to be cleaned every ten to twenty years, after which they can be used for another decade or two before cleaning is required. Cleaning is done by washing of the stones and the inside of the pit. This cleaning is often performed by hand on the street outside the house (Dagerskog, pers.comm.). Installing a leach pit costs around 100 000 fCFA and is therefore not a possibility for the majority of households in Ouagadougou (Kando, 2008; Yofe, 2008; Dagerskog, pers.comm.; Koanda, pers.comm.).
Figure 12. Leach pit under construction (Kando, 2008).
Figure 13. Construction of a leach pit connected to the shower (Kando, 2008).
3.4 URBAN AGRICULTURE As in many poor countries, urban agriculture plays a vital role in Ouagadougou. It is concentrated along the city‘s river system. According to Sawadogo (2008), there are 93 urban agriculture sites in Ouagadougou. Because of the dry climate, water is a limiting factor when it comes to developing and further expanding the urban agriculture in Ouagadougou and given current conditions, the available water is not enough for expansion. Wastewater, both treated and untreated, is already used to grow vegetables for transport to the local markets, but represents a sanitary hazard. In order to be able to develop and expand the urban agriculture in Ouagadougou, agricultural method and techniques must become more effective (Sawadogo, 2008).
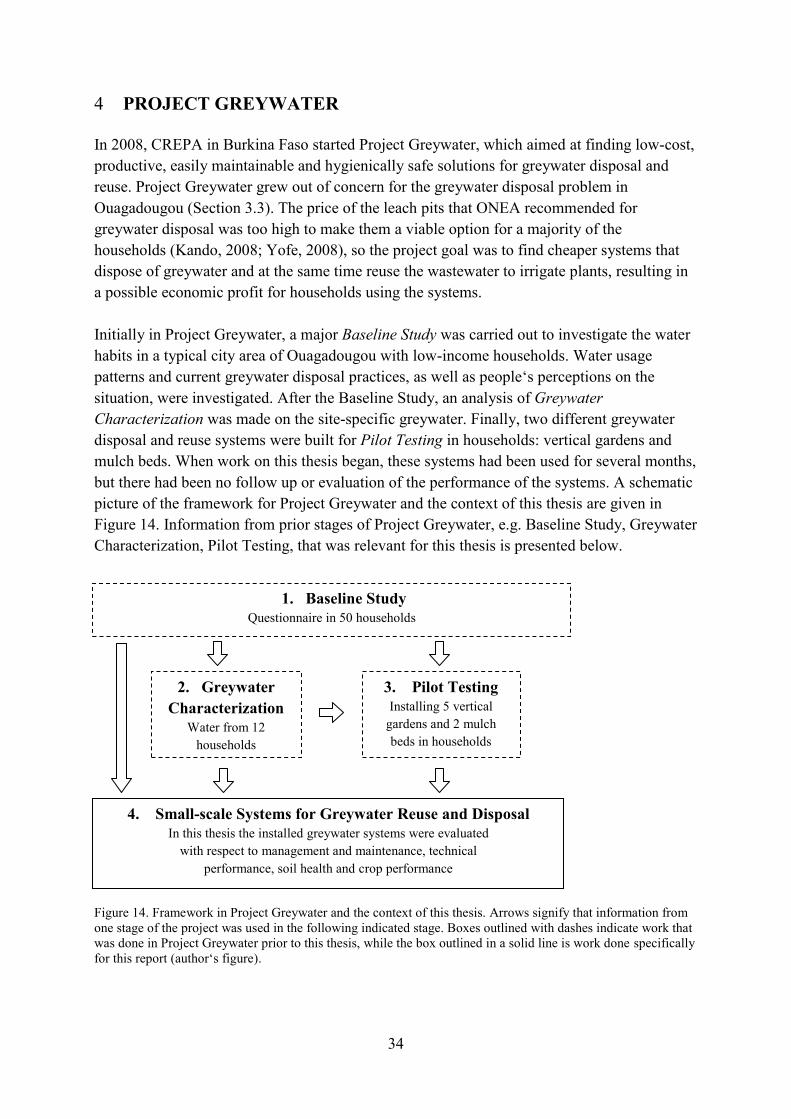
34
4 PROJECT GREYWATER In 2008, CREPA in Burkina Faso started Project Greywater, which aimed at finding low-cost, productive, easily maintainable and hygienically safe solutions for greywater disposal and reuse. Project Greywater grew out of concern for the greywater disposal problem in Ouagadougou (Section 3.3). The price of the leach pits that ONEA recommended for greywater disposal was too high to make them a viable option for a majority of the households (Kando, 2008; Yofe, 2008), so the project goal was to find cheaper systems that dispose of greywater and at the same time reuse the wastewater to irrigate plants, resulting in a possible economic profit for households using the systems. Initially in Project Greywater, a major Baseline Study was carried out to investigate the water habits in a typical city area of Ouagadougou with low-income households. Water usage patterns and current greywater disposal practices, as well as people‘s perceptions on the situation, were investigated. After the Baseline Study, an analysis of Greywater Characterization was made on the site-specific greywater. Finally, two different greywater disposal and reuse systems were built for Pilot Testing in households: vertical gardens and mulch beds. When work on this thesis began, these systems had been used for several months, but there had been no follow up or evaluation of the performance of the systems. A schematic picture of the framework for Project Greywater and the context of this thesis are given in Figure 14. Information from prior stages of Project Greywater, e.g. Baseline Study, Greywater Characterization, Pilot Testing, that was relevant for this thesis is presented below.
Figure 14. Framework in Project Greywater and the context of this thesis. Arrows signify that information from one stage of the project was used in the following indicated stage. Boxes outlined with dashes indicate work that was done in Project Greywater prior to this thesis, while the box outlined in a solid line is work done specifically for this report (author‘s figure).
1. Baseline Study Questionnaire in 50 households
2. Greywater Characterization
Water from 12 households
3. Pilot Testing Installing 5 vertical
gardens and 2 mulch beds in households
4. Small-scale Systems for Greywater Reuse and Disposal In this thesis the installed greywater systems were evaluated
with respect to management and maintenance, technical performance, soil health and crop performance
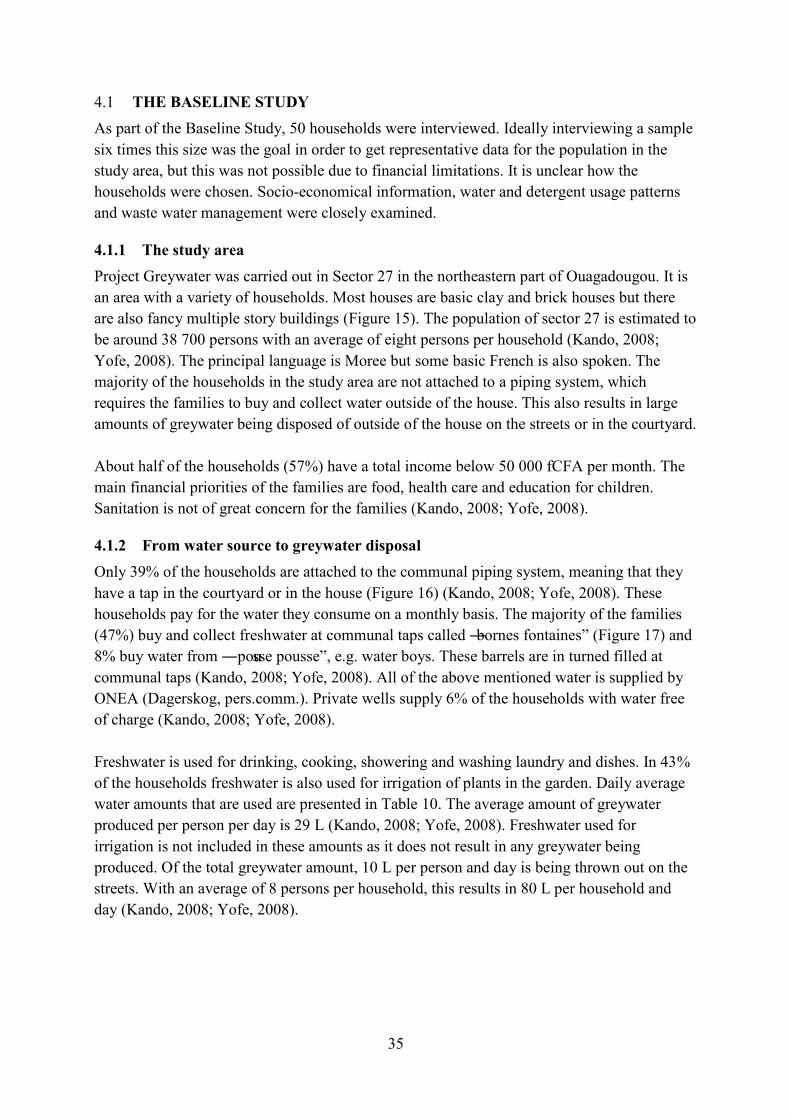
35
4.1 THE BASELINE STUDY As part of the Baseline Study, 50 households were interviewed. Ideally interviewing a sample six times this size was the goal in order to get representative data for the population in the study area, but this was not possible due to financial limitations. It is unclear how the households were chosen. Socio-economical information, water and detergent usage patterns and waste water management were closely examined.
4.1.1 The study area Project Greywater was carried out in Sector 27 in the northeastern part of Ouagadougou. It is an area with a variety of households. Most houses are basic clay and brick houses but there are also fancy multiple story buildings (Figure 15). The population of sector 27 is estimated to be around 38 700 persons with an average of eight persons per household (Kando, 2008; Yofe, 2008). The principal language is Moree but some basic French is also spoken. The majority of the households in the study area are not attached to a piping system, which requires the families to buy and collect water outside of the house. This also results in large amounts of greywater being disposed of outside of the house on the streets or in the courtyard. About half of the households (57%) have a total income below 50 000 fCFA per month. The main financial priorities of the families are food, health care and education for children. Sanitation is not of great concern for the families (Kando, 2008; Yofe, 2008).
4.1.2 From water source to greywater disposal Only 39% of the households are attached to the communal piping system, meaning that they have a tap in the courtyard or in the house (Figure 16) (Kando, 2008; Yofe, 2008). These households pay for the water they consume on a monthly basis. The majority of the families (47%) buy and collect freshwater at communal taps called ―bornes fontaines‖ (Figure 17) and 8% buy water from ―pousse pousse‖, e.g. water boys. These barrels are in turned filled at communal taps (Kando, 2008; Yofe, 2008). All of the above mentioned water is supplied by ONEA (Dagerskog, pers.comm.). Private wells supply 6% of the households with water free of charge (Kando, 2008; Yofe, 2008). Freshwater is used for drinking, cooking, showering and washing laundry and dishes. In 43% of the households freshwater is also used for irrigation of plants in the garden. Daily average water amounts that are used are presented in Table 10. The average amount of greywater produced per person per day is 29 L (Kando, 2008; Yofe, 2008). Freshwater used for irrigation is not included in these amounts as it does not result in any greywater being produced. Of the total greywater amount, 10 L per person and day is being thrown out on the streets. With an average of 8 persons per household, this results in 80 L per household and day (Kando, 2008; Yofe, 2008).
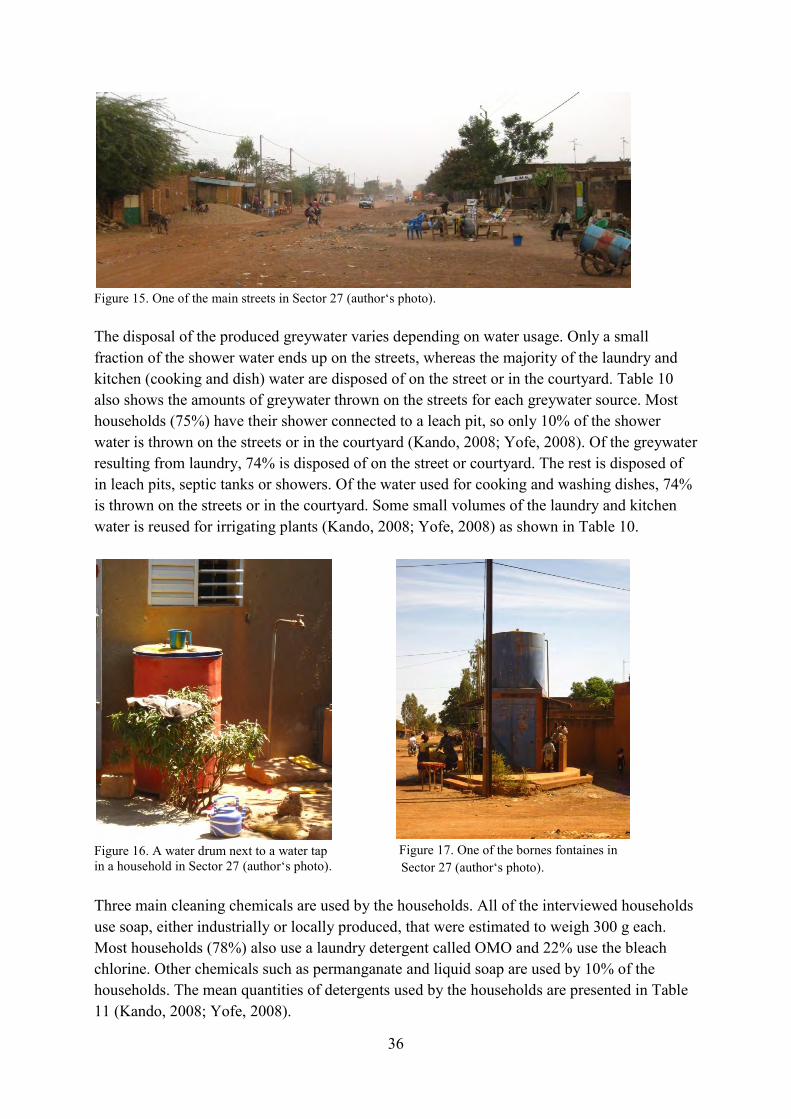
36
Figure 15. One of the main streets in Sector 27 (author‘s photo). The disposal of the produced greywater varies depending on water usage. Only a small fraction of the shower water ends up on the streets, whereas the majority of the laundry and kitchen (cooking and dish) water are disposed of on the street or in the courtyard. Table 10 also shows the amounts of greywater thrown on the streets for each greywater source. Most households (75%) have their shower connected to a leach pit, so only 10% of the shower water is thrown on the streets or in the courtyard (Kando, 2008; Yofe, 2008). Of the greywater resulting from laundry, 74% is disposed of on the street or courtyard. The rest is disposed of in leach pits, septic tanks or showers. Of the water used for cooking and washing dishes, 74% is thrown on the streets or in the courtyard. Some small volumes of the laundry and kitchen water is reused for irrigating plants (Kando, 2008; Yofe, 2008) as shown in Table 10.
Figure 16. A water drum next to a water tap in a household in Sector 27 (author‘s photo).
Figure 17. One of the bornes fontaines in Sector 27 (author‘s photo).
Three main cleaning chemicals are used by the households. All of the interviewed households use soap, either industrially or locally produced, that were estimated to weigh 300 g each. Most households (78%) also use a laundry detergent called OMO and 22% use the bleach chlorine. Other chemicals such as permanganate and liquid soap are used by 10% of the households. The mean quantities of detergents used by the households are presented in Table 11 (Kando, 2008; Yofe, 2008).
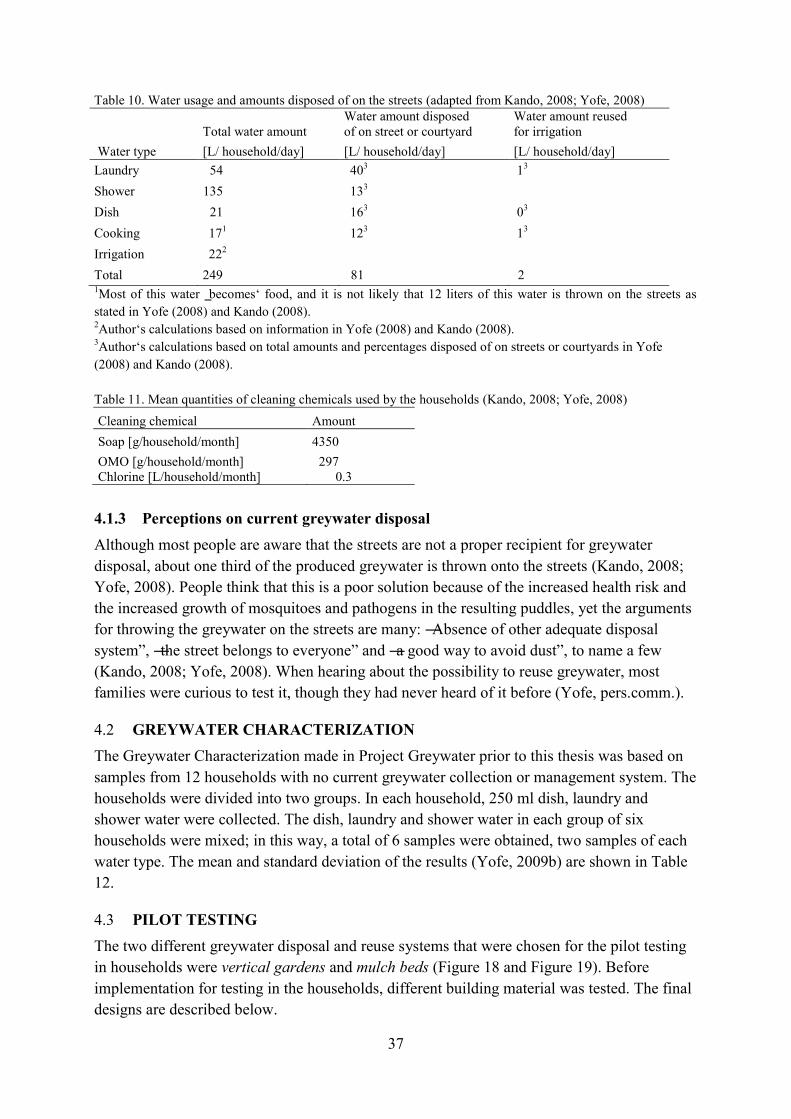
37
Table 10. Water usage and amounts disposed of on the streets (adapted from Kando, 2008; Yofe, 2008)
Total water amount Water amount disposed of on street or courtyard
Water amount reused for irrigation
Water type [L/ household/day] [L/ household/day] [L/ household/day] Laundry 54 403 13 Shower 135 133 Dish 21 163 03 Cooking 171 123 13 Irrigation 222 Total 249 81 2 1Most of this water ‗becomes‘ food, and it is not likely that 12 liters of this water is thrown on the streets as stated in Yofe (2008) and Kando (2008). 2Author‘s calculations based on information in Yofe (2008) and Kando (2008). 3Author‘s calculations based on total amounts and percentages disposed of on streets or courtyards in Yofe (2008) and Kando (2008). Table 11. Mean quantities of cleaning chemicals used by the households (Kando, 2008; Yofe, 2008) Cleaning chemical Amount Soap [g/household/month] 4350 OMO [g/household/month] 297 Chlorine [L/household/month] 0.3
4.1.3 Perceptions on current greywater disposal Although most people are aware that the streets are not a proper recipient for greywater disposal, about one third of the produced greywater is thrown onto the streets (Kando, 2008; Yofe, 2008). People think that this is a poor solution because of the increased health risk and the increased growth of mosquitoes and pathogens in the resulting puddles, yet the arguments for throwing the greywater on the streets are many: ―Absence of other adequate disposal system‖, ―the street belongs to everyone‖ and ―a good way to avoid dust‖, to name a few (Kando, 2008; Yofe, 2008). When hearing about the possibility to reuse greywater, most families were curious to test it, though they had never heard of it before (Yofe, pers.comm.).
4.2 GREYWATER CHARACTERIZATION The Greywater Characterization made in Project Greywater prior to this thesis was based on samples from 12 households with no current greywater collection or management system. The households were divided into two groups. In each household, 250 ml dish, laundry and shower water were collected. The dish, laundry and shower water in each group of six households were mixed; in this way, a total of 6 samples were obtained, two samples of each water type. The mean and standard deviation of the results (Yofe, 2009b) are shown in Table 12.
4.3 PILOT TESTING The two different greywater disposal and reuse systems that were chosen for the pilot testing in households were vertical gardens and mulch beds (Figure 18 and Figure 19). Before implementation for testing in the households, different building material was tested. The final designs are described below.
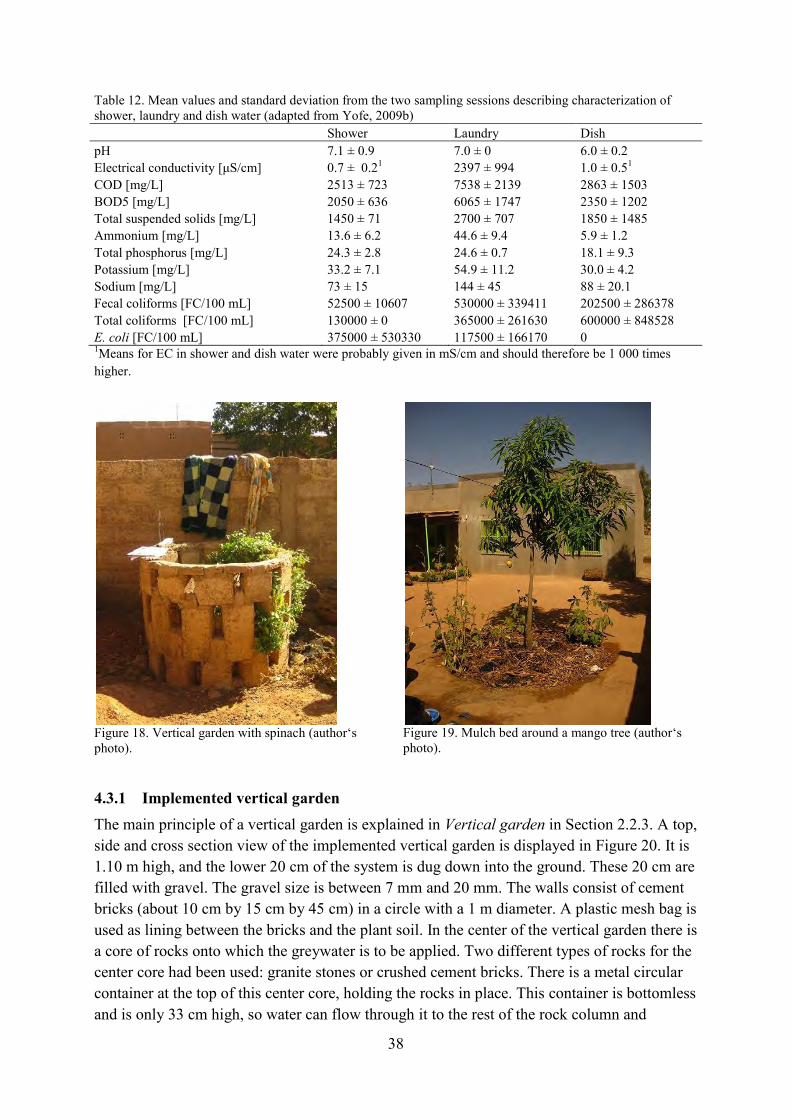
38
Table 12. Mean values and standard deviation from the two sampling sessions describing characterization of shower, laundry and dish water (adapted from Yofe, 2009b) Shower Laundry Dish pH 7.1 ± 0.9 7.0 ± 0 6.0 ± 0.2 Electrical conductivity [μS/cm] 0.7 ± 0.21 2397 ± 994 1.0 ± 0.51
COD [mg/L] 2513 ± 723 7538 ± 2139 2863 ± 1503 BOD5 [mg/L] 2050 ± 636 6065 ± 1747 2350 ± 1202 Total suspended solids [mg/L] 1450 ± 71 2700 ± 707 1850 ± 1485 Ammonium [mg/L] 13.6 ± 6.2 44.6 ± 9.4 5.9 ± 1.2 Total phosphorus [mg/L] 24.3 ± 2.8 24.6 ± 0.7 18.1 ± 9.3 Potassium [mg/L] 33.2 ± 7.1 54.9 ± 11.2 30.0 ± 4.2 Sodium [mg/L] 73 ± 15 144 ± 45 88 ± 20.1 Fecal coliforms [FC/100 mL] 52500 ± 10607 530000 ± 339411 202500 ± 286378 Total coliforms [FC/100 mL] 130000 ± 0 365000 ± 261630 600000 ± 848528 E. coli [FC/100 mL] 375000 ± 530330 117500 ± 166170 0 1Means for EC in shower and dish water were probably given in mS/cm and should therefore be 1 000 times higher.
Figure 18. Vertical garden with spinach (author‘s photo).
Figure 19. Mulch bed around a mango tree (author‘s photo).
4.3.1 Implemented vertical garden The main principle of a vertical garden is explained in Vertical garden in Section 2.2.3. A top, side and cross section view of the implemented vertical garden is displayed in Figure 20. It is 1.10 m high, and the lower 20 cm of the system is dug down into the ground. These 20 cm are filled with gravel. The gravel size is between 7 mm and 20 mm. The walls consist of cement bricks (about 10 cm by 15 cm by 45 cm) in a circle with a 1 m diameter. A plastic mesh bag is used as lining between the bricks and the plant soil. In the center of the vertical garden there is a core of rocks onto which the greywater is to be applied. Two different types of rocks for the center core had been used: granite stones or crushed cement bricks. There is a metal circular container at the top of this center core, holding the rocks in place. This container is bottomless and is only 33 cm high, so water can flow through it to the rest of the rock column and
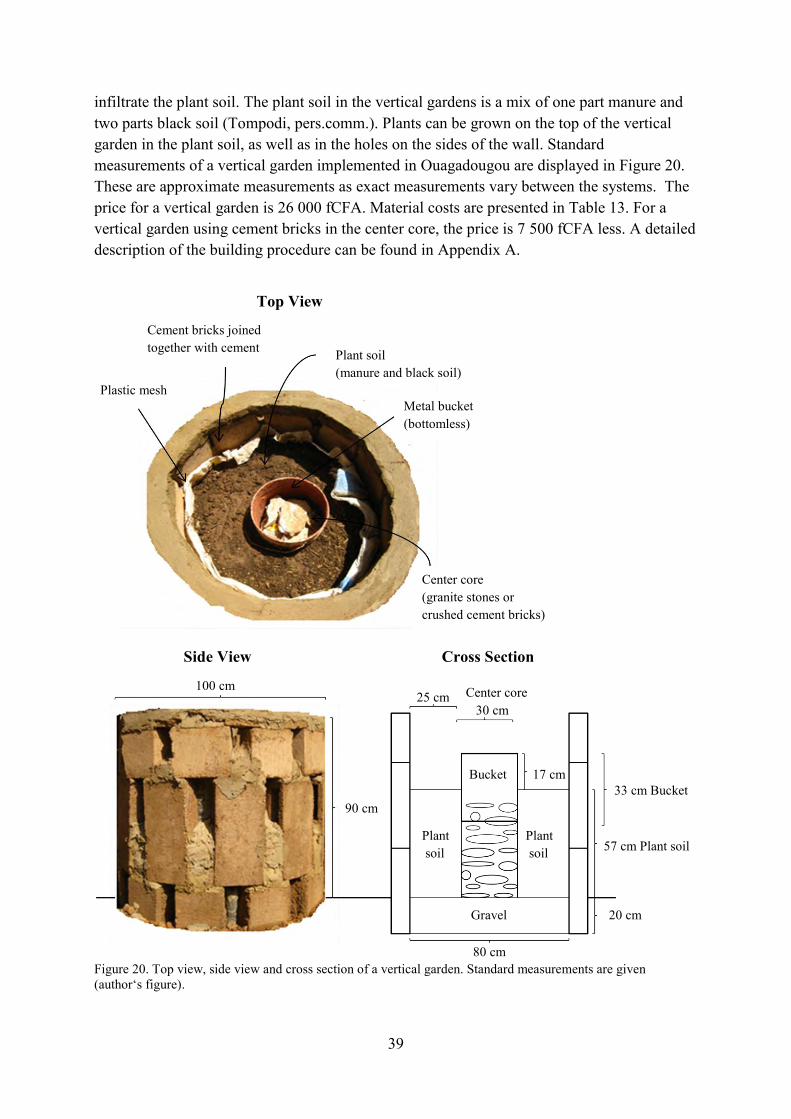
39
infiltrate the plant soil. The plant soil in the vertical gardens is a mix of one part manure and two parts black soil (Tompodi, pers.comm.). Plants can be grown on the top of the vertical garden in the plant soil, as well as in the holes on the sides of the wall. Standard measurements of a vertical garden implemented in Ouagadougou are displayed in Figure 20. These are approximate measurements as exact measurements vary between the systems. The price for a vertical garden is 26 000 fCFA. Material costs are presented in Table 13. For a vertical garden using cement bricks in the center core, the price is 7 500 fCFA less. A detailed description of the building procedure can be found in Appendix A.
Figure 20. Top view, side view and cross section of a vertical garden. Standard measurements are given (author‘s figure).
57 cm Plant soil
Plastic mesh Metal bucket (bottomless)
Plant soil (manure and black soil)
Cement bricks joined together with cement
Center core (granite stones or crushed cement bricks)
Center core 30 cm
25 cm
17 cm
20 cm
33 cm Bucket
100 cm
90 cm
Bucket
Gravel
Plant soil
Plant soil
80 cm
Side View Cross Section
Top View
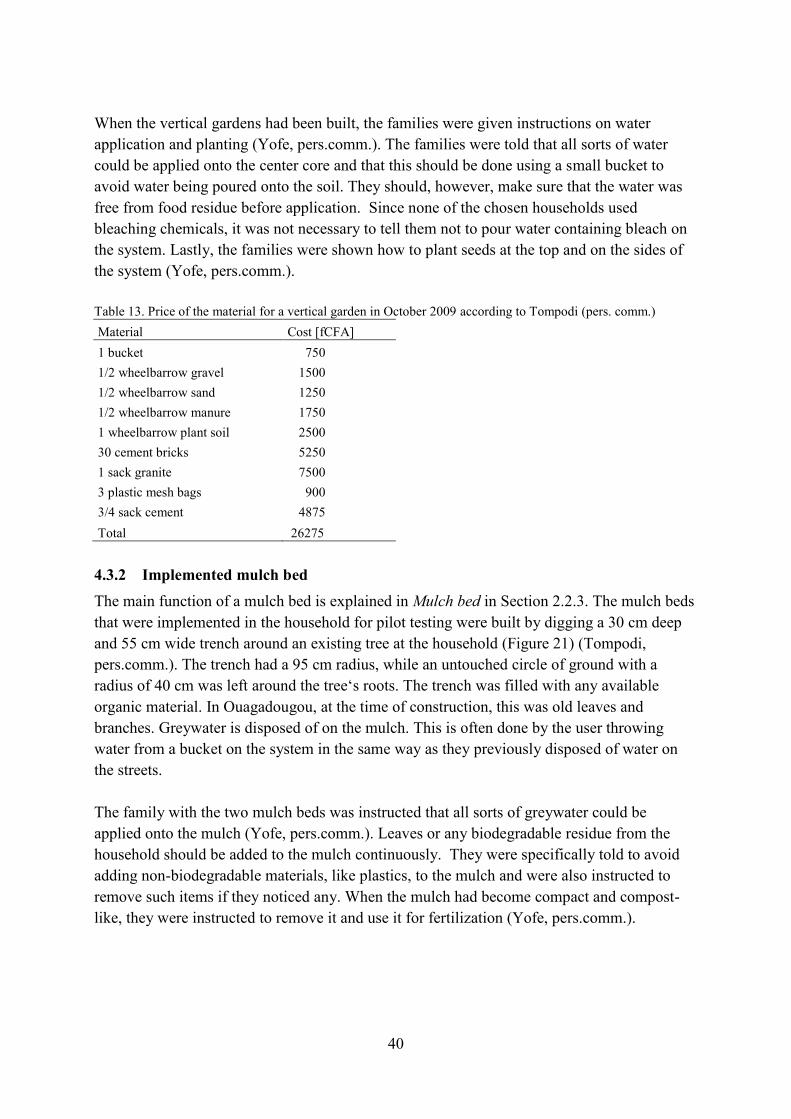
40
When the vertical gardens had been built, the families were given instructions on water application and planting (Yofe, pers.comm.). The families were told that all sorts of water could be applied onto the center core and that this should be done using a small bucket to avoid water being poured onto the soil. They should, however, make sure that the water was free from food residue before application. Since none of the chosen households used bleaching chemicals, it was not necessary to tell them not to pour water containing bleach on the system. Lastly, the families were shown how to plant seeds at the top and on the sides of the system (Yofe, pers.comm.). Table 13. Price of the material for a vertical garden in October 2009 according to Tompodi (pers. comm.) Material Cost [fCFA] 1 bucket 750 1/2 wheelbarrow gravel 1500 1/2 wheelbarrow sand 1250 1/2 wheelbarrow manure 1750 1 wheelbarrow plant soil 2500 30 cement bricks 5250 1 sack granite 7500 3 plastic mesh bags 900 3/4 sack cement 4875 Total 26275
4.3.2 Implemented mulch bed The main function of a mulch bed is explained in Mulch bed in Section 2.2.3. The mulch beds that were implemented in the household for pilot testing were built by digging a 30 cm deep and 55 cm wide trench around an existing tree at the household (Figure 21) (Tompodi, pers.comm.). The trench had a 95 cm radius, while an untouched circle of ground with a radius of 40 cm was left around the tree‘s roots. The trench was filled with any available organic material. In Ouagadougou, at the time of construction, this was old leaves and branches. Greywater is disposed of on the mulch. This is often done by the user throwing water from a bucket on the system in the same way as they previously disposed of water on the streets. The family with the two mulch beds was instructed that all sorts of greywater could be applied onto the mulch (Yofe, pers.comm.). Leaves or any biodegradable residue from the household should be added to the mulch continuously. They were specifically told to avoid adding non-biodegradable materials, like plastics, to the mulch and were also instructed to remove such items if they noticed any. When the mulch had become compact and compost-like, they were instructed to remove it and use it for fertilization (Yofe, pers.comm.).

41
Figure 21. Cross section view of a mulch bed showing standard measurements (author‘s figure).
40 cm 95 cm
55 cm
30 cm Mulch Mulch
Tree
42
5 METHODS In order to make an assessment of the two types of implemented systems, information was collected from the five vertical gardens and the two mulch beds in the households, as well as the two new vertical gardens located at CREPA‘s headquarters, which were built especially for this thesis. Extra focus was placed on monitoring and system assessment by evaluating system operation, technical performance, soil health and crop production. This was done in the form of observations, interviews at the households with the implemented systems, soil sampling, as well as through various experiments described below.
5.1 SYSTEMS IN PRACTICE Interviews and study visits were conducted in order to identify the current usage patterns of the five vertical gardens and two mulch beds in operation in Project Greywater, and to identify any problems that had occurred since the greywater systems had been built. This was done with focus on factors that could be used to evaluate system operation, e.g. how the system was operated by the user. At the same time, information on technical performance, soil health and crop production was also compiled. One comprehensive interview was conducted at each of the households during November and December 2009. An open-ended questionnaire was used with questions belonging to three categories:
Greywater generation and system usage patterns Plant quality and quantity System performance.
These interviews were conducted orally, with help from a Moore-French translator, and the answers were recorded on paper. The questionnaire can be found in Appendix B.
Besides the information collected at the time of the interviews, additional information regarding the system operation and monitoring was photographed and recorded through writing during study visits done on October 11, 2009, November 11, 2009, November 24, 2009, December 2, 2009, December 3, 2009, December 10, 2009 and February 1, 2010.
5.2 ELECTRICAL CONDUCTIVITY AND pH ANALYSIS Soil health was examined by testing pH and electrical conductivity (EC) from plant soil in the vertical gardens and from mulch/soil mixtures in the mulch beds. By measuring EC, the salinity in the soil was tested. The pH was measured because it is an indicator of soil health and it affects plant growth directly due to its influence on soil properties. EC and pH analysis were carried out on soil/mulch samples from five vertical gardens and two mulch beds in the households as well as from a vertical garden at CREPA. Samples for the mulch beds were
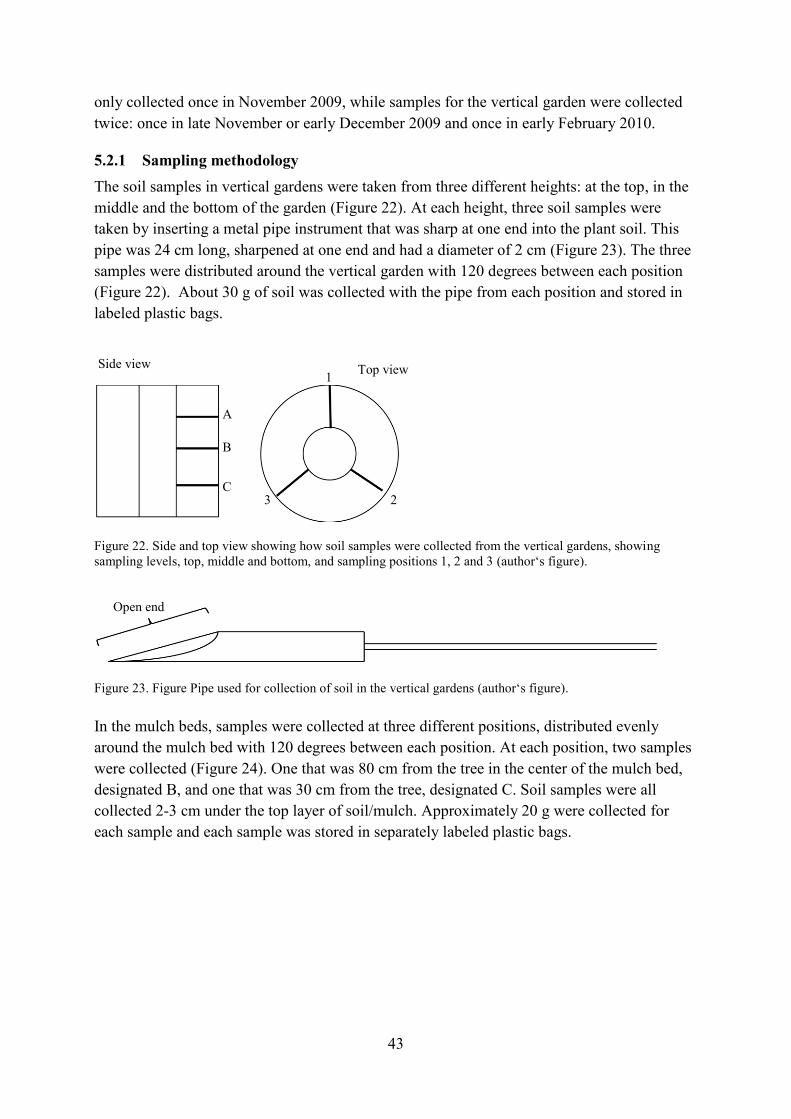
43
only collected once in November 2009, while samples for the vertical garden were collected twice: once in late November or early December 2009 and once in early February 2010.
5.2.1 Sampling methodology The soil samples in vertical gardens were taken from three different heights: at the top, in the middle and the bottom of the garden (Figure 22). At each height, three soil samples were taken by inserting a metal pipe instrument that was sharp at one end into the plant soil. This pipe was 24 cm long, sharpened at one end and had a diameter of 2 cm (Figure 23). The three samples were distributed around the vertical garden with 120 degrees between each position (Figure 22). About 30 g of soil was collected with the pipe from each position and stored in labeled plastic bags.
Figure 22. Side and top view showing how soil samples were collected from the vertical gardens, showing sampling levels, top, middle and bottom, and sampling positions 1, 2 and 3 (author‘s figure).
Figure 23. Figure Pipe used for collection of soil in the vertical gardens (author‘s figure). In the mulch beds, samples were collected at three different positions, distributed evenly around the mulch bed with 120 degrees between each position. At each position, two samples were collected (Figure 24). One that was 80 cm from the tree in the center of the mulch bed, designated B, and one that was 30 cm from the tree, designated C. Soil samples were all collected 2-3 cm under the top layer of soil/mulch. Approximately 20 g were collected for each sample and each sample was stored in separately labeled plastic bags.
Side view Top view 1
3 2 C
A
B
Open end
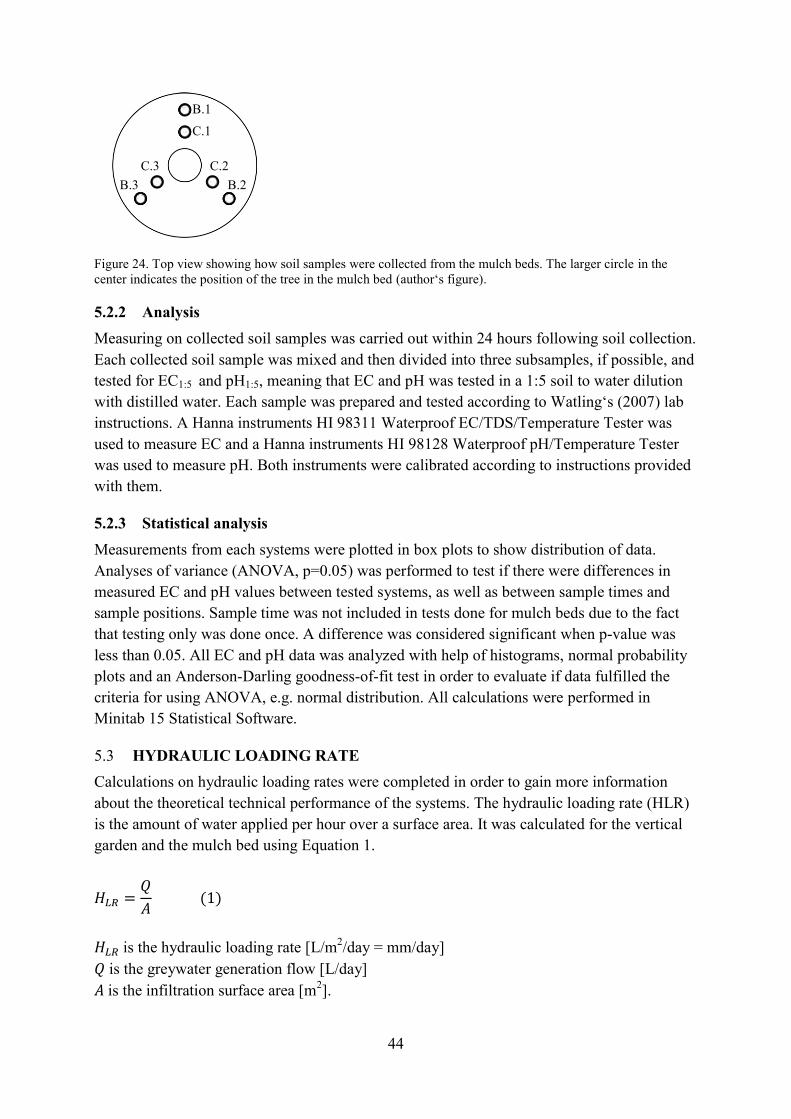
44
Figure 24. Top view showing how soil samples were collected from the mulch beds. The larger circle in the center indicates the position of the tree in the mulch bed (author‘s figure).
5.2.2 Analysis Measuring on collected soil samples was carried out within 24 hours following soil collection. Each collected soil sample was mixed and then divided into three subsamples, if possible, and tested for EC1:5 and pH1:5, meaning that EC and pH was tested in a 1:5 soil to water dilution with distilled water. Each sample was prepared and tested according to Watling‘s (2007) lab instructions. A Hanna instruments HI 98311 Waterproof EC/TDS/Temperature Tester was used to measure EC and a Hanna instruments HI 98128 Waterproof pH/Temperature Tester was used to measure pH. Both instruments were calibrated according to instructions provided with them.
5.2.3 Statistical analysis Measurements from each systems were plotted in box plots to show distribution of data. Analyses of variance (ANOVA, p=0.05) was performed to test if there were differences in measured EC and pH values between tested systems, as well as between sample times and sample positions. Sample time was not included in tests done for mulch beds due to the fact that testing only was done once. A difference was considered significant when p-value was less than 0.05. All EC and pH data was analyzed with help of histograms, normal probability plots and an Anderson-Darling goodness-of-fit test in order to evaluate if data fulfilled the criteria for using ANOVA, e.g. normal distribution. All calculations were performed in Minitab 15 Statistical Software.
5.3 HYDRAULIC LOADING RATE Calculations on hydraulic loading rates were completed in order to gain more information about the theoretical technical performance of the systems. The hydraulic loading rate (HLR) is the amount of water applied per hour over a surface area. It was calculated for the vertical garden and the mulch bed using Equation 1.
is the hydraulic loading rate [L/m2/day = mm/day] is the greywater generation flow [L/day] is the infiltration surface area [m2].
B.2 C.2
B.1
C.1
C.3 B.3
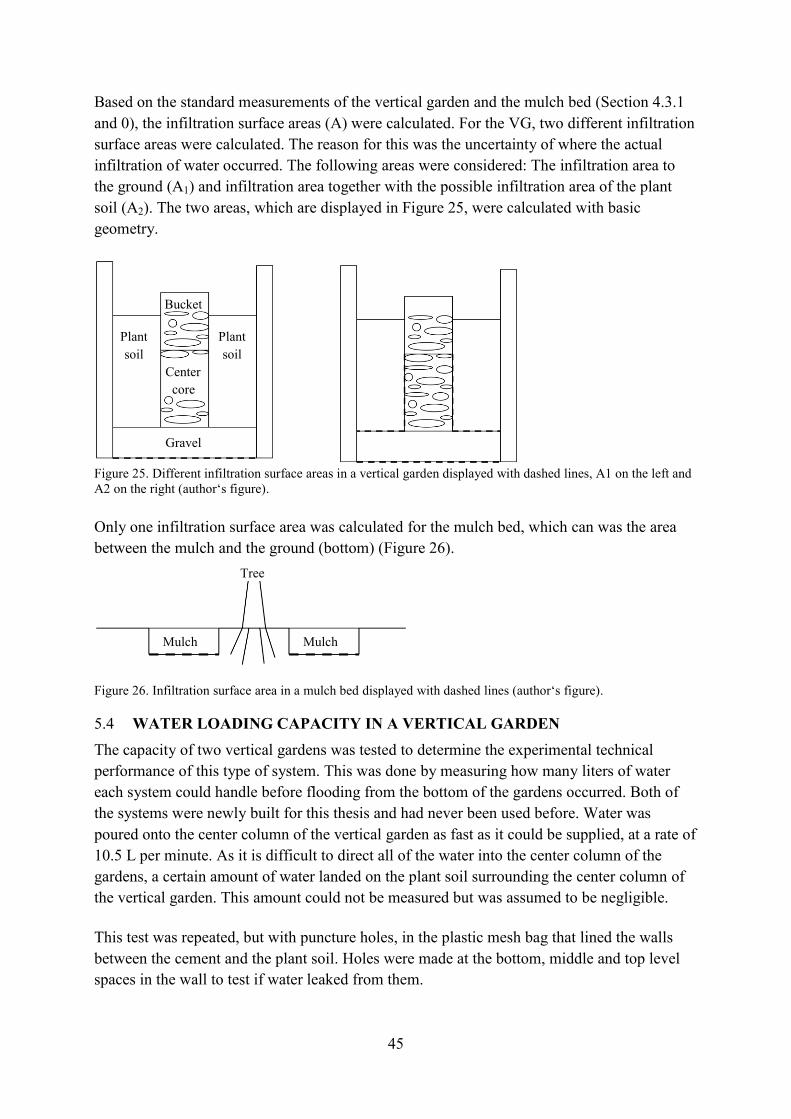
45
Based on the standard measurements of the vertical garden and the mulch bed (Section 4.3.1 and 0), the infiltration surface areas (A) were calculated. For the VG, two different infiltration surface areas were calculated. The reason for this was the uncertainty of where the actual infiltration of water occurred. The following areas were considered: The infiltration area to the ground (A1) and infiltration area together with the possible infiltration area of the plant soil (A2). The two areas, which are displayed in Figure 25, were calculated with basic geometry.
Figure 25. Different infiltration surface areas in a vertical garden displayed with dashed lines, A1 on the left and A2 on the right (author‘s figure). Only one infiltration surface area was calculated for the mulch bed, which can was the area between the mulch and the ground (bottom) (Figure 26).
Figure 26. Infiltration surface area in a mulch bed displayed with dashed lines (author‘s figure).
5.4 WATER LOADING CAPACITY IN A VERTICAL GARDEN The capacity of two vertical gardens was tested to determine the experimental technical performance of this type of system. This was done by measuring how many liters of water each system could handle before flooding from the bottom of the gardens occurred. Both of the systems were newly built for this thesis and had never been used before. Water was poured onto the center column of the vertical garden as fast as it could be supplied, at a rate of 10.5 L per minute. As it is difficult to direct all of the water into the center column of the gardens, a certain amount of water landed on the plant soil surrounding the center column of the vertical garden. This amount could not be measured but was assumed to be negligible.
This test was repeated, but with puncture holes, in the plastic mesh bag that lined the walls between the cement and the plant soil. Holes were made at the bottom, middle and top level spaces in the wall to test if water leaked from them.
Bucket
Gravel
Plant soil
Center core
Plant soil
Mulch Mulch
Tree
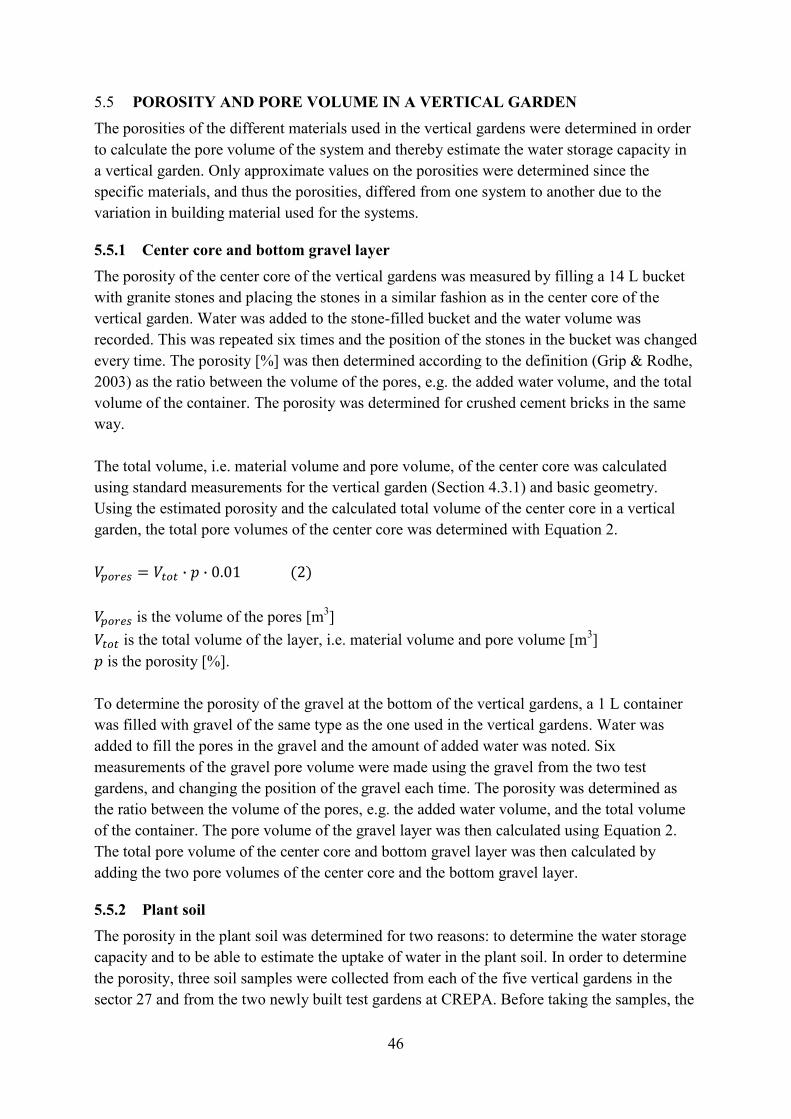
46
5.5 POROSITY AND PORE VOLUME IN A VERTICAL GARDEN The porosities of the different materials used in the vertical gardens were determined in order to calculate the pore volume of the system and thereby estimate the water storage capacity in a vertical garden. Only approximate values on the porosities were determined since the specific materials, and thus the porosities, differed from one system to another due to the variation in building material used for the systems.
5.5.1 Center core and bottom gravel layer The porosity of the center core of the vertical gardens was measured by filling a 14 L bucket with granite stones and placing the stones in a similar fashion as in the center core of the vertical garden. Water was added to the stone-filled bucket and the water volume was recorded. This was repeated six times and the position of the stones in the bucket was changed every time. The porosity [%] was then determined according to the definition (Grip & Rodhe, 2003) as the ratio between the volume of the pores, e.g. the added water volume, and the total volume of the container. The porosity was determined for crushed cement bricks in the same way. The total volume, i.e. material volume and pore volume, of the center core was calculated using standard measurements for the vertical garden (Section 4.3.1) and basic geometry. Using the estimated porosity and the calculated total volume of the center core in a vertical garden, the total pore volumes of the center core was determined with Equation 2. is the volume of the pores [m3] is the total volume of the layer, i.e. material volume and pore volume [m3] is the porosity [%]. To determine the porosity of the gravel at the bottom of the vertical gardens, a 1 L container was filled with gravel of the same type as the one used in the vertical gardens. Water was added to fill the pores in the gravel and the amount of added water was noted. Six measurements of the gravel pore volume were made using the gravel from the two test gardens, and changing the position of the gravel each time. The porosity was determined as the ratio between the volume of the pores, e.g. the added water volume, and the total volume of the container. The pore volume of the gravel layer was then calculated using Equation 2. The total pore volume of the center core and bottom gravel layer was then calculated by adding the two pore volumes of the center core and the bottom gravel layer.
5.5.2 Plant soil The porosity in the plant soil was determined for two reasons: to determine the water storage capacity and to be able to estimate the uptake of water in the plant soil. In order to determine the porosity, three soil samples were collected from each of the five vertical gardens in the sector 27 and from the two newly built test gardens at CREPA. Before taking the samples, the
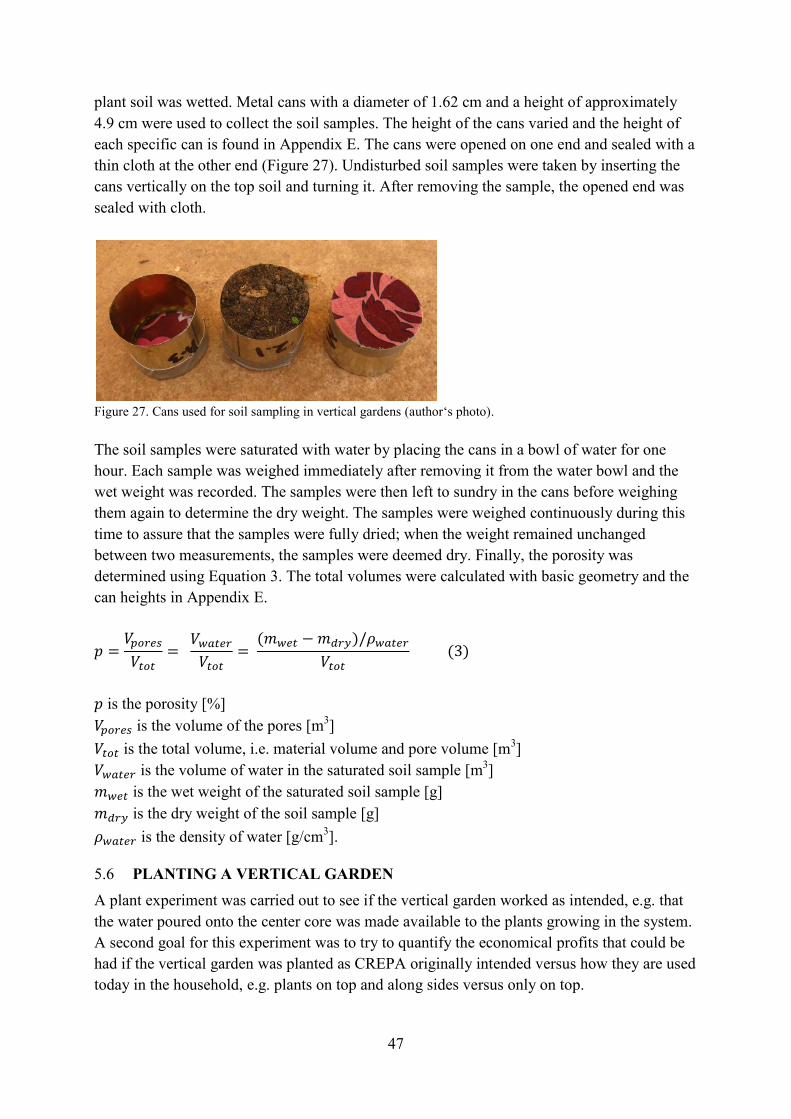
47
plant soil was wetted. Metal cans with a diameter of 1.62 cm and a height of approximately 4.9 cm were used to collect the soil samples. The height of the cans varied and the height of each specific can is found in Appendix E. The cans were opened on one end and sealed with a thin cloth at the other end (Figure 27). Undisturbed soil samples were taken by inserting the cans vertically on the top soil and turning it. After removing the sample, the opened end was sealed with cloth.
Figure 27. Cans used for soil sampling in vertical gardens (author‘s photo). The soil samples were saturated with water by placing the cans in a bowl of water for one hour. Each sample was weighed immediately after removing it from the water bowl and the wet weight was recorded. The samples were then left to sundry in the cans before weighing them again to determine the dry weight. The samples were weighed continuously during this time to assure that the samples were fully dried; when the weight remained unchanged between two measurements, the samples were deemed dry. Finally, the porosity was determined using Equation 3. The total volumes were calculated with basic geometry and the can heights in Appendix E.
is the porosity [%] is the volume of the pores [m3] is the total volume, i.e. material volume and pore volume [m3] is the volume of water in the saturated soil sample [m3] is the wet weight of the saturated soil sample [g] is the dry weight of the soil sample [g] is the density of water [g/cm3].
5.6 PLANTING A VERTICAL GARDEN A plant experiment was carried out to see if the vertical garden worked as intended, e.g. that the water poured onto the center core was made available to the plants growing in the system. A second goal for this experiment was to try to quantify the economical profits that could be had if the vertical garden was planted as CREPA originally intended versus how they are used today in the household, e.g. plants on top and along sides versus only on top.
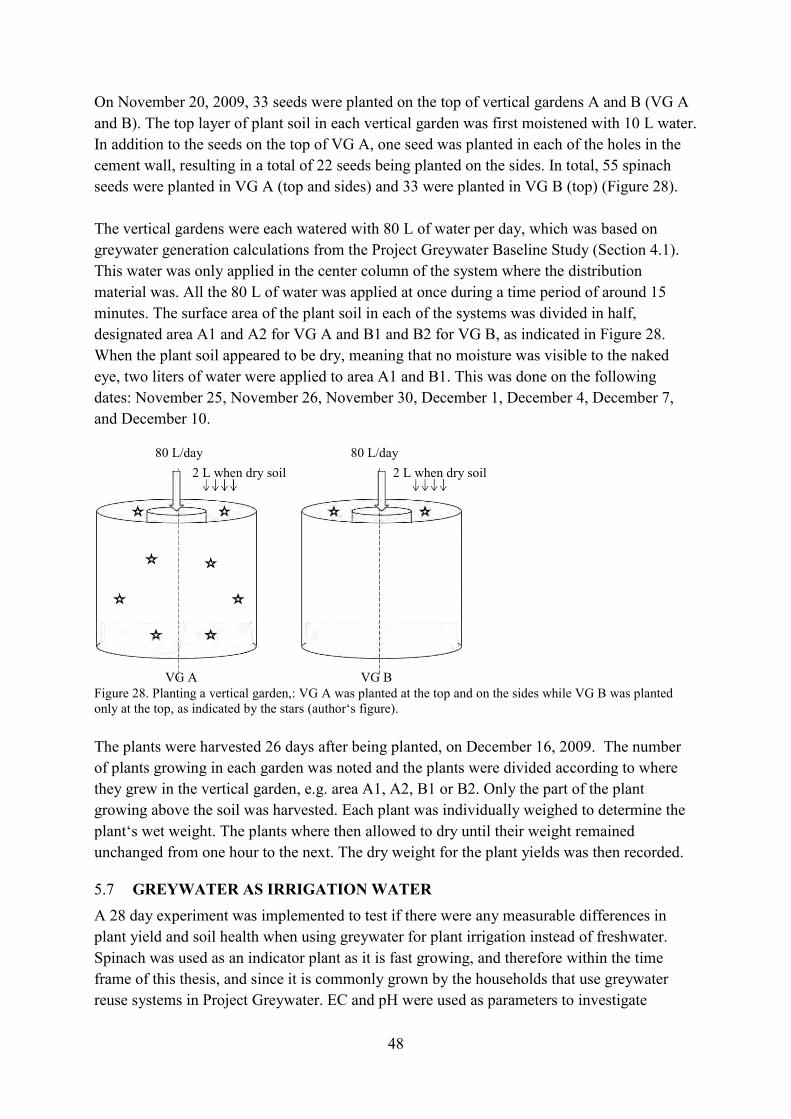
48
On November 20, 2009, 33 seeds were planted on the top of vertical gardens A and B (VG A and B). The top layer of plant soil in each vertical garden was first moistened with 10 L water. In addition to the seeds on the top of VG A, one seed was planted in each of the holes in the cement wall, resulting in a total of 22 seeds being planted on the sides. In total, 55 spinach seeds were planted in VG A (top and sides) and 33 were planted in VG B (top) (Figure 28). The vertical gardens were each watered with 80 L of water per day, which was based on greywater generation calculations from the Project Greywater Baseline Study (Section 4.1). This water was only applied in the center column of the system where the distribution material was. All the 80 L of water was applied at once during a time period of around 15 minutes. The surface area of the plant soil in each of the systems was divided in half, designated area A1 and A2 for VG A and B1 and B2 for VG B, as indicated in Figure 28. When the plant soil appeared to be dry, meaning that no moisture was visible to the naked eye, two liters of water were applied to area A1 and B1. This was done on the following dates: November 25, November 26, November 30, December 1, December 4, December 7, and December 10.
Figure 28. Planting a vertical garden,: VG A was planted at the top and on the sides while VG B was planted only at the top, as indicated by the stars (author‘s figure). The plants were harvested 26 days after being planted, on December 16, 2009. The number of plants growing in each garden was noted and the plants were divided according to where they grew in the vertical garden, e.g. area A1, A2, B1 or B2. Only the part of the plant growing above the soil was harvested. Each plant was individually weighed to determine the plant‘s wet weight. The plants where then allowed to dry until their weight remained unchanged from one hour to the next. The dry weight for the plant yields was then recorded.
5.7 GREYWATER AS IRRIGATION WATER A 28 day experiment was implemented to test if there were any measurable differences in plant yield and soil health when using greywater for plant irrigation instead of freshwater. Spinach was used as an indicator plant as it is fast growing, and therefore within the time frame of this thesis, and since it is commonly grown by the households that use greywater reuse systems in Project Greywater. EC and pH were used as parameters to investigate
VG A VG B
80 L/day 80 L/day 2 L when dry soil 2 L when dry soil
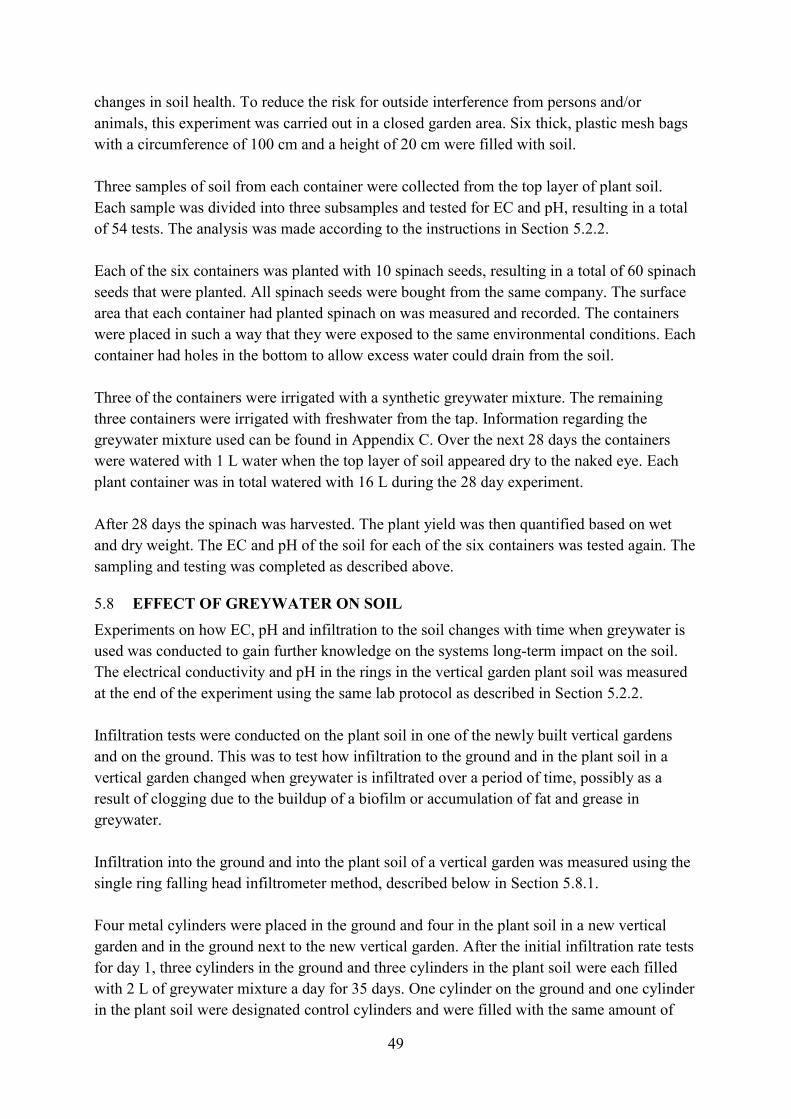
49
changes in soil health. To reduce the risk for outside interference from persons and/or animals, this experiment was carried out in a closed garden area. Six thick, plastic mesh bags with a circumference of 100 cm and a height of 20 cm were filled with soil. Three samples of soil from each container were collected from the top layer of plant soil. Each sample was divided into three subsamples and tested for EC and pH, resulting in a total of 54 tests. The analysis was made according to the instructions in Section 5.2.2. Each of the six containers was planted with 10 spinach seeds, resulting in a total of 60 spinach seeds that were planted. All spinach seeds were bought from the same company. The surface area that each container had planted spinach on was measured and recorded. The containers were placed in such a way that they were exposed to the same environmental conditions. Each container had holes in the bottom to allow excess water could drain from the soil. Three of the containers were irrigated with a synthetic greywater mixture. The remaining three containers were irrigated with freshwater from the tap. Information regarding the greywater mixture used can be found in Appendix C. Over the next 28 days the containers were watered with 1 L water when the top layer of soil appeared dry to the naked eye. Each plant container was in total watered with 16 L during the 28 day experiment. After 28 days the spinach was harvested. The plant yield was then quantified based on wet and dry weight. The EC and pH of the soil for each of the six containers was tested again. The sampling and testing was completed as described above.
5.8 EFFECT OF GREYWATER ON SOIL Experiments on how EC, pH and infiltration to the soil changes with time when greywater is used was conducted to gain further knowledge on the systems long-term impact on the soil. The electrical conductivity and pH in the rings in the vertical garden plant soil was measured at the end of the experiment using the same lab protocol as described in Section 5.2.2. Infiltration tests were conducted on the plant soil in one of the newly built vertical gardens and on the ground. This was to test how infiltration to the ground and in the plant soil in a vertical garden changed when greywater is infiltrated over a period of time, possibly as a result of clogging due to the buildup of a biofilm or accumulation of fat and grease in greywater. Infiltration into the ground and into the plant soil of a vertical garden was measured using the single ring falling head infiltrometer method, described below in Section 5.8.1. Four metal cylinders were placed in the ground and four in the plant soil in a new vertical garden and in the ground next to the new vertical garden. After the initial infiltration rate tests for day 1, three cylinders in the ground and three cylinders in the plant soil were each filled with 2 L of greywater mixture a day for 35 days. One cylinder on the ground and one cylinder in the plant soil were designated control cylinders and were filled with the same amount of
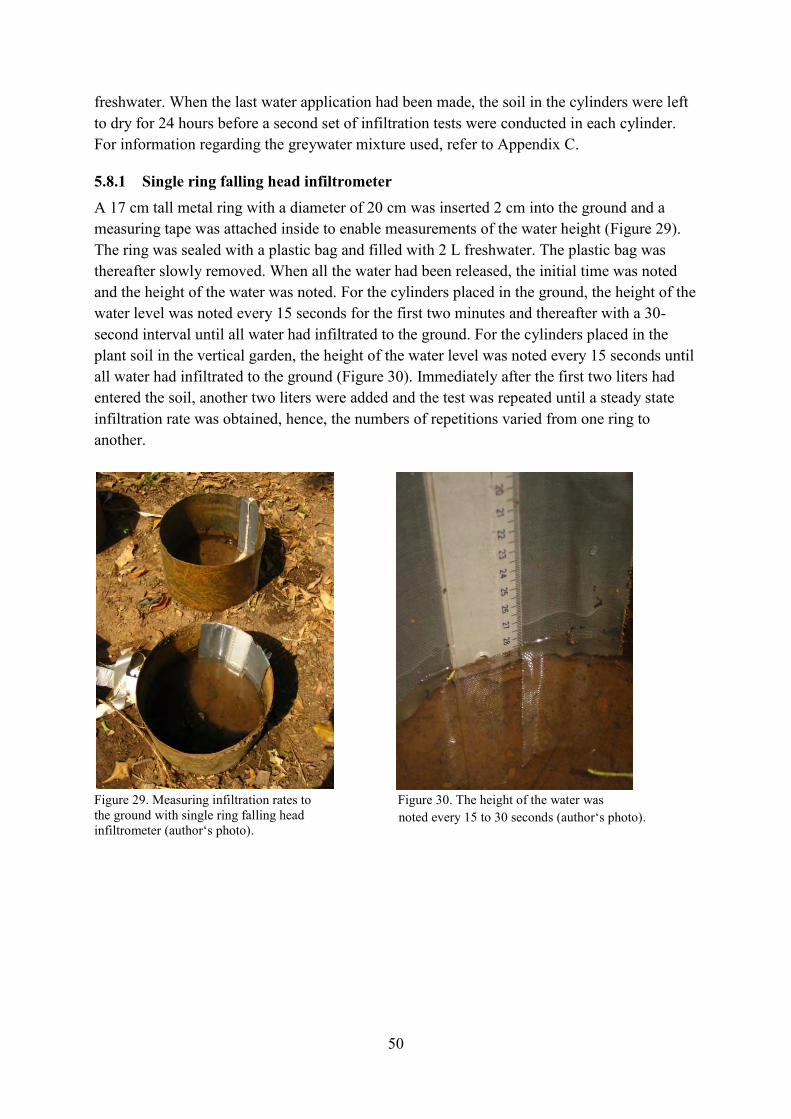
50
freshwater. When the last water application had been made, the soil in the cylinders were left to dry for 24 hours before a second set of infiltration tests were conducted in each cylinder. For information regarding the greywater mixture used, refer to Appendix C.
5.8.1 Single ring falling head infiltrometer A 17 cm tall metal ring with a diameter of 20 cm was inserted 2 cm into the ground and a measuring tape was attached inside to enable measurements of the water height (Figure 29). The ring was sealed with a plastic bag and filled with 2 L freshwater. The plastic bag was thereafter slowly removed. When all the water had been released, the initial time was noted and the height of the water was noted. For the cylinders placed in the ground, the height of the water level was noted every 15 seconds for the first two minutes and thereafter with a 30-second interval until all water had infiltrated to the ground. For the cylinders placed in the plant soil in the vertical garden, the height of the water level was noted every 15 seconds until all water had infiltrated to the ground (Figure 30). Immediately after the first two liters had entered the soil, another two liters were added and the test was repeated until a steady state infiltration rate was obtained, hence, the numbers of repetitions varied from one ring to another.
Figure 29. Measuring infiltration rates to the ground with single ring falling head infiltrometer (author‘s photo).
Figure 30. The height of the water was noted every 15 to 30 seconds (author‘s photo).
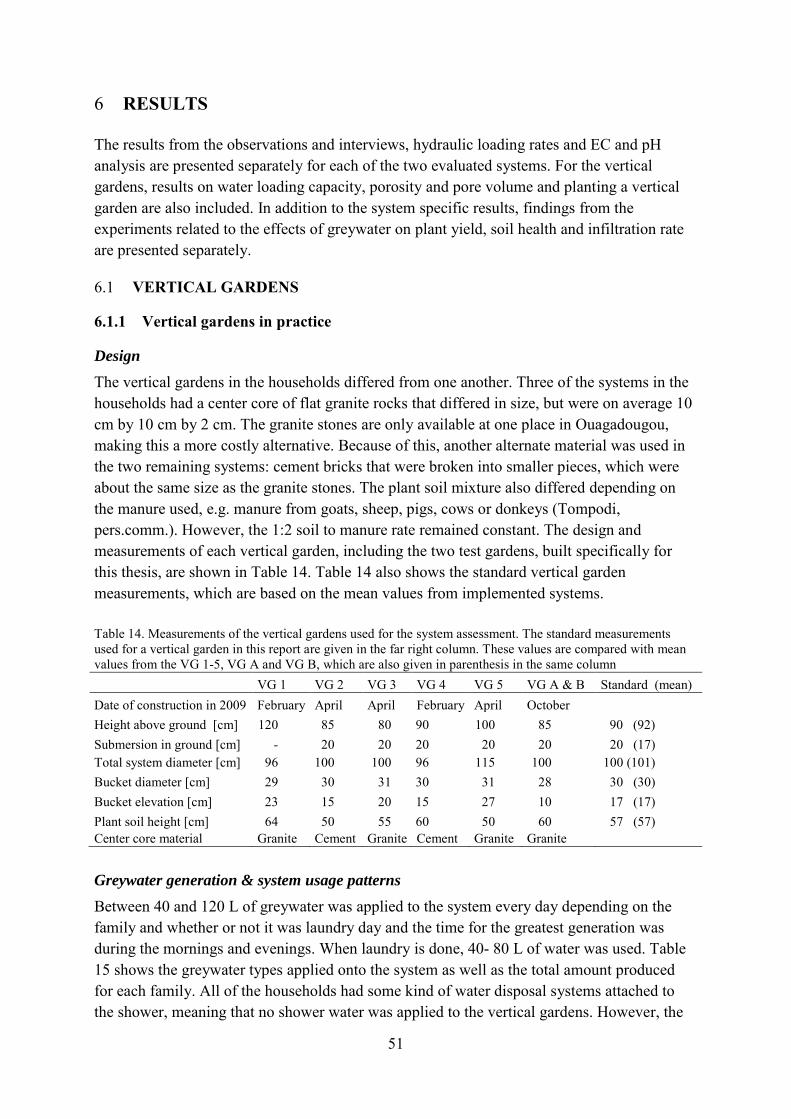
51
6 RESULTS The results from the observations and interviews, hydraulic loading rates and EC and pH analysis are presented separately for each of the two evaluated systems. For the vertical gardens, results on water loading capacity, porosity and pore volume and planting a vertical garden are also included. In addition to the system specific results, findings from the experiments related to the effects of greywater on plant yield, soil health and infiltration rate are presented separately.
6.1 VERTICAL GARDENS
6.1.1 Vertical gardens in practice
Design
The vertical gardens in the households differed from one another. Three of the systems in the households had a center core of flat granite rocks that differed in size, but were on average 10 cm by 10 cm by 2 cm. The granite stones are only available at one place in Ouagadougou, making this a more costly alternative. Because of this, another alternate material was used in the two remaining systems: cement bricks that were broken into smaller pieces, which were about the same size as the granite stones. The plant soil mixture also differed depending on the manure used, e.g. manure from goats, sheep, pigs, cows or donkeys (Tompodi, pers.comm.). However, the 1:2 soil to manure rate remained constant. The design and measurements of each vertical garden, including the two test gardens, built specifically for this thesis, are shown in Table 14. Table 14 also shows the standard vertical garden measurements, which are based on the mean values from implemented systems. Table 14. Measurements of the vertical gardens used for the system assessment. The standard measurements used for a vertical garden in this report are given in the far right column. These values are compared with mean values from the VG 1-5, VG A and VG B, which are also given in parenthesis in the same column
VG 1 VG 2 VG 3 VG 4 VG 5 VG A & B Standard (mean)
Date of construction in 2009 February April April February April October Height above ground [cm] 120 85 80 90 100 85 90 (92)
Submersion in ground [cm] - 20 20 20 20 20 20 (17) Total system diameter [cm] 96 100 100 96 115 100 100 (101) Bucket diameter [cm] 29 30 31 30 31 28 30 (30) Bucket elevation [cm] 23 15 20 15 27 10 17 (17) Plant soil height [cm] 64 50 55 60 50 60 57 (57) Center core material Granite Cement Granite Cement Granite Granite
Greywater generation & system usage patterns
Between 40 and 120 L of greywater was applied to the system every day depending on the family and whether or not it was laundry day and the time for the greatest generation was during the mornings and evenings. When laundry is done, 40- 80 L of water was used. Table 15 shows the greywater types applied onto the system as well as the total amount produced for each family. All of the households had some kind of water disposal systems attached to the shower, meaning that no shower water was applied to the vertical gardens. However, the
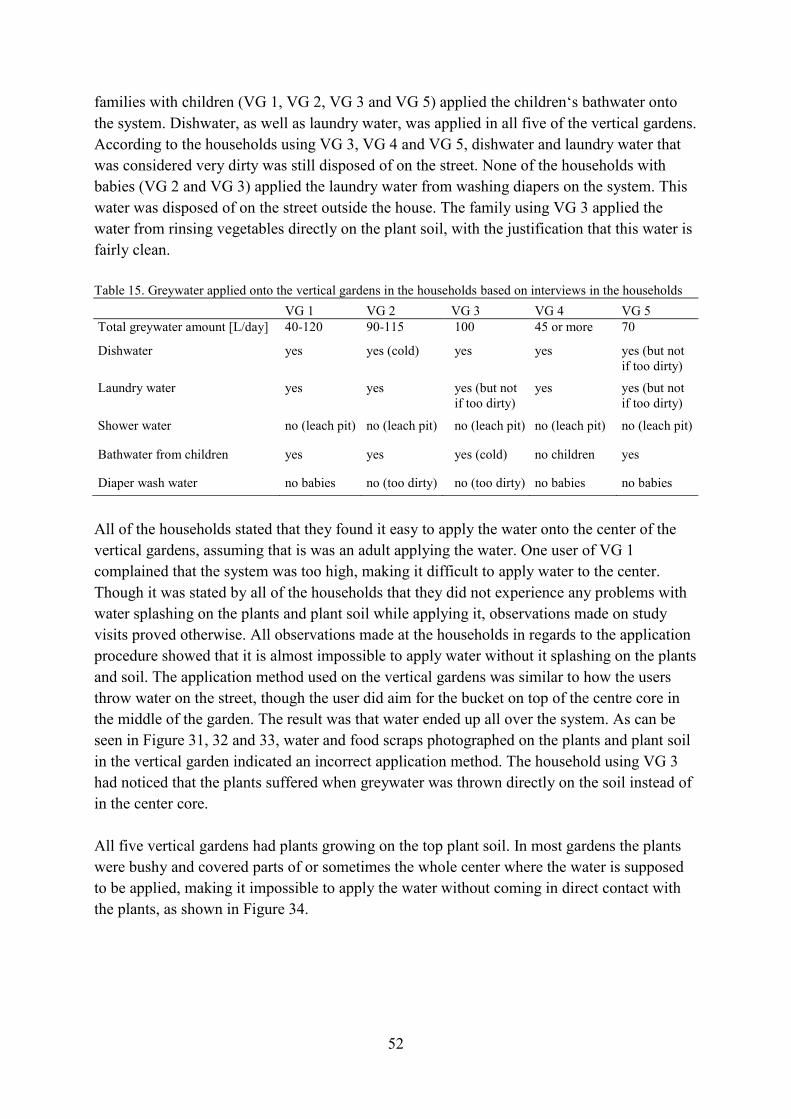
52
families with children (VG 1, VG 2, VG 3 and VG 5) applied the children‘s bathwater onto the system. Dishwater, as well as laundry water, was applied in all five of the vertical gardens. According to the households using VG 3, VG 4 and VG 5, dishwater and laundry water that was considered very dirty was still disposed of on the street. None of the households with babies (VG 2 and VG 3) applied the laundry water from washing diapers on the system. This water was disposed of on the street outside the house. The family using VG 3 applied the water from rinsing vegetables directly on the plant soil, with the justification that this water is fairly clean. Table 15. Greywater applied onto the vertical gardens in the households based on interviews in the households VG 1 VG 2 VG 3 VG 4 VG 5 Total greywater amount [L/day] 40-120 90-115 100 45 or more 70
Dishwater yes yes (cold) yes yes yes (but not if too dirty)
Laundry water yes yes yes (but not if too dirty)
yes yes (but not if too dirty)
Shower water no (leach pit) no (leach pit) no (leach pit) no (leach pit) no (leach pit)
Bathwater from children yes yes yes (cold) no children yes
Diaper wash water no babies no (too dirty) no (too dirty) no babies no babies
All of the households stated that they found it easy to apply the water onto the center of the vertical gardens, assuming that is was an adult applying the water. One user of VG 1 complained that the system was too high, making it difficult to apply water to the center. Though it was stated by all of the households that they did not experience any problems with water splashing on the plants and plant soil while applying it, observations made on study visits proved otherwise. All observations made at the households in regards to the application procedure showed that it is almost impossible to apply water without it splashing on the plants and soil. The application method used on the vertical gardens was similar to how the users throw water on the street, though the user did aim for the bucket on top of the centre core in the middle of the garden. The result was that water ended up all over the system. As can be seen in Figure 31, 32 and 33, water and food scraps photographed on the plants and plant soil in the vertical garden indicated an incorrect application method. The household using VG 3 had noticed that the plants suffered when greywater was thrown directly on the soil instead of in the center core. All five vertical gardens had plants growing on the top plant soil. In most gardens the plants were bushy and covered parts of or sometimes the whole center where the water is supposed to be applied, making it impossible to apply the water without coming in direct contact with the plants, as shown in Figure 34.
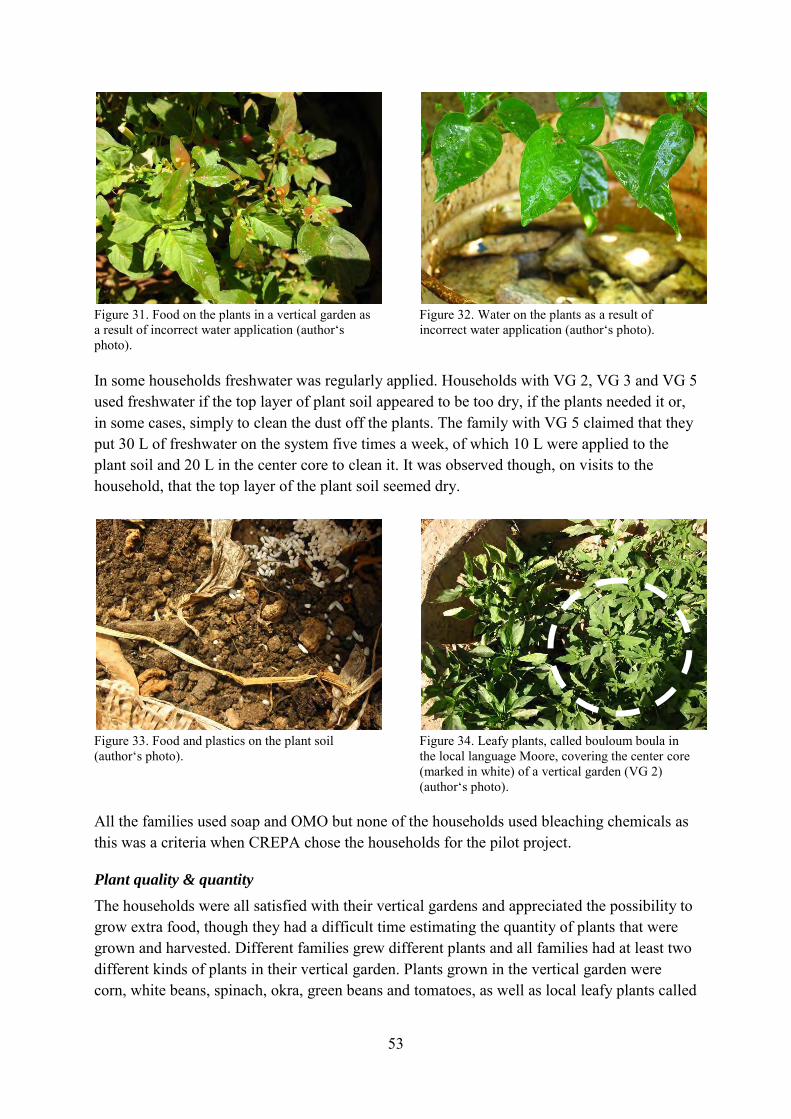
53
Figure 31. Food on the plants in a vertical garden as a result of incorrect water application (author‘s photo).
Figure 32. Water on the plants as a result of incorrect water application (author‘s photo).
In some households freshwater was regularly applied. Households with VG 2, VG 3 and VG 5 used freshwater if the top layer of plant soil appeared to be too dry, if the plants needed it or, in some cases, simply to clean the dust off the plants. The family with VG 5 claimed that they put 30 L of freshwater on the system five times a week, of which 10 L were applied to the plant soil and 20 L in the center core to clean it. It was observed though, on visits to the household, that the top layer of the plant soil seemed dry.
Figure 33. Food and plastics on the plant soil (author‘s photo).
Figure 34. Leafy plants, called bouloum boula in the local language Moore, covering the center core (marked in white) of a vertical garden (VG 2) (author‘s photo).
All the families used soap and OMO but none of the households used bleaching chemicals as this was a criteria when CREPA chose the households for the pilot project.
Plant quality & quantity
The households were all satisfied with their vertical gardens and appreciated the possibility to grow extra food, though they had a difficult time estimating the quantity of plants that were grown and harvested. Different families grew different plants and all families had at least two different kinds of plants in their vertical garden. Plants grown in the vertical garden were corn, white beans, spinach, okra, green beans and tomatoes, as well as local leafy plants called
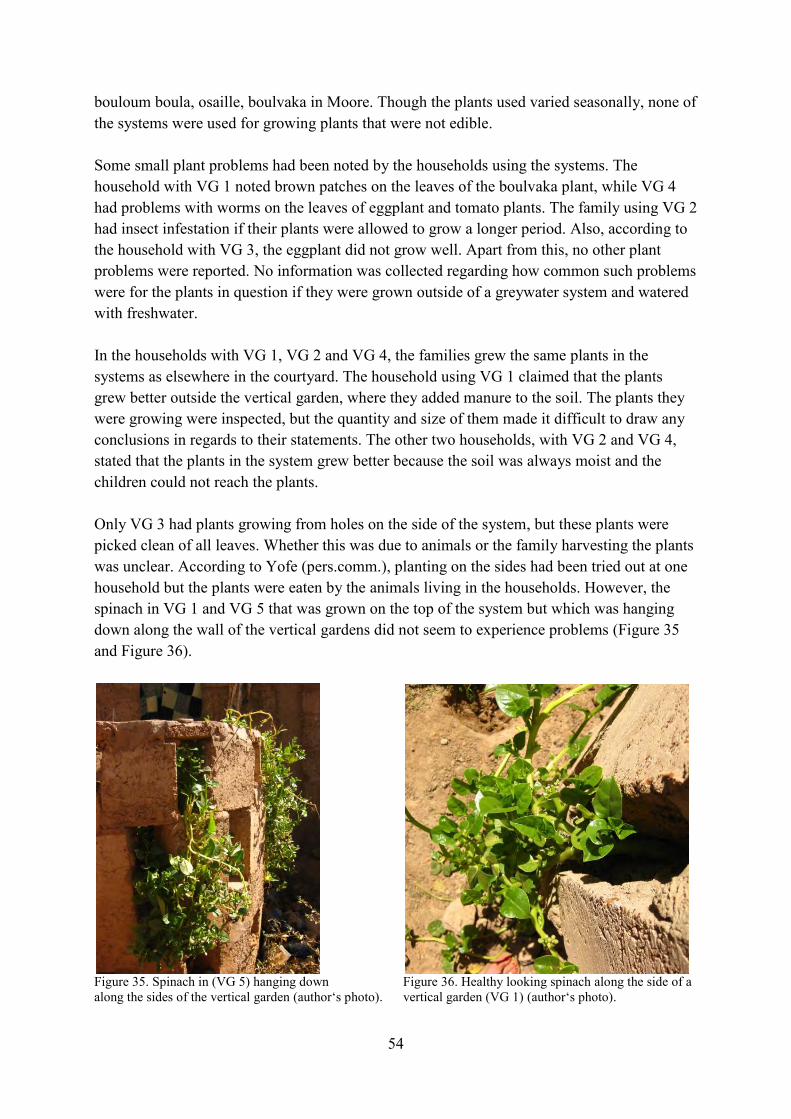
54
bouloum boula, osaille, boulvaka in Moore. Though the plants used varied seasonally, none of the systems were used for growing plants that were not edible. Some small plant problems had been noted by the households using the systems. The household with VG 1 noted brown patches on the leaves of the boulvaka plant, while VG 4 had problems with worms on the leaves of eggplant and tomato plants. The family using VG 2 had insect infestation if their plants were allowed to grow a longer period. Also, according to the household with VG 3, the eggplant did not grow well. Apart from this, no other plant problems were reported. No information was collected regarding how common such problems were for the plants in question if they were grown outside of a greywater system and watered with freshwater. In the households with VG 1, VG 2 and VG 4, the families grew the same plants in the systems as elsewhere in the courtyard. The household using VG 1 claimed that the plants grew better outside the vertical garden, where they added manure to the soil. The plants they were growing were inspected, but the quantity and size of them made it difficult to draw any conclusions in regards to their statements. The other two households, with VG 2 and VG 4, stated that the plants in the system grew better because the soil was always moist and the children could not reach the plants. Only VG 3 had plants growing from holes on the side of the system, but these plants were picked clean of all leaves. Whether this was due to animals or the family harvesting the plants was unclear. According to Yofe (pers.comm.), planting on the sides had been tried out at one household but the plants were eaten by the animals living in the households. However, the spinach in VG 1 and VG 5 that was grown on the top of the system but which was hanging down along the wall of the vertical gardens did not seem to experience problems (Figure 35 and Figure 36).
Figure 35. Spinach in (VG 5) hanging down along the sides of the vertical garden (author‘s photo).
Figure 36. Healthy looking spinach along the side of a vertical garden (VG 1) (author‘s photo).
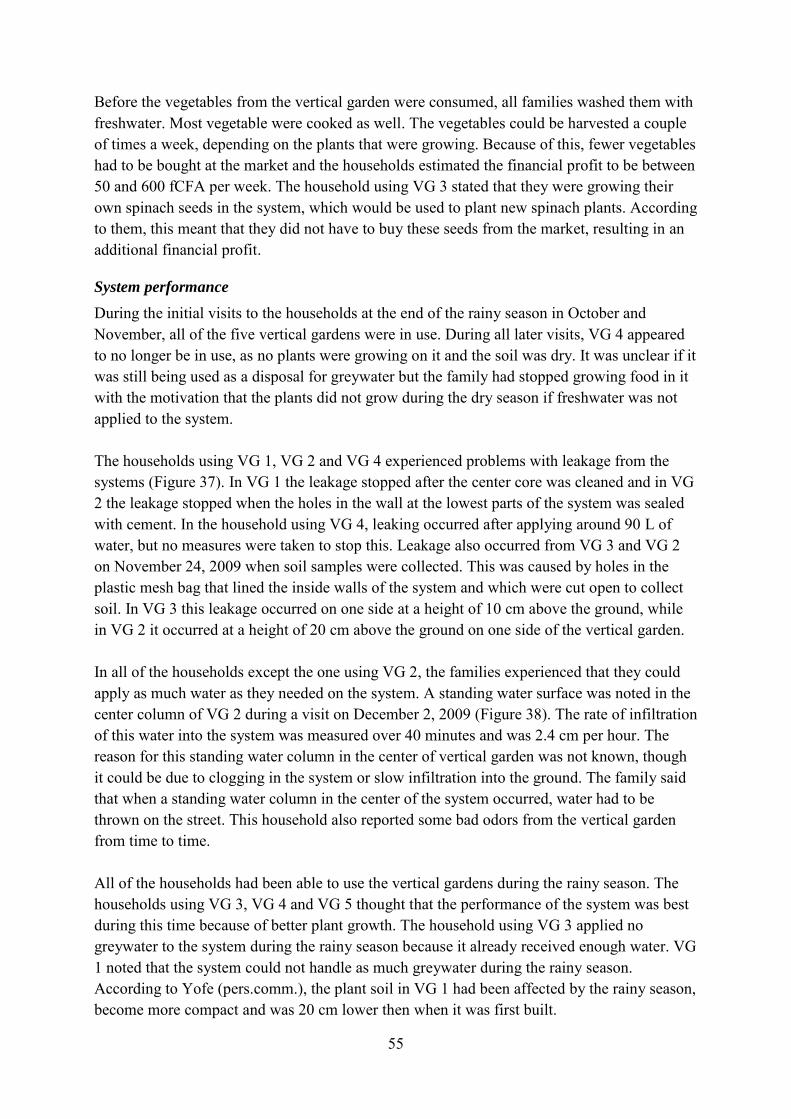
55
Before the vegetables from the vertical garden were consumed, all families washed them with freshwater. Most vegetable were cooked as well. The vegetables could be harvested a couple of times a week, depending on the plants that were growing. Because of this, fewer vegetables had to be bought at the market and the households estimated the financial profit to be between 50 and 600 fCFA per week. The household using VG 3 stated that they were growing their own spinach seeds in the system, which would be used to plant new spinach plants. According to them, this meant that they did not have to buy these seeds from the market, resulting in an additional financial profit.
System performance
During the initial visits to the households at the end of the rainy season in October and November, all of the five vertical gardens were in use. During all later visits, VG 4 appeared to no longer be in use, as no plants were growing on it and the soil was dry. It was unclear if it was still being used as a disposal for greywater but the family had stopped growing food in it with the motivation that the plants did not grow during the dry season if freshwater was not applied to the system. The households using VG 1, VG 2 and VG 4 experienced problems with leakage from the systems (Figure 37). In VG 1 the leakage stopped after the center core was cleaned and in VG 2 the leakage stopped when the holes in the wall at the lowest parts of the system was sealed with cement. In the household using VG 4, leaking occurred after applying around 90 L of water, but no measures were taken to stop this. Leakage also occurred from VG 3 and VG 2 on November 24, 2009 when soil samples were collected. This was caused by holes in the plastic mesh bag that lined the inside walls of the system and which were cut open to collect soil. In VG 3 this leakage occurred on one side at a height of 10 cm above the ground, while in VG 2 it occurred at a height of 20 cm above the ground on one side of the vertical garden. In all of the households except the one using VG 2, the families experienced that they could apply as much water as they needed on the system. A standing water surface was noted in the center column of VG 2 during a visit on December 2, 2009 (Figure 38). The rate of infiltration of this water into the system was measured over 40 minutes and was 2.4 cm per hour. The reason for this standing water column in the center of vertical garden was not known, though it could be due to clogging in the system or slow infiltration into the ground. The family said that when a standing water column in the center of the system occurred, water had to be thrown on the street. This household also reported some bad odors from the vertical garden from time to time. All of the households had been able to use the vertical gardens during the rainy season. The households using VG 3, VG 4 and VG 5 thought that the performance of the system was best during this time because of better plant growth. The household using VG 3 applied no greywater to the system during the rainy season because it already received enough water. VG 1 noted that the system could not handle as much greywater during the rainy season. According to Yofe (pers.comm.), the plant soil in VG 1 had been affected by the rainy season, become more compact and was 20 cm lower then when it was first built.
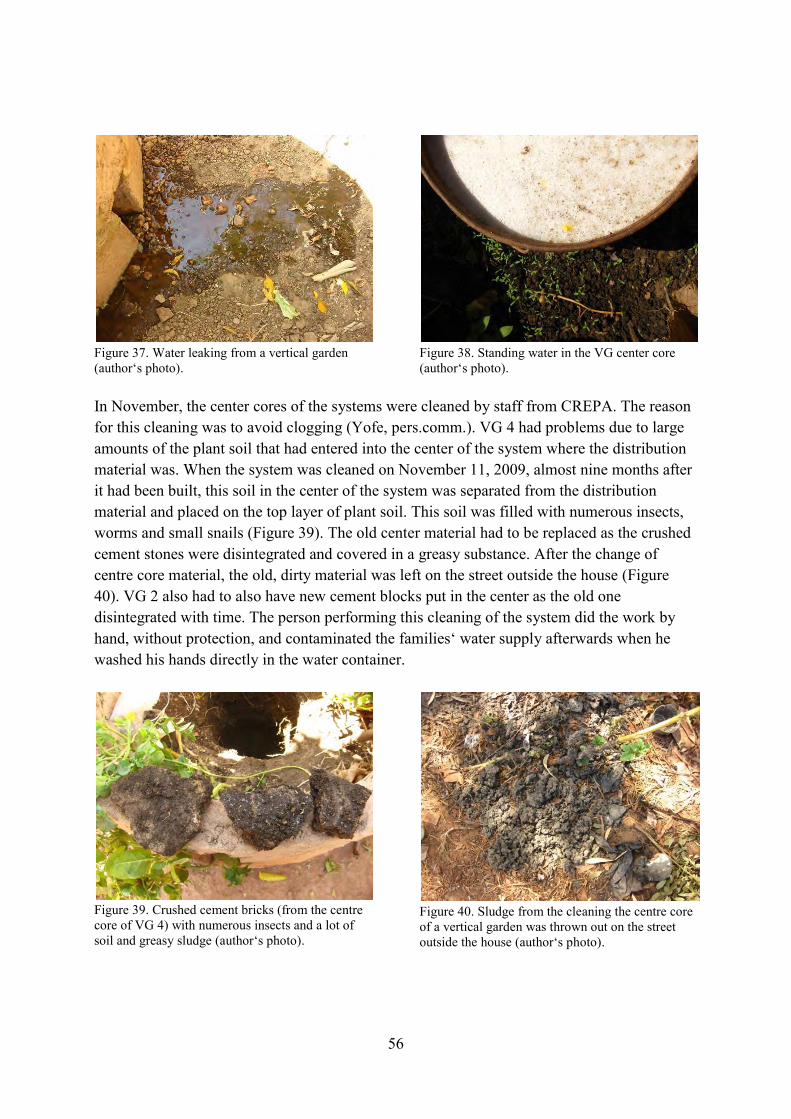
56
Figure 37. Water leaking from a vertical garden (author‘s photo).
Figure 38. Standing water in the VG center core (author‘s photo).
In November, the center cores of the systems were cleaned by staff from CREPA. The reason for this cleaning was to avoid clogging (Yofe, pers.comm.). VG 4 had problems due to large amounts of the plant soil that had entered into the center of the system where the distribution material was. When the system was cleaned on November 11, 2009, almost nine months after it had been built, this soil in the center of the system was separated from the distribution material and placed on the top layer of plant soil. This soil was filled with numerous insects, worms and small snails (Figure 39). The old center material had to be replaced as the crushed cement stones were disintegrated and covered in a greasy substance. After the change of centre core material, the old, dirty material was left on the street outside the house (Figure 40). VG 2 also had to also have new cement blocks put in the center as the old one disintegrated with time. The person performing this cleaning of the system did the work by hand, without protection, and contaminated the families‘ water supply afterwards when he washed his hands directly in the water container.
Figure 39. Crushed cement bricks (from the centre core of VG 4) with numerous insects and a lot of soil and greasy sludge (author‘s photo).
Figure 40. Sludge from the cleaning the centre core of a vertical garden was thrown out on the street outside the house (author‘s photo).
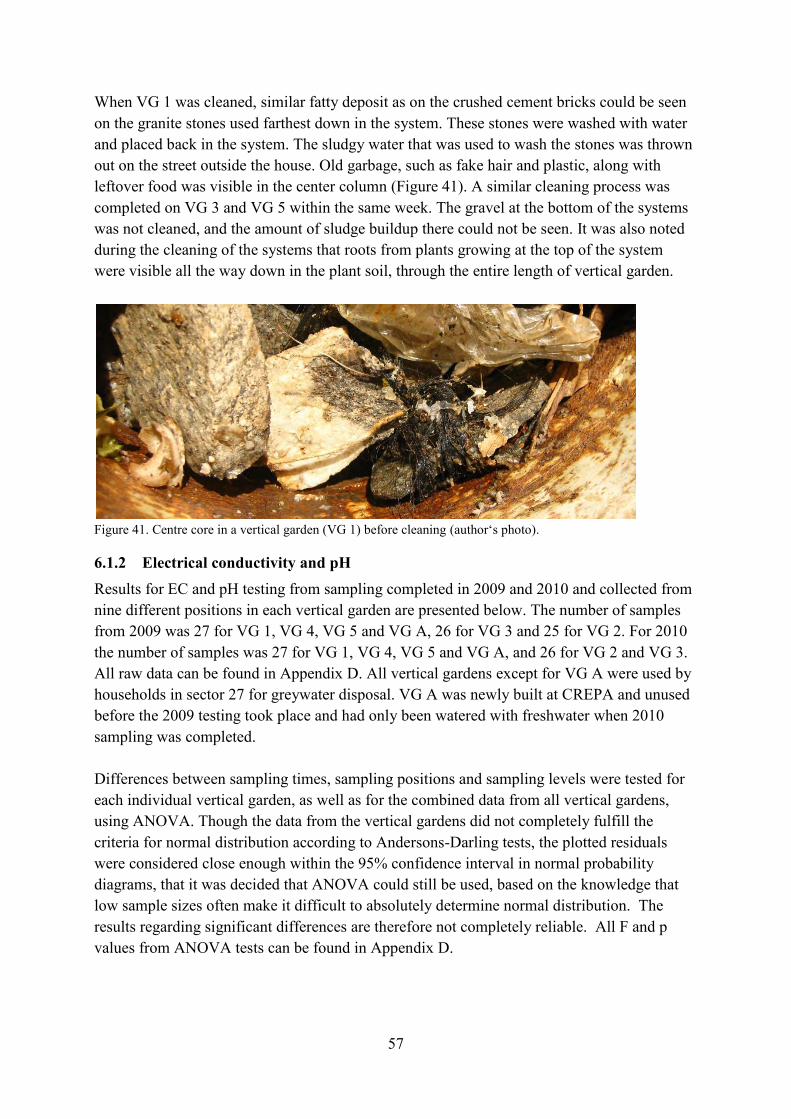
57
When VG 1 was cleaned, similar fatty deposit as on the crushed cement bricks could be seen on the granite stones used farthest down in the system. These stones were washed with water and placed back in the system. The sludgy water that was used to wash the stones was thrown out on the street outside the house. Old garbage, such as fake hair and plastic, along with leftover food was visible in the center column (Figure 41). A similar cleaning process was completed on VG 3 and VG 5 within the same week. The gravel at the bottom of the systems was not cleaned, and the amount of sludge buildup there could not be seen. It was also noted during the cleaning of the systems that roots from plants growing at the top of the system were visible all the way down in the plant soil, through the entire length of vertical garden.
Figure 41. Centre core in a vertical garden (VG 1) before cleaning (author‘s photo).
6.1.2 Electrical conductivity and pH Results for EC and pH testing from sampling completed in 2009 and 2010 and collected from nine different positions in each vertical garden are presented below. The number of samples from 2009 was 27 for VG 1, VG 4, VG 5 and VG A, 26 for VG 3 and 25 for VG 2. For 2010 the number of samples was 27 for VG 1, VG 4, VG 5 and VG A, and 26 for VG 2 and VG 3. All raw data can be found in Appendix D. All vertical gardens except for VG A were used by households in sector 27 for greywater disposal. VG A was newly built at CREPA and unused before the 2009 testing took place and had only been watered with freshwater when 2010 sampling was completed. Differences between sampling times, sampling positions and sampling levels were tested for each individual vertical garden, as well as for the combined data from all vertical gardens, using ANOVA. Though the data from the vertical gardens did not completely fulfill the criteria for normal distribution according to Andersons-Darling tests, the plotted residuals were considered close enough within the 95% confidence interval in normal probability diagrams, that it was decided that ANOVA could still be used, based on the knowledge that low sample sizes often make it difficult to absolutely determine normal distribution. The results regarding significant differences are therefore not completely reliable. All F and p values from ANOVA tests can be found in Appendix D.
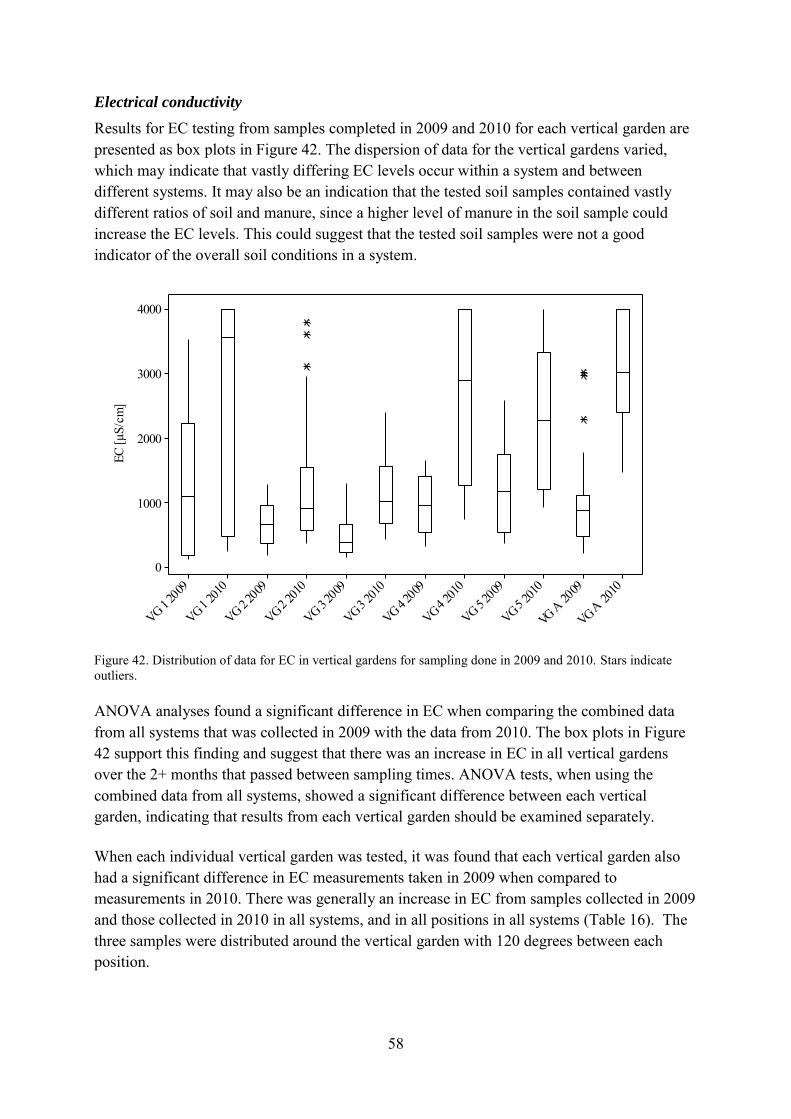
58
Electrical conductivity
Results for EC testing from samples completed in 2009 and 2010 for each vertical garden are presented as box plots in Figure 42. The dispersion of data for the vertical gardens varied, which may indicate that vastly differing EC levels occur within a system and between different systems. It may also be an indication that the tested soil samples contained vastly different ratios of soil and manure, since a higher level of manure in the soil sample could increase the EC levels. This could suggest that the tested soil samples were not a good indicator of the overall soil conditions in a system.
VG A 20
10
VG A 20
09
VG 5 2010
VG 5 2009
VG 4 2010
VG 4 2009
VG 3 2010
VG 3 2009
VG 2 2010
VG 2 2009
VG 1 2010
VG 1 2009
4000
3000
2000
1000
0
EC [µ
S/cm
]
Figure 42. Distribution of data for EC in vertical gardens for sampling done in 2009 and 2010. Stars indicate outliers.
ANOVA analyses found a significant difference in EC when comparing the combined data from all systems that was collected in 2009 with the data from 2010. The box plots in Figure 42 support this finding and suggest that there was an increase in EC in all vertical gardens over the 2+ months that passed between sampling times. ANOVA tests, when using the combined data from all systems, showed a significant difference between each vertical garden, indicating that results from each vertical garden should be examined separately.
When each individual vertical garden was tested, it was found that each vertical garden also had a significant difference in EC measurements taken in 2009 when compared to measurements in 2010. There was generally an increase in EC from samples collected in 2009 and those collected in 2010 in all systems, and in all positions in all systems (Table 16). The three samples were distributed around the vertical garden with 120 degrees between each position.
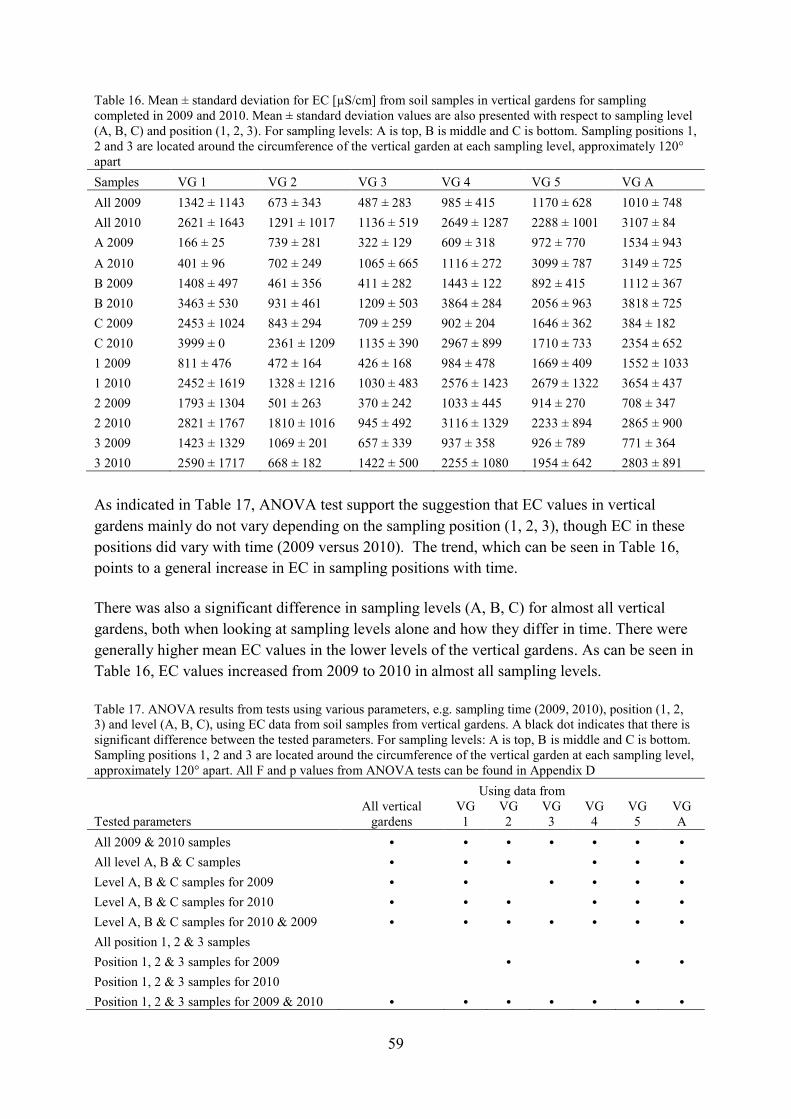
59
Table 16. Mean ± standard deviation for EC [µS/cm] from soil samples in vertical gardens for sampling completed in 2009 and 2010. Mean ± standard deviation values are also presented with respect to sampling level (A, B, C) and position (1, 2, 3). For sampling levels: A is top, B is middle and C is bottom. Sampling positions 1, 2 and 3 are located around the circumference of the vertical garden at each sampling level, approximately 120° apart Samples VG 1 VG 2 VG 3 VG 4 VG 5 VG A All 2009 1342 ± 1143 673 ± 343 487 ± 283 985 ± 415 1170 ± 628 1010 ± 748 All 2010 2621 ± 1643 1291 ± 1017 1136 ± 519 2649 ± 1287 2288 ± 1001 3107 ± 84 A 2009 166 ± 25 739 ± 281 322 ± 129 609 ± 318 972 ± 770 1534 ± 943 A 2010 401 ± 96 702 ± 249 1065 ± 665 1116 ± 272 3099 ± 787 3149 ± 725 B 2009 1408 ± 497 461 ± 356 411 ± 282 1443 ± 122 892 ± 415 1112 ± 367 B 2010 3463 ± 530 931 ± 461 1209 ± 503 3864 ± 284 2056 ± 963 3818 ± 725 C 2009 2453 ± 1024 843 ± 294 709 ± 259 902 ± 204 1646 ± 362 384 ± 182 C 2010 3999 ± 0 2361 ± 1209 1135 ± 390 2967 ± 899 1710 ± 733 2354 ± 652 1 2009 811 ± 476 472 ± 164 426 ± 168 984 ± 478 1669 ± 409 1552 ± 1033 1 2010 2452 ± 1619 1328 ± 1216 1030 ± 483 2576 ± 1423 2679 ± 1322 3654 ± 437 2 2009 1793 ± 1304 501 ± 263 370 ± 242 1033 ± 445 914 ± 270 708 ± 347 2 2010 2821 ± 1767 1810 ± 1016 945 ± 492 3116 ± 1329 2233 ± 894 2865 ± 900 3 2009 1423 ± 1329 1069 ± 201 657 ± 339 937 ± 358 926 ± 789 771 ± 364 3 2010 2590 ± 1717 668 ± 182 1422 ± 500 2255 ± 1080 1954 ± 642 2803 ± 891
As indicated in Table 17, ANOVA test support the suggestion that EC values in vertical gardens mainly do not vary depending on the sampling position (1, 2, 3), though EC in these positions did vary with time (2009 versus 2010). The trend, which can be seen in Table 16, points to a general increase in EC in sampling positions with time.
There was also a significant difference in sampling levels (A, B, C) for almost all vertical gardens, both when looking at sampling levels alone and how they differ in time. There were generally higher mean EC values in the lower levels of the vertical gardens. As can be seen in Table 16, EC values increased from 2009 to 2010 in almost all sampling levels.
Table 17. ANOVA results from tests using various parameters, e.g. sampling time (2009, 2010), position (1, 2, 3) and level (A, B, C), using EC data from soil samples from vertical gardens. A black dot indicates that there is significant difference between the tested parameters. For sampling levels: A is top, B is middle and C is bottom. Sampling positions 1, 2 and 3 are located around the circumference of the vertical garden at each sampling level, approximately 120° apart. All F and p values from ANOVA tests can be found in Appendix D
Using data from
Tested parameters All vertical
gardens VG 1
VG 2
VG 3
VG 4
VG 5
VG A
All 2009 & 2010 samples • • • • • • • All level A, B & C samples • • • • • • Level A, B & C samples for 2009 • • • • • • Level A, B & C samples for 2010 • • • • • • Level A, B & C samples for 2010 & 2009 • • • • • • • All position 1, 2 & 3 samples
Position 1, 2 & 3 samples for 2009 • • • Position 1, 2 & 3 samples for 2010
Position 1, 2 & 3 samples for 2009 & 2010 • • • • • • •
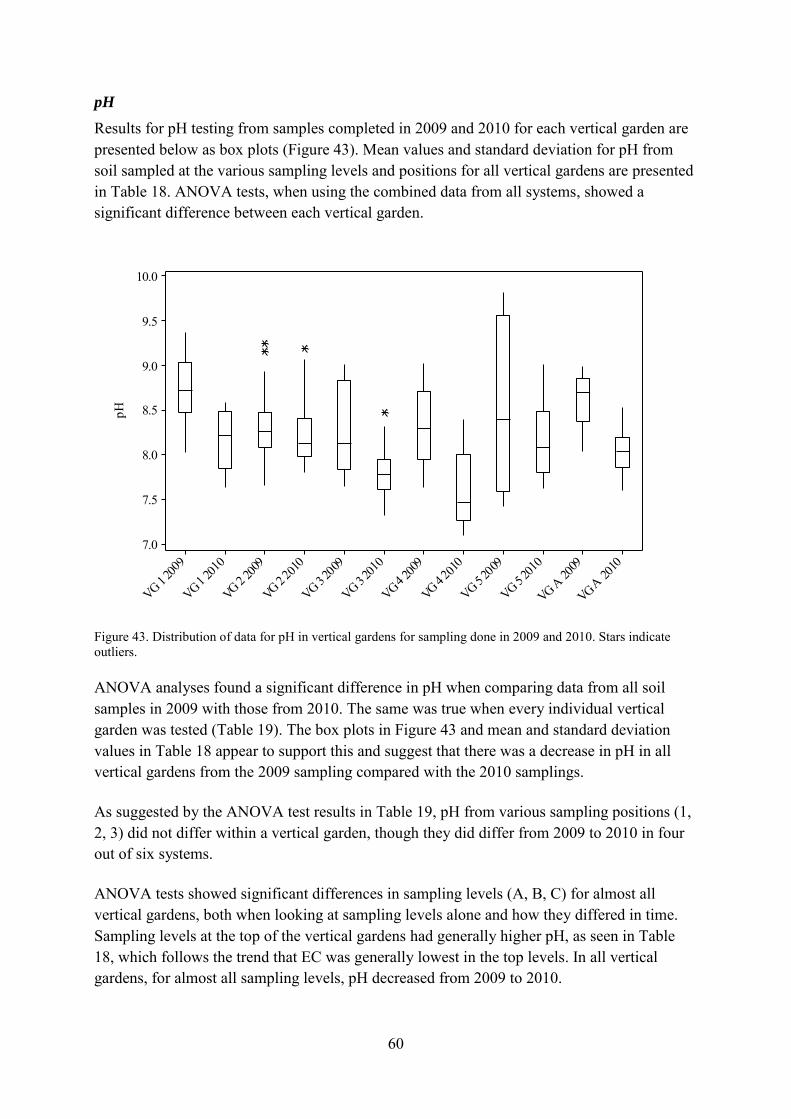
60
pH
Results for pH testing from samples completed in 2009 and 2010 for each vertical garden are presented below as box plots (Figure 43). Mean values and standard deviation for pH from soil sampled at the various sampling levels and positions for all vertical gardens are presented in Table 18. ANOVA tests, when using the combined data from all systems, showed a significant difference between each vertical garden.
VG A 20
10
VG A 20
09
VG 5 201
0
VG 5 2009
VG 4 201
0
VG 4 2009
VG 3 201
0
VG 3 2009
VG 2 201
0
VG 2 200
9
VG 1 2010
VG 1 200
9
10.0
9.5
9.0
8.5
8.0
7.5
7.0
pH
Figure 43. Distribution of data for pH in vertical gardens for sampling done in 2009 and 2010. Stars indicate outliers.
ANOVA analyses found a significant difference in pH when comparing data from all soil samples in 2009 with those from 2010. The same was true when every individual vertical garden was tested (Table 19). The box plots in Figure 43 and mean and standard deviation values in Table 18 appear to support this and suggest that there was a decrease in pH in all vertical gardens from the 2009 sampling compared with the 2010 samplings.
As suggested by the ANOVA test results in Table 19, pH from various sampling positions (1, 2, 3) did not differ within a vertical garden, though they did differ from 2009 to 2010 in four out of six systems.
ANOVA tests showed significant differences in sampling levels (A, B, C) for almost all vertical gardens, both when looking at sampling levels alone and how they differed in time. Sampling levels at the top of the vertical gardens had generally higher pH, as seen in Table 18, which follows the trend that EC was generally lowest in the top levels. In all vertical gardens, for almost all sampling levels, pH decreased from 2009 to 2010.

61
Table 18. Mean ± standard deviation for pH from soil samples in vertical gardens for sampling completed in 2009 and 2010. Mean ± standard deviation values are also presented with respect to sampling level (A, B, C) and position (1, 2, 3). For sampling levels: A is top, B is middle and C is bottom. Sampling positions 1, 2 and 3 are located around the circumference of the vertical garden at each sampling level, approximately 120° apart Samples VG 1 VG 2 VG 3 VG 4 VG 5 VG A All 2009 8.59 ± 0.42 8.21 ± 0.41 8.07 ± 0.50 8.16 ± 0.43 7.87 ± 1.14 8.53 ± 0.29 All 2010 8.06 ± 0.35 8.13 ± 0.41 7.73 ± 0.29 7.47 ± 0.46 8.02 ± 0.45 7.98 ± 0.24 A 2009 9.12 ± 0.15 7.96 ± 0.17 8.59 ± 0.30 8.69 ± 0.24 9.61 ± 0.13 8.59 ± 0.23 A 2010 8.42 ± 0.15 8.31 ± 0.51 7.90 ± 0.32 8.13 ± 0.17 8.31 ± 0.49 8.27 ± 0.12 B 2009 8.27 ± 0.21 8.35 ± 0.11 8.09 ± 0.52 7.85 ± 0.12 8.00 ± 0.71 8.87 ± 0.07 B 2010 7.76 ± 0.09 8.10 ± 0.23 7.61 ± 0.28 7.22 ± 0.08 8.07 ± 0.31 8.01 ± 0.09 C 2009 8.77 ± 0.18 8.48 ± 0.50 7.84 ± 0.14 8.35 ± 0.09 7.52 ± 0.09 8.30 ± 0.15 C 2010 8.32 ± 0.16 8.02 ± 0.38 7.73 ± 0.16 7.47 ± 0.23 7.81 ± 0.23 7.79 ± 0.16 1 2009 8.79 ± 0.28 8.29 ± 0.38 8.07 ± 0.34 8.20 ± 0.48 7.73 ± 1.21 8.50 ± 0.28 1 2010 8.07 ± 0.20 8.17 ± 0.60 7.67 ± 0.50 7.39 ± 0.61 8.08 ± 0.34 8.13 ± 0.18 2 2009 8.41 ± 0.47 8.31 ± 0.52 8.23 ± 0.65 8.22 ± 0.31 8.03 ± 1.09 8.66 ± 0.22 2 2010 8.03 ± 0.45 8.00 ± 0.19 7.77 ± 0.19 7.49 ± 0.39 7.93 ± 0.19 7.93 ± 0.24 3 2009 8.64 ± 0.46 8.07 ± 0.25 7.95 ± 0.38 8.07 ± 0.52 7.91 ± 1.21 8.45 ± 0.36 3 2010 8.10 ± 0.40 8.29 ± 0.27 7.76 ± 0.13 7.55 ± 0.39 8.06 ± 0.67 7.92 ± 0.26
Table 19. ANOVA results from tests using various parameters, e.g. sampling time (2009, 2010), position (1, 2, 3) and level (A, B, C), using pH data from soil samples from vertical gardens. A black dot indicates that there is significant difference between the tested parameters. For sampling levels: A is top, B is middle and C is bottom. Sampling positions 1, 2 and 3 are located around the circumference of the vertical garden at each sampling level, approximately 120° apart. All F and p values from ANOVA tests can be found in Appendix D
Using data from
Tested parameters All vertical
gardens VG 1
VG 2
VG 3
VG 4
VG 5
VG A
All 2009 & 2010 samples • • • •
• All level A, B & C samples • • • • • • Level A, B & C samples for 2009 • • • • • • • Level A, B & C samples for 2010 • • • • • Level A, B & C samples for 2010 & 2009 • • • • • • • All position 1, 2 and 3 samples Position 1, 2 & 3 samples for 2009 Position 1, 2 & 3 samples for 2010 Position 1, 2 & 3 samples for 2009 & 2010 • • • • •
6.1.3 Hydraulic loading rate Based on the standard measurements for a vertical garden presented in Section 4.3.1, the two infiltration surface areas were calculated. The greywater generation flow (Q) used was based on data for the average water amount that was disposed of on the street or courtyard from a household, which was 81 L/day (Section 4.1.2). According to the interviews, between 40 and 120 liters of water was applied onto the system every day, why these two amounts of generated water were also used to calculate the HLR. Hence, three different HLRs were calculated: HLRaverage, HLRmin and HLRmax (corresponding to the generated water amounts 81 L/day, 40 L/day and 120 L/day).
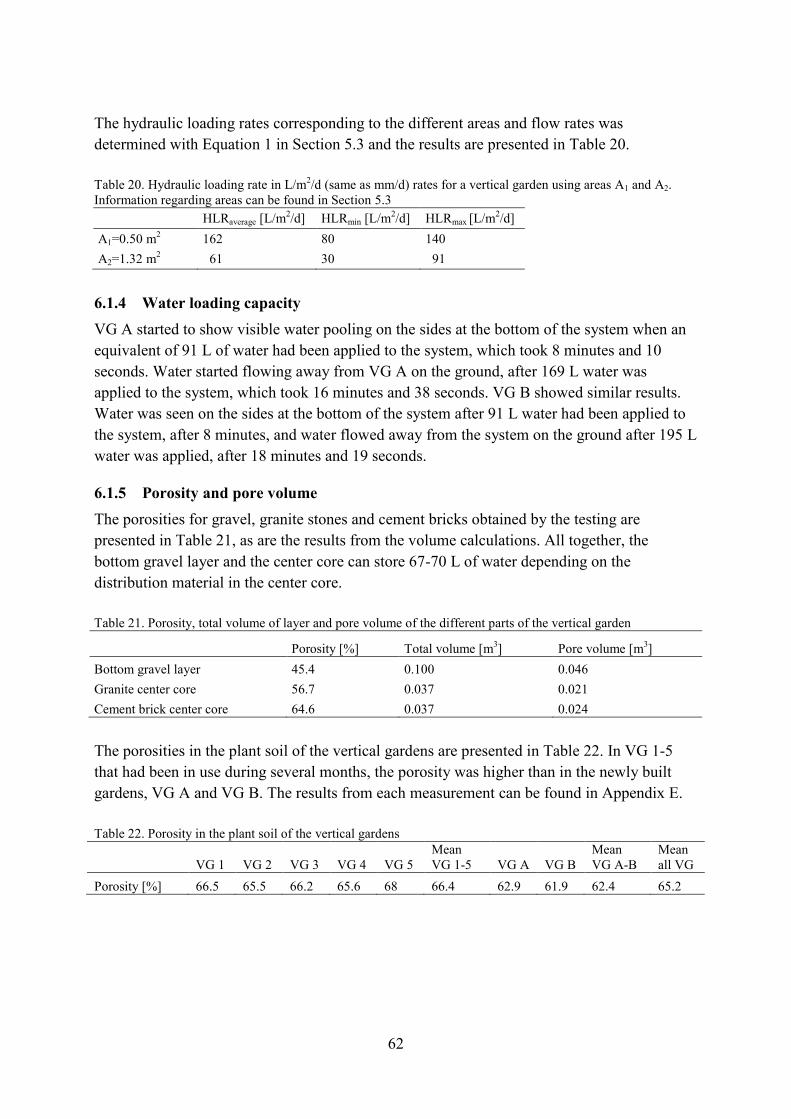
62
The hydraulic loading rates corresponding to the different areas and flow rates was determined with Equation 1 in Section 5.3 and the results are presented in Table 20. Table 20. Hydraulic loading rate in L/m2/d (same as mm/d) rates for a vertical garden using areas A1 and A2. Information regarding areas can be found in Section 5.3 HLRaverage [L/m2/d] HLRmin [L/m2/d] HLRmax [L/m2/d] A1=0.50 m2 162 80 140 A2=1.32 m2 61 30 91
6.1.4 Water loading capacity VG A started to show visible water pooling on the sides at the bottom of the system when an equivalent of 91 L of water had been applied to the system, which took 8 minutes and 10 seconds. Water started flowing away from VG A on the ground, after 169 L water was applied to the system, which took 16 minutes and 38 seconds. VG B showed similar results. Water was seen on the sides at the bottom of the system after 91 L water had been applied to the system, after 8 minutes, and water flowed away from the system on the ground after 195 L water was applied, after 18 minutes and 19 seconds.
6.1.5 Porosity and pore volume The porosities for gravel, granite stones and cement bricks obtained by the testing are presented in Table 21, as are the results from the volume calculations. All together, the bottom gravel layer and the center core can store 67-70 L of water depending on the distribution material in the center core. Table 21. Porosity, total volume of layer and pore volume of the different parts of the vertical garden
Porosity [%] Total volume [m3] Pore volume [m3] Bottom gravel layer 45.4 0.100 0.046 Granite center core 56.7 0.037 0.021 Cement brick center core 64.6 0.037 0.024
The porosities in the plant soil of the vertical gardens are presented in Table 22. In VG 1-5 that had been in use during several months, the porosity was higher than in the newly built gardens, VG A and VG B. The results from each measurement can be found in Appendix E. Table 22. Porosity in the plant soil of the vertical gardens
VG 1 VG 2 VG 3 VG 4 VG 5
Mean VG 1-5 VG A VG B
Mean VG A-B
Mean all VG
Porosity [%] 66.5 65.5 66.2 65.6 68 66.4 62.9 61.9 62.4 65.2
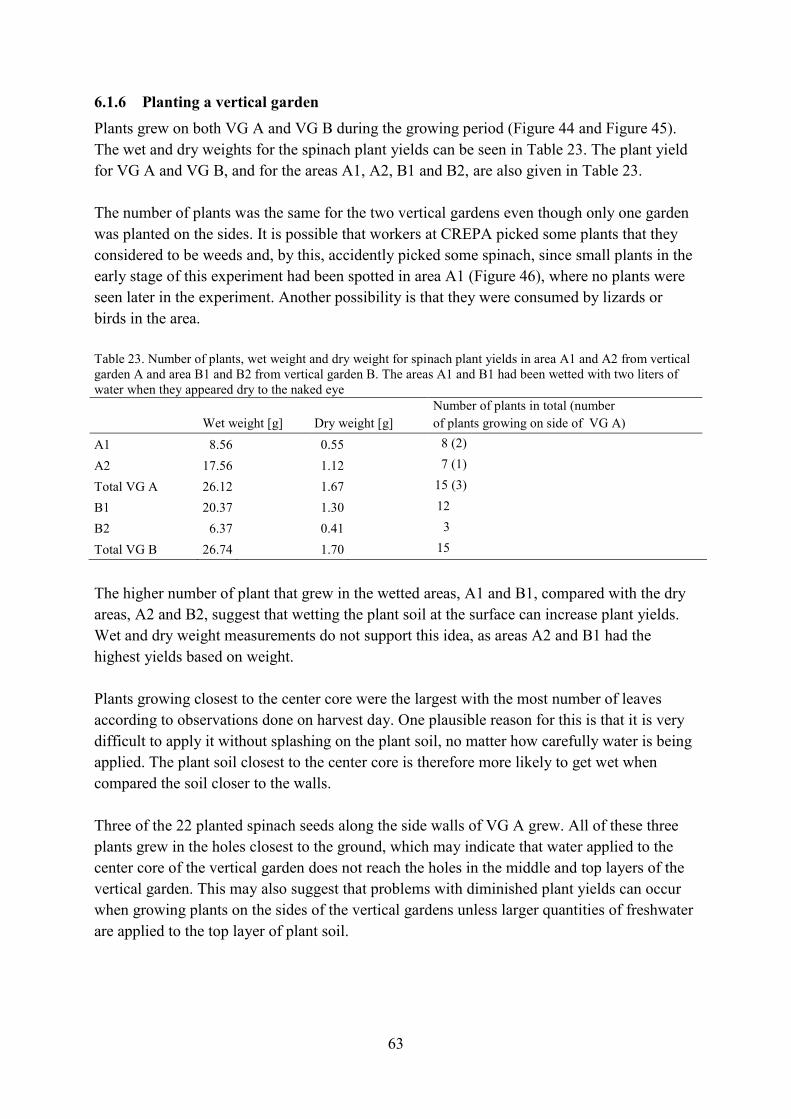
63
6.1.6 Planting a vertical garden Plants grew on both VG A and VG B during the growing period (Figure 44 and Figure 45). The wet and dry weights for the spinach plant yields can be seen in Table 23. The plant yield for VG A and VG B, and for the areas A1, A2, B1 and B2, are also given in Table 23. The number of plants was the same for the two vertical gardens even though only one garden was planted on the sides. It is possible that workers at CREPA picked some plants that they considered to be weeds and, by this, accidently picked some spinach, since small plants in the early stage of this experiment had been spotted in area A1 (Figure 46), where no plants were seen later in the experiment. Another possibility is that they were consumed by lizards or birds in the area. Table 23. Number of plants, wet weight and dry weight for spinach plant yields in area A1 and A2 from vertical garden A and area B1 and B2 from vertical garden B. The areas A1 and B1 had been wetted with two liters of water when they appeared dry to the naked eye
Wet weight [g] Dry weight [g] Number of plants in total (number of plants growing on side of VG A)
A1 8.56 0.55 8 (2)
A2 17.56 1.12 7 (1)
Total VG A 26.12 1.67 15 (3)
B1 20.37 1.30 12
B2 6.37 0.41 3
Total VG B 26.74 1.70 15
The higher number of plant that grew in the wetted areas, A1 and B1, compared with the dry areas, A2 and B2, suggest that wetting the plant soil at the surface can increase plant yields. Wet and dry weight measurements do not support this idea, as areas A2 and B1 had the highest yields based on weight. Plants growing closest to the center core were the largest with the most number of leaves according to observations done on harvest day. One plausible reason for this is that it is very difficult to apply it without splashing on the plant soil, no matter how carefully water is being applied. The plant soil closest to the center core is therefore more likely to get wet when compared the soil closer to the walls. Three of the 22 planted spinach seeds along the side walls of VG A grew. All of these three plants grew in the holes closest to the ground, which may indicate that water applied to the center core of the vertical garden does not reach the holes in the middle and top layers of the vertical garden. This may also suggest that problems with diminished plant yields can occur when growing plants on the sides of the vertical gardens unless larger quantities of freshwater are applied to the top layer of plant soil.
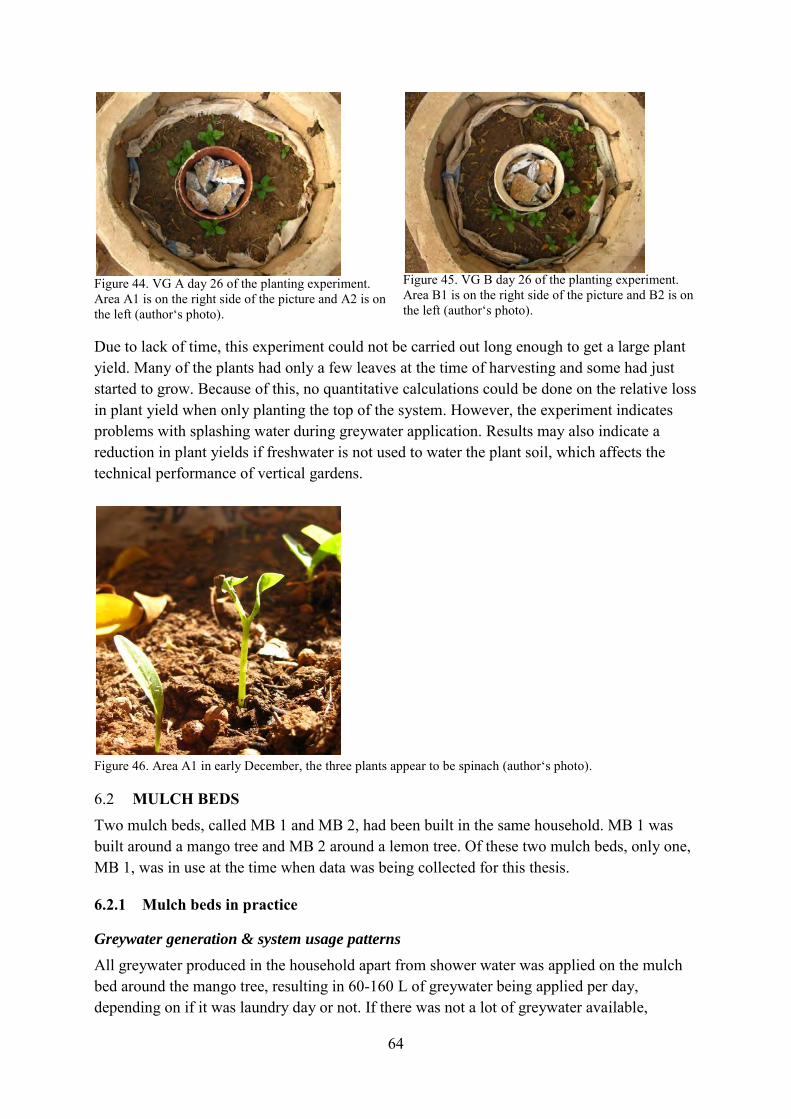
64
Figure 44. VG A day 26 of the planting experiment. Area A1 is on the right side of the picture and A2 is on the left (author‘s photo).
Figure 45. VG B day 26 of the planting experiment. Area B1 is on the right side of the picture and B2 is on the left (author‘s photo).
Due to lack of time, this experiment could not be carried out long enough to get a large plant yield. Many of the plants had only a few leaves at the time of harvesting and some had just started to grow. Because of this, no quantitative calculations could be done on the relative loss in plant yield when only planting the top of the system. However, the experiment indicates problems with splashing water during greywater application. Results may also indicate a reduction in plant yields if freshwater is not used to water the plant soil, which affects the technical performance of vertical gardens.
Figure 46. Area A1 in early December, the three plants appear to be spinach (author‘s photo).
6.2 MULCH BEDS Two mulch beds, called MB 1 and MB 2, had been built in the same household. MB 1 was built around a mango tree and MB 2 around a lemon tree. Of these two mulch beds, only one, MB 1, was in use at the time when data was being collected for this thesis.
6.2.1 Mulch beds in practice
Greywater generation & system usage patterns
All greywater produced in the household apart from shower water was applied on the mulch bed around the mango tree, resulting in 60-160 L of greywater being applied per day, depending on if it was laundry day or not. If there was not a lot of greywater available,
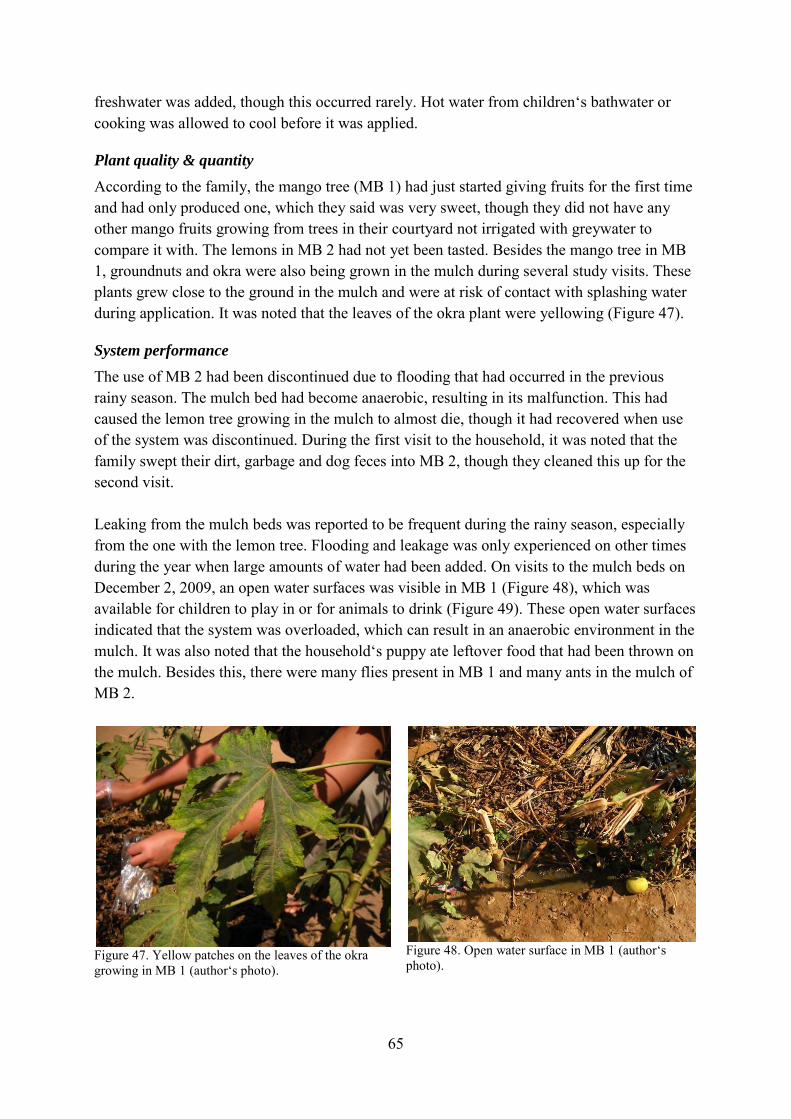
65
freshwater was added, though this occurred rarely. Hot water from children‘s bathwater or cooking was allowed to cool before it was applied.
Plant quality & quantity
According to the family, the mango tree (MB 1) had just started giving fruits for the first time and had only produced one, which they said was very sweet, though they did not have any other mango fruits growing from trees in their courtyard not irrigated with greywater to compare it with. The lemons in MB 2 had not yet been tasted. Besides the mango tree in MB 1, groundnuts and okra were also being grown in the mulch during several study visits. These plants grew close to the ground in the mulch and were at risk of contact with splashing water during application. It was noted that the leaves of the okra plant were yellowing (Figure 47).
System performance
The use of MB 2 had been discontinued due to flooding that had occurred in the previous rainy season. The mulch bed had become anaerobic, resulting in its malfunction. This had caused the lemon tree growing in the mulch to almost die, though it had recovered when use of the system was discontinued. During the first visit to the household, it was noted that the family swept their dirt, garbage and dog feces into MB 2, though they cleaned this up for the second visit. Leaking from the mulch beds was reported to be frequent during the rainy season, especially from the one with the lemon tree. Flooding and leakage was only experienced on other times during the year when large amounts of water had been added. On visits to the mulch beds on December 2, 2009, an open water surfaces was visible in MB 1 (Figure 48), which was available for children to play in or for animals to drink (Figure 49). These open water surfaces indicated that the system was overloaded, which can result in an anaerobic environment in the mulch. It was also noted that the household‘s puppy ate leftover food that had been thrown on the mulch. Besides this, there were many flies present in MB 1 and many ants in the mulch of MB 2.
Figure 47. Yellow patches on the leaves of the okra growing in MB 1 (author‘s photo).
Figure 48. Open water surface in MB 1 (author‘s photo).
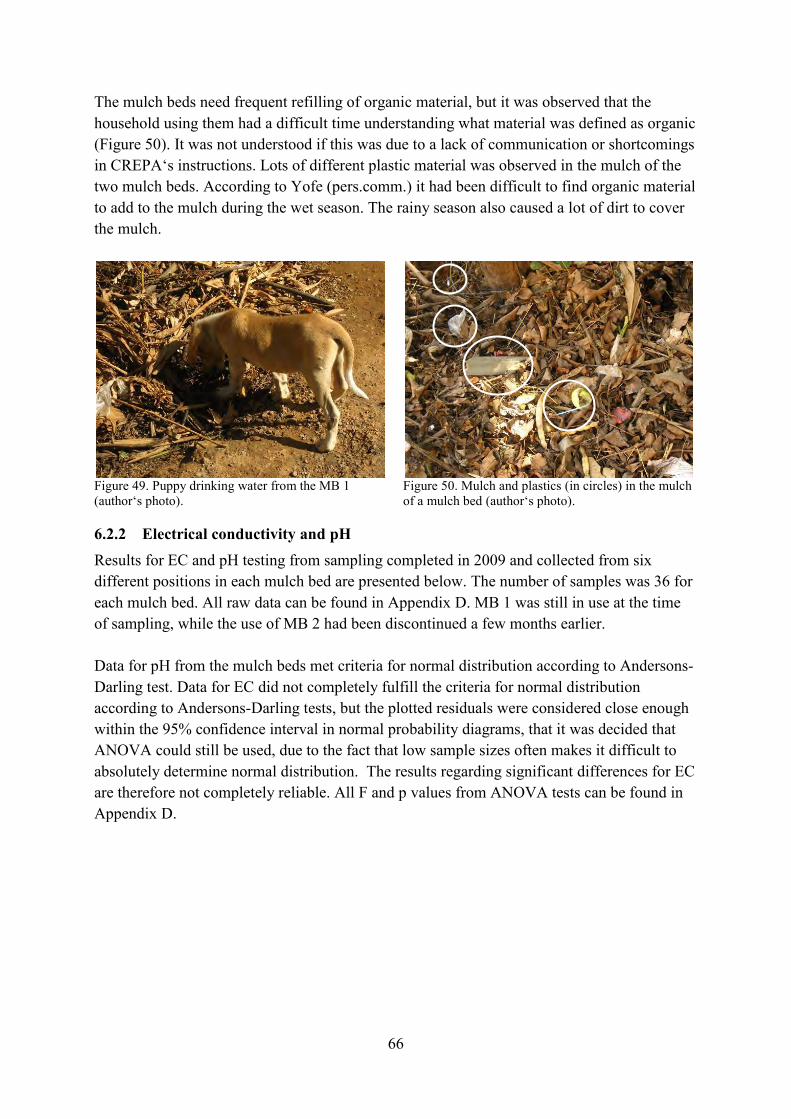
66
The mulch beds need frequent refilling of organic material, but it was observed that the household using them had a difficult time understanding what material was defined as organic (Figure 50). It was not understood if this was due to a lack of communication or shortcomings in CREPA‘s instructions. Lots of different plastic material was observed in the mulch of the two mulch beds. According to Yofe (pers.comm.) it had been difficult to find organic material to add to the mulch during the wet season. The rainy season also caused a lot of dirt to cover the mulch.
Figure 49. Puppy drinking water from the MB 1 (author‘s photo).
Figure 50. Mulch and plastics (in circles) in the mulch of a mulch bed (author‘s photo).
6.2.2 Electrical conductivity and pH Results for EC and pH testing from sampling completed in 2009 and collected from six different positions in each mulch bed are presented below. The number of samples was 36 for each mulch bed. All raw data can be found in Appendix D. MB 1 was still in use at the time of sampling, while the use of MB 2 had been discontinued a few months earlier. Data for pH from the mulch beds met criteria for normal distribution according to Andersons-Darling test. Data for EC did not completely fulfill the criteria for normal distribution according to Andersons-Darling tests, but the plotted residuals were considered close enough within the 95% confidence interval in normal probability diagrams, that it was decided that ANOVA could still be used, due to the fact that low sample sizes often makes it difficult to absolutely determine normal distribution. The results regarding significant differences for EC are therefore not completely reliable. All F and p values from ANOVA tests can be found in Appendix D.
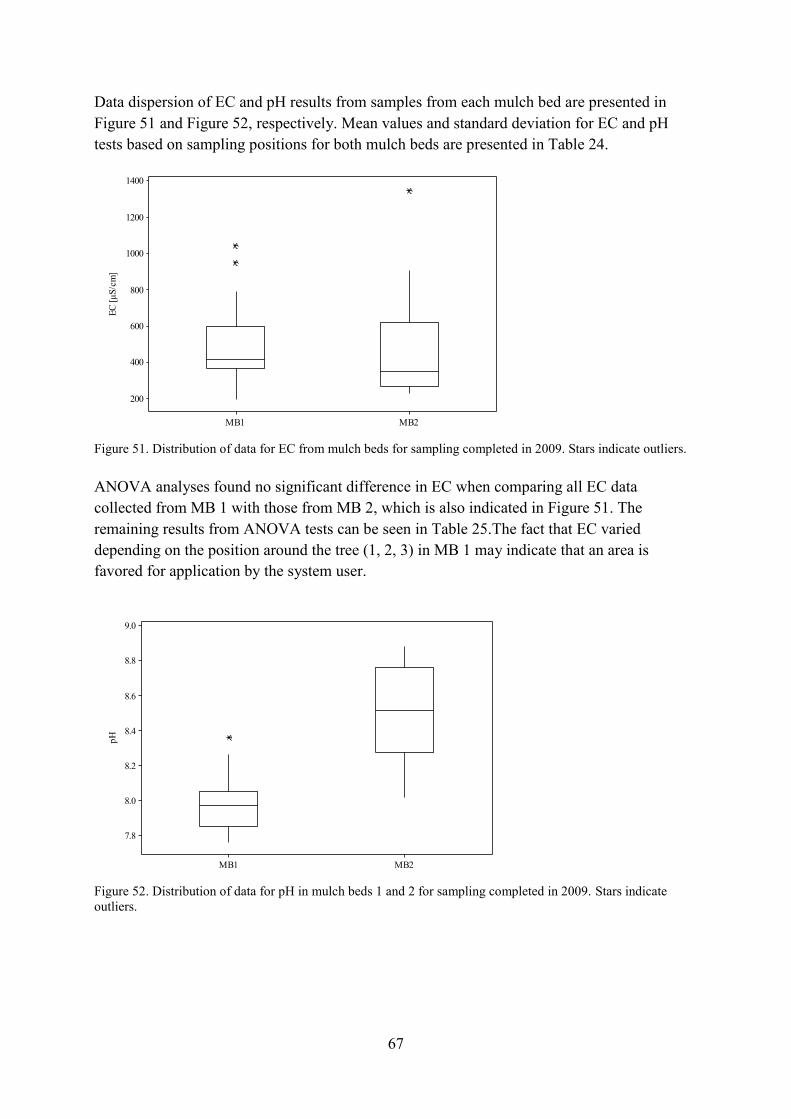
67
Data dispersion of EC and pH results from samples from each mulch bed are presented in Figure 51 and Figure 52, respectively. Mean values and standard deviation for EC and pH tests based on sampling positions for both mulch beds are presented in Table 24.
MB2MB1
1400
1200
1000
800
600
400
200
EC [µ
S/cm
]
Figure 51. Distribution of data for EC from mulch beds for sampling completed in 2009. Stars indicate outliers.
ANOVA analyses found no significant difference in EC when comparing all EC data collected from MB 1 with those from MB 2, which is also indicated in Figure 51. The remaining results from ANOVA tests can be seen in Table 25.The fact that EC varied depending on the position around the tree (1, 2, 3) in MB 1 may indicate that an area is favored for application by the system user.
MB2MB1
9.0
8.8
8.6
8.4
8.2
8.0
7.8
pH
Figure 52. Distribution of data for pH in mulch beds 1 and 2 for sampling completed in 2009. Stars indicate outliers.
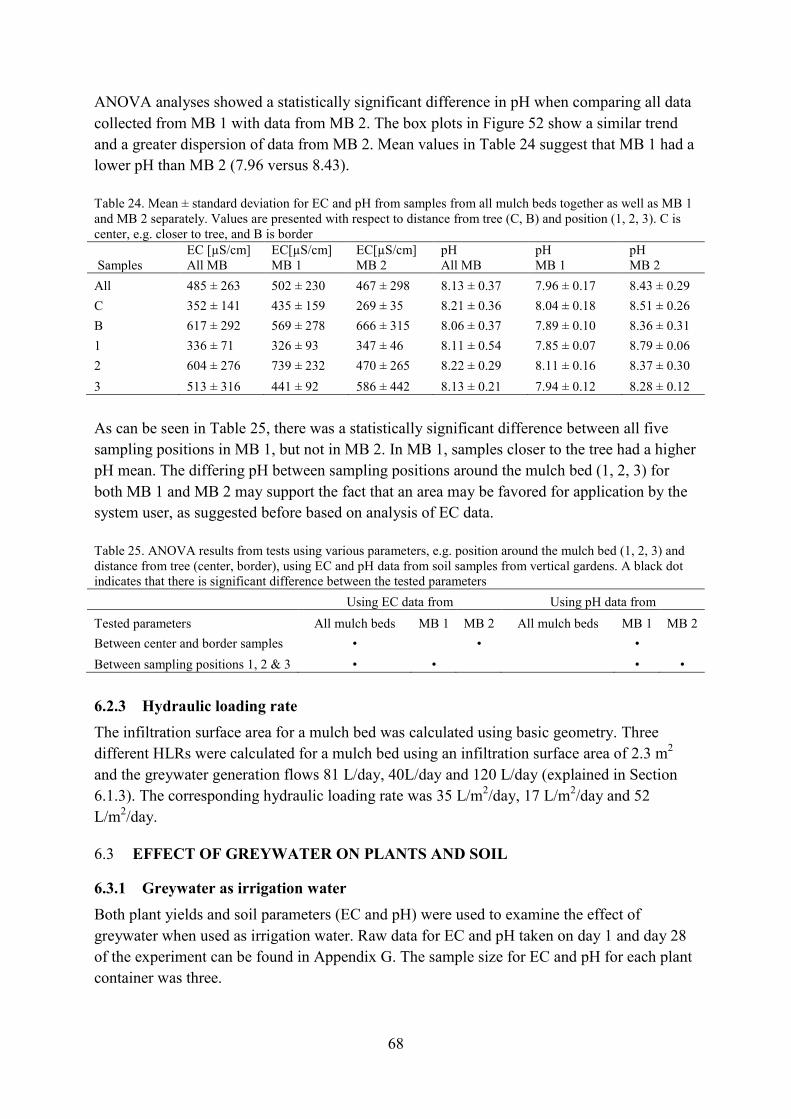
68
ANOVA analyses showed a statistically significant difference in pH when comparing all data collected from MB 1 with data from MB 2. The box plots in Figure 52 show a similar trend and a greater dispersion of data from MB 2. Mean values in Table 24 suggest that MB 1 had a lower pH than MB 2 (7.96 versus 8.43).
Table 24. Mean ± standard deviation for EC and pH from samples from all mulch beds together as well as MB 1 and MB 2 separately. Values are presented with respect to distance from tree (C, B) and position (1, 2, 3). C is center, e.g. closer to tree, and B is border
Samples EC [µS/cm] All MB
EC[µS/cm] MB 1
EC[µS/cm] MB 2
pH All MB
pH MB 1
pH MB 2
All 485 ± 263 502 ± 230 467 ± 298 8.13 ± 0.37 7.96 ± 0.17 8.43 ± 0.29 C 352 ± 141 435 ± 159 269 ± 35 8.21 ± 0.36 8.04 ± 0.18 8.51 ± 0.26 B 617 ± 292 569 ± 278 666 ± 315 8.06 ± 0.37 7.89 ± 0.10 8.36 ± 0.31 1 336 ± 71 326 ± 93 347 ± 46 8.11 ± 0.54 7.85 ± 0.07 8.79 ± 0.06 2 604 ± 276 739 ± 232 470 ± 265 8.22 ± 0.29 8.11 ± 0.16 8.37 ± 0.30 3 513 ± 316 441 ± 92 586 ± 442 8.13 ± 0.21 7.94 ± 0.12 8.28 ± 0.12
As can be seen in Table 25, there was a statistically significant difference between all five sampling positions in MB 1, but not in MB 2. In MB 1, samples closer to the tree had a higher pH mean. The differing pH between sampling positions around the mulch bed (1, 2, 3) for both MB 1 and MB 2 may support the fact that an area may be favored for application by the system user, as suggested before based on analysis of EC data.
Table 25. ANOVA results from tests using various parameters, e.g. position around the mulch bed (1, 2, 3) and distance from tree (center, border), using EC and pH data from soil samples from vertical gardens. A black dot indicates that there is significant difference between the tested parameters Using EC data from Using pH data from Tested parameters All mulch beds MB 1 MB 2 All mulch beds MB 1 MB 2 Between center and border samples • •
•
Between sampling positions 1, 2 & 3 • • • •
6.2.3 Hydraulic loading rate The infiltration surface area for a mulch bed was calculated using basic geometry. Three different HLRs were calculated for a mulch bed using an infiltration surface area of 2.3 m2 and the greywater generation flows 81 L/day, 40L/day and 120 L/day (explained in Section 6.1.3). The corresponding hydraulic loading rate was 35 L/m2/day, 17 L/m2/day and 52 L/m2/day.
6.3 EFFECT OF GREYWATER ON PLANTS AND SOIL
6.3.1 Greywater as irrigation water Both plant yields and soil parameters (EC and pH) were used to examine the effect of greywater when used as irrigation water. Raw data for EC and pH taken on day 1 and day 28 of the experiment can be found in Appendix G. The sample size for EC and pH for each plant container was three.
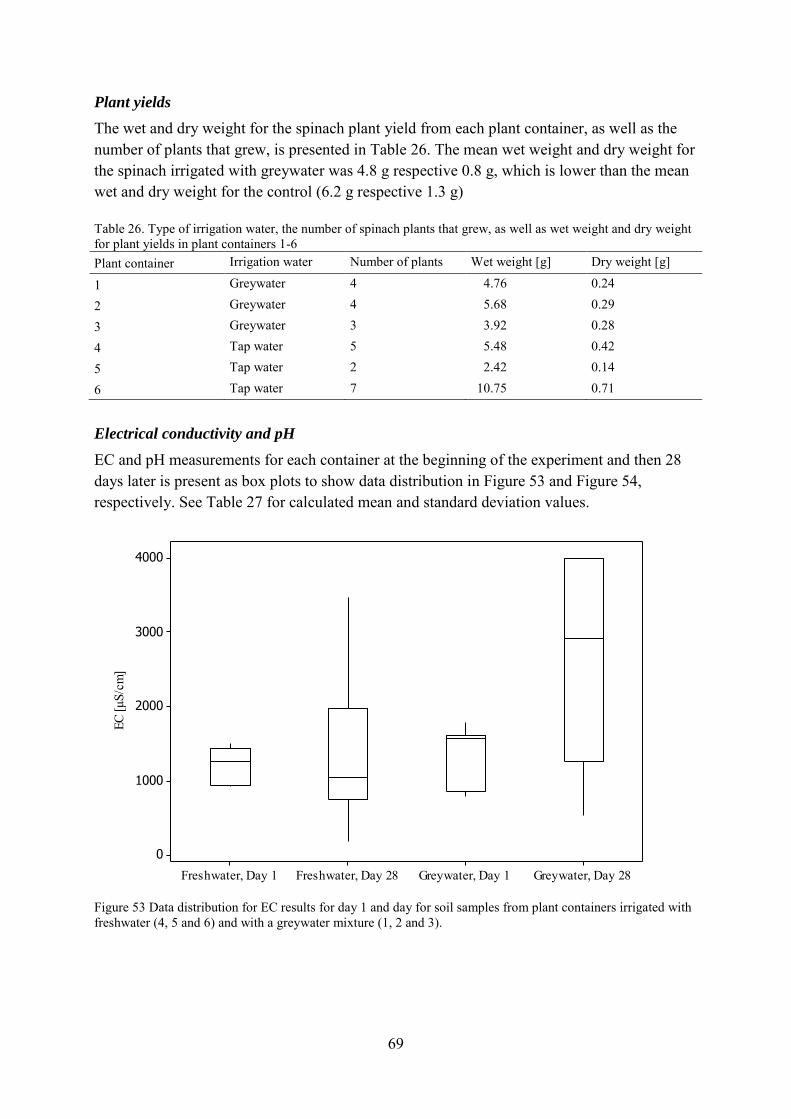
69
Plant yields
The wet and dry weight for the spinach plant yield from each plant container, as well as the number of plants that grew, is presented in Table 26. The mean wet weight and dry weight for the spinach irrigated with greywater was 4.8 g respective 0.8 g, which is lower than the mean wet and dry weight for the control (6.2 g respective 1.3 g) Table 26. Type of irrigation water, the number of spinach plants that grew, as well as wet weight and dry weight for plant yields in plant containers 1-6 Plant container Irrigation water Number of plants Wet weight [g] Dry weight [g]
1 Greywater 4 4.76 0.24
2 Greywater 4 5.68 0.29
3 Greywater 3 3.92 0.28
4 Tap water 5 5.48 0.42
5 Tap water 2 2.42 0.14
6 Tap water 7 10.75 0.71
Electrical conductivity and pH
EC and pH measurements for each container at the beginning of the experiment and then 28 days later is present as box plots to show data distribution in Figure 53 and Figure 54, respectively. See Table 27 for calculated mean and standard deviation values.
Greywater, Day 28Greywater, Day 1Freshwater, Day 28Freshwater, Day 1
4000
3000
2000
1000
0
EC [µ
S/cm
]
Figure 53 Data distribution for EC results for day 1 and day for soil samples from plant containers irrigated with freshwater (4, 5 and 6) and with a greywater mixture (1, 2 and 3).
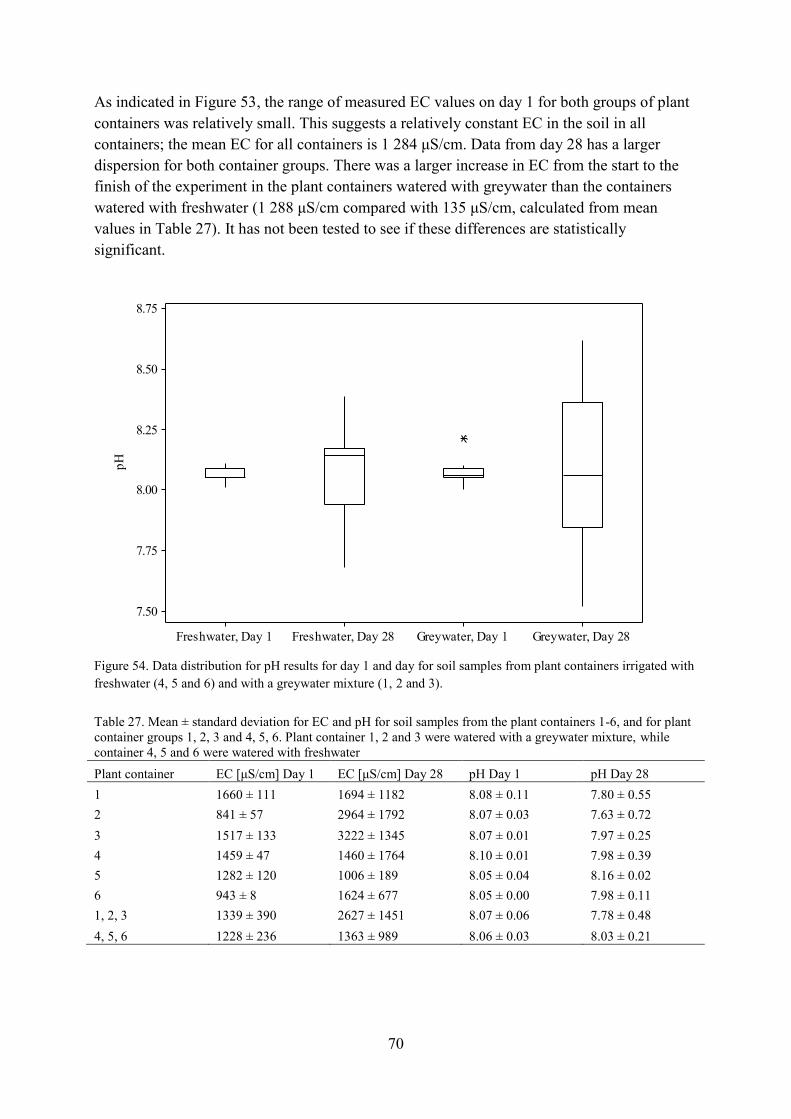
70
As indicated in Figure 53, the range of measured EC values on day 1 for both groups of plant containers was relatively small. This suggests a relatively constant EC in the soil in all containers; the mean EC for all containers is 1 284 μS/cm. Data from day 28 has a larger dispersion for both container groups. There was a larger increase in EC from the start to the finish of the experiment in the plant containers watered with greywater than the containers watered with freshwater (1 288 μS/cm compared with 135 μS/cm, calculated from mean values in Table 27). It has not been tested to see if these differences are statistically significant.
Greywater, Day 28Greywater, Day 1Freshwater, Day 28Freshwater, Day 1
8.75
8.50
8.25
8.00
7.75
7.50
pH
Figure 54. Data distribution for pH results for day 1 and day for soil samples from plant containers irrigated with freshwater (4, 5 and 6) and with a greywater mixture (1, 2 and 3). Table 27. Mean ± standard deviation for EC and pH for soil samples from the plant containers 1-6, and for plant container groups 1, 2, 3 and 4, 5, 6. Plant container 1, 2 and 3 were watered with a greywater mixture, while container 4, 5 and 6 were watered with freshwater Plant container EC [μS/cm] Day 1 EC [μS/cm] Day 28 pH Day 1 pH Day 28 1 1660 ± 111 1694 ± 1182 8.08 ± 0.11 7.80 ± 0.55 2 841 ± 57 2964 ± 1792 8.07 ± 0.03 7.63 ± 0.72 3 1517 ± 133 3222 ± 1345 8.07 ± 0.01 7.97 ± 0.25 4 1459 ± 47 1460 ± 1764 8.10 ± 0.01 7.98 ± 0.39 5 1282 ± 120 1006 ± 189 8.05 ± 0.04 8.16 ± 0.02 6 943 ± 8 1624 ± 677 8.05 ± 0.00 7.98 ± 0.11 1, 2, 3 1339 ± 390 2627 ± 1451 8.07 ± 0.06 7.78 ± 0.48 4, 5, 6 1228 ± 236 1363 ± 989 8.06 ± 0.03 8.03 ± 0.21
71
The distribution of measured pH on day 1 for both groups of plant containers was relatively small, implying a relatively constant pH in the soil at the beginning of the experiment. The calculated mean pH on day 1 for data from all containers is 8.07. Data from day 28 has a larger dispersion for both groups of plant containers. The mean value for pH in plant containers watered with freshwater on day 28 was essentially the same (8.03 on day 28 versus 8.06 on day 1), while there was a decrease in mean pH in containers irrigated with the greywater mixture (7.78 on day 28 versus 8.07 on day 1). It has not been tested to see if these differences are statistically significant.
6.3.2 The effect of greywater on soil Infiltration rates were measured on day 1 and day 36 in all rings in the ground and in the plant soil of VG B. Raw data used to calculate infiltration rates, as well as EC and pH data, can be found in Appendix G. The number of samples for each ring when EC and pH were tested was three. EC and pH measurements were only taken on day 36 in the plant soil of the vertical garden.
Infiltration rate
The steady state infiltration rates to the ground and to the plant soil are presented in Table 28. A white film, which was not there on day 1, was evident on day 36 in all rings watered with the greywater mixture. It was most likely due to a buildup of soaps, milk powder and sugar from the greywater mixture. In Figure 55 a ring placed in the ground that was watered with the greywater can be seen. The control ring plant in the ground that was watered with freshwater is visible in Figure 56.
Table 28. Steady state infiltration rates, qs, to the ground and the plant soil at day 1 and day 36 qs to the ground [mm/h] qs to the plant soil [mm/h] Ring Day 1 Day 36 Day 1 Day 36 A 86 13801 280 24962 B 89 7871 312 160 C 91 4001 284 102 Control 77 75 293 169 1Ant colonies had been built under each ring, thus these measurements are not valid. 2While ant colonies were not visible, it is probable that they or another form of insect affected this measurement as it is unusually high.
Rings A, B and C in the ground leaked during infiltration tests on day 36, rendering those results useless. It was evident during testing that an ant colony had moved in under each ring, causing the structure of the soil to change in these rings. It was unclear if they had moved in because of the use of greywater mixture in the rings. The control ring, which was within 10 cm of the other rings, did not have any ants living in it.
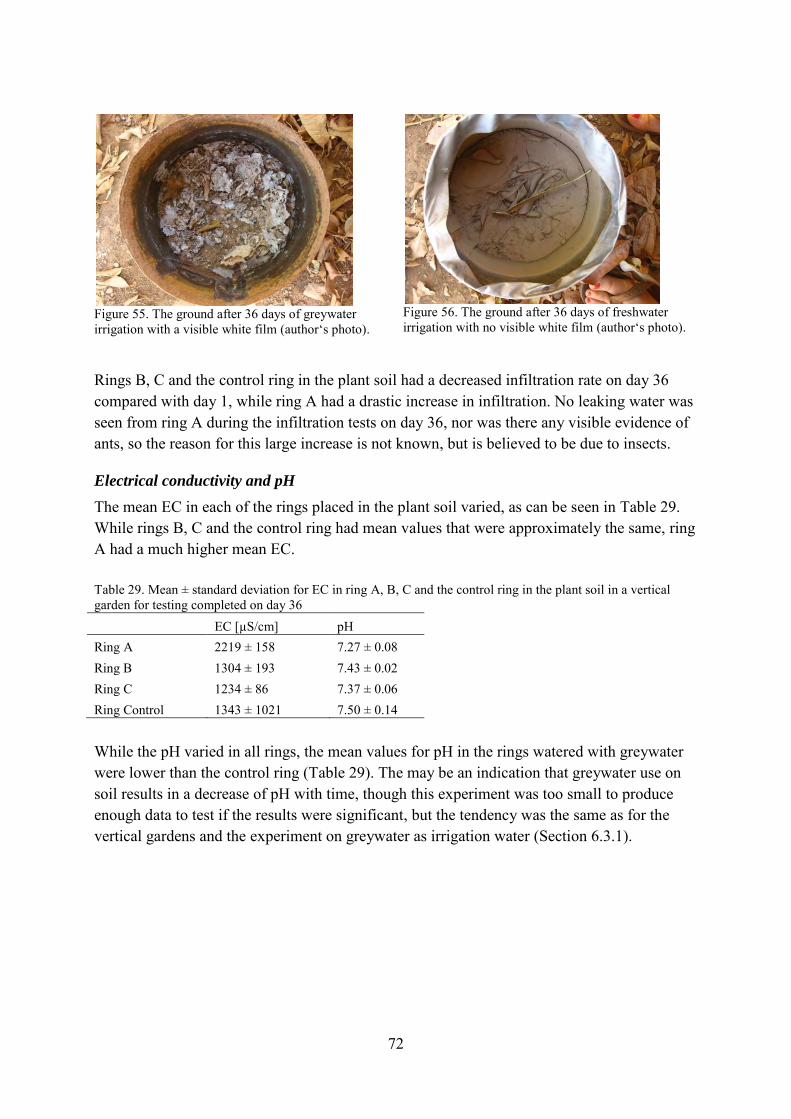
72
Figure 55. The ground after 36 days of greywater irrigation with a visible white film (author‘s photo).
Figure 56. The ground after 36 days of freshwater irrigation with no visible white film (author‘s photo).
Rings B, C and the control ring in the plant soil had a decreased infiltration rate on day 36 compared with day 1, while ring A had a drastic increase in infiltration. No leaking water was seen from ring A during the infiltration tests on day 36, nor was there any visible evidence of ants, so the reason for this large increase is not known, but is believed to be due to insects.
Electrical conductivity and pH
The mean EC in each of the rings placed in the plant soil varied, as can be seen in Table 29. While rings B, C and the control ring had mean values that were approximately the same, ring A had a much higher mean EC. Table 29. Mean ± standard deviation for EC in ring A, B, C and the control ring in the plant soil in a vertical garden for testing completed on day 36 EC [µS/cm] pH Ring A 2219 ± 158 7.27 ± 0.08 Ring B 1304 ± 193 7.43 ± 0.02 Ring C 1234 ± 86 7.37 ± 0.06 Ring Control 1343 ± 1021 7.50 ± 0.14
While the pH varied in all rings, the mean values for pH in the rings watered with greywater were lower than the control ring (Table 29). The may be an indication that greywater use on soil results in a decrease of pH with time, though this experiment was too small to produce enough data to test if the results were significant, but the tendency was the same as for the vertical gardens and the experiment on greywater as irrigation water (Section 6.3.1).
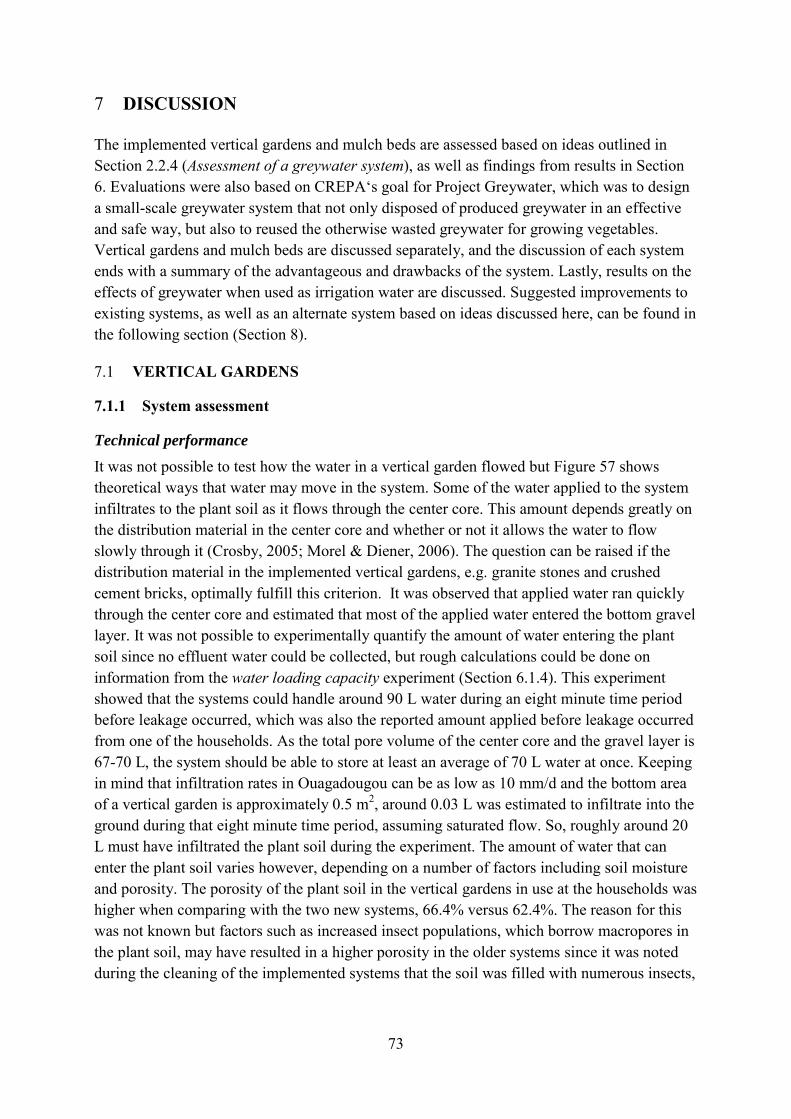
73
7 DISCUSSION The implemented vertical gardens and mulch beds are assessed based on ideas outlined in Section 2.2.4 (Assessment of a greywater system), as well as findings from results in Section 6. Evaluations were also based on CREPA‘s goal for Project Greywater, which was to design a small-scale greywater system that not only disposed of produced greywater in an effective and safe way, but also to reused the otherwise wasted greywater for growing vegetables. Vertical gardens and mulch beds are discussed separately, and the discussion of each system ends with a summary of the advantageous and drawbacks of the system. Lastly, results on the effects of greywater when used as irrigation water are discussed. Suggested improvements to existing systems, as well as an alternate system based on ideas discussed here, can be found in the following section (Section 8).
7.1 VERTICAL GARDENS
7.1.1 System assessment
Technical performance
It was not possible to test how the water in a vertical garden flowed but Figure 57 shows theoretical ways that water may move in the system. Some of the water applied to the system infiltrates to the plant soil as it flows through the center core. This amount depends greatly on the distribution material in the center core and whether or not it allows the water to flow slowly through it (Crosby, 2005; Morel & Diener, 2006). The question can be raised if the distribution material in the implemented vertical gardens, e.g. granite stones and crushed cement bricks, optimally fulfill this criterion. It was observed that applied water ran quickly through the center core and estimated that most of the applied water entered the bottom gravel layer. It was not possible to experimentally quantify the amount of water entering the plant soil since no effluent water could be collected, but rough calculations could be done on information from the water loading capacity experiment (Section 6.1.4). This experiment showed that the systems could handle around 90 L water during an eight minute time period before leakage occurred, which was also the reported amount applied before leakage occurred from one of the households. As the total pore volume of the center core and the gravel layer is 67-70 L, the system should be able to store at least an average of 70 L water at once. Keeping in mind that infiltration rates in Ouagadougou can be as low as 10 mm/d and the bottom area of a vertical garden is approximately 0.5 m2, around 0.03 L was estimated to infiltrate into the ground during that eight minute time period, assuming saturated flow. So, roughly around 20 L must have infiltrated the plant soil during the experiment. The amount of water that can enter the plant soil varies however, depending on a number of factors including soil moisture and porosity. The porosity of the plant soil in the vertical gardens in use at the households was higher when comparing with the two new systems, 66.4% versus 62.4%. The reason for this was not known but factors such as increased insect populations, which borrow macropores in the plant soil, may have resulted in a higher porosity in the older systems since it was noted during the cleaning of the implemented systems that the soil was filled with numerous insects,
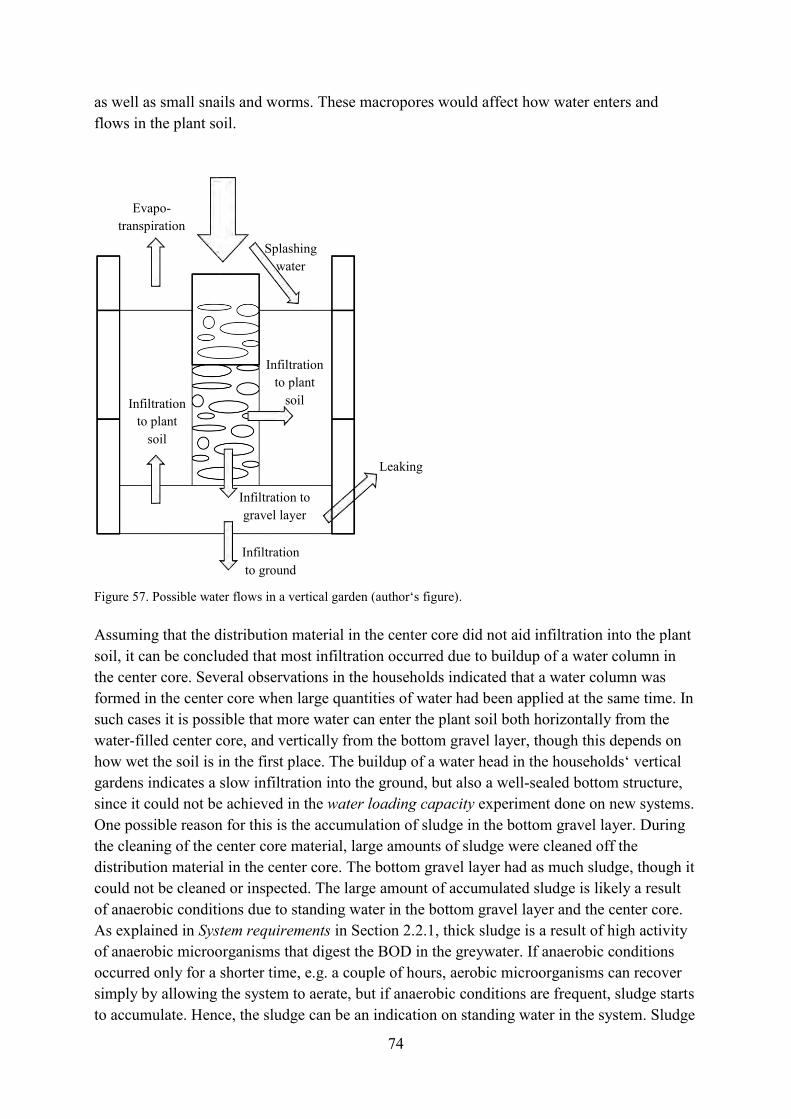
74
as well as small snails and worms. These macropores would affect how water enters and flows in the plant soil.
Figure 57. Possible water flows in a vertical garden (author‘s figure). Assuming that the distribution material in the center core did not aid infiltration into the plant soil, it can be concluded that most infiltration occurred due to buildup of a water column in the center core. Several observations in the households indicated that a water column was formed in the center core when large quantities of water had been applied at the same time. In such cases it is possible that more water can enter the plant soil both horizontally from the water-filled center core, and vertically from the bottom gravel layer, though this depends on how wet the soil is in the first place. The buildup of a water head in the households‘ vertical gardens indicates a slow infiltration into the ground, but also a well-sealed bottom structure, since it could not be achieved in the water loading capacity experiment done on new systems. One possible reason for this is the accumulation of sludge in the bottom gravel layer. During the cleaning of the center core material, large amounts of sludge were cleaned off the distribution material in the center core. The bottom gravel layer had as much sludge, though it could not be cleaned or inspected. The large amount of accumulated sludge is likely a result of anaerobic conditions due to standing water in the bottom gravel layer and the center core. As explained in System requirements in Section 2.2.1, thick sludge is a result of high activity of anaerobic microorganisms that digest the BOD in the greywater. If anaerobic conditions occurred only for a shorter time, e.g. a couple of hours, aerobic microorganisms can recover simply by allowing the system to aerate, but if anaerobic conditions are frequent, sludge starts to accumulate. Hence, the sludge can be an indication on standing water in the system. Sludge
Evapo-transpiration
Infiltration to plant
soil
Leaking
Infiltration to plant
soil
Infiltration to ground
Infiltration to gravel layer
Splashing water
75
also causes clogging, which in turn increases the risk for standing water and anaerobic environments even more (US EPA, 2006). It was not possible to quantify the actual clogging effect of sludge on the bottom of the systems since no infiltration tests had been carried out when systems were newly built. Based on tests and observations, it can be concluded that the current design is too small, resulting in a system that does not function properly. According to CREPA‘s Baseline Study, an average household in the study area produces around 80 L of greywater daily (Kando, 2008; Yofe, 2008), which is less than the amount of water that caused leakage in the water loading capacity experiment (Section 6.1.4). For the implemented vertical gardens, hydraulic loading rates based on that amount ranged between 61 and 162 L/m2/d depending on the infiltration surface area. As mentioned, it was estimated that most water enters the bottom gravel layer, why the most probable infiltration surface area is the bottom of the system, which gives the higher hydraulic loading rate. If infiltration to the plant soil occurs, the hydraulic loading rate is smaller than if only the bottom of the system is considered. In the households of the implemented systems, between 40 and 120 L of greywater was applied to the systems every day. More water has time to infiltrate into the ground if the rate of water applied to a system, e.g. liters per minute, decreases. This in turn means that a system can theoretically accept more greywater before overloading then in the water loading capacity experiment. Nevertheless, the fact that systems overload after 90 L implies that on days when greater greywater quantities are produced, the vertical garden might not be able to handle it. Aside from infiltration to the ground and plant soil, water also leaves the system through evapotranspiration, e.g. the water loss due to evaporation from the soil surface combined with the water that actively transpires from the plants (USEPA, 2004). The evapotranspiration affects water availability in the system and therefore the ability of a vertical garden to function. A vertical garden should be able to offer the plants sufficient water regardless of the season, which was not the case with the implemented system. System use was discontinued due to increases water demands during the dry season in one household. On the other hand, precipitation is just as important to consider since it increases the water added to the system, which can result in leakage and anaerobic conditions, which was also common in the implemented systems. The current vertical gardens are not designed to fully handle the amount of precipitation that falls during the rainy season plus the amount of greywater that is produced, but neither small enough to fully support plant growth without the addition of freshwater during the dry season. The question has to be asked if a vertical garden can be designed so that is can handle climate fluctuations in Ouagadougou. The current systems are not perfect in either the dry or rainy season, though they seem to be fairly good at weathering both conditions. Plant growth and water reuse potential of the system was affected by the system design and system use. The bucket that creates the inlet for water application to the center core is lowered in the plant soil and because of that, no water entering the center core was in direct contact with the top 16 cm of plant soil. While this is not a problem when the system is planted on the sides or when plants grown at the top have matured, it can prevent plants with shallow roots
76
from reaching the wetted soil. Nevertheless, plants did grow at the top of the systems in all vertical gardens. This may indicate an upward transportation of water in the soil or, alternately, that the water that entered the plant soil due to splashing water when greywater was applied onto the center core was enough for the plants to survive on. On CREPA‘s recommendation, several of the households did use freshwater periodically on the top soil, both when it appeared to be dry and when the plants seemed to need it. The fact that one household did not regularly apply freshwater to the system had to discontinue use of their system during the dry season, indicates that freshwater has to be applied in order for the plants to grow. It also suggests that the water reuse potential of the system is not optimal. It was noted that none of the households were growing plants on the sides of their system. The reason for this depends on the design of the vertical gardens, but can also be due to poor system operation education. The small holes between the cement bricks that make up the wall of the vertical garden are difficult to plant seeds in, and the overall design of the system encourages the user to plant on the top. A major problem with planting on the top of the systems was the increased risk for direct contact between applied greywater and plants due to splashing water or simply because the plants cover the whole application inlet. All observations indicated that it is more or less impossible to apply water without it splashing on the plants and plant soil. Planting the system on the sides would reduce the risk of plant contact with potentially contaminated water. Unfortunately, since animals are commonly loose in the households‘ courtyard, it can be difficult to keep them from eating these unprotected side plants. Health related problems with the application procedure are more thoroughly discussed in Section 7.1.2. The building materials used in the vertical gardens were chosen based on functionality and economical viability. CREPA had originally hoped to build the system using plastic mesh bags to form the walls of the system, as they are cheap and common. As these disintegrated after one rainy season, it was decided that cement blocks would be used lined on the inside with plastic mesh bags. The lifespan of the plastic mesh bags when used on the inside of walls was not known, though there was no indication that they were disintegrating during the study visits done for this thesis. The two types of center material that were used, granite and crushed cement blocks, may not be the best choice. The crushed cement blocks disintegrated after only a few months of use, and had to be replaced, which is both time consuming and increases costs and maintenance. The effect of the disintegration of the core material on system function was not investigated. Granite stones on the other hand, are a rare and costly material in Ouagadougou, as they are only available at one place in town. Other materials like crushed glass, pieces of plastic or even gravel could be a more viable option. They would offer a greater percolation area enabling more aerobic digestion of the BOD in the greywater before entering the bottom gravel layer, which could reduce the clogging effect. It is also possible that these materials would distribute the water more efficiently into the plant soil since they are flatter and could force the water to flow slower through the system. This would further reduce the water load on the bottom gravel layer and reduce risks of anaerobic conditions.
77
Soil and plant health
The mean volume weighted EC for greywater that was applied to systems in Sector 27, based on CREPA‘s Baseline Study, was 618 µS/cm. According to Ayers and Westcot (1985), this is under the limit (700 µS/cm) with which restriction should be used when using wastewater for irrigation. The sample size for the Baseline Study was small though, which means that the mean EC might not reflect the actual EC concentrations in greywater at the households with vertical gardens. The increase in salinity in VG 1-5 between testing done in 2009 and 2010 indicates that there may be a buildup of salts in the soil, possibly as a result of greywater irrigation. This increase in EC from 2009 and 2010 varied from system to system. VG 4 had the highest mean EC increase of 1664 µS/cm, compared to VG 2, which had a mean EC increase of 618 µS/cm from 2009 to 2010. This variation can reflect differences in household water and detergent use, or be an indication that certain households apply more freshwater to their systems, which can cause salts in leach to the ground under the vertical garden. The three vertical gardens (VG 2, VG 3, VG 5) with the lowest increase in mean EC from 2009 to 2010 came from the three households which stated in the interviews that they regularly apply freshwater to the system when the topsoil appeared to be dry. The increase in mean EC can also possibly be explained by seasonal variations since the first measurements in 2009 were taken just after the end of the rainy season and the 2010 measurements were taken in the middle of the dry season. Evapotranspiration is higher during dry, hot periods, which can result in increased concentrations of salts left in the system, which would have otherwise been able to leach farther down into the ground (Ayers & Westcot, 1985). Salinity in VG A between 2009 and 2010 also increased though the system was only irrigated with freshwater. The reason for this is not clear and may indicate that the increase in EC in the system does not depend on the type of irrigation water, but instead on some other unknown factor, e.g. mineralization of the manure used, seasonal variations and/or weathering of the crushed granite stones in the center core or minerals in the plant soil. The freshwater used to irrigate VG A can also have had unusually high salinity. The freshwater that was used to water VG A was not the same freshwater that is common in other parts of Ouagadougou, e.g. ONEA‘s water. It was CREPA‘s own well water and its quality was regretfully never tested. All soils were classified as non-saline in 2009, according to Table 6 (Section 2.1.1). In 2010 VG 1, VG 4, VG 5 and VG A were classified as very slightly saline, while VG 2 and VG 3 were still non-saline. It is important to note here that results from 2010 from VG 1, VG 4 and VG A do not show the actual EC in the soil. A large portion of the 2010 samples from these two systems measured 3999 µS/cm, which is the maximum measurable EC for a Hanna instruments HI 98311 Waterproof EC/TDS/Temperature Tester. The actual EC for 2010 samples from these systems could have been significantly higher than was measureable. If the increase in soil EC did not depend on seasonal variations, but instead is an indication of a successive increase in soil salinity due to greywater irritation, then leaching may be a necessary measure to maintain plant and soil health. A question raised during the course of
78
research was if the precipitation that falls during the rainy season is sufficient to accomplish this. Soil health in the systems can remain relatively constant, when considering problems related to salinity, if leaching occurs naturally every year. EC testing from 2009 may indicate that leaching does occur naturally during the rainy season. Using the mean EC for 2009 samples from VG A, which was newly built at the time of testing, as a reference EC for new vertical gardens, a comparison between new vertical gardens and vertical gardens that have been in use through a rainy season, e.g. VG 1-5, can be made. VG 1-5, which all had been in use several months before and during the rainy season when testing was done in November 2009, had a combined mean EC that was lower than the reference mean EC from VG A (931 µS/cm versus 1010 µS/cm). While this may indicate leaching, it could also just be due to varying manure types that were used in the plant soil mix. CREPA would need to test soil before and after the rainy season in order to investigate the possibility of natural leaching. Seasonal variations in soil salinity can also be tested in the future to try to determine if greywater irrigation is the cause. If increased soil salinity is not due to seasonal variations and leaching does not occur naturally, it is recommended that households be encouraged to periodically leach their system with freshwater to reduce the risk for increased salinity. Leaching does move the salts further down in the ground, where they can eventually reach the groundwater, but the risk for this should be the same as when the greywater is thrown out on the streets. Differences in EC changes in individual vertical garden may be explained by differences in household habits, including water and detergent use, as well as application method. Since the greywater at each household was not tested, conclusions about how varying greywater quality affects EC in the systems based on these results cannot be discussed. When looking at the vertical gardens in the households, there were generally significant differences in EC between sampling levels at the top, middle and bottom for. As can be seen in Figure 58, there was a higher mean EC in the bottom level of the average vertical garden, followed by the middle and top level. According to Ayers and Westcot (1985), the salinity concentrations will often increase with depth due to leaching as a result of each water application, as could be indicated here. There was an overall increase of 1056 µS/cm in mean EC from combined data from VG 1-5 from 2009 to 2010, when looking at an average system. But when looking at each sampling level individually, there was a mean increase of 704 µS/cm in the top level, 1382 µS/cm in the middle level and 1084 µS/cm in the bottom. This could signify that there was a leaching of salts from the top layer to the middle layer. On the other hand, this variation in EC could also indicate that different heights of the vertical garden receive different amounts of greywater. In this case, it would seem that greywater enters the plant soil most at the bottom, followed by the middle and top levels. This would support the idea of how water flows through the system discussed under the Technical Performance section above. This pattern suggest that less water reaches the top layer of soil, compared to the rest of the system, due to the metal bucket around the center stones in the top 16 cm of soil, and that more water enters the middle and bottom levels as the water moves through the center core. The most water enters the bottom level of plant soil once the greywater has filled up the gravel at the bottom of the system and then enters the plant soil. Results could indicate
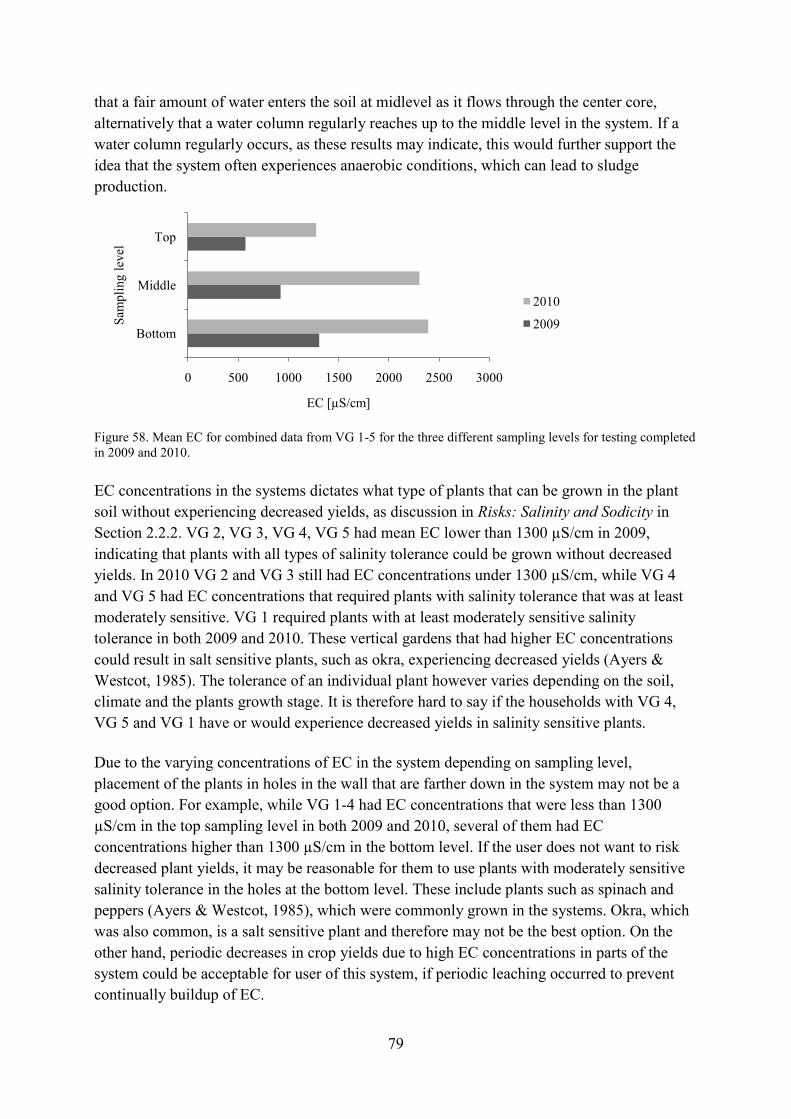
79
that a fair amount of water enters the soil at midlevel as it flows through the center core, alternatively that a water column regularly reaches up to the middle level in the system. If a water column regularly occurs, as these results may indicate, this would further support the idea that the system often experiences anaerobic conditions, which can lead to sludge production.
Figure 58. Mean EC for combined data from VG 1-5 for the three different sampling levels for testing completed in 2009 and 2010. EC concentrations in the systems dictates what type of plants that can be grown in the plant soil without experiencing decreased yields, as discussion in Risks: Salinity and Sodicity in Section 2.2.2. VG 2, VG 3, VG 4, VG 5 had mean EC lower than 1300 µS/cm in 2009, indicating that plants with all types of salinity tolerance could be grown without decreased yields. In 2010 VG 2 and VG 3 still had EC concentrations under 1300 µS/cm, while VG 4 and VG 5 had EC concentrations that required plants with salinity tolerance that was at least moderately sensitive. VG 1 required plants with at least moderately sensitive salinity tolerance in both 2009 and 2010. These vertical gardens that had higher EC concentrations could result in salt sensitive plants, such as okra, experiencing decreased yields (Ayers & Westcot, 1985). The tolerance of an individual plant however varies depending on the soil, climate and the plants growth stage. It is therefore hard to say if the households with VG 4, VG 5 and VG 1 have or would experience decreased yields in salinity sensitive plants.
Due to the varying concentrations of EC in the system depending on sampling level, placement of the plants in holes in the wall that are farther down in the system may not be a good option. For example, while VG 1-4 had EC concentrations that were less than 1300 µS/cm in the top sampling level in both 2009 and 2010, several of them had EC concentrations higher than 1300 µS/cm in the bottom level. If the user does not want to risk decreased plant yields, it may be reasonable for them to use plants with moderately sensitive salinity tolerance in the holes at the bottom level. These include plants such as spinach and peppers (Ayers & Westcot, 1985), which were commonly grown in the systems. Okra, which was also common, is a salt sensitive plant and therefore may not be the best option. On the other hand, periodic decreases in crop yields due to high EC concentrations in parts of the system could be acceptable for user of this system, if periodic leaching occurred to prevent continually buildup of EC.
0 500 1000 1500 2000 2500 3000
Bottom
Middle
Top
EC [µS/cm]
Sam
plin
g le
vel
2010
2009
80
The mean pH for greywater that is applied to systems in Sector 27, e.g. dish and laundry, was 6.4 based on CREPA‘s baseline study. This is within the 6 to 8.5 recommended pH range for irrigation water according to USEPA (2004). As mentioned before, the measured parameters by CREPA might not necessarily reflect the actual pH in greywater at the individual households with vertical gardens since composite samples were used. The pH in all systems decreased between testing done in 2009 and 2010. The decrease in VG 1-5, from an average of 8.2 in 2009 to 7.9 in 2010, could be an indication of the effect of greywater on the plant soil, though VG A also had decreased pH although it was only watered with freshwater. Using measurements done in 2009 on VG A to represent a new system, since it was unused at the time, a new system would have on average a pH of 8.5. In reality this value varies depending on the type of manure used in the 2:1 black soil and manure mixture that is used in each system. If the mean pH of 6.4 is a representative value for the greywater being applied to the systems, than it is possible that greywater is lowering the pH of the plant soil, both directly and indirectly through the nitrification of nitrogen which increases acidity (Bardy & Weil, 1996). Differences in pH between 2009 and 2010 samplings can also be caused by fluctuations in soil pH caused by the leaching of salts downward in the system or by natural seasonal variation. Brady and Weil (1996) noted that decomposition of organic material which resulted in more organic and inorganic acids can cause pH in a soil to decrease, which could also be the case here since greywater has generally high amounts of organic matter. Furthermore, there is a natural decrease in the soil pH when plants are grown, due to the roots exchanging positively charged ions with H+ ions, when they are taken up from the soil. It can therefore not be concluded if decreased pH is the result of greywater irrigation or not. Variation in pH between vertical gardens can be explained with variations in household activities, e.g. application methods, water and detergent usage. Differences in the soil‘s buffering capacity can also account for this variation, as soil‘s ability to buffer against pH differs depending on the soil. There were statistically significant differences between sampling levels in all vertical gardens except for VG 2. The pH was highest at the top and generally decreased towards the bottom of the system. If the decreased pH is a result of greywater irrigation, this could indicate that greywater enters different parts of the soil more than other, in same way as described for EC earlier in this section, e.g. more water enters the bottom level, followed by middle and top levels. The vertical gardens that had a mean pH over 8, e.g. VG 1-4 in 2009 and VG 1, VG 2 in 2010, may experience decreased plant yields, since certain plant nutrient such as iron become inaccessible (Ayers & Westcot, 1985). EC and pH results point to normal soil conditions in all systems in 2010, according to Brady and Weil‘s (1996) definition of normal soils, e.g. a pH less than 8.5 and EC less than 4000 µS/cm. This means that there is at present no need to worry about soil health in regards to
81
salinity and pH. If the increase in EC and decrease in pH are caused by greywater irrigation then there might be long-term problems in the soil if certain measures, such as leaching, are not taken. The necessary measures that are to be taken depend on the lifespan of the system and on the user‘s willingness to have reduced plant yields. It is nevertheless recommended the EC and pH trends continue to be monitored in order to determine more precisely what long-term salinity and pH effects can result from greywater reuse. While various households did note certain problems with plant health, it was not determined in the course of this research if the problems experienced were common in the area for that type of plant regardless of the water used for irrigation, or if they only occurred when greywater was used for irrigation.
System requirements
Having a vertical garden requires an engaged user. For the system to function properly, to produce plants safe for human consumption and to be long lasting, the user has to be well informed. This includes information relating to application techniques, crop restrictions, water loading capacity and on the benefits, both financial and human health, that arise when the system is used properly right. For the systems to be used properly, thorough education is needed and has to be offered by the organization offering these solutions. With the present design, clogging due to sludge accumulation in an anaerobic system required frequent maintenance. The design makes it possible to clean the center core free from sludge, but more or less impossible to clean the soil and bottom gravel layer without taking the whole system apart. It is therefore important to make sure that the applied water contains as little solid matter as possible, in order to extend the lifespan of the system. It is also important that aerobic conditions are maintained by not overloading it. Ideally, some sort of primary treatment should be installed to reduce the BOD load as well as larger solid matter. Even though the families had been told to make sure that no water containing food residue was applied onto the systems, pieces of food, plastics and hair were observed in the center core and on the plant soil. Materials like this can also increase the risk of clogging, the risk for unpleasant odors and decrease the expected lifespan of the system, which in turn increases the need for frequent maintenance. It was observed, that cleaning of the center core was a labor-intensive process, in which the cleaner had to almost crawl into the center of the system to remove the last center stones. Cleaning the system is therefore a health risk if done improperly and not a process that can be done by everyone in the household, if it can even be properly done by anyone there. There were also indications of poor safety precautions, such as no gloves and improper sludge disposal practices, which suggest that more education is required for the persons intended to maintain the systems. If CREPA wants to use this system at several hundred households, the question of who would clean the systems, who would pay for these cleanings and who would regulate them, must be examined. As the implemented vertical gardens needed cleaning after less than one year of use, maintenance costs for the systems over their whole lifespan could be expensive.

82
7.1.2 Assessment of health risk As discussed in Section 2.2.2, the greatest health risk associated with the reuse of greywater as irrigation water is the direct human contact with pathogen contaminated water or with parts of the system and plants that have been in contact with the contaminated greywater. WHO (2006) suggests that plants to be consumed should not be irrigated with greywater that contains E. coil levels higher than 103 FC/100mL to 105 FC/100mL, depending on if the vegetables will be eaten raw or not. The concentration of E. coli in the greywater in Sector 27 according to CREPA‘s baseline study was in the range of 105 FC/100mL. This suggests that the risk for pathogen transmission and the resulting health risks vary depending on the preparation method used before the plants are consumed. According Yofe (pers.comm.) these measurements are likely highly misleading, which may be due to issues regarding indictor organisms as discussed earlier in Section 2.1.1. To eliminate any potential risk, direct contact between greywater and plants should be avoided (Gerba & Smith, 2005), something which was not successful in the current system based on the design and system usage patterns. During application, direct contact between greywater and the top soil plant parts was hard to avoid and in most cases inevitable. Plants were often in contact with the greywater, which can increase the risk for pathogen transmission. This may be due to an insufficient user education or to the fact that it is impractical for the families to achieve this, as greywater application would have to be stopped for a time. As described in Diminishing Risks in Section 2.2.2, the risk for infection when consuming the plants can be reduced by washing, disinfecting, peeling and cooking vegetables before consuming them; cooking is a very efficient microbiological barrier. All households washed their vegetables with fresh water before consumption and in most cases they were cooked as well. It should be noted that consumption of fresh vegetables, like tomatoes, also occurred. It is recommended that if use of the system is to continue, then only vegetables that are cooked before being consumed be grown. The households did not observe any rules in regards to the amount of time that should pass between irrigation and plant consumption, e.g. several days according to Barker-Reid et al. (2009). But, since Ouagadougou has on average 306 days a year without rain, there is a chance that sunlight kills the majority of pathogens on plants and the surface of the plant soil, as sun decreases pathogen survival, though more research is needed before any such statement can be taken into consideration. Health risks are higher in households with small children, which can be expected in most households in Ouagadougou. Though diaper-washing water was not applied to the system, bathwater from washing children was, which could also increase the risk for the introduction of fecal matter. The credibility of this information should also be questioned, as it was clear in several cases that the interviewee answered what they thought was the interviewer‘s desired answer. If water from diaper washing is applied to the systems, the risks of using this greywater source should be emphasized during the user‘s system education or new systems should be designed which eliminated the contact of greywater with plants during the application process, as it could increase the risk for pathogen transmission.
83
When the systems are cleaned, direct contact between potentially contaminated system parts and the person performing the cleaning is inevitable. As mentioned earlier, cleaning was performed with minimal safety protection and poor sludge handling, which is not recommended. Guidelines for cleaning and necessary education to reduce potential contact with pathogens should be adopted. Regardless of the cleaning methods that are used, maintenance requirements should be kept as low as possible as system contact poses a health risk (WHO, 2006). This means that proper system use should be implemented, and the system should be designed, so that the frequency of cleaning is lowered. With the current conditions, sludge had accumulated after six months to levels that required cleaning, which is significantly more frequent than ONEA‘s recommended greywater disposal solution, leach pits, which are only cleaned every 10 to 20 years (Dagerskog, pers.comm.). Both the observed system usage patterns and system cleaning point to the fact that proper education is necessary for the users to better be able to control the health risks associated with these. Though CREPA did provide some training when the systems were used, no information on how usage patterns can increase or decrease health risks were given (Yofe, pers.comm.). The alternative way of disposing greywater if systems are not used, e.g. throwing greywater directly onto the streets, also entails a health risk as the greywater is out in the open and can readily come into contact with animals and humans. It is therefore important to also consider which one of these two alternatives carries the greatest health risk, when considering if vertical gardens is an acceptable system in regards to possible risks. This is not always easy to decide. A major difference, and possibly a deciding factor, is that vertical gardens produce food that is consumed. Since the main pathogen transmission route is fecal to oral, there is an increased health risk if proper water application and food preparation measures are not taken when using a vertical garden. This risk for potential pathogen transmission should also be weighted up against the health effects of an improved and more varied diet, especially in countries experiencing food shortages, such as Burkina Faso.
7.1.3 Environmental aspects The majority of households used OMO and industrially and locally produced soaps. The exact chemical composition of these are not known, so it is hard to estimate the negative environmental effects that result from their use or if any possible negative effects can be diminished if other soaps were used. Unless there is some incentive for the households to change detergents, e.g. from a national level or because of economic benefits, it is unlikely that their chemical usage patterns will change in the near future. Changes in salt levels and pH that result due to greywater use and their possible negative effects, discussed in Risks in Section 2.2.2, are not deemed to be greater than the present risks that result from discarding of the greywater on the streets outside of homes. While the risk of groundwater and surface water contamination as a result of using vertical gardens is not examined in this thesis, it can be noted that the risk that results due to use of
84
such a system is not greater than the current method of greywater disposal. Greywater that is thrown of onto the same area of the street can pose just as high a risk to other water sources. The materials used to build the system are for the most part common in the area, but how the production of them, or an increased production of them, affects the environment was not investigated. It was observed that there is a need for CREPA to initiate measures so the sludge produced in the system is properly disposed of, as sludge is currently being thrown out on the street when the systems are cleaned. This can result in an increased risk to surrounding water sources and soils, though this depends on the makeup of the sludge, which is not known.
7.1.4 Socio-cultural aspects While this thesis does not focus specifically on socio-cultural aspects, it can be interesting for future studies to discuss observations regarding such aspects that were noted during the course of the study. There was a large tendency for the households being interviewed to give the answer they assumed was right, instead of saying what they actually thought. Why this is so and ways to work around it should be explored if other interviews are to be completed, as it is important to have information on the shortcomings, perceived and real, of the systems in order to improve them. The gender aspect is also important as women play a central role in water collection, use and disposal in West Africa (Crisman et al., 2003; Clartee, 1991). It was observed that it was mostly woman and children that were at home doing activities that produced greywater, which indicates that it is important to focus on including them in user education if the systems are to be used properly. It was also noted that using a female translator evoked more involvement from the people being interviewed, as they were mostly women, when compared to a male translator. It is also possible that this was due to the fact that the people being interviewed did not like the male translator due to other reasons than his gender. Considering the main users of the system, a major drawback in the design of the vertical garden is the height of the system. It can be difficult for women to lift heavy buckets of greywater 80 cm off the ground to pour perfectly in the middle of a hole in the center of the vertical garden. An application inlet at a lower height would be preferable.
7.1.5 Economical aspects The construction cost for an implemented vertical garden is 25% of the cost of ONEA‘s recommended leach pit for greywater disposal, making it at first glance a more economically viable option. But considering the additional costs and time for required maintenance, it may not be the most economical system in the long run. One of the major problems with respect to costs was the fact no one was sure what the lifespan of the system was. If the lifespan is significantly less than the recommended leach pit, it can be discussed if it is worth investing in a vertical garden, especially as most households already had some type of leach pit for shower water.
85
The profits that can results from food production on such a little area can be discussed too. Certain households suggested an economical profit of 50 to 600 fCFA per week for food that was grown in system. If their estimations are right this would be a profit of 2600 fCFA to 31 200 fCFA a year, which could make amount to a significant difference in food costs and food security for that household. Taking this figure into account, this would also mean the construction costs for a vertical garden (26 000 fCFA) would be paid off in just over 10 months to 10 years, depending on the profit resulting from plants. If the payoff time was 10 years would the system still be in use then? The payoff time could decrease even more if the vertical gardens were also planted successfully on the sides instead of just on the top. While it has been demonstrated to the households by CREPA how the system could be planted at the top and on the sides, no information on the economical benefits of planting the system on the sides had been given. CREPA believed that this was why so few families had utilized the option. The Planting a vertical garden experiment (Section 0) was done in order to quantify the economical pay-back time for a fully planted system versus a system only planted at the top. Unfortunately, the data collected was insufficient to draw any real conclusions. The reason for this was insufficient time for conducting this type of experiment.
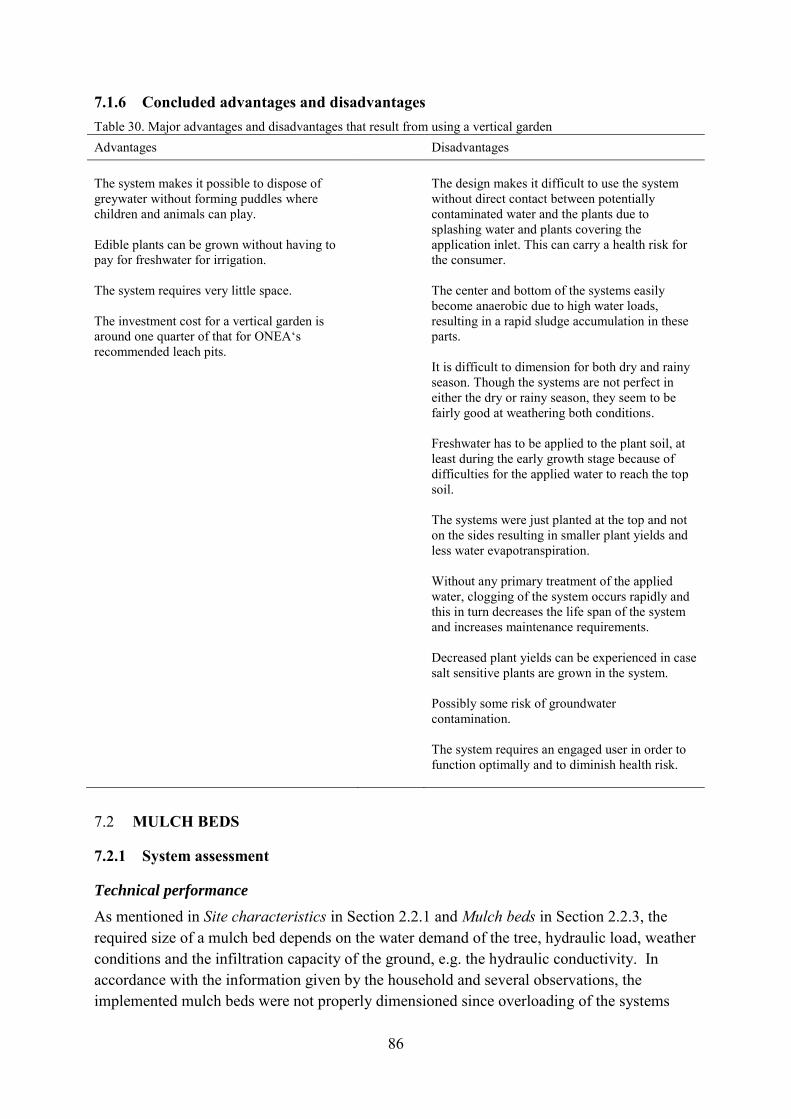
86
7.1.6 Concluded advantages and disadvantages Table 30. Major advantages and disadvantages that result from using a vertical garden Advantages Disadvantages The system makes it possible to dispose of greywater without forming puddles where children and animals can play. Edible plants can be grown without having to pay for freshwater for irrigation. The system requires very little space. The investment cost for a vertical garden is around one quarter of that for ONEA‘s recommended leach pits.
The design makes it difficult to use the system without direct contact between potentially contaminated water and the plants due to splashing water and plants covering the application inlet. This can carry a health risk for the consumer. The center and bottom of the systems easily become anaerobic due to high water loads, resulting in a rapid sludge accumulation in these parts. It is difficult to dimension for both dry and rainy season. Though the systems are not perfect in either the dry or rainy season, they seem to be fairly good at weathering both conditions. Freshwater has to be applied to the plant soil, at least during the early growth stage because of difficulties for the applied water to reach the top soil. The systems were just planted at the top and not on the sides resulting in smaller plant yields and less water evapotranspiration. Without any primary treatment of the applied water, clogging of the system occurs rapidly and this in turn decreases the life span of the system and increases maintenance requirements. Decreased plant yields can be experienced in case salt sensitive plants are grown in the system. Possibly some risk of groundwater contamination. The system requires an engaged user in order to function optimally and to diminish health risk.
7.2 MULCH BEDS
7.2.1 System assessment
Technical performance
As mentioned in Site characteristics in Section 2.2.1 and Mulch beds in Section 2.2.3, the required size of a mulch bed depends on the water demand of the tree, hydraulic load, weather conditions and the infiltration capacity of the ground, e.g. the hydraulic conductivity. In accordance with the information given by the household and several observations, the implemented mulch beds were not properly dimensioned since overloading of the systems
87
was frequent. One of the two implemented systems was even taken out of use because of this, when the tree started dying. It was noted in the other system, which was still in use, that there was a standing water surface in the mulch. In order for a mulch bed to work as intended and for the mulch to be digested, the microorganisms present in the mulch require oxygen. This necessary aerobic environment was not available in the implemented systems as they were constantly overloaded and full of water. Anaerobic environments in mulch bed can also cause unpleasant odors, as well as hamper the development of plant roots and worms in the mulch. Also, standing water can create a problem with increased mosquito breeding, which should always be avoided in areas with malaria. The hydraulic loading rate based on the generated greywater amounts in CREPA‘s Baseline study was 35 mm/d. Considering that the hydraulic conductivity of the Ouagadougou soils can be as low as 10 mm/d and the average daily reference potential evapotranspiration is 6 mm/d (based on the average yearly reference potential evapotranspiration, Section 3.1), it can be estimated that 19 mm/d of water does not leave the mulch bed through infiltration or evapotranspiration. This calculation assumes saturated flow, clean water and that the infiltration to the sides of the pit is zero, which is not theoretically realistic. The mulch bed is 30 cm deep, which means that there is enough room to store this water, but with a risk of creating anaerobe conditions in the mulch, which was evident. Anaerobic conditions lead to anaerobic digestion of organic materials. As mentioned in System requirements in Section 2.2.1, this, in combination with a lot of available biodegradable carbons, results in formation of a thick sludge that can lead to clogging in the system. The fact that the implemented systems are showing signs of overloading with the current quantities of greywater can be a sign of clogging in the ground under the mulch and in the mulch in the system is occurring.
Soil and plant health
The two mulch beds were implemented in the same household, though the use of MB 2 had been discontinued during the rainy season a few months earlier. Interestingly enough, there was no significant difference between EC data from the two systems. This could indicate that there is no salt accumulation in MB 1 due to greywater irrigation. The fact that the MB 1 and MB 2 do not differ in spite of the fact that one was in use and one was not may also be an indication of low concentrations of salts in the greywater that is produced by the household in question. It was noted that the mulch of MB 2 was filled with old dirt, dog fecal matter, garbage and ants, which were not present in MB 1. If this extra material increased EC in MB 2, which is plausible, it could indicate that EC in MB 1 was also increasing due to greywater, though there were no other values to compare this with. Both of the mulch beds had lower mean EC in samples taken closer to the tree than at a slightly farther distance (435 µS/cm versus 569 µS/cm in MB 1 and 269 µS/cm versus 666 µS/cm in MB 2). If high EC was caused by greywater, this may indicate that the majority of the greywater was applied closer to the outer edge of the mulch bed. In MB 1 sampling position 2 had the highest EC, which may indicate that greywater application to the mulch bed commonly occurred around this location. The raw data for sample B.2 (outer border, position 2) are the highest for all EC samplings, which supports the suggestion of frequent application
88
in one spot and a risk for increased EC as a result of greywater irrigation. Position 2 was the sampling position that was closest to the freshwater tap and where buckets for washing and cleaning stood, as well as the wettest part of the mulch bed, which all strengthens this interpretation. The low concentrations of measured EC in the mulch bed indicate that all types of salt sensitive plants can be grown in the system. MB 1 had a lower, significantly different pH when compared with MB 2 (7.96 versus 8.43). Since mulch beds using organic mulch can lower pH (Billeaud & Zajicekz, 1989), this may be an indication that MB 1 was functioning to some level, while the biological and chemical benefits of the mulch in MB 2 were lost as it was no longer active.
Both the distance from the tree and the sampling position around MB 1 were significant for pH, with the lowest pH close to the outer edge of the system and in sampling position 1. This may once again be an indication of a more popular application position. If the greywater lowers pH in the mulch, it would indicate that the outer border and position 1 are most often used, which does not exactly match results for EC, but of course the most used application spot could also be somewhere in between, especially as the EC and pH concentrations in these positions are not only affected by greywater application but also by other factors, such as the mulch, garbage in the system and/or initial homogeneity.
Though tree and plants growing in the system should not experience any problems due to measured EC and pH concentrations, the reoccurring standing water pools in the mulch are not positive for plant growth due to anaerobic conditions. The mulch beds need to be dimensioned to avoid such problems.
System requirements
The required yearly maintenance for a mulch bed is the addition of new organic material every year, which is theoretically easy. Two problems emerged from observations and interviews, one of which was that organic material is not available year round, as trees are leafless under a large portion of the year due to drought. This means that it is necessary for the user to be informed when during the year they should be making the effort to collect and apply organic material; if they wait, it will not be available until the following year. Another major problem was the fact that user could not seem to tell the difference between organic matter, such as leaves, and plastic bags and appeared to throw both on the mulch beds It was not known if due a poor understanding of the definition of organic material or how the system works. It could also be caused by laziness on the part of the user. According to Ludwig (2004), a mulch bed must be resized every few years to accommodate the growth of the tree. This means that mulch must be removed, the trench around the tree must be made bigger and the old mulch, as well as new mulch, must be replaced. Education on this process and when it should happen for the system to continue to work properly should be included by CREPA.
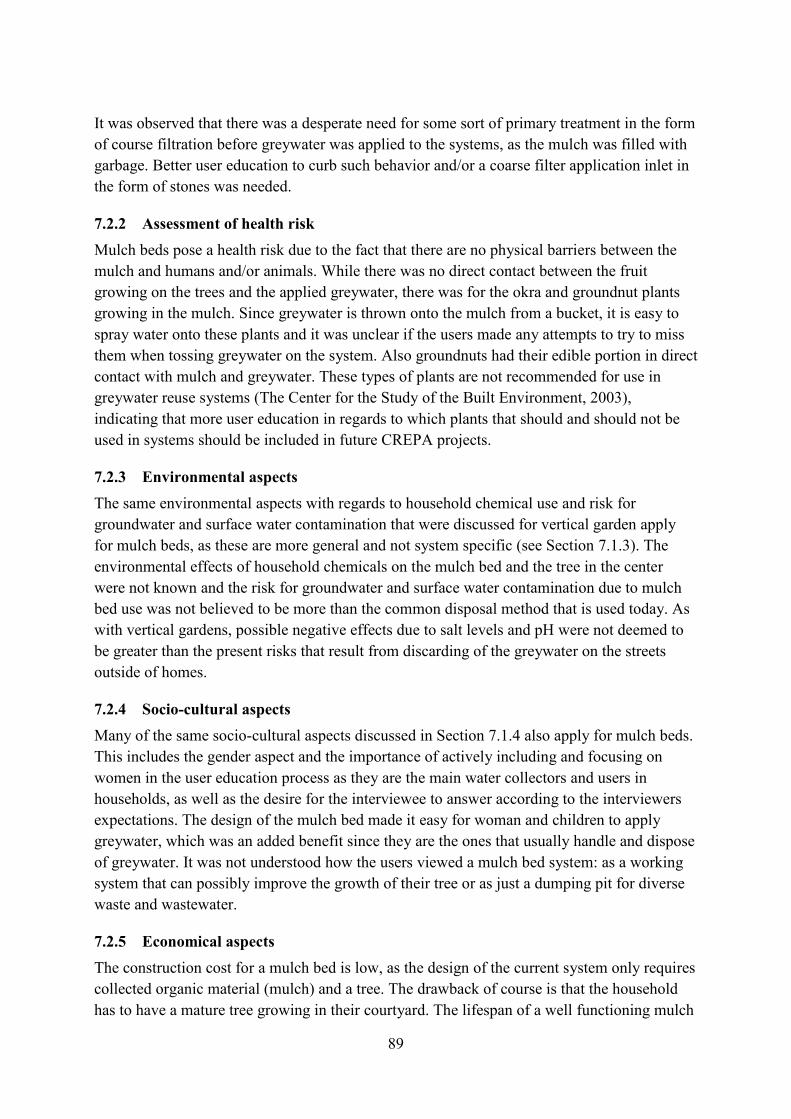
89
It was observed that there was a desperate need for some sort of primary treatment in the form of course filtration before greywater was applied to the systems, as the mulch was filled with garbage. Better user education to curb such behavior and/or a coarse filter application inlet in the form of stones was needed.
7.2.2 Assessment of health risk Mulch beds pose a health risk due to the fact that there are no physical barriers between the mulch and humans and/or animals. While there was no direct contact between the fruit growing on the trees and the applied greywater, there was for the okra and groundnut plants growing in the mulch. Since greywater is thrown onto the mulch from a bucket, it is easy to spray water onto these plants and it was unclear if the users made any attempts to try to miss them when tossing greywater on the system. Also groundnuts had their edible portion in direct contact with mulch and greywater. These types of plants are not recommended for use in greywater reuse systems (The Center for the Study of the Built Environment, 2003), indicating that more user education in regards to which plants that should and should not be used in systems should be included in future CREPA projects.
7.2.3 Environmental aspects The same environmental aspects with regards to household chemical use and risk for groundwater and surface water contamination that were discussed for vertical garden apply for mulch beds, as these are more general and not system specific (see Section 7.1.3). The environmental effects of household chemicals on the mulch bed and the tree in the center were not known and the risk for groundwater and surface water contamination due to mulch bed use was not believed to be more than the common disposal method that is used today. As with vertical gardens, possible negative effects due to salt levels and pH were not deemed to be greater than the present risks that result from discarding of the greywater on the streets outside of homes.
7.2.4 Socio-cultural aspects Many of the same socio-cultural aspects discussed in Section 7.1.4 also apply for mulch beds. This includes the gender aspect and the importance of actively including and focusing on women in the user education process as they are the main water collectors and users in households, as well as the desire for the interviewee to answer according to the interviewers expectations. The design of the mulch bed made it easy for woman and children to apply greywater, which was an added benefit since they are the ones that usually handle and dispose of greywater. It was not understood how the users viewed a mulch bed system: as a working system that can possibly improve the growth of their tree or as just a dumping pit for diverse waste and wastewater.
7.2.5 Economical aspects The construction cost for a mulch bed is low, as the design of the current system only requires collected organic material (mulch) and a tree. The drawback of course is that the household has to have a mature tree growing in their courtyard. The lifespan of a well functioning mulch
90
bed is also theoretically long as long as they are used properly, e.g. new organic material being added when needed, and not overloaded. The profits that can results from food production are not known as the trees that were being used in the mulch beds were already there before the actual system was built. There is a possibility that mulch beds encourage the growth of the tree due to the extra organic material and nutrients (Ludwig, 2003), though this depends on a number of factors including if the system used properly, which was not the case here.
7.2.6 Concluded advantages and disadvantages Table 31. Major advantages and disadvantages that result from using a mulch bed
Advantages Disadvantages Might produce fertile mulch that can be used or sold. Easy to apply water. Irrigates the tree without having to worry about costs for freshwater. If used properly and depending on the type of organic mulch, tree growth can improve. Salt sensitive plants can be grown in the system.
Requires a fairly large space. The implemented systems were not big enough to handle all the water that was applied, causing anaerobic mulch and open water surfaces. Overloading the system may kill the tree. Requires that the household has a mature tree growing in their courtyard. An overloaded mulch bed allows for easy direct contact between the greywater in the mulch and animals and/children. New organic material has to be added
7.3 EFFECTS OF GREYWATER ON PLANTS AND SOIL
7.3.1 Greywater as irrigation water Plant containers that were watered with greywater had a lower mean wet and dry weight for spinach yields when compared with those plant containers watered with freshwater. This could be an indication of the negative effect of greywater on young plants, as discussed in Reducing Risks in Section 2.2.2, but the results of the experiment are inconclusive. This is mostly due to the fact that the planned time allotted for the experiment proved to be too short for the conditions given and there was no extra time for an extension of experiment. The results nevertheless suggest that this may be an interesting area for further research in the future for CREPA, as the negative and positive effects of greywater on plants need to be better understood before promoting greywater reuse systems. EC and pH were measured in this experiment, though they were not conclusive as the number of samples was small. The EC and pH were fairly constant in all plant containers in the beginning of the experiment, with a mean for all plant containers of 1284 μS/cm and 8.07 respectively. When the experiment ended 28 days later, there was an increase in EC in all containers, though this increase was almost ten times higher in containers watered with greywater (1288 μS/cm compared with 135 μS/cm). If the increased EC in the soil watered with greywater proved to be significant in future studies this could mean that measures to
91
counteract salinity, such as leaching must be introduced into system education programs. While pH was relatively constant in all containers when tested 28 days later, the decrease in pH in the containers irrigated with greywater could indicate that greywater does reduce pH, especially as this was also seen for the vertical gardens. No statistical analyses to test significant differences were done. The time frame of the experiment may also have been too short to produce relevant results.
7.3.2 The effect of greywater on soil The leakage that occurred in the three rings that had greywater applied resulted in infiltration rates that cannot be used to interpret the results of the effect of greywater on the ground. The appearance of the colony of ants in these rings can explain the resulting problems with leakage on tests done on day 36. Ants could also be an indication that greywater irrigation in one spot attracts insects, which may cause problems in systems. On the other hand they may improve their function by eating up sludge and working the soil surface in a way that may decrease problems that can occur due to soil surface crusting, though this has not been researched or examined in the scope of this work. The similar decrease in infiltration in rings B, C and the control ring in the plant soil in vertical gardens suggest that greywater does not affect infiltration, at least not at this loading rate, when the surface was essentially aerobic all the time. The reason for the increase in infiltration in ring A is not known. According to Ayers and Westcot (1985) infiltration can increase in soil if wastewater used to irrigate it has high salinity, e.g. high EC, or high SAR. While the EC of the greywater mixture was not high (547 µS/cm), the SAR was not measured and therefore no conclusions can be drawn. Another possibility is that ants or some other insect had built a nest close to the ring, which was not visible from the surface. In the case of all rings, in both the plant soil in a vertical garden and in the ground, the time frame of the experiment may have been too short for a biofilm to develop. The white film that accumulated in the rings can indicate that a biofilm would eventually form. On the other hand this accumulation could also be due to a poorly mixed greywater mixture. There were not any major differences in the EC between rings in the plant soil of the vertical garden. This could depend on the fact that only three samples per ring were collected, and as seen in the results for EC testing completed on vertical gardens (Section 6.1.2), it is not uncommon with a large variation of data as EC varies depending on manure and moisture. The mean values for pH in rings watered with greywater were lower than the control ring, though this result is not conclusive due to the low number of samples. No EC and pH sampling were taken on the rings in the ground due to time constraints.
92
8 SUGGESTED IMPROVEMENTS AND ALTERNATE SYSTEMS Lessons learned while assessing the implemented systems (Section 7), as well as information from the report by Yofe (2009) on Greywater Characterization (Section 4.2), was used to identify important aspects to consider when suggesting improvements to the implemented systems and when planning the alternate system in Ouagadougou. Although improvements to the implemented vertical gardens and mulch beds were suggested, these systems are not in line with CREPA‘s goals, which is why a suggested alternate system might be worth testing.
8.1 REQUIREMENTS AND CONSIDERATIONS FOR A GREYWATER REUSE SYSTEM IN OUAGADOUGOU
The aspects outlined below should be considered when planning and implementing a greywater system that is applicable in an urban environment such as Ouagadougou and fulfills CREPA‘s goals of a low-cost, productive, easily maintainable and hygienically safe system. Greywater characterization: CREPA‘s greywater characterization is based on composite samples, meaning that water from different households was mixed without volume weighed proportions before analyzing. This is a problem because the distribution of data cannot be identified, which is of great interest considering that these systems will be used on a household level where water characteristics most certainly vary. A more detailed study of this would make it possible to suggest a more suitable system. Clogging and sludge accumulation: The implemented systems were too small which caused anaerobic conditions in the system; this in turn increased the sludge production that clogged the systems, leading to decreased infiltration and an increased risk of anaerobic conditions. While it is important for the systems to be as space-efficient as possible since they are used in a city where space is often a limiting factor, they still have to be well dimensioned. It is important that the greywater systems can receive the produced greywater without overloading. This includes taking into consideration precipitation and potential evapotranspiration differences during the dry and rainy season and the resulting fluctuations in water addition and abstraction that can affect the system. Figure 59 shows daily water addition (positive) or abstraction (negative) due to precipitation and reference potential evapotranspiration (ETo). The actual evapotranspiration will vary depending on the type of tree or plants growing in the system (Allen et al., 1998).Values when the ground‘s infiltration capacity is added are also displayed. When taking into account infiltration to the ground in Ouagadougou, there is continual water abstraction from the system throughout the year. But there is also a great variation in the amount of water that is abstracted from the system during the course of a year, which is important to consider when designing a system in order to avoid problems with overloading.
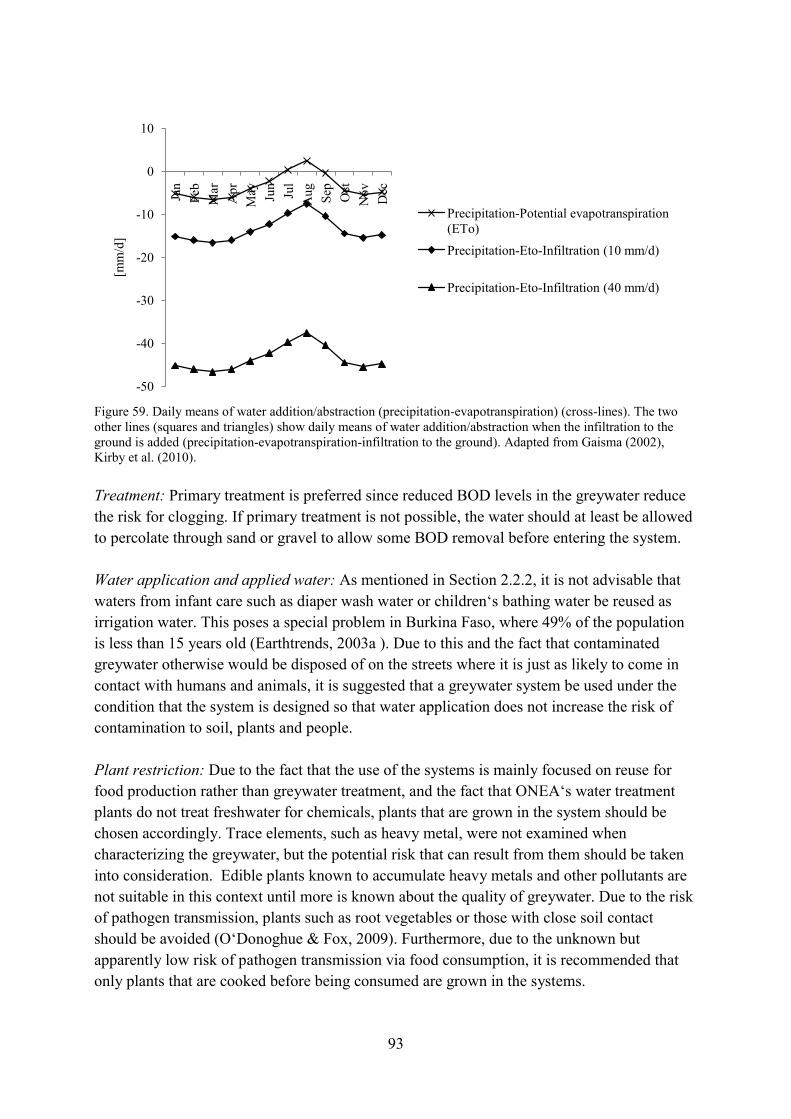
93
Figure 59. Daily means of water addition/abstraction (precipitation-evapotranspiration) (cross-lines). The two other lines (squares and triangles) show daily means of water addition/abstraction when the infiltration to the ground is added (precipitation-evapotranspiration-infiltration to the ground). Adapted from Gaisma (2002), Kirby et al. (2010). Treatment: Primary treatment is preferred since reduced BOD levels in the greywater reduce the risk for clogging. If primary treatment is not possible, the water should at least be allowed to percolate through sand or gravel to allow some BOD removal before entering the system. Water application and applied water: As mentioned in Section 2.2.2, it is not advisable that waters from infant care such as diaper wash water or children‘s bathing water be reused as irrigation water. This poses a special problem in Burkina Faso, where 49% of the population is less than 15 years old (Earthtrends, 2003a ). Due to this and the fact that contaminated greywater otherwise would be disposed of on the streets where it is just as likely to come in contact with humans and animals, it is suggested that a greywater system be used under the condition that the system is designed so that water application does not increase the risk of contamination to soil, plants and people. Plant restriction: Due to the fact that the use of the systems is mainly focused on reuse for food production rather than greywater treatment, and the fact that ONEA‘s water treatment plants do not treat freshwater for chemicals, plants that are grown in the system should be chosen accordingly. Trace elements, such as heavy metal, were not examined when characterizing the greywater, but the potential risk that can result from them should be taken into consideration. Edible plants known to accumulate heavy metals and other pollutants are not suitable in this context until more is known about the quality of greywater. Due to the risk of pathogen transmission, plants such as root vegetables or those with close soil contact should be avoided (O‘Donoghue & Fox, 2009). Furthermore, due to the unknown but apparently low risk of pathogen transmission via food consumption, it is recommended that only plants that are cooked before being consumed are grown in the systems.
-50
-40
-30
-20
-10
0
10
Jan
Feb
Mar
Apr
May Jun
Jul
Aug Sep
Oct
Nov Dec
[mm
/d]
Precipitation-Potential evapotranspiration (ETo)
Precipitation-Eto-Infiltration (10 mm/d)
Precipitation-Eto-Infiltration (40 mm/d)
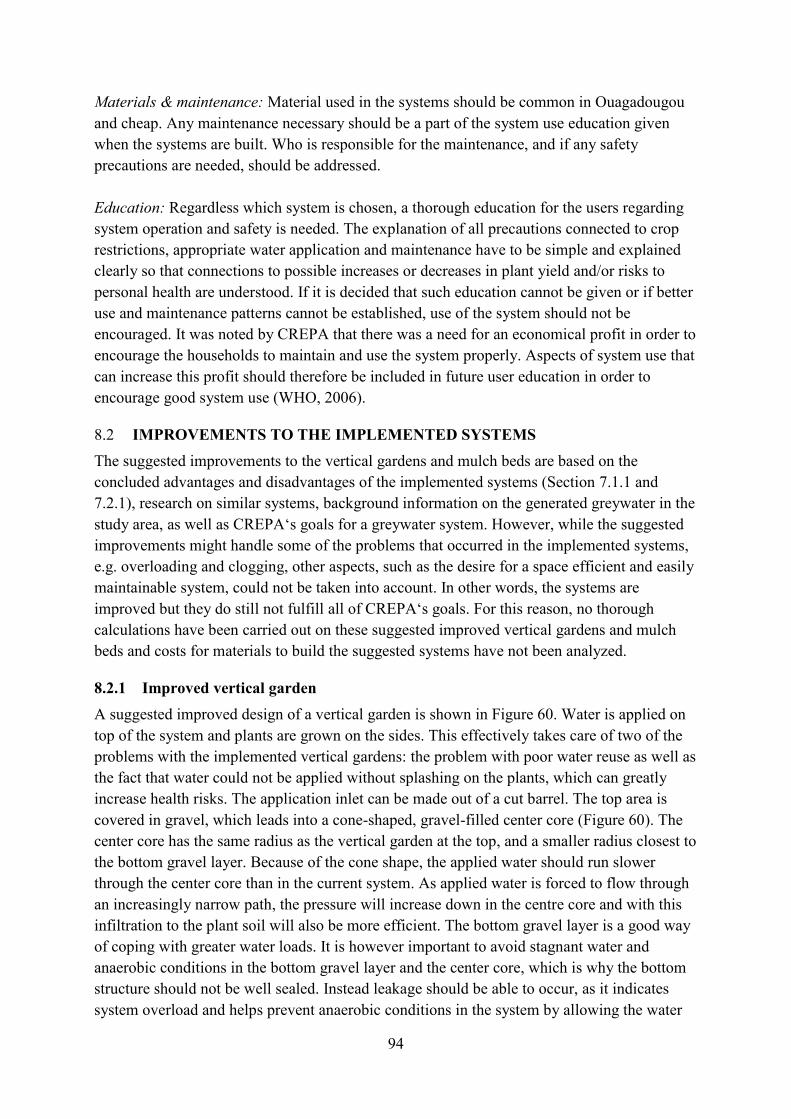
94
Materials & maintenance: Material used in the systems should be common in Ouagadougou and cheap. Any maintenance necessary should be a part of the system use education given when the systems are built. Who is responsible for the maintenance, and if any safety precautions are needed, should be addressed. Education: Regardless which system is chosen, a thorough education for the users regarding system operation and safety is needed. The explanation of all precautions connected to crop restrictions, appropriate water application and maintenance have to be simple and explained clearly so that connections to possible increases or decreases in plant yield and/or risks to personal health are understood. If it is decided that such education cannot be given or if better use and maintenance patterns cannot be established, use of the system should not be encouraged. It was noted by CREPA that there was a need for an economical profit in order to encourage the households to maintain and use the system properly. Aspects of system use that can increase this profit should therefore be included in future user education in order to encourage good system use (WHO, 2006).
8.2 IMPROVEMENTS TO THE IMPLEMENTED SYSTEMS The suggested improvements to the vertical gardens and mulch beds are based on the concluded advantages and disadvantages of the implemented systems (Section 7.1.1 and 7.2.1), research on similar systems, background information on the generated greywater in the study area, as well as CREPA‘s goals for a greywater system. However, while the suggested improvements might handle some of the problems that occurred in the implemented systems, e.g. overloading and clogging, other aspects, such as the desire for a space efficient and easily maintainable system, could not be taken into account. In other words, the systems are improved but they do still not fulfill all of CREPA‘s goals. For this reason, no thorough calculations have been carried out on these suggested improved vertical gardens and mulch beds and costs for materials to build the suggested systems have not been analyzed.
8.2.1 Improved vertical garden A suggested improved design of a vertical garden is shown in Figure 60. Water is applied on top of the system and plants are grown on the sides. This effectively takes care of two of the problems with the implemented vertical gardens: the problem with poor water reuse as well as the fact that water could not be applied without splashing on the plants, which can greatly increase health risks. The application inlet can be made out of a cut barrel. The top area is covered in gravel, which leads into a cone-shaped, gravel-filled center core (Figure 60). The center core has the same radius as the vertical garden at the top, and a smaller radius closest to the bottom gravel layer. Because of the cone shape, the applied water should run slower through the center core than in the current system. As applied water is forced to flow through an increasingly narrow path, the pressure will increase down in the centre core and with this infiltration to the plant soil will also be more efficient. The bottom gravel layer is a good way of coping with greater water loads. It is however important to avoid stagnant water and anaerobic conditions in the bottom gravel layer and the center core, which is why the bottom structure should not be well sealed. Instead leakage should be able to occur, as it indicates system overload and helps prevent anaerobic conditions in the system by allowing the water
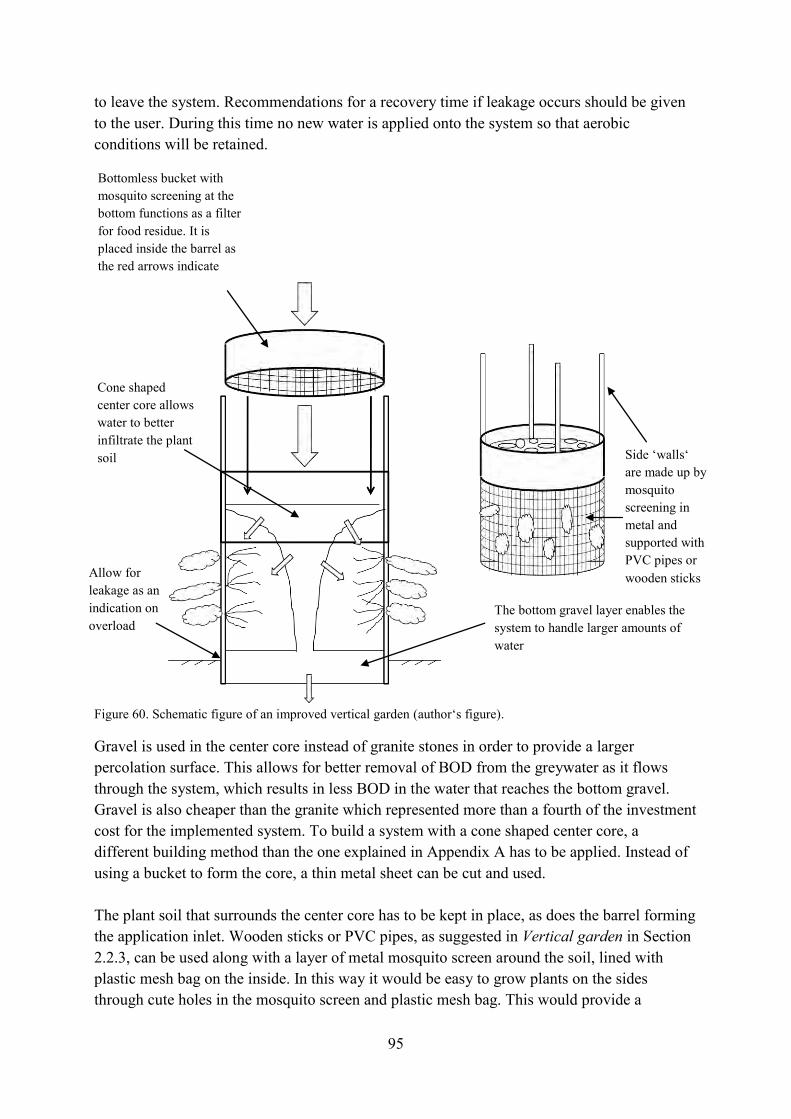
95
to leave the system. Recommendations for a recovery time if leakage occurs should be given to the user. During this time no new water is applied onto the system so that aerobic conditions will be retained.
Figure 60. Schematic figure of an improved vertical garden (author‘s figure). Gravel is used in the center core instead of granite stones in order to provide a larger percolation surface. This allows for better removal of BOD from the greywater as it flows through the system, which results in less BOD in the water that reaches the bottom gravel. Gravel is also cheaper than the granite which represented more than a fourth of the investment cost for the implemented system. To build a system with a cone shaped center core, a different building method than the one explained in Appendix A has to be applied. Instead of using a bucket to form the core, a thin metal sheet can be cut and used. The plant soil that surrounds the center core has to be kept in place, as does the barrel forming the application inlet. Wooden sticks or PVC pipes, as suggested in Vertical garden in Section 2.2.3, can be used along with a layer of metal mosquito screen around the soil, lined with plastic mesh bag on the inside. In this way it would be easy to grow plants on the sides through cute holes in the mosquito screen and plastic mesh bag. This would provide a
Bottomless bucket with mosquito screening at the bottom functions as a filter for food residue. It is placed inside the barrel as the red arrows indicate
Cone shaped center core allows water to better infiltrate the plant soil
Allow for leakage as an indication on overload
Side ‘walls‘ are made up by mosquito screening in metal and supported with PVC pipes or wooden sticks
The bottom gravel layer enables the system to handle larger amounts of water
96
planting surface twice the size of the one when the system is only planted on the top. This provides a greater surface for evapotranspiration, which increases the capacity of the system. To avoid food residue, garbage and other solid matter that increase the risk for clogging in the system, a bottomless plastic bucket with metal mosquito screening attached to the bottom, and with a slightly smaller radius as the barrel, can be placed inside the barrel and used as a filter. This filter is removable so that it can easily be cleaned (Figure 60). The suggested new design avoids many of the identified problems experienced in the implemented systems. However, if the bottom gravel layer needs to be cleaned or the soil needs to be changed, the whole system has to be taken apart. To decrease the hydraulic loading on the system, the water load on the system should be controlled to minimize anaerobic conditions.
8.2.2 Improved mulch bed The major problem with the implemented mulch beds was that they were under-dimensioned and easily became overloaded, resulting in anaerobic mulch. One way to improve their function is to calculate the size that is needed for the system to work in Ouagadougou. Considering climate conditions displayed in Figure 59, 10 to 45 mm/d of greywater can be handled assuming that the only infiltration that occurs from the mulch bed is the infiltration from the bottom of the mulch, e.g. horizontal infiltration is neglected. The hydraulic loading rate for the implemented systems was 35 L/m2/d (equals mm/d), which implies that the size of the current system should be enough in soils with higher hydraulic conductivity, e.g. around 40 mm/d. However, if the soil has a lower infiltration capacity, a larger bottom surface area is required. For soils with infiltration rates of 10 mm/d, 8 m2 is needed to be able to handle the applied amounts of water, which is over three times larger than the current mulch beds being used and is therefore not realistic in an urban environment with space constraints. If clogging is a problem in the system, this can be lessened by using a type of primary treatment, such as coarse filtration in the form of stones and gravel, at the area where water is applied. This would require that water only be applied from this one spot and not thrown on the system as is currently done. In a well dimensioned mulch bed, the mulch would not become anaerobic and by that, the greatest reason for clogging would be avoided, making this improvement unnecessary. Problems related to the lack of physical barrier between the mulch and users and/or animals are hard to solve without building a fence around the systems, which in general is not practical for the household using them.
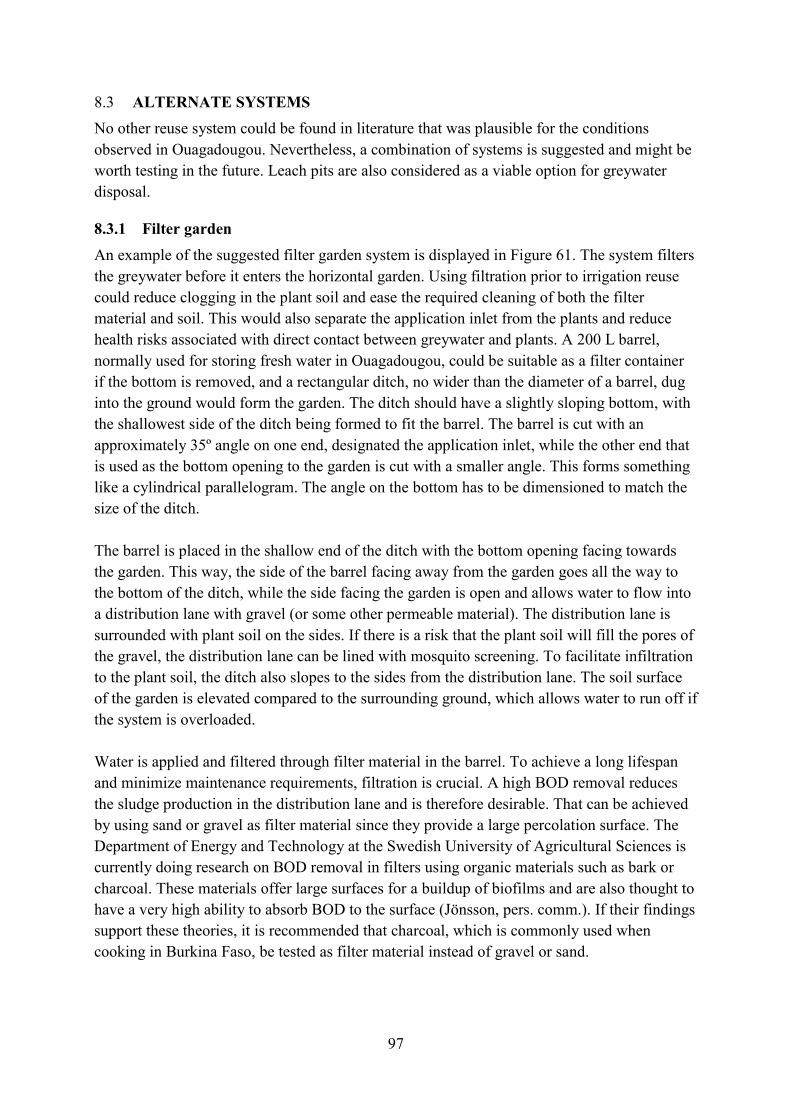
97
8.3 ALTERNATE SYSTEMS No other reuse system could be found in literature that was plausible for the conditions observed in Ouagadougou. Nevertheless, a combination of systems is suggested and might be worth testing in the future. Leach pits are also considered as a viable option for greywater disposal.
8.3.1 Filter garden An example of the suggested filter garden system is displayed in Figure 61. The system filters the greywater before it enters the horizontal garden. Using filtration prior to irrigation reuse could reduce clogging in the plant soil and ease the required cleaning of both the filter material and soil. This would also separate the application inlet from the plants and reduce health risks associated with direct contact between greywater and plants. A 200 L barrel, normally used for storing fresh water in Ouagadougou, could be suitable as a filter container if the bottom is removed, and a rectangular ditch, no wider than the diameter of a barrel, dug into the ground would form the garden. The ditch should have a slightly sloping bottom, with the shallowest side of the ditch being formed to fit the barrel. The barrel is cut with an approximately 35º angle on one end, designated the application inlet, while the other end that is used as the bottom opening to the garden is cut with a smaller angle. This forms something like a cylindrical parallelogram. The angle on the bottom has to be dimensioned to match the size of the ditch. The barrel is placed in the shallow end of the ditch with the bottom opening facing towards the garden. This way, the side of the barrel facing away from the garden goes all the way to the bottom of the ditch, while the side facing the garden is open and allows water to flow into a distribution lane with gravel (or some other permeable material). The distribution lane is surrounded with plant soil on the sides. If there is a risk that the plant soil will fill the pores of the gravel, the distribution lane can be lined with mosquito screening. To facilitate infiltration to the plant soil, the ditch also slopes to the sides from the distribution lane. The soil surface of the garden is elevated compared to the surrounding ground, which allows water to run off if the system is overloaded. Water is applied and filtered through filter material in the barrel. To achieve a long lifespan and minimize maintenance requirements, filtration is crucial. A high BOD removal reduces the sludge production in the distribution lane and is therefore desirable. That can be achieved by using sand or gravel as filter material since they provide a large percolation surface. The Department of Energy and Technology at the Swedish University of Agricultural Sciences is currently doing research on BOD removal in filters using organic materials such as bark or charcoal. These materials offer large surfaces for a buildup of biofilms and are also thought to have a very high ability to absorb BOD to the surface (Jönsson, pers. comm.). If their findings support these theories, it is recommended that charcoal, which is commonly used when cooking in Burkina Faso, be tested as filter material instead of gravel or sand.
98
Figure 61. Side and top view of filter garden design, where a filter is connected to a horizontal flow garden (author‘s figure).
The side of the barrel facing the garden is higher to prevent the plants from splashing water
The system can be built along one of the house walls
Filter material Distribution material
Plant soil
1. PRIMARY TREATMENT IN A FILTER
2. SECONDARY TREATMENT AND WATER REUSE IN A HORIZONTALGARDEN
Preferably a coarse filter made of for example mosquito screening should be placed at the inlet
A sloping bottom of the garden allows the water to reach the far end and for better infiltration into plant soil
Barrel
Any space between the barrel and the sides of the ditch should be sealed with cement so that the water will continue into the garden
The garden is slightly elevated to allow water to run off and prevent formation of anaerobic conditions
A low and separate application inlet facilitates safe application of greywater and heavy buckets can rest on the barrel when applying the water
Leakage of primary treated water from the garden may occur (indication of overload) and a recovery period (during which no water would be applied to the system) is then recommended
99
After filtration through the barrel, the water flows into the distribution lane and from there it is able to infiltrate into the plant soil, where it is available for plant uptake, or into the ground under the dugout ditch. The dimensions of the distribution lane and the garden itself, e.g. the dugout ditch, should be investigated to reduce the risk of overloading and to make sure the plants get enough water. The sloped ditch, that the garden and distribution material are placed in, makes it easier for the water to flow through the system; the garden end farthest away from the filter barrel is deeper than the other end, giving the bottom of the garden a slight slope. Because of the low infiltration rates of the soils in Ouagadougou, the ground does not need to be lined with impermeable material. This also lessens the risk of overflowing or leakage in the rainy season. The space between ditch walls and the barrel should, on the other hand, be sealed with cement to prevent leakage from the sand filter and to ensure that the water flows into the garden. Leakage from the garden on the other hand is an important indication of overload and anaerobic conditions in the system. Since the water has been partially treated in the filter before entering the garden, this leaking water is considered to be safer than untreated greywater. To prevent buildup of sludge, it is important that the system is allowed a recovery period when leakage occurs. During this time no water is applied, in order to retain aerobic conditions. The top of the barrel, which is also cut off at an angle, reduces the risk for splashing plants when applying greywater if the high end is facing the garden. It also simplifies application for shorter or weaker users, who can rest the bucket on the lowest edge of the barrel when applying the water. Preferably, mosquito screening should be used as a primary course filtration to prevent plastic, hair and food residue or other material from entering the system. If there is a risk that animals and children would play in the garden, a typical Ouagadougou plant protection fence, built with wood sticks and metal wire fencing material, can be placed around the garden. This two-in-one reuse system is believed to be cheap, hygienically safe and easy to maintain, which is in line with CREPA‘s system goals. It also takes into consideration the problems experienced with the vertical gardens and mulch beds. Nevertheless the system would of course require maintenance and user engagement, as any other reuse system.
Dimensioning a filter garden
As mentioned in Section 8.1, aspects to take into consideration when dimensioning a system are the water load, climate conditions, infiltration rate to the ground, crop coefficients for the planted crop and the fact that the capacity of the system will decrease with time due to the buildup of a biofilter. The water load for a system in Sector 27 is on average 80 L/d, though it varies between 40-120 L/d depending on the day. Laundry generates 40-80 L once or twice a week. The single crop coefficient for spinach is just below one (Allen et al., 1998), meaning that the evapotranspiration if spinach is grown is approximately the same as the potential evapotranspiration, so all calculations below are made assuming that spinach is grown in the garden. As indicated in Figure 59, somewhere between 10 to 45 mm/d of water is abstracted when average precipitation, potential evapotranspiration and the infiltration rate to the ground is considered, which equals 10-45 L/m2/d. If 40 L/d of greywater is applied to the system and
100
the highest infiltration rate in the ground is used, e.g. 40 mm/d, then the dugout ditch in the filter garden would have to be dimensioned to be approximately 0.5 m by 2 m, assuming that the barrel used as a filter has a diameter of 0.5 m. If instead the ground had a lower infiltration rate, e.g. 10mm/d, the dugout ditch would need to be 0.5 m by 8 m. Slow infiltration to the ground requires a larger system, which was a similar problem with the mulch beds, since this space is not always available. Calculating with a greywater quantity of 40 L/d means that the garden will theoretically not need extra freshwater during the dry season, but it does mean the system will often leak. If the system has to be dimensioned for more the 40 L/d greywater, then it will have to be larger, which might make the system not plausible for use in some households. Depending on the given conditions in each household, a larger system will be required if this future greywater reuse system to function properly. If adjustments to the system‘s size cannot be made, then restrictions as to the amount of water that can be applied to the system per day must be established. On days when extra greywater is produced and added to the system, such as on laundry days, leakage and flooding can occur from the plant soil in the garden. But since the greywater is filtered before this occurs, there are fewer risks when compared with throwing out untreated greywater on the street. The resting time that is required for the system if overloading occurs also depends on the factors mentioned above. A more efficient water abstraction potential results in a shorter required resting time to retain aerobic conditions and reduce the risk for clogging. The amount of required resting time is therefore shorter during the dry season and longer during the rainy season.
8.3.2 Leach pits As observed with the implemented vertical gardens and mulch beds, it is difficult to find a system that performs optimally during both dry and rainy season. In the case of households that have a leach pit or other system attached to the shower, which is 90% of the households in Sector 27, one solution to help overloaded vertical gardens and mulch beds during the rainy season could be to investigate the possibility of adding an application inlet to leach pit into which extra greywater could be applied. The inlet should preferably be connected with the distribution ditch, so that the water entering the leach pit was pretreated. This could, depending on the dimensions of the system, function as an emergency disposal system in case increased greywater volumes are produced or if the capacity of the vertical garden and/or mulch bed is reduced due to rain. It could also be a better way to disposing of greywater originating from infant care, which may have a higher concentration of pathogens. In this way, disposal of water on the street would be avoided, and health risks would be reduced. Considering the conditions in Ouagadougou and the experienced problems with the current systems, the question must be raised if the leach pits recommended by ONEA might be the best option until a functioning and properly dimensioned greywater reuse and disposal system can be found. Leach pits require the least amount of user participation and the least amount of maintenance. While they are expensive to invest in, the cost for them during their lifespan could be considerably less than for vertical gardens and mulch beds. While they do not reuse the greywater for food production, which is one of CREPA‘s goals as they try to work to find a EcoSan system, they effectively reduce the problem of removing greywater off the streets in a safe way. Nevertheless, this option has its drawbacks. If there is not enough vertical distance

101
between the bottom of the leach pit and the groundwater, the soil may not effectively treat the greywater before it reaches the groundwater. Since the depth of groundwater varies greatly in Ouagadougou, from 5 m to 30 m (Simmers, 1987), there is a risk in areas with low groundwater depths that groundwater contamination can occur. This is not an acute problem today, as the majority of the drinking water in Ouagadougou is currently taken from surface water sources. But, when considering the long-term water situation in the area, risking groundwater contamination is not wise, as groundwater may be a much needed source of drinking water in the future. Also, in dry areas such as Ouagadougou, that experience water scarcity and food insecurity, it will become increasingly important in the future to find a system that can reuse greywater for irrigation. It is therefore not recommended that leach pits be seen as the final solution to greywater disposal. Instead they are a way to reduce the immediate problem with greywater disposal on the streets, until a better system is found.
102
9 CONCLUSIONS Designing a system for irrigation reuse that has high productivity all year round and at the same is able to receive all the produced greywater without overloading is a challenge that still remains to be met. To find a space-efficient and cheap system that also requires as little maintenance as possible is demanding. Many systems need active involvement from the users in order to function optimally and not increase risks to human health. This in turn requires that the user has a relevant and thorough education in system use. The implemented systems did not fulfill CREPA‘s goal of finding a system that was low-cost, productive, easily maintainable and hygienically safe. The buildup of a water column in the vertical gardens and standing water in the mulch bed, due to overloading and poor dimensioning, caused anaerobic conditions. This resulted in a large sludge production due to the anaerobic digestion of BOD, and was thought to be the reason for clogging in the systems. The fallible design of the vertical gardens led to a poor reuse of applied water and an increased risk for pathogen transmissions. The mulch bed was too small and poorly maintained. The continued use of these systems is therefore not advised. Changes to the implemented were suggested that improve some but not all of the observed problems. Suggested improvements for a vertical garden included a separated application inlet for greywater and a different design to reduce the risk of anaerobic conditions and clogging. This design would hopefully increase the water reuse potential of the system and reduce the risk of pathogen transmission. An improved, larger mulch bed was also suggested. An alternate two-in-one reuse system, combining filtration and horizontal gardening, is believed to fulfill CREPA‘s criteria for a greywater reuse and disposal system. A design proposal along with maintenance and education suggestions was developed to facilitate future testing of the system in CREPA‘s Project Greywater. While the dream of an EcoSan system is a worthwhile goal, systems that are improperly managed by the user or poorly designed should not be encouraged or implemented. The question must be raised if the leach pits recommended by ONEA are the best option until a functioning greywater reuse system can be found. While their use is not recommended as a final solution in the quest for a greywater disposal system, the leach pit effectively reduces the immediate problem of removing greywater from the streets. In areas such as Ouagadougou, where problems with water scarcity and food insecurity are common, it is increasingly important to find new water management alternatives. It is therefore recommended that new systems for greywater disposal that reuse the water for irrigation continue to be tested and the suggested two-in-one reuse system is one system that deserves to be tested.
103
10 REFERENCES Abu-Ashour, J. & Jamrah, A. (2008). Survival of bacteria in soil subsequent to greywater application. International Journal of Environmental Studies, 65:1, 51-65. [online]. Available from: http://pdfserve.informaworld.com.ezproxy.its.uu.se/16768_751319972_790725634.pdf. [05 April 2010]. AGWT – American Ground Water Trust. Septic systems for Waste Water disposal (2008). [online]. Available from: http://www.agwt.org/info/septicsystems.htm#HOW DO SEPTIC TANKS WORK? [31 March 2010]. Allen, R. G., Pereria, L. S., Raes, D., Smith, M. (1998). Crop evapotranspiration - Guidelines for computing crop water requirements - FAO Irrigation and drainage paper 56. ISBN 92-5-104219-5. [online]. Available from: http://www.fao.org/docrep/X0490E/X0490E00.htm. [15 April 2010]. Ayers, R.S. & Westcott, D.W. (1985). Water Quality for Irrigation. FAO Irrigation and Drainage Paper 29, Rev. 1. [online]. Available from: http://www.fao.org/DOCREP/003/T0234E/T0234E00.htm. [14 April 2010]. Barker-Reid, F., Harper, G.A., Hamilton, A.J. (2009). Affluent effluent: growing vegetables with wastewater in Melbourne, Australia – a wealthy, but bone-dry city. Irrigation and Drainage Systems. [online]. DOI 10.1007/s10795-009-9082-x. [26 February 2010]. Billeaud, L. and Zajicekz, J. (1989). Influence of Mulches on Weed Control, Soil pH, Soil Nitrogen Content, and Growth of Ligustrum japonicum. Journal of Environmental Horticulture, 7:4, 155-157. [online]. Available from: http://www.hriresearch.org/docs/ publications/JEH/JEH_1989/JEH_1989_7_4/JEH%207-4-155-157.pdf. [17 April 2010]. Blumenthal, U.J., Peasey, A., Ruiz-Palacios, G., Mara, D.D. (2000). Guidelines for Wastewater Reuse in Agriculture and Aquaculture: Recommended Revisions Based on New Reseach Evidence. WELL Study, Task No. 68 Part 1. [online]. Available from: http://www.lboro.ac.uk/well/resources/well-studies/full-reports-pdf/task0068i.pdf. [7 October 2009]. Borg, H. (1989). The Relationship Between the Concentration of Total Soluble Salts and Osmotic Potential in Soil, Ground and Surface Waters for Several Regions of Western Australia. Government of Western Australia: Resource Management Technical Report No.83. [online]. Available from: http://www.agric.wa.gov.au/objtwr/imported_assets/content/ lwe/salin/smeas/tr083.pdf. [16 April 2010]. Brady, N. & Weil, R. (1996). The Nature and Properties of Soil. 11th ed. New Jersey: Prentice-Hall International, Inc.
104
Casanova, L.M., Little, V., Frye, R.J., Gerba, C.P. (2001a). A Survey of the Microbial Quality of Recycled Household Graywater. Journal of the American Water Resources Association, 37:5, 1313-1319. Casanova, L.M., Gerba, C. P., Karpiscak, M. (2001b). Chemical and microbial characterization of household graywater. Journal of Environmental Science and Health. Part A, Toxic/Hazardous Substances & Environmental Engineering, 36:4, 395–401. doi:10.1081/ESE-100103471. Center for the Study of the Built Environment (2003). Greywater Reuse in Other Countries and its Applicability to Jordan. [online]. Available from: http://www.csbe.org/graywater/report/report_final.pdf. [7 October 2009]. Clartee, R. (1991). Water: The International Crisis. London: Earthscan Publications Ltd. CIA - Central Intelligence Agency (2010). The World FactBook: Burkina Faso. [online]. Available from: https://www.cia.gov/library/publications/the-world-factbook/geos/uv.html. [14 April 2010]. CREPA - Centre Régionale l'Eau Potable et l'Assainissement à faible coût. Présentation. [online] (2009a). Available from: http://www.reseaucrepa.org/page/312 [20 October 2009]. CREPA - Centre Régional pour l'Eau Potable et l'Assainissement à faible coût. Historique. [online] (2009b). Available from: http://www.reseaucrepa.org/page/3103 [20 October 2009]. CREPA – Centre Régional pour l'Eau Potable et l'Assainissement à faible coût (N.d.). Regional Ecological Sanitation Program 2006-2010. Factsheet. Crisman, T., Chapman, L., Chapman, C., Kafman, L. (2003). Conservation, Ecology and Management of African Freshwater. Gainesville, Fl: The University Press of Florida. Criswell, M., Roesner, L., Qian, Y., Stromberger, M., Klein, S., Marjoram, C. (2005). Experimental Design of a Long-term Study on Landscape Irrigation Using Household Graywater. [online]. Available from: http://www.engr.colostate.edu/HHSLab/papers/ Criswell%20and%20Roesner%20Graywater.pdf. [26 February 2019]. Cronk, J. & Fennessy, M. (2001). Wetland plants: Biology and Ecology. Florida: CRC Press LLC. Crosby, C. (2005). Food from used water: Making the previously impossible happen. [online]. The Water Wheel, Jan/Feb. Available from: http://www.dwaf.gov.za/Events/WaterWeek /2005/Documents/WaterWheelJan05d.pdf [28 March 2010].
105
Direction de la Météorologie du Burkina Faso (N.d.). Pluviometrie annuelle moyenne. [online]. Available from: http://www.meteo-burkina.net/CARTES/MOY_7100/ MOY_7100.GIF. [17 March 2010]. Drangert, JO. (2004). Norms and Attitude Towards Ecoson and Other Sanitation Systems. EcoSanRes Publication Series, Report 2004-5. Stockholm Environmental Institute; Stockholm, Sweden. [online]. Available from: http://esa.un.org/iys/docs/san_lib_docs/ESR5web[1].pdf. [27 April 2009]. Earthtrends (2003a). Population, Health and Human Well-Being-Burkina Faso. [online]. Available from: http://earthtrends.wri.org. [29 March 2010]. Earthtrends (2003b). Water Resources and Freshwater Ecosystems-Burkina Faso. [online]. Available from: http://earthtrends.wri.org. [4 Nov. 2009]. Eliasson, J., 2002. Hydraulic Loading Rates. Rule Development Committee Issue Research Report – Draft. Wastewater Management Program. Washington State Department of Health.
Engstrand, U. & Olsson, U. (2003). Variansanalys och försöksplanering. Sweden: Studentlitteratur. Esrey, S., Gough, J., Rapaport, D., Sawyer R., Sompson-Hébert, M., Vargas, J., Winblad, U. (1998). Ecological Sanitation. SIDA. [online]. Available from: http://www.ecosanres.org/pdf_files/Ecological_Sanitation.pdf. [15 April 2010]. FAO - Food and Agriculture Organization (1996). Rome declaration on food summit 1996. [online]. Available from: http://www.fao.org/docrep/003/w3613e/w3613e00.HTM. [15 April 2010]. FAO - Food and Agriculture Organization (1999). Food insecurity: When people must live with hunger and fear starvation.. The state of food insecurity in the world 1999. [online]. Available from: ftp://ftp.fao.org/docrep/fao/007/x3114e/x3114e00.pdf. [15 April 2010]. FAO - Food and Health Organization (2007). Coping with Water Scarcity. [online]. Available from: http://www.fao.org/newsroom/en/focus/2007/1000521/index.html. [14 April 2010]. Faruqui, N. & Al-Jayyousi, O. (2002). Greywater Reuse in Urban Agriculture for Poverty Alleviation: A Case Study in Jordan. Water International, 27:3, 387-394. [online]. Available from: http://pdfserve.informaworld.com.ezproxy.its.uu.se/587726_751319972_ 908071450.pdf. [5 April 2010]. Finley, S., Barrington, S., Lyew, D. (2009). Reuse of Domestic Greywater for Irrigation of Food Crops. Water Air Soil Pollution, 199, 235-245. DOI 10.1007/s11270-008-9874-x.

106
Friedler, E. (2008). The water saving potential and the socio-economic feasibility of greywater reuse within the urban sector - Israel as a case study. International Journal of Environmental Studies, 65: 1, 57 - 69. Gaisma (2010). Sunrise, sunset, dawn and dusk times around the world. [online]. Available from: http://www.gaisma.com/en/location/ouagadougou.html [7 April 2010]. Garzón-Zúñiga, MA., Lessard, P., Buelna, G. (2003). Determination of the Hydraulic Residence Time in a Trickling Biofilter Filled with Organic Matter. Environmental Technology, 24, 605-614. Gerba, C. P., & Smith, J. E. (2005). Sources of pathogenic microorganisms and their fate during land application of wastes. Journal of Environmental Quality, 34, 42–48. Gouin, F.R. (1994). Mulches for home gardening. Maryland Cooperative Extension. Fact sheet. University of Maryland. [online]. Available from: http://extension.umd.edu/publications/PDFs/FS553.pdf. [8 April 2010]. Grip, H. & Rodhe, A. (2003). Vattnets väg från regn till bäck. Sweden: Hallgren & Fallgren Studieförlag AB. ISBN 91 7382 762 2. Hanson, R. (1991). Evapotranspiration and droughts. US Geological Survey. [online]. Available from: http://geochange.er.usgs.gov/sw/changes/natural/et/ [14 April 2010] Jefferson, B., Palmer, A., Jeffrey, P., Stuetz, R., Judd, S. (2004). Grey water characterisation and its impact on the selection and operation of technologies for urban reuse. Water Science and Technology, 50:2, 157–164. Joint UNEP/OCHA Environment Unit - United Nations Environment Programme/ Offtice for the Coordination of Humanitarian Affairs (2009). Floods in Burkina Faso – September 2009. Assessments of the Environmental Impacts of the Floods in Ouagadougou and peri-urban Areas. Mission Report 2009. Kando, E. Y. A. (2008). Projet Eaux grises au secteur 27 de OUAGADOUGOU: Etat des lieux et tester des solutions productives. Ouagadougou: International Institute for Water and Environmental Engineering. Keswick, B.H. & Gerba, C.P. (1980). Viruses in groundwater. Environ. Sci. Technol. 14, 1290–1297. [online]. Available from: http://pubs.acs.org.ezproxy.its.uu.se/doi/pdf/10.1021/es60171a602?cookieSet=1. [25 March 2010].

107
Kientega, M., Wethe, J., Kone, D., Kuela, N. (2001). Projet de recherché/consultation puor le développement durable de l‘agriculture urbaine en Afrique de l‘Ouest. Thème: Profil du recyclage des eaux uses dans l‘agriculture urbaine á Ouagadougou. Kirby, M., de Condappa, D., Mainuddin, M., Eastham, J., Thomas, M. (2010). Water-use accounts in CPWF basin. Simple water-use accounts of the Volta Basin. [online]. Available from: http://www.waterandfood.org/fileadmin/CPWF_Documents/Documents/ CPWF_Publications/CP_WP_4_Volta_Basin.pdf. [7 April 2010]. Kulabako, R., Kinobe, J., Mujunga, J., Olwenyi, S., Sleytr, K. (2009). Greywater use in peri-urban households in Kitgum, Uganda. Ecosan Club: Sustainable sanitation practice, issue 1/2009. [online]. Available from: http://www.ecosan.at/ssp. [30 March 2010]. Lindgren, DT., Steinegger, DH., Baxendale, FP., Watkins, JE. (1999). Organic Gardening in the Backyards G81-548-A. University of Nebraska, Institute of Agriculture and Natural Resources. [online]. Available from: http://digitalcommons.unl.edu/cgi/viewcontent.cgi? article=2005&context=extensionhist. [7 October 2009]. Ludwig, A. (2003). Create an Oasis with Greywater. 4. ed. Santa Maria, California: Poor Richard's Press. 0-9643433-0-4. Ludwig, A. (2004). Branched Drain Greywater Systems. Santa Maria, California: Poor Richard's Press. 0-9643433-5-5. Madungwe, E. & Sakuringwa, S. (2007). Greywater reuse: A strategy for water demand management in Harare? Physics and Chemistry of the Earth, 32:15–18, 1231–1236. Ministry of Economy and Development (2004). Burkina Faso: Poverty Reduction Strategy Paper. [online]. Available from: http://siteresources.worldbank.org/INTPRS1/Resources /BurkinaFaso_PRSP_July2004.pdf. [15 April 2010]. Morel, A. & Diener, S. (2006). Greywater Management in Low and Middle-Income Countries, Review of different treatment systems for households or neighbourhoods. Swiss Federal Institute of Aquatic Science and Technology (Eawag). [online]. Available from: http://www.eawag.ch/organisation/abteilungen/sandec/publikationen /publications_ewm/downloads_ewm/Morel_Diener_Greywater_2006_lowres.pdf. [20 October 2009]. Morris, B.L., Lawrence, A.R.L., Chilton, P.J.C., Adams, B., Calow, R.C., Klinck, B.A. (2003). Groundwater and its Susceptibility to Degradation: A Global Assessment of the Problems and Options for Management. Early Warning and Assessment Report Series, RS. 03-3. United Nations Environment Porgramme, Nairobi, Kenya. [online]. Available from: http://www.unep.org/DEWA/water/groundwater/pdfs/Groundwater_Prelims_SCREEN.pdf. [7 October 2009].
108
Mungai, G.G. (2008). Impacts of long-term greywater disposal on soil properties and reuse in urban agriculture in an informal settlement – a case study of Waruku, Nairobi. UNESCO-IHE Institute for Water Education, Eawag. Murphy, K. O'H. (2006). A Scoping Study to Evaluate the Fitness-for-use of Greywater in Urban and Peri-Urban Agriculture. Pretoria: Water Research Commission Report No. 1479/1/06. 1-77005-471-5. NSW HEALTH - New South Wales Department of Health (2000). Greywater Reuse in Sewered Single Domestic Premises, Sydney. [online]. Available from: http://www.health.nsw.gov.au/resources/publichealth/environment/water/pdf/greywater_policy.pdf. [7 October 2009]. O‘Donoghue, R. & Fox, H. (eds.) (2009). Creative Garden Design. Handprint – Action towards sustainability. [online]. Available from: http://www.tessafrica.net. [20 March 2010]. Olade, M. (1987). Heavy Metal Pollution and the Need for Monitoring: Illustrated for Developing Countries in West Africa. John Wiley & Sons Ltd. [online]. Available from: http://dge.stanford.edu/SCOPE/SCOPE_31/SCOPE_31_2.15_Chapter20_335-341.pdf. [18 April 2010]. ONEA - l‘Office National de l‘Eau et l‘Assainissement. Les Tarifs (2010a). [online]. Available from: http://www.oneabf.com/tarifs-de-leau--la-politique-tarifaire-de-lonea.html [8 April 2010]. ONEA - L‘Office national de l‘eau et l‘assainissement. Tout sur l‘eau (2010b). [online]. Available from: http://www.oneabf.com/produits-et-services/eau/tout-sur-leau.html. [18 February 2010]. Ottoson, J. (2003). Hygiene Aspects of Greywater and Greywater Reuse. Stockholm: Royal Institute of Technology & Swedish Institute for Infectious Disease Control. Ottoson, J. & Stenström, T.A. (2003). Faecal Contamination of Greywater and Associated Microbial Risks. Water Research, 37:3, 645-655. doi:10.1016/S0043-1354(02)00352-4. Pettygrove, G.S. & Asano, T. (1985). Irrigation with Reclaimed Municipal Wastewater- a guidance manual. Chelsea, USA: Lewis Publishers, Inc. Pinto, U., Maheshwari, B. L., Grewal, H.S. (2009). Effects of greywater irrigation on plant growth, water use and soil properties. Resources, Conservation and Recycling, 54:7, 429-435. [online]. Available from: http://www.sciencedirect.com.ezproxy.its.uu.se/science?_ob= ArticleURL&_udi=B6VDX-4XHJX79-2&_user=651519&_coverDate=05/31/2010&_rdo c=1&_fmt=&_sort=d&_docanchor=&view=c&_acct=C000035158&_version=1&_urlVersion=0&_userid=651519&md5=108edf8323dd13e9432a2514e75502b5. [5 April 2010].
109
Prüss-Üstün, A., Bos, R., Gore, F., Bartram, J. (2008). Safe water better health: costs, benefits and sustainability of interventions to protect and promote health. World Health Organization, Geneva. ISBN 978 92 4 159643 5. [online]. Available from: http://whqlibdoc.who.int/publications/2008/9789241596435_eng.pdf [13 April 2010]. Raude, Mutua, Chemelil, Kraft, Sleytr. 2009. Household greywater treatment for peri-urban areas of Nakuru Municipality, Kenya. Ecosan Club: Sustainable sanitation practice, issue 1/2009. [online]. Available from: http://www.ecosan.at/ssp [30 March 2010]. Ridderstolpe, P. (2004). Introduction to Greywater Management. EcoSanRes Publication Series, Report 2004-4. Stockholm Environmental Institute; Stockholm, Sweden. [online]. Available from: http://www.ecosanres.org/pdf_files/ESR_Publications_2004/ESR4web.pdf. [17 February 2010]. Roesner, L., Qian, Y., Criswell, M., Stromberger, M., Klein, S. (2006). Long-term effects of landscape irrigation using household graywater—literature review and synthesis. Resource Document. Water Environment Research Foundation. [online]. Available from: http://www.cleaning101.com/files/SDA_WERF_Graywater_2006.pdf. [26 February 2010]. Rowe, D. & Abdel-Magid, I.M., (1995). Handbook of Wastewater Reclamation and Reuse. Boca Raton, USA: Lewis Publishers, Inc. Sadegh-Zadeh, F., Ser-Bardan, B.J., Samsuri, A.W., Mohannadi, A., Chorom, M., Yazdani, G-A. (2009). Saline Soil Reclamation by Means of Layered Mulch. Arid Land Research and Management, 23:2, 127-136. DOI: 10.1080/15324980902817097. Sawadogo, H. (2008). Approche GIRE et expansion de l‘agriculture urbaine a Ouagadougou. Ouagadougou: International institute for Water and Environmental Engineering (2iE). SEI - Stockholm Environmental Institute (2006). Case 1: Strategic plan for management of wastewater in Ouagadougou-Burkina Faso. NETSSAF Coordination Action. SEI - Stockholm Environmental Institute (2009). EcoSanRes. [online]. Available from: http://www.ecosanres.org/index.htm. [12 April 2010]. SIDA - Swedish International Development Cooperation Agency (2009a). Lär känna Burkina Faso. [online]. Available from: http://www.sida.se/Svenska/Lander--regioner/Afrika/Burkina-Faso/Lar-kanna-burkina-faso/. [17 March 2010]. SIDA – Swedish International Development Cooperation Agency (2009b). Burkina Faso, landfact. [online]. Available from: http://www.sida.se/Svenska/Lander--regioner/Afrika/Burkina-Faso/Landfakta/. [18 Febuary 2010].
110
Simmers, I. (1987). Estimation of groundwater recharge. NATO ASI Series. Series C: Mathematical and Physical Science Vol. 222. ISBN 90-277-2632-9. [online]. Available from: http://books.google.com/books?id=W0uvL96OaMoC&pg=PA33&lpg=PA33&dq=groundwater+table++Ouagadougou&source=bl&ots=H8UT8Pqws0&sig=p2IAmHlzDasItYzd4G0jJief-ZE&hl=sv&ei=Lk7NS_fBMdP5OfPYvfMP&sa=X&oi=book_result&ct=result&resnum=4&ved=0CBwQ6AEwAw#. [20 April 2010]. Simmons, R.W., Waqa, A., Noble, A.D., Blummel, M., Evans, A., Weckenbrock, P. (2009). Effect of long-term un-treated domestic wastewater re-use on soil quality, wheat grain and straw yields and attributes of fodder quality. Irrigation and Drainage System. DOI 10.1007/s10795-009-9085-7. SISA - Système d‘Information sur la Sécurité Allimentaire (2007). Séminaire national sur les statistiques de sécurité alimentaire et les perspectives multisectorielles. [online]. Available from: http://www.sisa.bf/sisa/spip.php?article204. [15 April 2010]. SMHI - Sveriges Meteorologiska och Hydrologiska Institut (2009). Kunskapsbanken: Hur mats nederbörd. [online]. Available from: http://www.smhi.se/kunskapsbanken/ meteorologi/hur-mats-nederbord-1.637 [14 April 2010]. SP/CONAGESE - Secrétariat Permanent du Conseil National pour la Gestion de l'Environnement (2002). State of environment report for Burkina Faso: Summary. United Nations, Burkina Faso. The International Bank for Reconstruction and Development /The World Bank (2007). Making the Most of Scarcity. Accountability for Better Water Management in the Middle East and North Africa. [online]. Available from: http://www-wds.worldbank.org/external/default/WDSContentServer/WDSP/IB/2007/10/10/000310607_20071010141136/Rendered/PDF/411130was390400Englishoptmzd.pdf. [13 April 2010]. Toze, S. (2006a). Reuse of effluent water—benefits and risks. Agricultural Water Management, 80, 147–159. doi:10.1016/j.agwat.2005.07.010. Toze, S. (2006b). Water Reuse and Health Risks – Real vs. Perceived. Desalination, 187: 1-3, 41-51. doi:10.1016/j.desal.2005.04.066. Travis, M. J., Weisbrod, N., Gross, A. (2008). Accumulation of oil and grease in soils irrigated with greywater and their potential role in soil water repellency. Science of the Total Environment, 384:1, 68-74. [online]. Available from: http://www.sciencedirect.com. ezproxy.its.uu.se/science?_ob=ArticleURL&_udi=B6V78-4RV7GPP-1&_user=65151 9&_coverDate=05/01/2008&_rdoc=1&_fmt=high&_orig=search&_sort=d&_docanchor=&view=c&_acct=C000035158&_version=1&_urlVersion=0&_userid=651519&md5=89adb861592b77e4bc57327ca8750775. [5 April 2010].

111
Turf Irrigation Management Series, No 1. Basics of Evaporation and Evapotranspiration. The University of Arizona Cooperative Extension. [online]. Available from: http://ag.arizona.edu/pubs/water/az1194.pdf [14 April 2010]. Tyler, EJ (N.d.). Hydraulic Wastewater Loading Rate to Soils. University of Wisconsin-Madison, #4.43. [online]. Available from: http://www.soils.wisc.edu/sswmp/SSWMP_4.43.pdf. [2009-10-20]. UN - Water (2006). Water for Life 2005-2015 – Water Scarcity. [online]. Available from: http://www.un.org/waterforlifedecade/scarcity.html. [14 April 2010]. UNDP - United Nations Development Programme (2009). Statistics of the Human Development Report. [online]. Available from: http://hdr.undp.org/en/statistics/. [14 April 2010]. UNEP - United Nations Environment Programme (2002a). International Source Book On Environmentally Sound Technologies for Wastewater and Stormwater Management. [online]. Available from: http://www.unep.or.jp/ietc/publications/techpublications/techpub-15/2-4/4-1-4.asp [31 March2010]. UNEP - United Nations Environment Programme (2002b). Urban Surficial and Groundwater Pollution in Africa. [online]. Available from: http://www.unep.org/dewa/water/groundwater /africa/english/reports/CountrySummaries/BurkinaFaso/Eng-Burkina%20faso%20 summary.pdf. [18 February 2010]. UNICEF - The United Nations Children's Fund (2005). Burkina Faso, water, environment and sanitation. [online]. Available from: http://www.unicef.org/bfa/english/wes.html [8 April 2010]. UN - United Nations (2008). Millenium Development Goals. [online]. Available from: http://www.un.org/millenniumgoals/ [13 April 2010]. USAID - United States Agency International Development (2008). Burkina Faso: Water and Sanitation Profile. [online]. Available from: http://pdf.usaid.gov/pdf_docs/PNADO927.pdf. [14 April 2010]. USEPA - United States Environmental Protection Agency (2002). Onsite Wastewater Treatment Systems Manual. Office of Water and Office of Research and Development. EPA/625/R-00/008. USEPA - United States Environmental Protection Agency (2004). Guidelines for Water Reuse. U.S. Agency for International Development. [online]. Available from: http://epa.gov/nrmrl/pubs/625r04108/625r04108.pdf. [15 October 2009].
112
USEPA - United States Environmental Protection Agency (2006). Onsite Wastewater Treatment Systems Technology Fact Sheet 13. Renovation/Restoration of Subsurface Wastewater Infiltration Systems (SWIS). EPA 625/R-00/008. Vezina, M. (2002). Ouagadougou Strategic Sanitation Plan: An Holistic Approach to a City‘s Problems. Water and Sanitation Program. [online]. Available from: http://www-wds.worldbank.org/external/default/WDSContentServer/WDSP/IB/2003/08/28/000012009_20030828113145/Rendered/PDF/266280PAPER0English0Blue0Gold0no1010.pdf. [28 March 2010].
Watling, K. (2007). Measuring Salinity. Queensland Government Natural Resources and Water. WHO - World Health Organization (2006). Guidelines for the Safe Use of Wastewater, Excreta and Greywater. Geneva, Switzerland: World Health Organisation. WHO - World Health Organization (2009). Ten Facts About Water Scarcity. [online]. Available from: http://www.who.int/features/factfiles/water/en/index.html. [13 April 2010]. WHO - World Health Organization Africa (2008). Burkina Faso Publications. Annuaire statistique de Burkina Faso 2008. [online]. Available from: http://www.afro.who.int/en/burkina-faso/burkina-faso-publications.html. [17 March 2010]. Winblad, U. & Simpson-Hébert, M. (eds.) (2004). Ecological Sanitation – Revised and Enlarged Edition. Stockholm, Stockholm Environment Institute. World Bank (1996). Towards Environmentally Sustainable Development in Sub-Saharan Africa. Washington D.C.: World Bank International Bank of Reconstruction and Development. Yermiyahu, U., Ben-Gal, A., Keren, R., Reid, J. (2008). Combined effect of salinity and excess boron on plant growth and yield. Plant Soil, 304, 73-87. [online] DOI 10.1007/s11104-007-9522-z. [26 February 2010]. Yofe, J-M. (2008). Rapport d‘état det lieux du secteur 27 (Ouagadougou), EAUX GRISES. CREPA. Report. Yofe, J-M. (2009a). PROJET Eaux grises au secteur 27, ECHANTILLONAGE. CREPA. Report. Yofe, J-M. (2009b). EAUX GRISES, Caractérisation. CREPA. Report.
113
Youkhana, E., Korth, O., Lamizana, B., Sebaly, C., Van der Schaaf, C. (2006). Water Sector of Burkina Faso. Glowa Volta. [online]. Available from: http://www.glowa-volta.de/fileadmin/template/Glowa/Downloads/WATER_SECTOR_OF_BURKINA_FASO_final.pdf. [28 March 2010]. Personal Communication Dagerskog, Linus. Research assistant, CREPA, Burkina Faso. Interview continuously September 2009 – April 2010. Dagerskog, Linus. Research assistant, CREPA, Burkina Faso. Electronic mail continuously September 2009 – April 2010. Doh, Miss. Household with VG 4, Burkina Faso. Interview 2 December 2009. Jönsson, Håkan. Professor, Department of Energy and Technology at the Swedish University of Agricultural sciences. 19 April 2010. Kanazoé, Aminata. Household with VG 2, Burkina Faso. Interview 2 December 2009. Kaoré, Georgette. Household with MB 1 & 2, Burkina Faso. Interview 3 December 2009. Koanda, Halidou. Head of research, CREPA, Burkina Faso. Interview 5 February 2010. Nikiema, Paschal. Household with VG 1, Burkina Faso. Interview 1 October 2009. Nikiema, Mrs. Household with VG 1, Burkina Faso. Interview 12 November 2009. Nikiema, Mrs. Household with VG 3, Burkina Faso. Interview 1 October 2009 and 12 November 2009. Sawadogo, Moussa. Household with VG 5, Burkina Faso. Interview 3 December 2009. Tompodi, Zachari. Maintenance man/translator, CREPA, Burkina Faso. Interview continuously October 2009 – December 2010. Yofe, Jean Marc. Research assistant, CREPA, Burkina Faso. Interview continuously September 2009 – April 2010. Yofe, J-M. Research assistant ,CREPA, Burkina Faso. Electronic mail continuously February – March 2010.
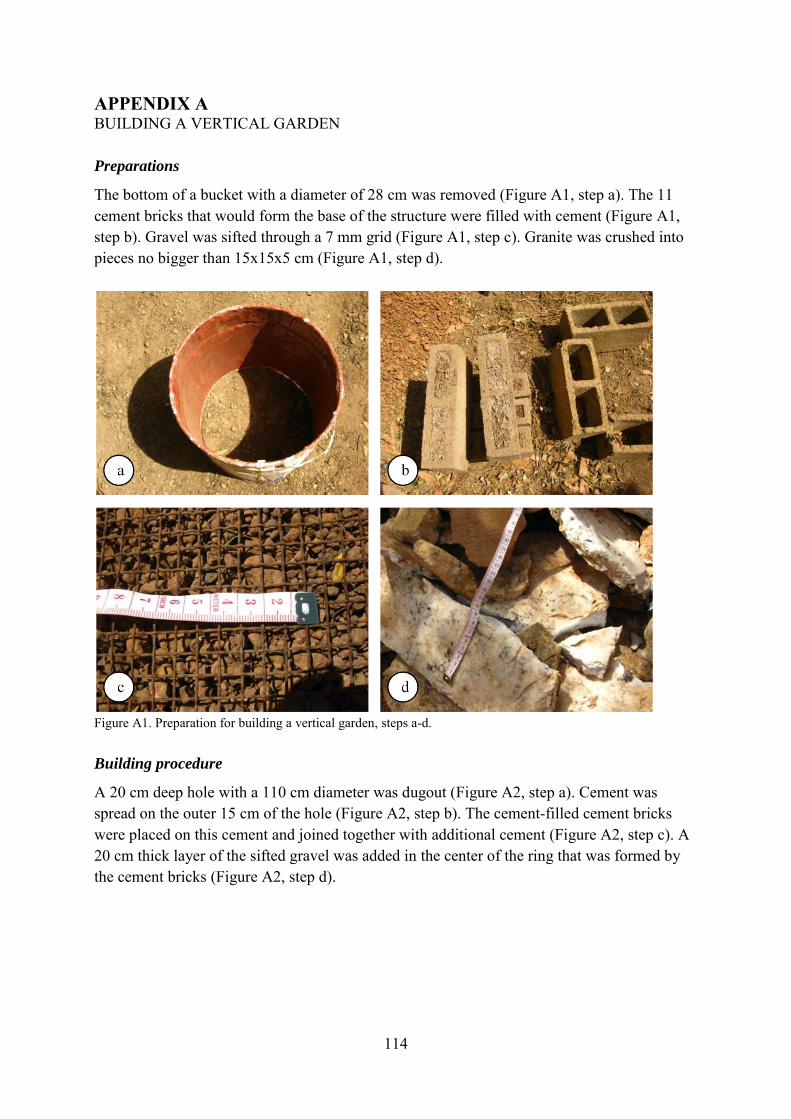
114
APPENDIX A BUILDING A VERTICAL GARDEN
Preparations
The bottom of a bucket with a diameter of 28 cm was removed (Figure A1, step a). The 11 cement bricks that would form the base of the structure were filled with cement (Figure A1, step b). Gravel was sifted through a 7 mm grid (Figure A1, step c). Granite was crushed into pieces no bigger than 15x15x5 cm (Figure A1, step d).
Figure A1. Preparation for building a vertical garden, steps a-d.
Building procedure
A 20 cm deep hole with a 110 cm diameter was dugout (Figure A2, step a). Cement was spread on the outer 15 cm of the hole (Figure A2, step b). The cement-filled cement bricks were placed on this cement and joined together with additional cement (Figure A2, step c). A 20 cm thick layer of the sifted gravel was added in the center of the ring that was formed by the cement bricks (Figure A2, step d).
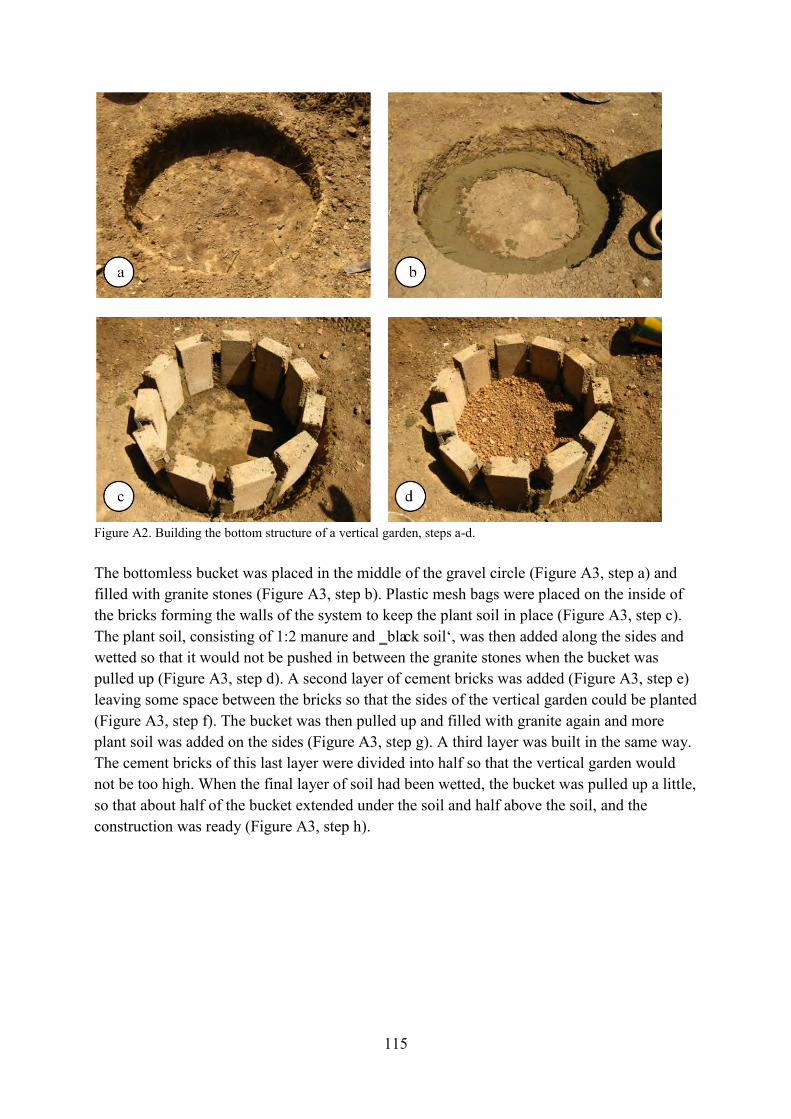
115
Figure A2. Building the bottom structure of a vertical garden, steps a-d. The bottomless bucket was placed in the middle of the gravel circle (Figure A3, step a) and filled with granite stones (Figure A3, step b). Plastic mesh bags were placed on the inside of the bricks forming the walls of the system to keep the plant soil in place (Figure A3, step c). The plant soil, consisting of 1:2 manure and ‗black soil‘, was then added along the sides and wetted so that it would not be pushed in between the granite stones when the bucket was pulled up (Figure A3, step d). A second layer of cement bricks was added (Figure A3, step e) leaving some space between the bricks so that the sides of the vertical garden could be planted (Figure A3, step f). The bucket was then pulled up and filled with granite again and more plant soil was added on the sides (Figure A3, step g). A third layer was built in the same way. The cement bricks of this last layer were divided into half so that the vertical garden would not be too high. When the final layer of soil had been wetted, the bucket was pulled up a little, so that about half of the bucket extended under the soil and half above the soil, and the construction was ready (Figure A3, step h).
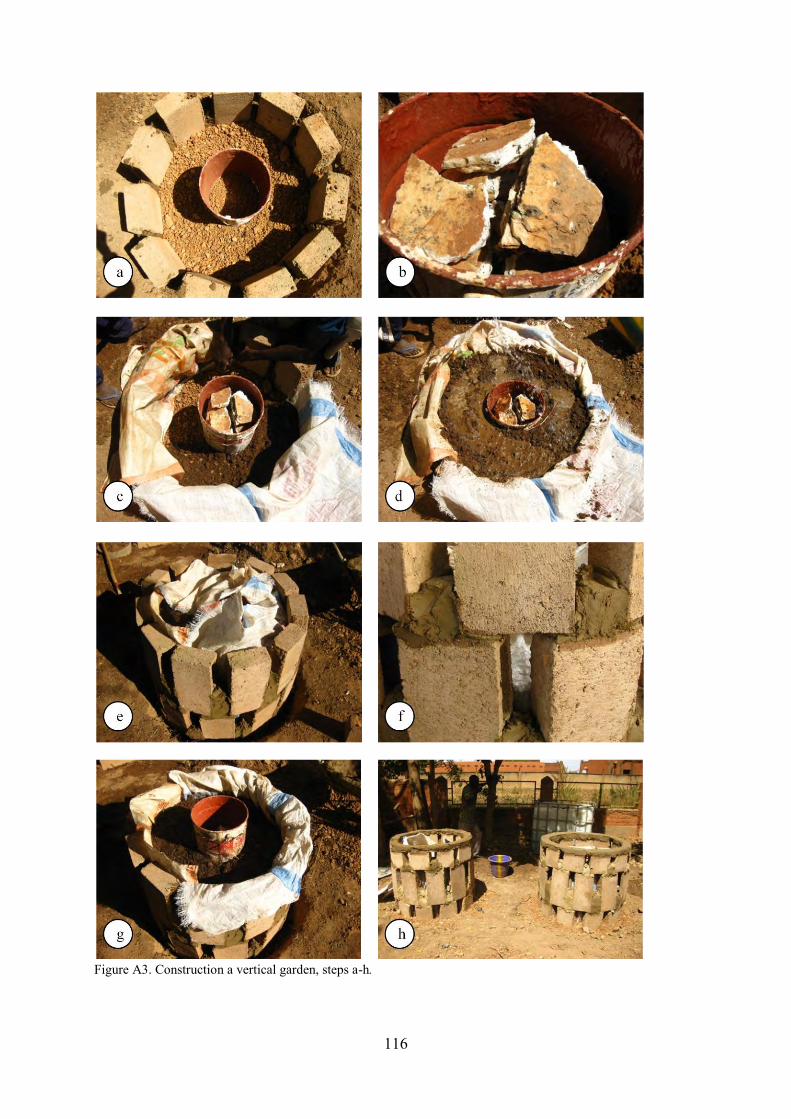
116
Figure A3. Construction a vertical garden, steps a-h.

117
APPENDIX B QUESTIONNAIRE
Greywater generation & system usage patterns
Greywater generation a. How much water do you buy per day? b. What quantity and frequency do you use for the following types of greywater: dish,
laundry, shower c. When during the day do you generate the most greywater? Application of water to the system d. How many buckets of greywater do you usually put on the system every day? e. How do you apply water to the system? f. Who applies the water to the system? Sex and age? g. Is it difficult to apply the water? Why? Greywater applied to the system h. What type of water do you apply on the system? i. Shower water? j. Bath water from baby? k. Cooking water (hot/cold)? l. Water from rinsing/cleaning vegetables? m. Dish water (with/without parts of organic kitchen waste)? n. Laundry water? o. Laundry water from washing diapers?
Freshwater applied to the system p. Do you apply any pure water on the system? If so, when and how often? q. Where do you apply it (on the center/on the top plant soil)? r. Why do you do that?
Detergents s. What type of detergent do you use? t. How much do you use? (Maybe ask how many packages per month?)
Plant quality & quantity
Plants from the system a. What type of plants do you grow? b. Do you eat the crops grown in the system? c. How do you prepare the vegetables from the system? d. Do you wash the vegetables before eating/cooking them? With what?

118
Plant health e. How does the food produced from the system taste to you? f. Do the leaves seem healthy/unhealthy? If unhealthy, how? g. Do they have any burnt or brown patches? h. Do the leaves fall off prematurely?
Comparison with the same type of plants grown elsewhere in the garden i. Do you grow any other plants somewhere else around the house? j. What type of plants? k. If the same type of plants, do you notice any difference between these plants and the ones
on the system?
Plant quantities and economical benefits l. Do you sell anything that you grow in the system? What? m. How much do you sell it for? n. How much food does the filter produce in one week? (Estimate with cupping your hand or
what measurement should we use?) o. What is this quantity worth in terms of money? p. Do you buy fewer vegetables in the market now?
System performance
Water loading capacity
a. Can the vertical garden receive all the greywater that is produced in one day or is some greywater still disposed of elsewhere (ex on the street)? Why?
b. Could you use the system during the rainy season? If no, why? c. Does the system ever leak water or flood? When?
General d. Do you notice any bad odors coming from the system? e. Are there any problems that you have experienced with the filter? f. What benefits have you experienced with the filter?
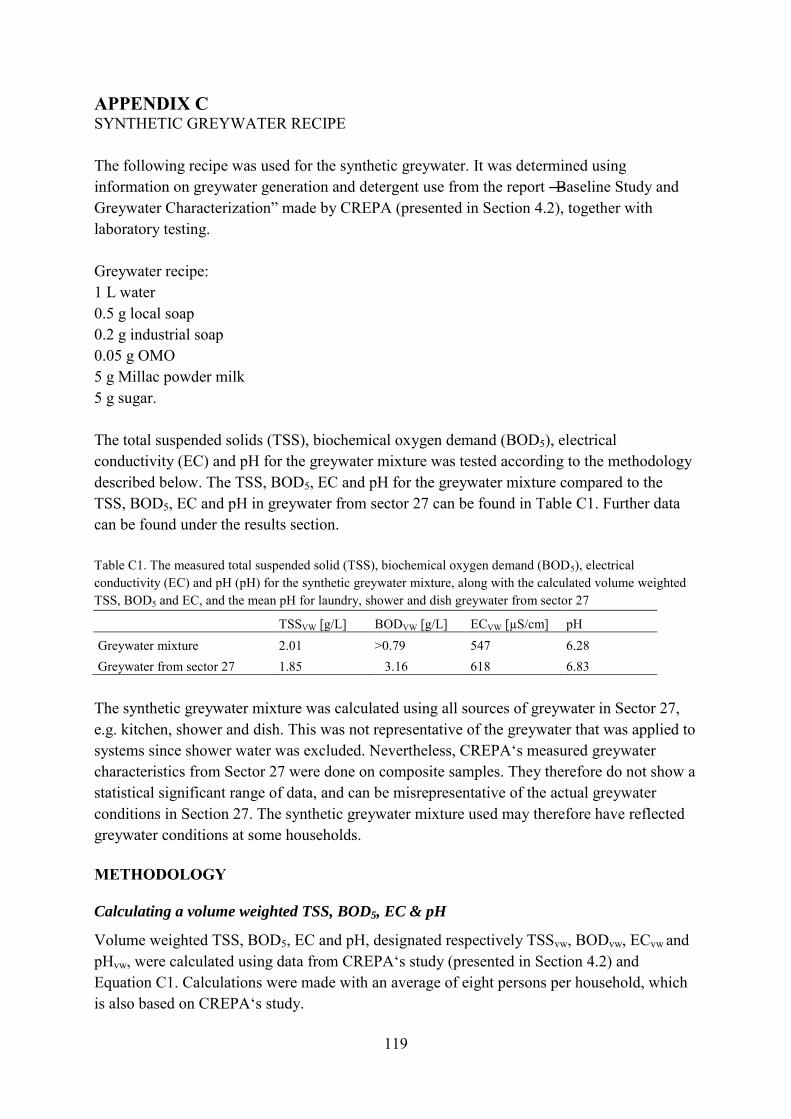
119
APPENDIX C SYNTHETIC GREYWATER RECIPE The following recipe was used for the synthetic greywater. It was determined using information on greywater generation and detergent use from the report ―Baseline Study and Greywater Characterization‖ made by CREPA (presented in Section 4.2), together with laboratory testing. Greywater recipe: 1 L water 0.5 g local soap 0.2 g industrial soap 0.05 g OMO 5 g Millac powder milk 5 g sugar. The total suspended solids (TSS), biochemical oxygen demand (BOD5), electrical conductivity (EC) and pH for the greywater mixture was tested according to the methodology described below. The TSS, BOD5, EC and pH for the greywater mixture compared to the TSS, BOD5, EC and pH in greywater from sector 27 can be found in Table C1. Further data can be found under the results section. Table C1. The measured total suspended solid (TSS), biochemical oxygen demand (BOD5), electrical conductivity (EC) and pH (pH) for the synthetic greywater mixture, along with the calculated volume weighted TSS, BOD5 and EC, and the mean pH for laundry, shower and dish greywater from sector 27
TSSVW [g/L] BODVW [g/L] ECVW [µS/cm] pH Greywater mixture 2.01 >0.79 547 6.28 Greywater from sector 27 1.85 3.16 618 6.83
The synthetic greywater mixture was calculated using all sources of greywater in Sector 27, e.g. kitchen, shower and dish. This was not representative of the greywater that was applied to systems since shower water was excluded. Nevertheless, CREPA‘s measured greywater characteristics from Sector 27 were done on composite samples. They therefore do not show a statistical significant range of data, and can be misrepresentative of the actual greywater conditions in Section 27. The synthetic greywater mixture used may therefore have reflected greywater conditions at some households. METHODOLOGY Calculating a volume weighted TSS, BOD5, EC & pH
Volume weighted TSS, BOD5, EC and pH, designated respectively TSSvw, BODvw, ECvw and pHvw, were calculated using data from CREPA‘s study (presented in Section 4.2) and Equation C1. Calculations were made with an average of eight persons per household, which is also based on CREPA‘s study.

120
is volume weighted parameter Z, where Z is TSS, BOD5 and EC for greywater in sector 27 [g/L] is parameter Z for water type X, where Z is TSS, BOD5 and EC and X is shower, laundry or dish greywater [g/L] is the volume for water type X, where X is shower, laundry, dish or total greywater [L/person/day]. Calculating a greywater mixture
Initially, the amounts of detergents in one liter water were calculated using the following Equations C2 and C3. All values used in the calculations are taken from CREPA‘s ―Baseline Study and Greywater Characterization‖ study. Using similar calculations as the ones described below, the chlorine content per one liter water was calculated to be less than 0.05 mL and was therefore neglected. The calculated amount of detergents is therefore divided between OMO and soap. The total average amount of greywater produced per household was calculated using Equation C2 and greywater quantities that can be found in Section 4.2. is the total amount of greywater produced [L/household/month] is the total amount of laundry greywater produced [L/household/day] is the total amount of shower greywater produced [L/household/day] is the total amount of dish greywater produced [L/household/day]. The mean amount of detergents used per 1 L water was then calculated with Equation C3 using information on quantities of detergents found in Section 4.2. No specifications in regards to the size of a soap were given in CREPA‘s reports. In this thesis, one soap was assumed to weigh 300 g, based on observations and information gathered in situ.
is the mass of detergent X per 1 L water, where X is OMO or soap [g/L] is the mass of detergent X [g/household/month] is the total amount of greywater produced [L/household/month]. On average, one liter of water contained 0.05 g OMO and 0.7 g soap. There are two types of soap commonly used in Burkina Faso. One is a locally made soap, while the other is a commercially bought industrial soap. It was not specified which soap was used by the

121
households in CREPA‘s reports. Since the use of both soaps is common, 13 different greywater mixtures were tested with varying amounts of local and industrial soap, along with varying amounts of Millac milk powder and sugar. Sugar and milk are commonly used to increase TSS and BOD when creating a greywater mixture (Dalahmeh, 2009).
Testing the greywater mixture
TSS testing was completed at the National Water Laboratory in Ouagadougou, Burkina Faso. 13 different greywater mixtures were tested as follows, based on lab methodology found in Environmental Science Section (1993): 1 L of each mixture was made and shaken for 5 minutes. 26 Glass fiber filters were labeled and washed with three 20 mL portions of distilled water. The filters were then dried in a 105 o C oven for one hour before being placed in a desiccator to cool. Using tongs, the filters were weighed and all weights were recorded. The weighed filter was then put on a filtering flask, into which a 10 mL water sample of the mixed greywater was placed. A vacuum pump was connected to the filtering flask and the greywater was filtered through the glass fiber filter. Once the 10 mL of water had been filtered, the glass fiber filter was dried at 105 o C for one hour and allowed to cool in a desiccator before it was weighed. This weight was recorded. This was repeated for two water samples from each greywater mixture. TSS for each of the two samples of the 13 greywater mixtures was calculated using Equation C4.
is total suspended solids [g/L] is the final weight (after greywater filtration) of the glass fiber filter [g] is the initial weight (before greywater filtration) of the glass fiber filter [g] is the filtrated volume [L]. The greywater mixture with the closest TSS to TSSvw was tested again for statistical significance. Three one liter mixtures, designated A, B and C, were made. TSS was tested as described above three times for each mixture, resulting in a total of nine tests. The following BOD5, EC and pH measurements were carried out at the Swedish University of Agricultural Sciences in Uppsala, Sweden. BOD5 was tested according to the lab protocol presented in American Public Health Association‘s 5210 Biochemical Oxygen Demand (2001). Three 1 L mixtures of the chosen greywater mixture, called A, B and C, were made and mixed for five minutes. Five BOD5 tests were made for each mixture: one blank with a dilution factor of 1, and five others tests with a dilution factor of 1/300, 2/300, 3/300, 4/300 and 5/300 that respectively contained a sample volume of 1 mL, 2 mL, 3 mL, 4 mL and 5 mL. Dissolved oxygen measurements were made on the first and fifth day. EC and pH was
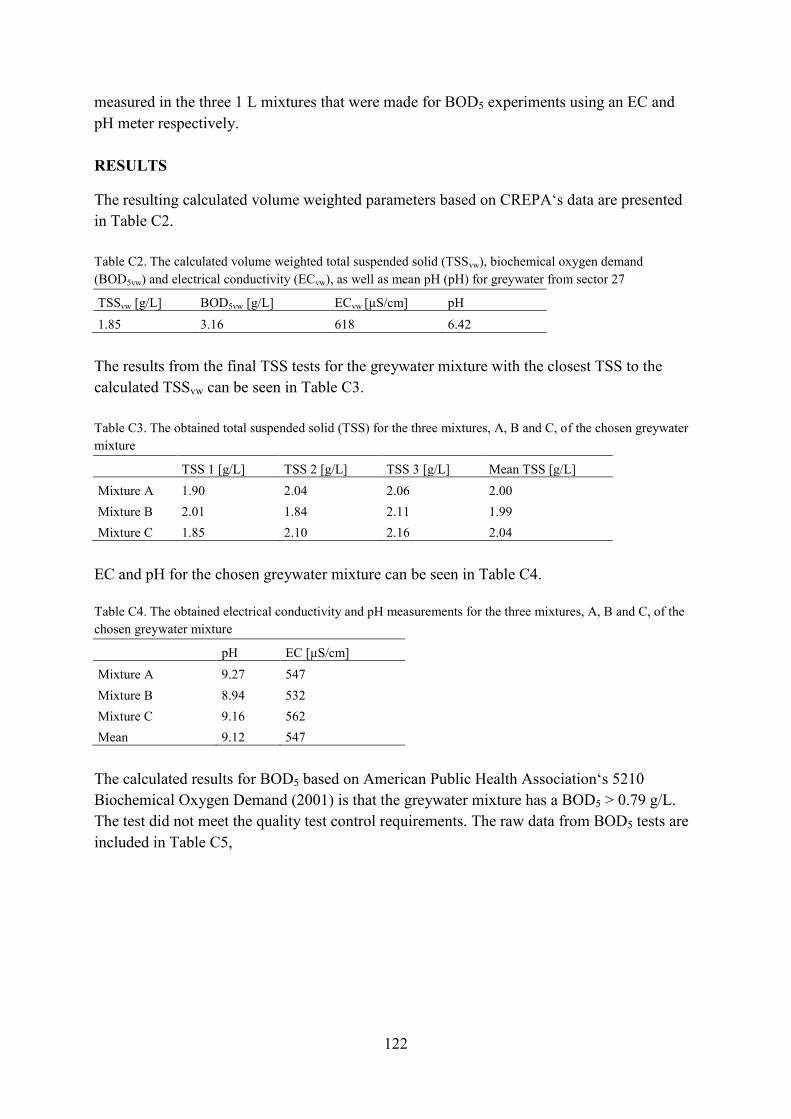
122
measured in the three 1 L mixtures that were made for BOD5 experiments using an EC and pH meter respectively. RESULTS
The resulting calculated volume weighted parameters based on CREPA‘s data are presented in Table C2. Table C2. The calculated volume weighted total suspended solid (TSSvw), biochemical oxygen demand (BOD5vw) and electrical conductivity (ECvw), as well as mean pH (pH) for greywater from sector 27
TSSvw [g/L] BOD5vw [g/L] ECvw [µS/cm] pH 1.85 3.16 618 6.42
The results from the final TSS tests for the greywater mixture with the closest TSS to the calculated TSSvw can be seen in Table C3. Table C3. The obtained total suspended solid (TSS) for the three mixtures, A, B and C, of the chosen greywater mixture
TSS 1 [g/L] TSS 2 [g/L] TSS 3 [g/L] Mean TSS [g/L] Mixture A 1.90 2.04 2.06 2.00 Mixture B 2.01 1.84 2.11 1.99 Mixture C 1.85 2.10 2.16 2.04
EC and pH for the chosen greywater mixture can be seen in Table C4. Table C4. The obtained electrical conductivity and pH measurements for the three mixtures, A, B and C, of the chosen greywater mixture
pH EC [µS/cm] Mixture A 9.27 547 Mixture B 8.94 532 Mixture C 9.16 562 Mean 9.12 547
The calculated results for BOD5 based on American Public Health Association‘s 5210 Biochemical Oxygen Demand (2001) is that the greywater mixture has a BOD5 > 0.79 g/L. The test did not meet the quality test control requirements. The raw data from BOD5 tests are included in Table C5,
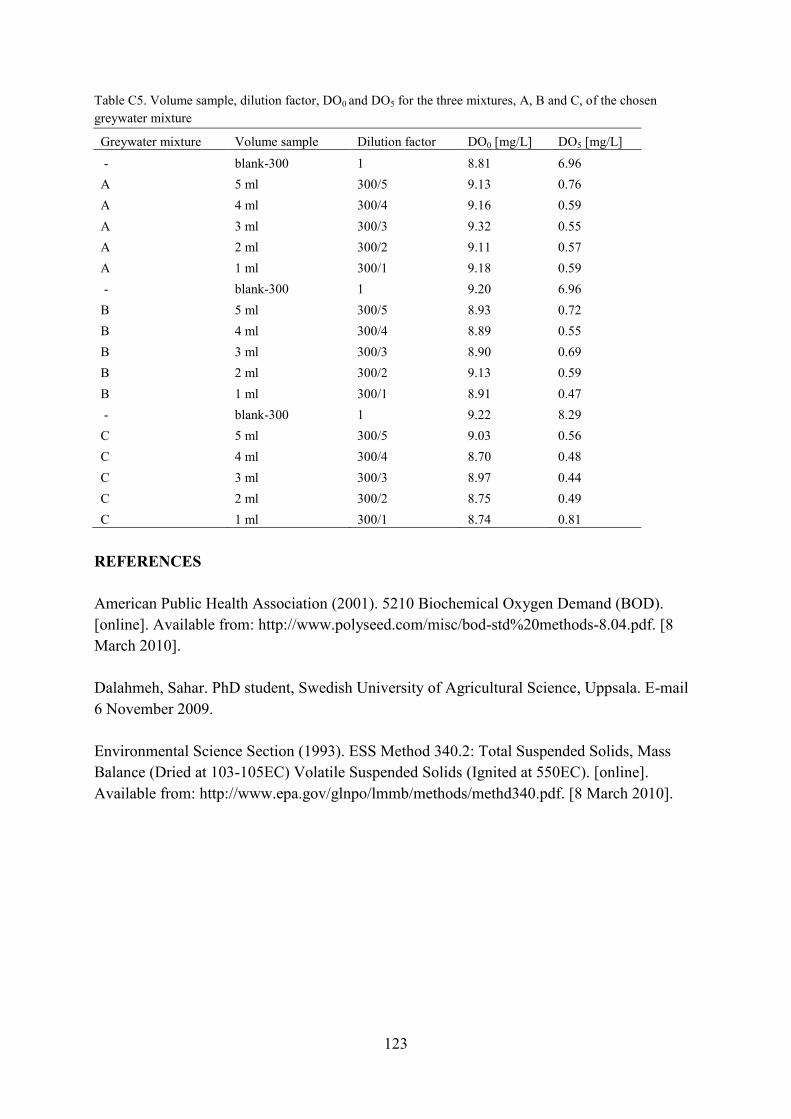
123
Table C5. Volume sample, dilution factor, DO0 and DO5 for the three mixtures, A, B and C, of the chosen greywater mixture
Greywater mixture Volume sample Dilution factor DO0 [mg/L] DO5 [mg/L] - blank-300 1 8.81 6.96 A 5 ml 300/5 9.13 0.76 A 4 ml 300/4 9.16 0.59 A 3 ml 300/3 9.32 0.55 A 2 ml 300/2 9.11 0.57 A 1 ml 300/1 9.18 0.59 - blank-300 1 9.20 6.96 B 5 ml 300/5 8.93 0.72 B 4 ml 300/4 8.89 0.55 B 3 ml 300/3 8.90 0.69 B 2 ml 300/2 9.13 0.59 B 1 ml 300/1 8.91 0.47 - blank-300 1 9.22 8.29 C 5 ml 300/5 9.03 0.56 C 4 ml 300/4 8.70 0.48 C 3 ml 300/3 8.97 0.44 C 2 ml 300/2 8.75 0.49 C 1 ml 300/1 8.74 0.81
REFERENCES American Public Health Association (2001). 5210 Biochemical Oxygen Demand (BOD). [online]. Available from: http://www.polyseed.com/misc/bod-std%20methods-8.04.pdf. [8 March 2010]. Dalahmeh, Sahar. PhD student, Swedish University of Agricultural Science, Uppsala. E-mail 6 November 2009. Environmental Science Section (1993). ESS Method 340.2: Total Suspended Solids, Mass Balance (Dried at 103-105EC) Volatile Suspended Solids (Ignited at 550EC). [online]. Available from: http://www.epa.gov/glnpo/lmmb/methods/methd340.pdf. [8 March 2010].
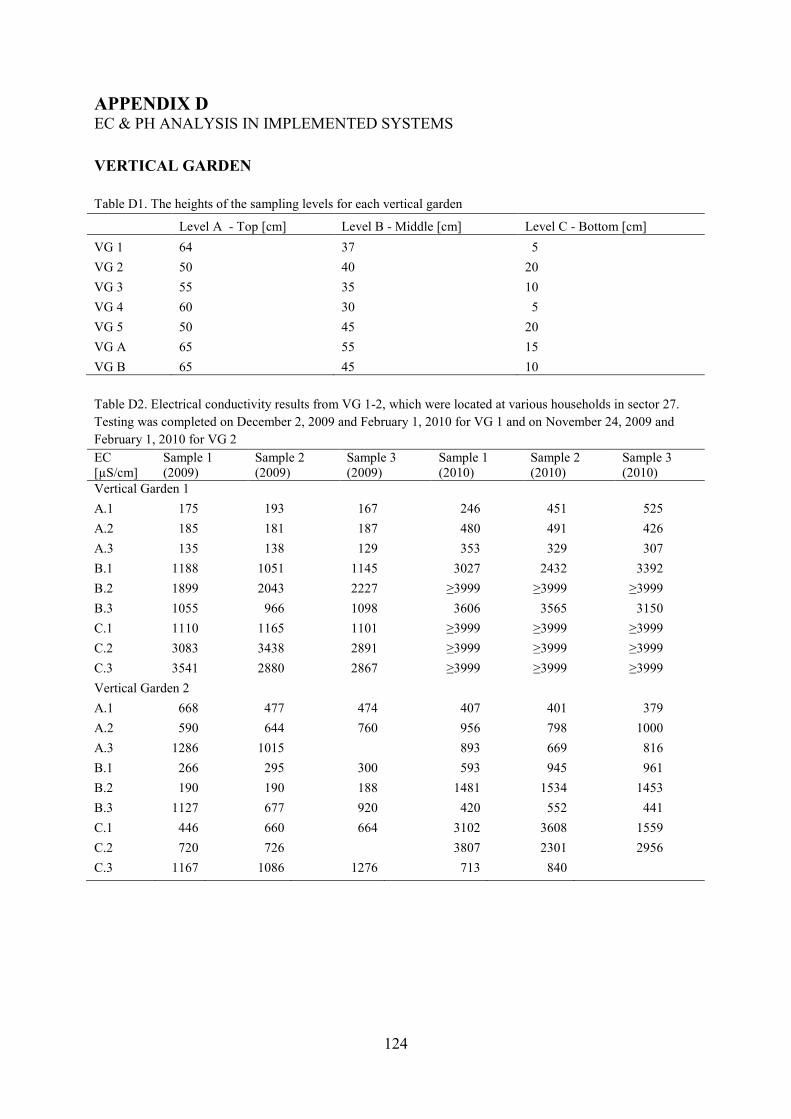
124
APPENDIX D EC & PH ANALYSIS IN IMPLEMENTED SYSTEMS VERTICAL GARDEN
Table D1. The heights of the sampling levels for each vertical garden
Level A - Top [cm] Level B - Middle [cm] Level C - Bottom [cm] VG 1 64 37 5 VG 2 50 40 20 VG 3 55 35 10 VG 4 60 30 5 VG 5 50 45 20 VG A 65 55 15 VG B 65 45 10 Table D2. Electrical conductivity results from VG 1-2, which were located at various households in sector 27. Testing was completed on December 2, 2009 and February 1, 2010 for VG 1 and on November 24, 2009 and February 1, 2010 for VG 2 EC [µS/cm]
Sample 1 (2009)
Sample 2 (2009)
Sample 3 (2009)
Sample 1 (2010)
Sample 2 (2010)
Sample 3 (2010)
Vertical Garden 1 A.1 175 193 167 246 451 525 A.2 185 181 187 480 491 426 A.3 135 138 129 353 329 307 B.1 1188 1051 1145 3027 2432 3392 B.2 1899 2043 2227 ≥3999 ≥3999 ≥3999 B.3 1055 966 1098 3606 3565 3150 C.1 1110 1165 1101 ≥3999 ≥3999 ≥3999 C.2 3083 3438 2891 ≥3999 ≥3999 ≥3999 C.3 3541 2880 2867 ≥3999 ≥3999 ≥3999 Vertical Garden 2 A.1 668 477 474 407 401 379 A.2 590 644 760 956 798 1000 A.3 1286 1015 893 669 816 B.1 266 295 300 593 945 961 B.2 190 190 188 1481 1534 1453 B.3 1127 677 920 420 552 441 C.1 446 660 664 3102 3608 1559 C.2 720 726 3807 2301 2956 C.3 1167 1086 1276 713 840
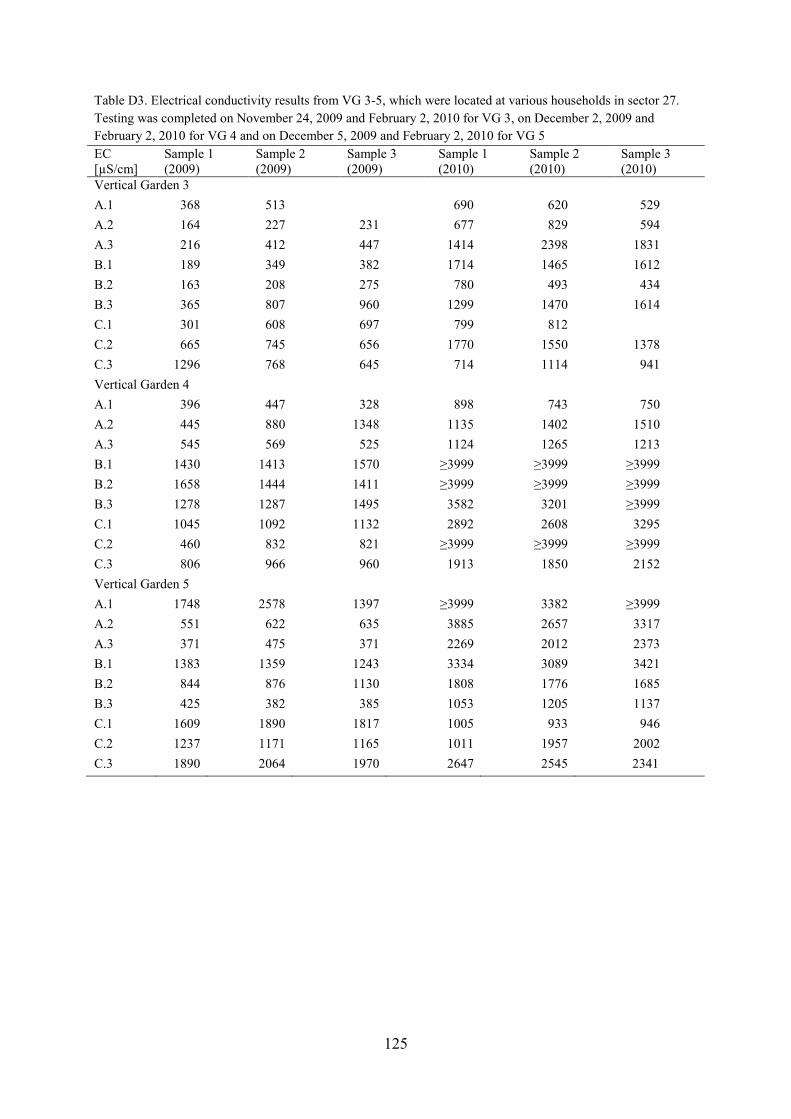
125
Table D3. Electrical conductivity results from VG 3-5, which were located at various households in sector 27. Testing was completed on November 24, 2009 and February 2, 2010 for VG 3, on December 2, 2009 and February 2, 2010 for VG 4 and on December 5, 2009 and February 2, 2010 for VG 5 EC [µS/cm]
Sample 1 (2009)
Sample 2 (2009)
Sample 3 (2009)
Sample 1 (2010)
Sample 2 (2010)
Sample 3 (2010)
Vertical Garden 3 A.1 368 513 690 620 529 A.2 164 227 231 677 829 594 A.3 216 412 447 1414 2398 1831 B.1 189 349 382 1714 1465 1612 B.2 163 208 275 780 493 434 B.3 365 807 960 1299 1470 1614 C.1 301 608 697 799 812 C.2 665 745 656 1770 1550 1378 C.3 1296 768 645 714 1114 941 Vertical Garden 4 A.1 396 447 328 898 743 750 A.2 445 880 1348 1135 1402 1510 A.3 545 569 525 1124 1265 1213 B.1 1430 1413 1570 ≥3999 ≥3999 ≥3999 B.2 1658 1444 1411 ≥3999 ≥3999 ≥3999 B.3 1278 1287 1495 3582 3201 ≥3999 C.1 1045 1092 1132 2892 2608 3295 C.2 460 832 821 ≥3999 ≥3999 ≥3999 C.3 806 966 960 1913 1850 2152 Vertical Garden 5 A.1 1748 2578 1397 ≥3999 3382 ≥3999 A.2 551 622 635 3885 2657 3317 A.3 371 475 371 2269 2012 2373 B.1 1383 1359 1243 3334 3089 3421 B.2 844 876 1130 1808 1776 1685 B.3 425 382 385 1053 1205 1137 C.1 1609 1890 1817 1005 933 946 C.2 1237 1171 1165 1011 1957 2002 C.3 1890 2064 1970 2647 2545 2341
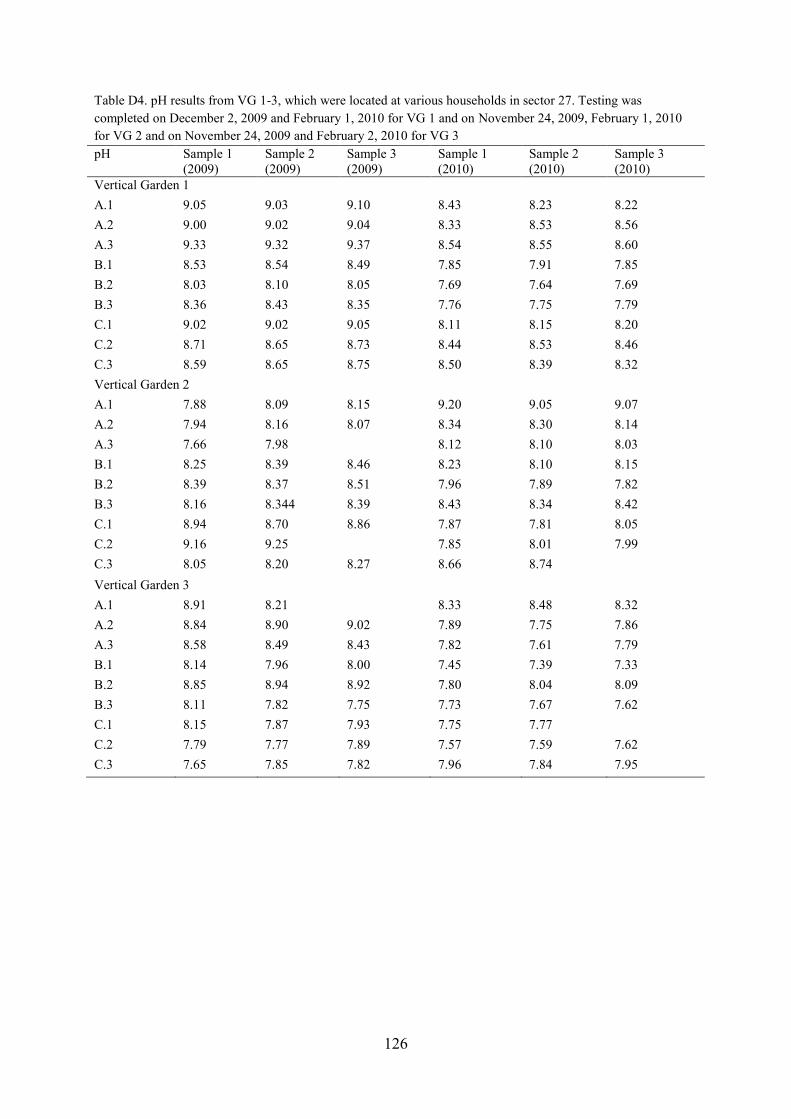
126
Table D4. pH results from VG 1-3, which were located at various households in sector 27. Testing was completed on December 2, 2009 and February 1, 2010 for VG 1 and on November 24, 2009, February 1, 2010 for VG 2 and on November 24, 2009 and February 2, 2010 for VG 3 pH Sample 1
(2009) Sample 2 (2009)
Sample 3 (2009)
Sample 1 (2010)
Sample 2 (2010)
Sample 3 (2010)
Vertical Garden 1 A.1 9.05 9.03 9.10 8.43 8.23 8.22 A.2 9.00 9.02 9.04 8.33 8.53 8.56 A.3 9.33 9.32 9.37 8.54 8.55 8.60 B.1 8.53 8.54 8.49 7.85 7.91 7.85 B.2 8.03 8.10 8.05 7.69 7.64 7.69 B.3 8.36 8.43 8.35 7.76 7.75 7.79 C.1 9.02 9.02 9.05 8.11 8.15 8.20 C.2 8.71 8.65 8.73 8.44 8.53 8.46 C.3 8.59 8.65 8.75 8.50 8.39 8.32 Vertical Garden 2 A.1 7.88 8.09 8.15 9.20 9.05 9.07 A.2 7.94 8.16 8.07 8.34 8.30 8.14 A.3 7.66 7.98 8.12 8.10 8.03 B.1 8.25 8.39 8.46 8.23 8.10 8.15 B.2 8.39 8.37 8.51 7.96 7.89 7.82 B.3 8.16 8.344 8.39 8.43 8.34 8.42 C.1 8.94 8.70 8.86 7.87 7.81 8.05 C.2 9.16 9.25 7.85 8.01 7.99 C.3 8.05 8.20 8.27 8.66 8.74 Vertical Garden 3 A.1 8.91 8.21 8.33 8.48 8.32 A.2 8.84 8.90 9.02 7.89 7.75 7.86 A.3 8.58 8.49 8.43 7.82 7.61 7.79 B.1 8.14 7.96 8.00 7.45 7.39 7.33 B.2 8.85 8.94 8.92 7.80 8.04 8.09 B.3 8.11 7.82 7.75 7.73 7.67 7.62 C.1 8.15 7.87 7.93 7.75 7.77 C.2 7.79 7.77 7.89 7.57 7.59 7.62 C.3 7.65 7.85 7.82 7.96 7.84 7.95
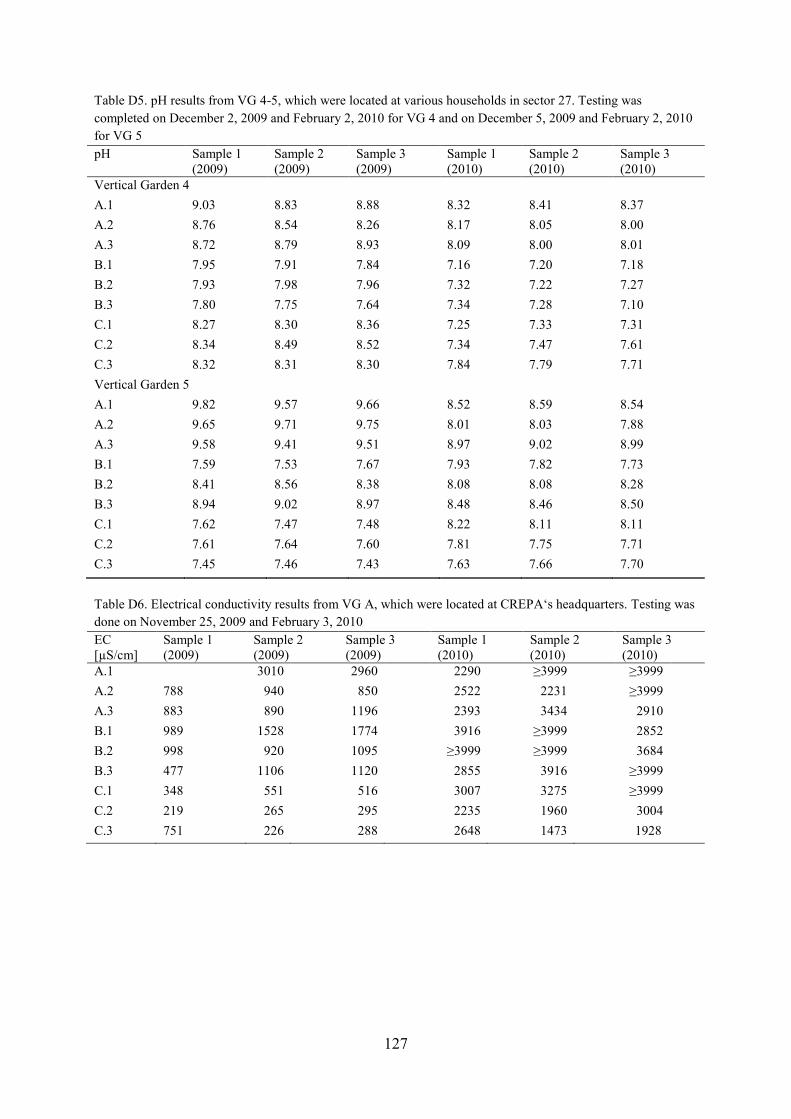
127
Table D5. pH results from VG 4-5, which were located at various households in sector 27. Testing was completed on December 2, 2009 and February 2, 2010 for VG 4 and on December 5, 2009 and February 2, 2010 for VG 5 pH Sample 1
(2009) Sample 2 (2009)
Sample 3 (2009)
Sample 1 (2010)
Sample 2 (2010)
Sample 3 (2010)
Vertical Garden 4 A.1 9.03 8.83 8.88 8.32 8.41 8.37 A.2 8.76 8.54 8.26 8.17 8.05 8.00 A.3 8.72 8.79 8.93 8.09 8.00 8.01 B.1 7.95 7.91 7.84 7.16 7.20 7.18 B.2 7.93 7.98 7.96 7.32 7.22 7.27 B.3 7.80 7.75 7.64 7.34 7.28 7.10 C.1 8.27 8.30 8.36 7.25 7.33 7.31 C.2 8.34 8.49 8.52 7.34 7.47 7.61 C.3 8.32 8.31 8.30 7.84 7.79 7.71 Vertical Garden 5 A.1 9.82 9.57 9.66 8.52 8.59 8.54 A.2 9.65 9.71 9.75 8.01 8.03 7.88 A.3 9.58 9.41 9.51 8.97 9.02 8.99 B.1 7.59 7.53 7.67 7.93 7.82 7.73 B.2 8.41 8.56 8.38 8.08 8.08 8.28 B.3 8.94 9.02 8.97 8.48 8.46 8.50 C.1 7.62 7.47 7.48 8.22 8.11 8.11 C.2 7.61 7.64 7.60 7.81 7.75 7.71 C.3 7.45 7.46 7.43 7.63 7.66 7.70
Table D6. Electrical conductivity results from VG A, which were located at CREPA‘s headquarters. Testing was done on November 25, 2009 and February 3, 2010 EC [µS/cm]
Sample 1 (2009)
Sample 2 (2009)
Sample 3 (2009)
Sample 1 (2010)
Sample 2 (2010)
Sample 3 (2010)
A.1 3010 2960 2290 ≥3999 ≥3999 A.2 788 940 850 2522 2231 ≥3999 A.3 883 890 1196 2393 3434 2910 B.1 989 1528 1774 3916 ≥3999 2852 B.2 998 920 1095 ≥3999 ≥3999 3684 B.3 477 1106 1120 2855 3916 ≥3999 C.1 348 551 516 3007 3275 ≥3999 C.2 219 265 295 2235 1960 3004 C.3 751 226 288 2648 1473 1928
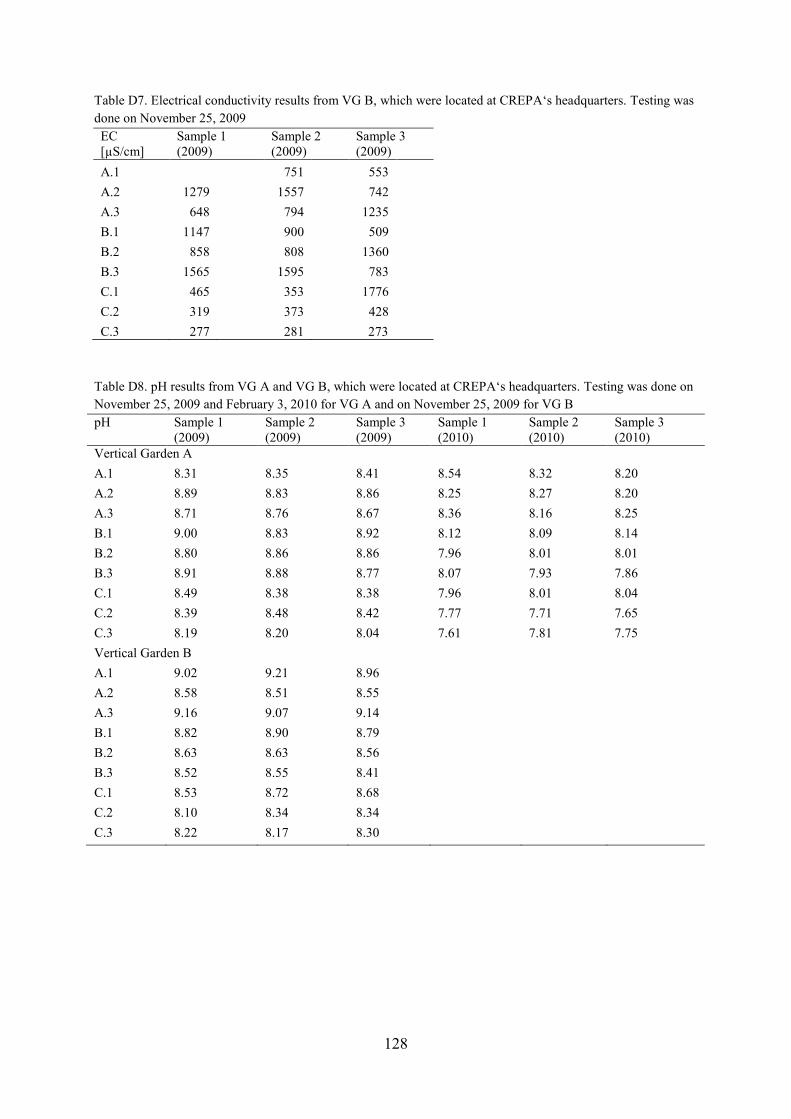
128
Table D7. Electrical conductivity results from VG B, which were located at CREPA‘s headquarters. Testing was done on November 25, 2009 EC [µS/cm]
Sample 1 (2009)
Sample 2 (2009)
Sample 3 (2009)
A.1 751 553 A.2 1279 1557 742 A.3 648 794 1235 B.1 1147 900 509 B.2 858 808 1360 B.3 1565 1595 783 C.1 465 353 1776 C.2 319 373 428 C.3 277 281 273
Table D8. pH results from VG A and VG B, which were located at CREPA‘s headquarters. Testing was done on November 25, 2009 and February 3, 2010 for VG A and on November 25, 2009 for VG B pH Sample 1
(2009) Sample 2 (2009)
Sample 3 (2009)
Sample 1 (2010)
Sample 2 (2010)
Sample 3 (2010)
Vertical Garden A A.1 8.31 8.35 8.41 8.54 8.32 8.20 A.2 8.89 8.83 8.86 8.25 8.27 8.20 A.3 8.71 8.76 8.67 8.36 8.16 8.25 B.1 9.00 8.83 8.92 8.12 8.09 8.14 B.2 8.80 8.86 8.86 7.96 8.01 8.01 B.3 8.91 8.88 8.77 8.07 7.93 7.86 C.1 8.49 8.38 8.38 7.96 8.01 8.04 C.2 8.39 8.48 8.42 7.77 7.71 7.65 C.3 8.19 8.20 8.04 7.61 7.81 7.75 Vertical Garden B A.1 9.02 9.21 8.96 A.2 8.58 8.51 8.55 A.3 9.16 9.07 9.14 B.1 8.82 8.90 8.79 B.2 8.63 8.63 8.56 B.3 8.52 8.55 8.41 C.1 8.53 8.72 8.68 C.2 8.10 8.34 8.34 C.3 8.22 8.17 8.30
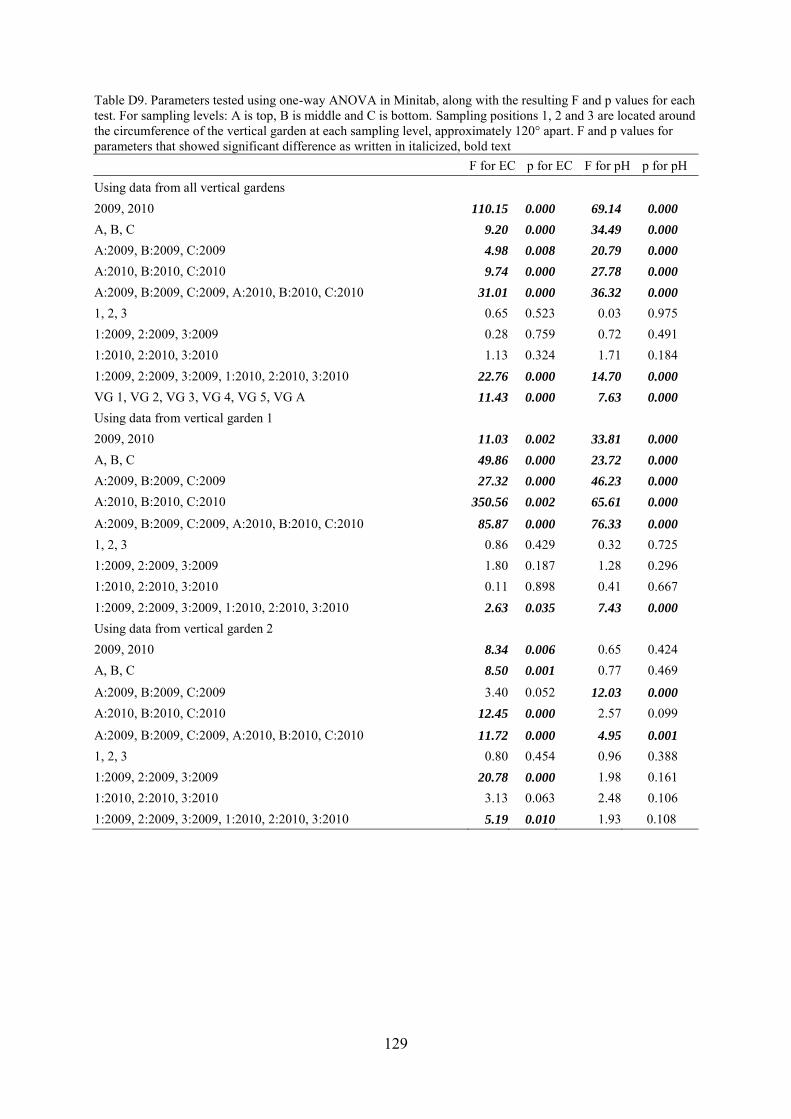
129
Table D9. Parameters tested using one-way ANOVA in Minitab, along with the resulting F and p values for each test. For sampling levels: A is top, B is middle and C is bottom. Sampling positions 1, 2 and 3 are located around the circumference of the vertical garden at each sampling level, approximately 120° apart. F and p values for parameters that showed significant difference as written in italicized, bold text F for EC p for EC F for pH p for pH
Using data from all vertical gardens 2009, 2010 110.15 0.000 69.14 0.000
A, B, C 9.20 0.000 34.49 0.000
A:2009, B:2009, C:2009 4.98 0.008 20.79 0.000
A:2010, B:2010, C:2010 9.74 0.000 27.78 0.000
A:2009, B:2009, C:2009, A:2010, B:2010, C:2010 31.01 0.000 36.32 0.000
1, 2, 3 0.65 0.523 0.03 0.975 1:2009, 2:2009, 3:2009 0.28 0.759 0.72 0.491 1:2010, 2:2010, 3:2010 1.13 0.324 1.71 0.184 1:2009, 2:2009, 3:2009, 1:2010, 2:2010, 3:2010 22.76 0.000 14.70 0.000
VG 1, VG 2, VG 3, VG 4, VG 5, VG A 11.43 0.000 7.63 0.000
Using data from vertical garden 1 2009, 2010 11.03 0.002 33.81 0.000
A, B, C 49.86 0.000 23.72 0.000
A:2009, B:2009, C:2009 27.32 0.000 46.23 0.000
A:2010, B:2010, C:2010 350.56 0.002 65.61 0.000
A:2009, B:2009, C:2009, A:2010, B:2010, C:2010 85.87 0.000 76.33 0.000
1, 2, 3 0.86 0.429 0.32 0.725 1:2009, 2:2009, 3:2009 1.80 0.187 1.28 0.296 1:2010, 2:2010, 3:2010 0.11 0.898 0.41 0.667 1:2009, 2:2009, 3:2009, 1:2010, 2:2010, 3:2010 2.63 0.035 7.43 0.000
Using data from vertical garden 2 2009, 2010 8.34 0.006 0.65 0.424
A, B, C 8.50 0.001 0.77 0.469
A:2009, B:2009, C:2009 3.40 0.052 12.03 0.000
A:2010, B:2010, C:2010 12.45 0.000 2.57 0.099
A:2009, B:2009, C:2009, A:2010, B:2010, C:2010 11.72 0.000 4.95 0.001
1, 2, 3 0.80 0.454 0.96 0.388 1:2009, 2:2009, 3:2009 20.78 0.000 1.98 0.161 1:2010, 2:2010, 3:2010 3.13 0.063 2.48 0.106 1:2009, 2:2009, 3:2009, 1:2010, 2:2010, 3:2010 5.19 0.010 1.93 0.108
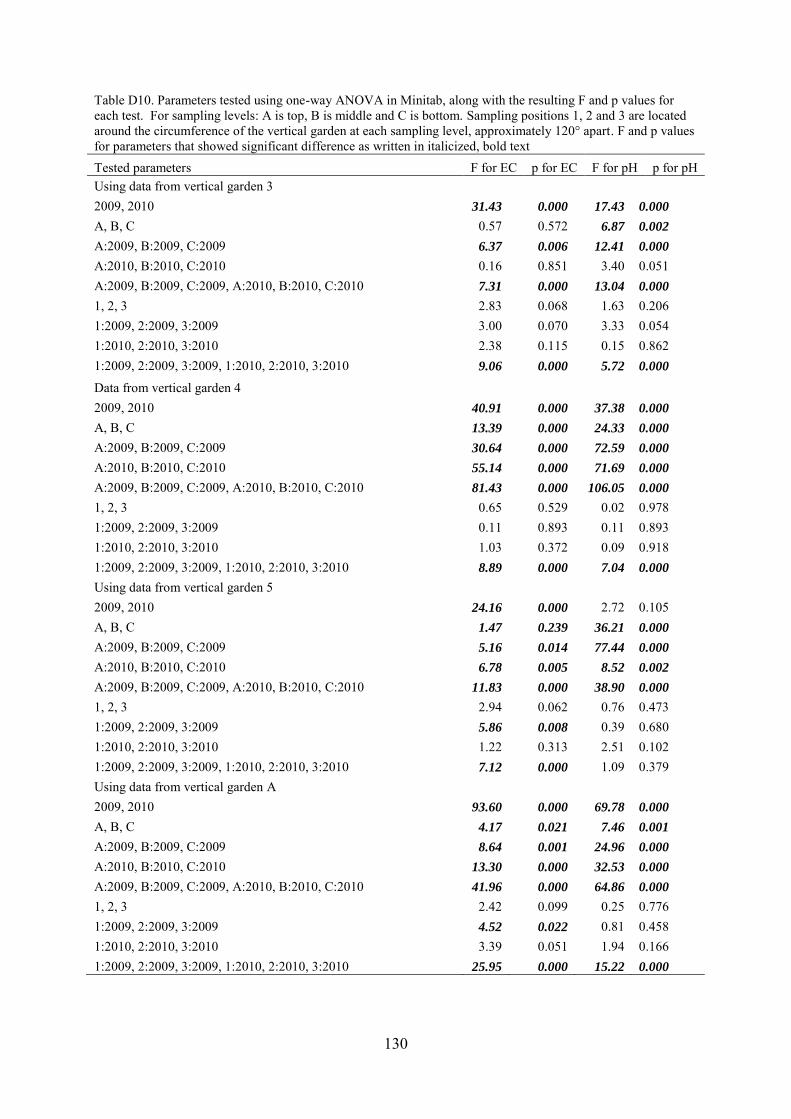
130
Table D10. Parameters tested using one-way ANOVA in Minitab, along with the resulting F and p values for each test. For sampling levels: A is top, B is middle and C is bottom. Sampling positions 1, 2 and 3 are located around the circumference of the vertical garden at each sampling level, approximately 120° apart. F and p values for parameters that showed significant difference as written in italicized, bold text Tested parameters F for EC p for EC F for pH p for pH Using data from vertical garden 3
2009, 2010 31.43 0.000 17.43 0.000
A, B, C 0.57 0.572 6.87 0.002
A:2009, B:2009, C:2009 6.37 0.006 12.41 0.000
A:2010, B:2010, C:2010 0.16 0.851 3.40 0.051 A:2009, B:2009, C:2009, A:2010, B:2010, C:2010 7.31 0.000 13.04 0.000
1, 2, 3 2.83 0.068 1.63 0.206 1:2009, 2:2009, 3:2009 3.00 0.070 3.33 0.054 1:2010, 2:2010, 3:2010 2.38 0.115 0.15 0.862 1:2009, 2:2009, 3:2009, 1:2010, 2:2010, 3:2010 9.06 0.000 5.72 0.000
Data from vertical garden 4 2009, 2010 40.91 0.000 37.38 0.000
A, B, C 13.39 0.000 24.33 0.000
A:2009, B:2009, C:2009 30.64 0.000 72.59 0.000
A:2010, B:2010, C:2010 55.14 0.000 71.69 0.000
A:2009, B:2009, C:2009, A:2010, B:2010, C:2010 81.43 0.000 106.05 0.000
1, 2, 3 0.65 0.529 0.02 0.978 1:2009, 2:2009, 3:2009 0.11 0.893 0.11 0.893 1:2010, 2:2010, 3:2010 1.03 0.372 0.09 0.918 1:2009, 2:2009, 3:2009, 1:2010, 2:2010, 3:2010 8.89 0.000 7.04 0.000
Using data from vertical garden 5 2009, 2010 24.16 0.000 2.72 0.105
A, B, C 1.47 0.239 36.21 0.000
A:2009, B:2009, C:2009 5.16 0.014 77.44 0.000
A:2010, B:2010, C:2010 6.78 0.005 8.52 0.002
A:2009, B:2009, C:2009, A:2010, B:2010, C:2010 11.83 0.000 38.90 0.000
1, 2, 3 2.94 0.062 0.76 0.473 1:2009, 2:2009, 3:2009 5.86 0.008 0.39 0.680 1:2010, 2:2010, 3:2010 1.22 0.313 2.51 0.102 1:2009, 2:2009, 3:2009, 1:2010, 2:2010, 3:2010 7.12 0.000 1.09 0.379 Using data from vertical garden A
2009, 2010 93.60 0.000 69.78 0.000
A, B, C 4.17 0.021 7.46 0.001
A:2009, B:2009, C:2009 8.64 0.001 24.96 0.000
A:2010, B:2010, C:2010 13.30 0.000 32.53 0.000
A:2009, B:2009, C:2009, A:2010, B:2010, C:2010 41.96 0.000 64.86 0.000
1, 2, 3 2.42 0.099 0.25 0.776 1:2009, 2:2009, 3:2009 4.52 0.022 0.81 0.458 1:2010, 2:2010, 3:2010 3.39 0.051 1.94 0.166 1:2009, 2:2009, 3:2009, 1:2010, 2:2010, 3:2010 25.95 0.000 15.22 0.000
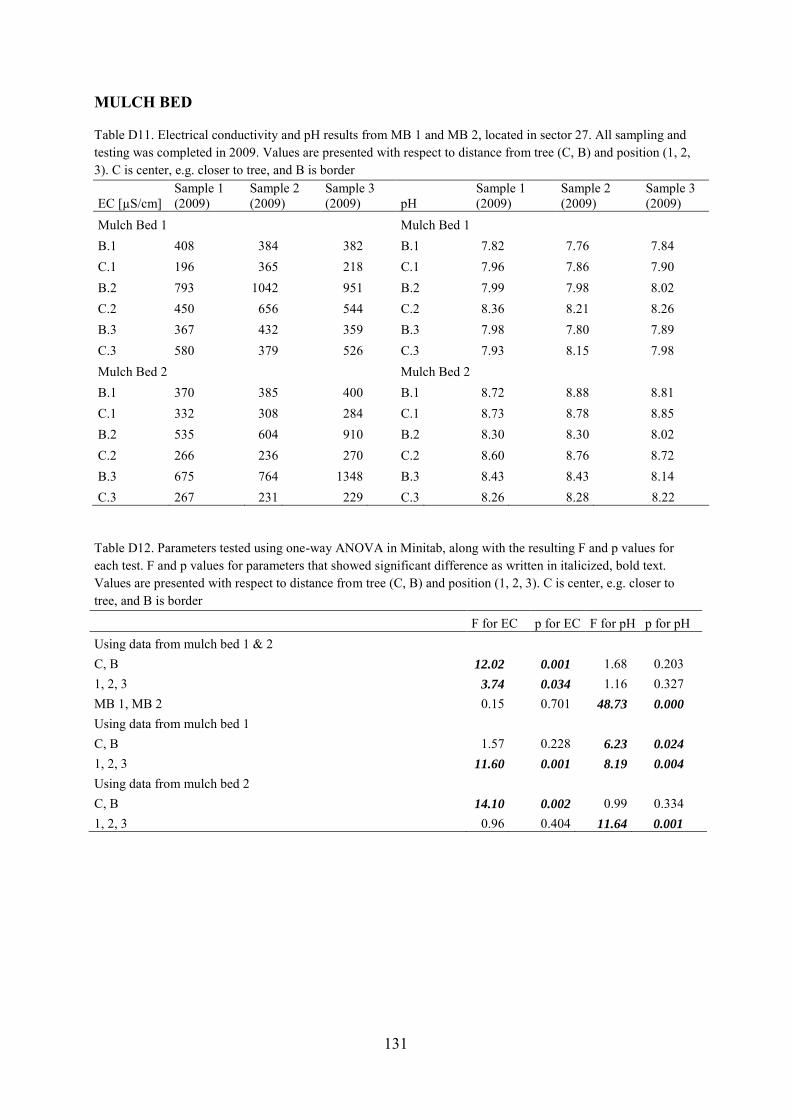
131
MULCH BED
Table D11. Electrical conductivity and pH results from MB 1 and MB 2, located in sector 27. All sampling and testing was completed in 2009. Values are presented with respect to distance from tree (C, B) and position (1, 2, 3). C is center, e.g. closer to tree, and B is border
EC [µS/cm] Sample 1 (2009)
Sample 2 (2009)
Sample 3 (2009) pH
Sample 1 (2009)
Sample 2 (2009)
Sample 3 (2009)
Mulch Bed 1
Mulch Bed 1 B.1 408 384 382 B.1 7.82 7.76 7.84
C.1 196 365 218 C.1 7.96 7.86 7.90 B.2 793 1042 951 B.2 7.99 7.98 8.02 C.2 450 656 544 C.2 8.36 8.21 8.26 B.3 367 432 359 B.3 7.98 7.80 7.89 C.3 580 379 526 C.3 7.93 8.15 7.98 Mulch Bed 2
Mulch Bed 2
B.1 370 385 400 B.1 8.72 8.88 8.81 C.1 332 308 284 C.1 8.73 8.78 8.85 B.2 535 604 910 B.2 8.30 8.30 8.02 C.2 266 236 270 C.2 8.60 8.76 8.72 B.3 675 764 1348 B.3 8.43 8.43 8.14 C.3 267 231 229 C.3 8.26 8.28 8.22
Table D12. Parameters tested using one-way ANOVA in Minitab, along with the resulting F and p values for each test. F and p values for parameters that showed significant difference as written in italicized, bold text. Values are presented with respect to distance from tree (C, B) and position (1, 2, 3). C is center, e.g. closer to tree, and B is border F for EC p for EC F for pH p for pH Using data from mulch bed 1 & 2
C, B 12.02 0.001 1.68 0.203 1, 2, 3 3.74 0.034 1.16 0.327 MB 1, MB 2 0.15 0.701 48.73 0.000
Using data from mulch bed 1 C, B 1.57 0.228 6.23 0.024
1, 2, 3 11.60 0.001 8.19 0.004
Using data from mulch bed 2 C, B 14.10 0.002 0.99 0.334
1, 2, 3 0.96 0.404 11.64 0.001
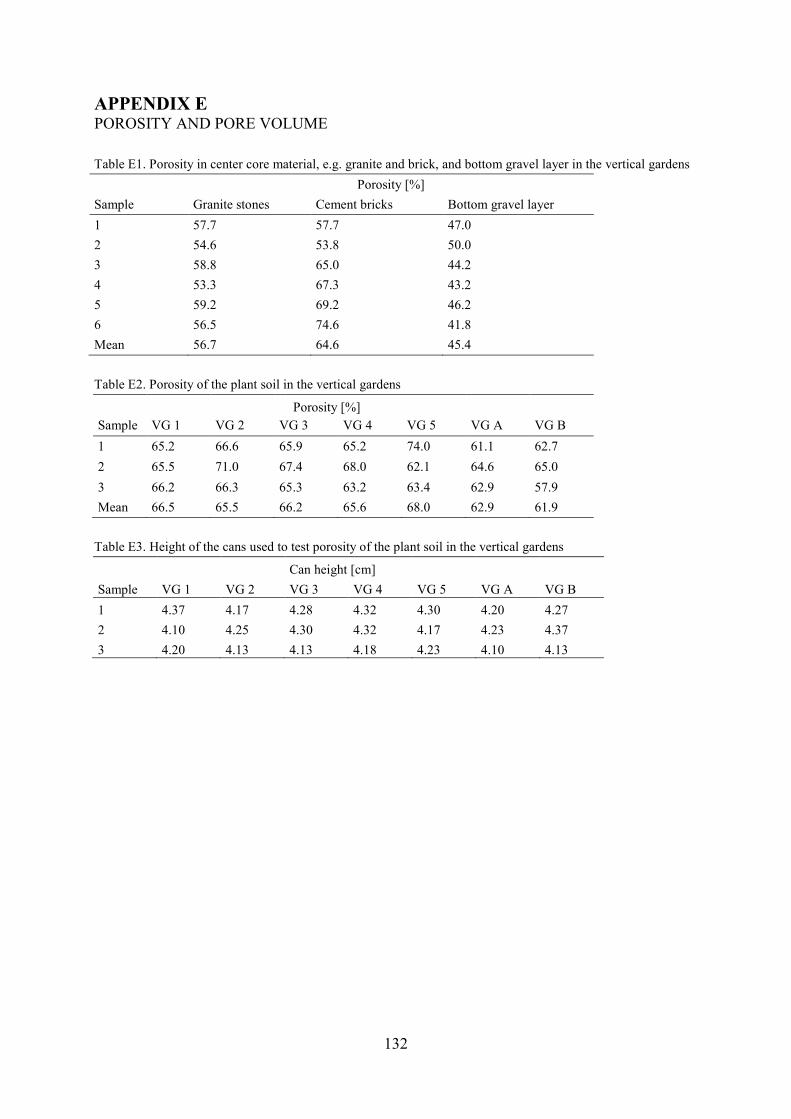
132
APPENDIX E POROSITY AND PORE VOLUME Table E1. Porosity in center core material, e.g. granite and brick, and bottom gravel layer in the vertical gardens
Porosity [%] Sample Granite stones Cement bricks Bottom gravel layer 1 57.7 57.7 47.0 2 54.6 53.8 50.0 3 58.8 65.0 44.2 4 53.3 67.3 43.2 5 59.2 69.2 46.2 6 56.5 74.6 41.8 Mean 56.7 64.6 45.4 Table E2. Porosity of the plant soil in the vertical gardens
Porosity [%]
Sample VG 1 VG 2 VG 3 VG 4 VG 5 VG A VG B 1 65.2 66.6 65.9 65.2 74.0 61.1 62.7 2 65.5 71.0 67.4 68.0 62.1 64.6 65.0 3 66.2 66.3 65.3 63.2 63.4 62.9 57.9 Mean 66.5 65.5 66.2 65.6 68.0 62.9 61.9 Table E3. Height of the cans used to test porosity of the plant soil in the vertical gardens
Can height [cm] Sample VG 1 VG 2 VG 3 VG 4 VG 5 VG A VG B 1 4.37 4.17 4.28 4.32 4.30 4.20 4.27 2 4.10 4.25 4.30 4.32 4.17 4.23 4.37 3 4.20 4.13 4.13 4.18 4.23 4.10 4.13
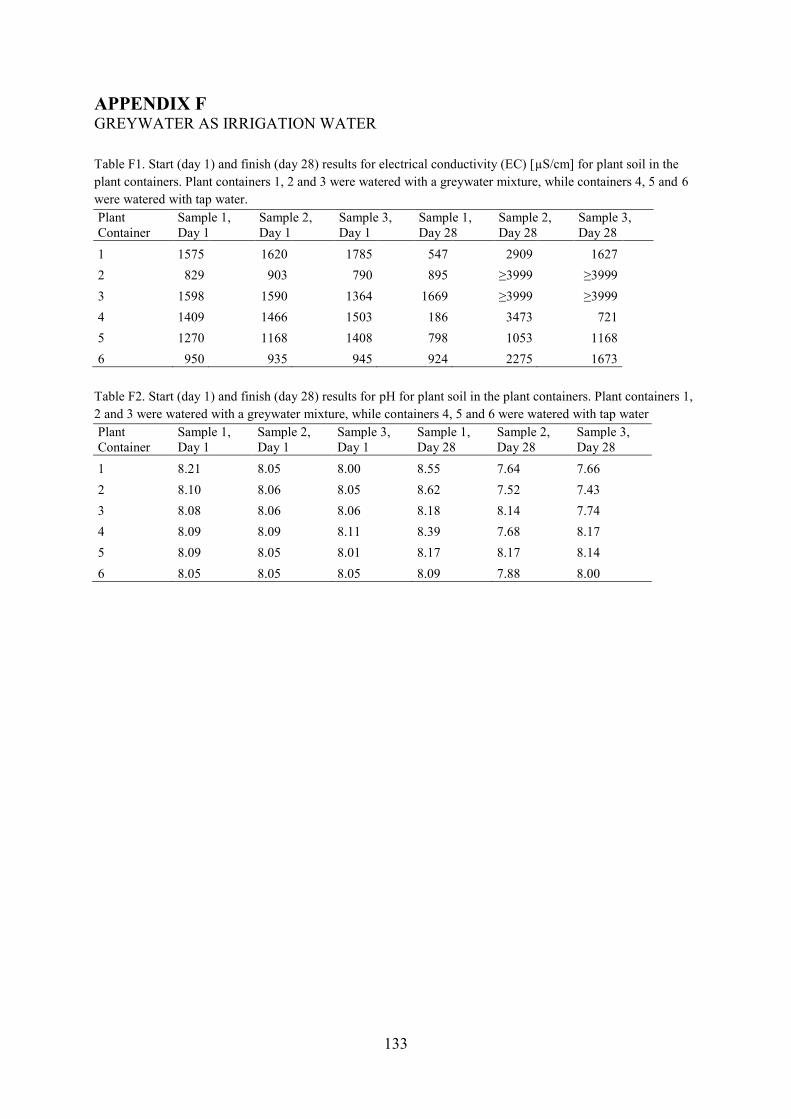
133
APPENDIX F GREYWATER AS IRRIGATION WATER Table F1. Start (day 1) and finish (day 28) results for electrical conductivity (EC) [µS/cm] for plant soil in the plant containers. Plant containers 1, 2 and 3 were watered with a greywater mixture, while containers 4, 5 and 6 were watered with tap water. Plant Container
Sample 1, Day 1
Sample 2, Day 1
Sample 3, Day 1
Sample 1, Day 28
Sample 2, Day 28
Sample 3, Day 28
1 1575 1620 1785 547 2909 1627 2 829 903 790 895 ≥3999 ≥3999 3 1598 1590 1364 1669 ≥3999 ≥3999 4 1409 1466 1503 186 3473 721 5 1270 1168 1408 798 1053 1168 6 950 935 945 924 2275 1673 Table F2. Start (day 1) and finish (day 28) results for pH for plant soil in the plant containers. Plant containers 1, 2 and 3 were watered with a greywater mixture, while containers 4, 5 and 6 were watered with tap water Plant Container
Sample 1, Day 1
Sample 2, Day 1
Sample 3, Day 1
Sample 1, Day 28
Sample 2, Day 28
Sample 3, Day 28
1 8.21 8.05 8.00 8.55 7.64 7.66 2 8.10 8.06 8.05 8.62 7.52 7.43 3 8.08 8.06 8.06 8.18 8.14 7.74 4 8.09 8.09 8.11 8.39 7.68 8.17 5 8.09 8.05 8.01 8.17 8.17 8.14 6 8.05 8.05 8.05 8.09 7.88 8.00
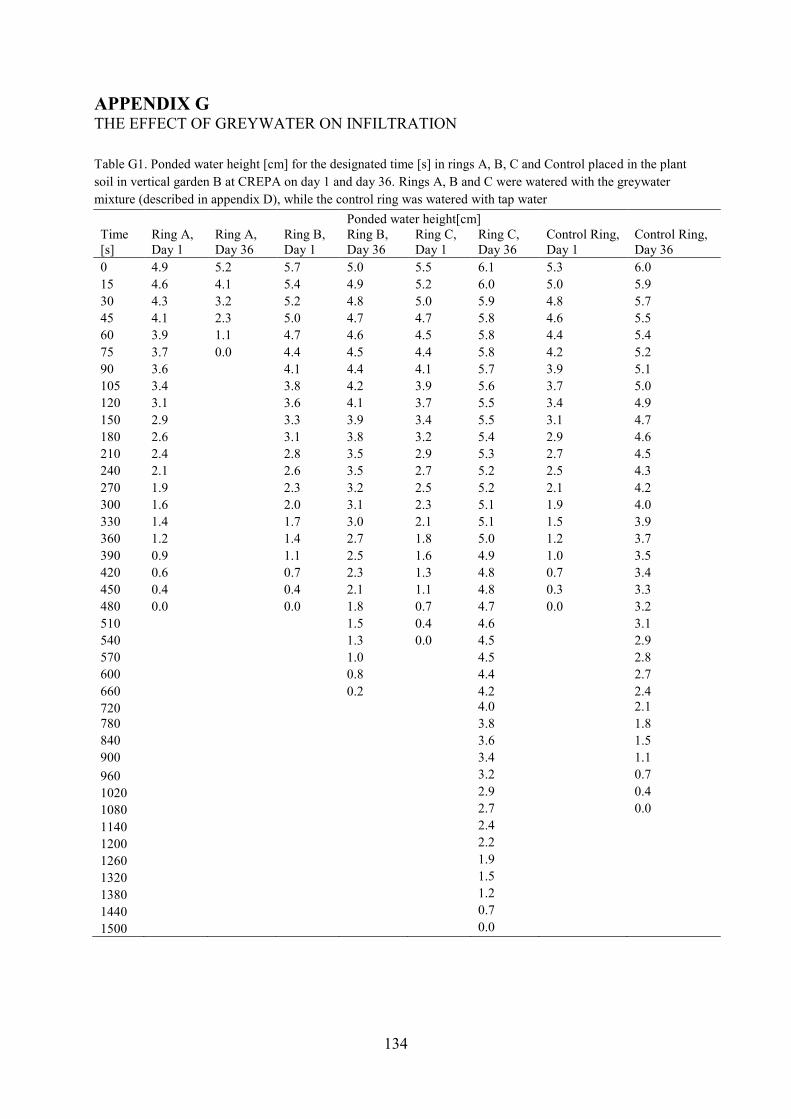
134
APPENDIX G THE EFFECT OF GREYWATER ON INFILTRATION Table G1. Ponded water height [cm] for the designated time [s] in rings A, B, C and Control placed in the plant soil in vertical garden B at CREPA on day 1 and day 36. Rings A, B and C were watered with the greywater mixture (described in appendix D), while the control ring was watered with tap water Ponded water height[cm] Time [s]
Ring A, Day 1
Ring A, Day 36
Ring B, Day 1
Ring B, Day 36
Ring C, Day 1
Ring C, Day 36
Control Ring, Day 1
Control Ring, Day 36
0 4.9 5.2 5.7 5.0 5.5 6.1 5.3 6.0 15 4.6 4.1 5.4 4.9 5.2 6.0 5.0 5.9 30 4.3 3.2 5.2 4.8 5.0 5.9 4.8 5.7 45 4.1 2.3 5.0 4.7 4.7 5.8 4.6 5.5 60 3.9 1.1 4.7 4.6 4.5 5.8 4.4 5.4 75 3.7 0.0 4.4 4.5 4.4 5.8 4.2 5.2 90 3.6
4.1 4.4 4.1 5.7 3.9 5.1
105 3.4
3.8 4.2 3.9 5.6 3.7 5.0 120 3.1
3.6 4.1 3.7 5.5 3.4 4.9
150 2.9
3.3 3.9 3.4 5.5 3.1 4.7 180 2.6
3.1 3.8 3.2 5.4 2.9 4.6
210 2.4
2.8 3.5 2.9 5.3 2.7 4.5 240 2.1
2.6 3.5 2.7 5.2 2.5 4.3
270 1.9
2.3 3.2 2.5 5.2 2.1 4.2 300 1.6
2.0 3.1 2.3 5.1 1.9 4.0
330 1.4
1.7 3.0 2.1 5.1 1.5 3.9 360 1.2
1.4 2.7 1.8 5.0 1.2 3.7
390 0.9
1.1 2.5 1.6 4.9 1.0 3.5 420 0.6
0.7 2.3 1.3 4.8 0.7 3.4
450 0.4
0.4 2.1 1.1 4.8 0.3 3.3 480 0.0
0.0 1.8 0.7 4.7 0.0 3.2
510
1.5 0.4 4.6
3.1 540
1.3 0.0 4.5
2.9
570
1.0
4.5
2.8 600
0.8
4.4
2.7
660
0.2
4.2
2.4 720 4.0 2.1 780 3.8 1.8 840 3.6 1.5 900 3.4 1.1 960 3.2 0.7 1020 2.9 0.4 1080 2.7 0.0 1140 2.4 1200 2.2 1260 1.9 1320 1.5 1380 1.2 1440 0.7 1500 0.0
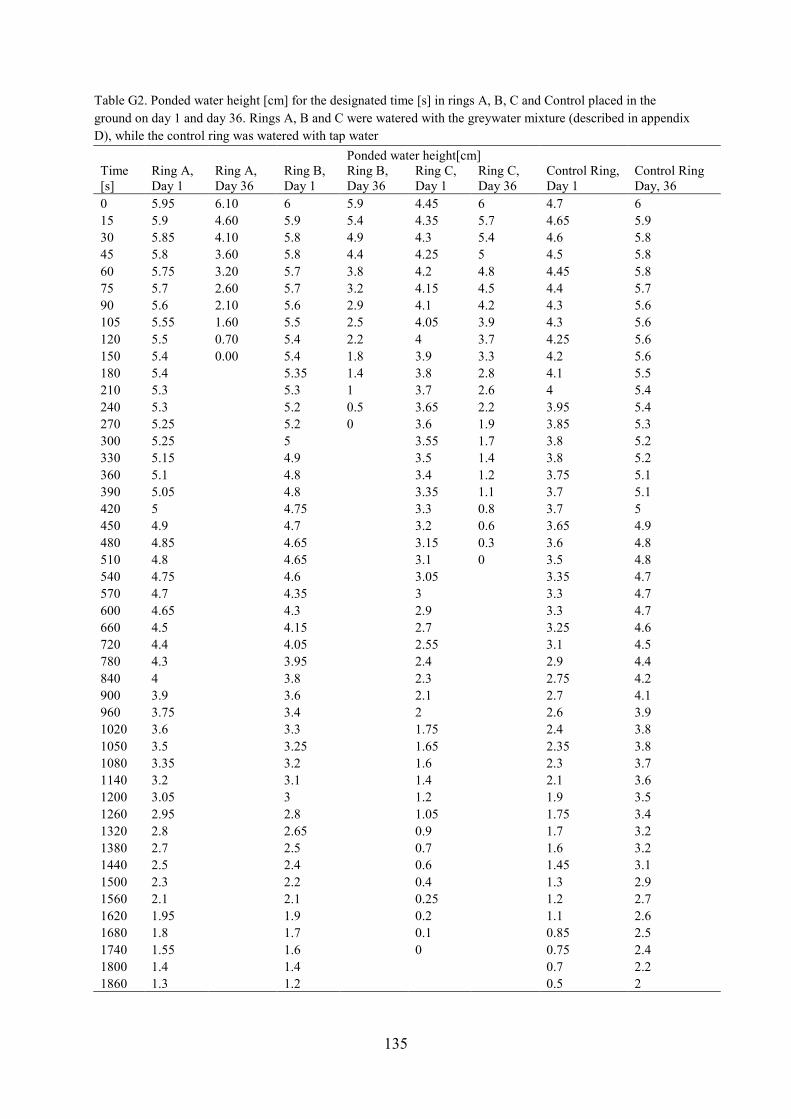
135
Table G2. Ponded water height [cm] for the designated time [s] in rings A, B, C and Control placed in the ground on day 1 and day 36. Rings A, B and C were watered with the greywater mixture (described in appendix D), while the control ring was watered with tap water Ponded water height[cm] Time [s]
Ring A, Day 1
Ring A, Day 36
Ring B, Day 1
Ring B, Day 36
Ring C, Day 1
Ring C, Day 36
Control Ring, Day 1
Control Ring Day, 36
0 5.95 6.10 6 5.9 4.45 6 4.7 6 15 5.9 4.60 5.9 5.4 4.35 5.7 4.65 5.9 30 5.85 4.10 5.8 4.9 4.3 5.4 4.6 5.8 45 5.8 3.60 5.8 4.4 4.25 5 4.5 5.8 60 5.75 3.20 5.7 3.8 4.2 4.8 4.45 5.8 75 5.7 2.60 5.7 3.2 4.15 4.5 4.4 5.7 90 5.6 2.10 5.6 2.9 4.1 4.2 4.3 5.6 105 5.55 1.60 5.5 2.5 4.05 3.9 4.3 5.6 120 5.5 0.70 5.4 2.2 4 3.7 4.25 5.6 150 5.4 0.00 5.4 1.8 3.9 3.3 4.2 5.6 180 5.4
5.35 1.4 3.8 2.8 4.1 5.5
210 5.3
5.3 1 3.7 2.6 4 5.4 240 5.3
5.2 0.5 3.65 2.2 3.95 5.4
270 5.25
5.2 0 3.6 1.9 3.85 5.3 300 5.25
5
3.55 1.7 3.8 5.2
330 5.15
4.9
3.5 1.4 3.8 5.2 360 5.1 4.8 3.4 1.2 3.75 5.1 390 5.05
4.8
3.35 1.1 3.7 5.1
420 5
4.75
3.3 0.8 3.7 5 450 4.9
4.7
3.2 0.6 3.65 4.9
480 4.85
4.65
3.15 0.3 3.6 4.8 510 4.8
4.65
3.1 0 3.5 4.8
540 4.75
4.6
3.05
3.35 4.7 570 4.7
4.35
3
3.3 4.7
600 4.65
4.3
2.9
3.3 4.7 660 4.5
4.15
2.7
3.25 4.6
720 4.4
4.05
2.55
3.1 4.5 780 4.3
3.95
2.4
2.9 4.4
840 4
3.8
2.3
2.75 4.2 900 3.9
3.6
2.1
2.7 4.1
960 3.75
3.4
2
2.6 3.9 1020 3.6
3.3
1.75
2.4 3.8
1050 3.5
3.25
1.65
2.35 3.8 1080 3.35
3.2
1.6
2.3 3.7
1140 3.2
3.1
1.4
2.1 3.6 1200 3.05
3
1.2
1.9 3.5
1260 2.95
2.8
1.05
1.75 3.4 1320 2.8
2.65
0.9
1.7 3.2
1380 2.7
2.5
0.7
1.6 3.2 1440 2.5
2.4
0.6
1.45 3.1
1500 2.3
2.2
0.4
1.3 2.9 1560 2.1
2.1
0.25
1.2 2.7
1620 1.95
1.9
0.2
1.1 2.6 1680 1.8
1.7
0.1
0.85 2.5
1740 1.55
1.6
0
0.75 2.4 1800 1.4 1.4 0.7 2.2 1860 1.3
1.2
0.5 2
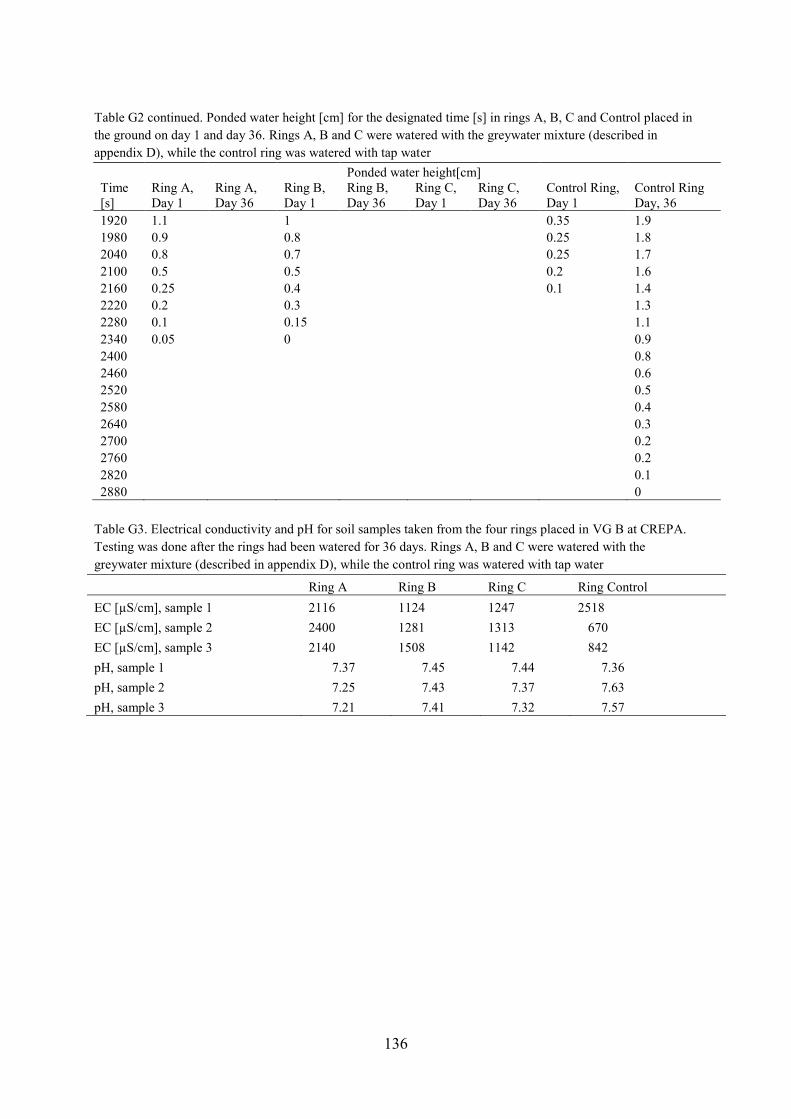
136
Table G2 continued. Ponded water height [cm] for the designated time [s] in rings A, B, C and Control placed in the ground on day 1 and day 36. Rings A, B and C were watered with the greywater mixture (described in appendix D), while the control ring was watered with tap water Ponded water height[cm] Time [s]
Ring A, Day 1
Ring A, Day 36
Ring B, Day 1
Ring B, Day 36
Ring C, Day 1
Ring C, Day 36
Control Ring, Day 1
Control Ring Day, 36
1920 1.1
1
0.35 1.9 1980 0.9
0.8
0.25 1.8
2040 0.8
0.7
0.25 1.7 2100 0.5
0.5
0.2 1.6
2160 0.25
0.4
0.1 1.4 2220 0.2
0.3
1.3
2280 0.1
0.15
1.1 2340 0.05
0
0.9
2400
0.8 2460
0.6
2520
0.5 2580
0.4
2640
0.3 2700
0.2
2760
0.2 2820
0.1
2880 0 Table G3. Electrical conductivity and pH for soil samples taken from the four rings placed in VG B at CREPA. Testing was done after the rings had been watered for 36 days. Rings A, B and C were watered with the greywater mixture (described in appendix D), while the control ring was watered with tap water
Ring A Ring B Ring C Ring Control EC [µS/cm], sample 1 2116 1124 1247 2518 EC [µS/cm], sample 2 2400 1281 1313 670 EC [µS/cm], sample 3 2140 1508 1142 842 pH, sample 1 7.37 7.45 7.44 7.36 pH, sample 2 7.25 7.43 7.37 7.63 pH, sample 3 7.21 7.41 7.32 7.57