energy generation with greywater reuse...
TRANSCRIPT

Energy Generation with Greywater Reuse Systems:The Case of Organ Pipe Cactus National Monument
Item Type text; Electronic Thesis
Authors Corron, Ashley
Publisher The University of Arizona.
Rights Copyright © is held by the author. Digital access to this materialis made possible by the University Libraries, University of Arizona.Further transmission, reproduction or presentation (such aspublic display or performance) of protected items is prohibitedexcept with permission of the author.
Download date 15/06/2018 02:35:19
Link to Item http://hdl.handle.net/10150/622898

1
ENERGY GENERATION WITH GREYWATER REUSE SYSTEMS: THE CASE OF ORGAN PIPE CACTUS NATIONAL MONUMENT
by
Ashley Corron
Copyright © Ashley Corron 2016
A Thesis Submitted to the Faculty of the
SCHOOL OF ARCHITECTURE
In Partial Fulfillment of the Requirements
For the Degree of
MASTER OF SCIENCE
In the Graduate College
THE UNIVERSITY OF ARIZONA
2016

2
STATEMENT BY AUTHOR
The thesis titles Energy Generation with Greywater Reuse Systems: The Case of Organ
Pipe Cactus National Monument. Prepared by Ashley Corron has been submitted in
partial fulfillment of requirements for a master’s degree at the University of Arizona
and is deposited in the University Library to be made available to borrowers under the
rules of the Library.
Brief quotations from the thesis are allowed without special permission provided
that an accurate acknowledgment of the source is made. Requests for permission for
extended quotation from or reproduction of this manuscript in whole or in part may be
granted by the head of the major department or the Dean of the Graduate College when
in his or her judgement the proposed use of the material is in the interest of the
scholarship. In all other instances, however, permission must be obtained from the
author.
SIGNED: Ashley Corron
APPROVAL BY THESIS DIRECTOR
This thesis has been approved on the date shown below.
12/07/16
Thesis Director Name: Nader Chalfoun Date
Professor of Architecture

3
Table of Contents
Abstract …………………………………………………………….…...6
Environmental Concerns………………………....6 (Ref. 2, 5, 10, 12, 16, 21, 23, 26, 27, 30)
Introduction……………………………………………………………….10 (Ref. 15)
Research……………………………………………………………….........11
Argonne National Laboratory…………………………………..….12 (Ref. 1, 4, 14)
Laurence Berkeley Research Lab…………………………………...13 (Ref. 19)
National Renewable Energy Lab………………………………...…14 (Ref. 3)
Oak Ridge National Laboratory…………………………………....15 (Ref. 17, 18)
Existing Technologies……………………………………………….17 (Ref. 24)
Harvesting Rainwater………………………………………….…...18 (Ref. 7)
Design Proposal…………………………………………………………19
Community Greywater Tank………………………………...20
Organ Pipe Cactus National Monument Scenario…..............21
Gathering Information………………………………………...22
Calculating Rainwater Harvesting…………………….…..23 (Ref. 7)
Calculating Greywater from Homes………………….......24 (Ref. 22)
Water Use………………………………………………………...25 (Ref. 22)
Estimating Greywater Tank Size…………………………..25 (Ref. 8)
Greywater Storage……………………………………………..26
Greywater Treatment…………………………………………27 (Ref. 6)
Choosing a Turbine……………………………………………29 (Ref. 11, 20, 25, 29)
Energy Generation……………………………………………………31 (Ref. 9, 13, 28, 32)
Conclusion……………………………………………………………....32

4
Illustrations and Tables
Figure 1: Diagram showing U.S. energy consumption by energy source…………………7
Figure 2: Diagram showing the carbon monoxide released By Sector…………………….7
Figure 3: Pollution from Energy Production…………………………………………………7
Figure 4: Photo from author showing pollution over Chicago…………………………….7
Figure 5: Pollution over Houston, Texas……………………………………………………..7
Figure 6: Pollution over Los Angeles, California……………………………………………7
Figure 7: Chart showing water consumption by power production technique…………..8
Figure 8: Diagrams of How Groundwater and Surface water is pumped………………...8
Figure 9: Map showing the depletion of the world’s groundwater………………………..9
Figure 10: Photos of Lake Mead being Drained by Omar Youssef………………………...9
Figure 11: Algae Blooms in Lake Erie……………………………………………………..…10
Figure 12: Animas River polluted by toxic heavy metals……………………………….....10
Figure 13: Diagram of keeping rainwater onsite by author……………………………….10
Figure 14: Diagram showing greywater reuse……………………………………………...11
Figure 15: Diagram showing the idea of saving water and producing energy………….11
Figure 16: Pictures of Argonne National Laboratory and Campus………………………12
Figure 17: Pictures of Laurence Berkeley Research Lab ……………………………………13
Figure 18: Picture of National Renewable Energy Campus……………………………….14
Figure 19: Picture of National Renewable Energy Lab Building………………………….15
Figure 20: Picture of Benkatina Turbine……………………………………………………..15
Figure 21: Picture of Oak Ridge National Campus………………………………………...15
Figure 22: Picture of Oak Ridge National Lab Building…………………………………...16
Figure 23: LucidPipe Water Turbine Diagram……………………………………………...17
Figure 24: The HighDro Power Sewer Turbine and Designer…………………………….17
Figure 25: The Solar Power and Pump Co. SunRotor brand solar water pump………...17
5
Figure 26: Diagrams by author showing rainwater harvesting techniques……………...18
Figure 27: Popular types of water tanks/cisterns…………………………………………..18
Figure 28: Diagram by author showing structure is needed to support water tanks…...19
Figure 29: Diagram by author showing single home design proposal…………………...19
Figure 30: Diagram by author showing community greywater tank proposal………….20
Figure 31: Maps showing location of Residential Loop in the National Monument…....21
Figure 32: Revit 3D view of the residential buildings……………………………………...22
Figure 33: Photo showing one of the houses that had a level 3 energy audit done……..22
Figure 34: Map showing the annual precipitation from 2014……………………………..23
Figure 35: Diagram from author showing how to take the roof footprint……………….23
Figure 36: Chart showing residential water use averages…………………………………24
Figure 37: Diagram showing indoor water usage by fixtures.…………………………….24
Figure 38: Chart showing Average Climate in Pima County, Arizona…………………..25
Figure 39: Picture of existing potable water tank……………………………………….…..25
Figure 40: Map of existing potable water tank and proposed water tank (in purple)….25
Figure 41: Plan of proposed greywater reuse system with energy generation………….26
Figure 42: Diagram of Sedimentation tank………………………………………………….27
Figure 43: Diagram of Sand filter…………………………………………………………….28
Figure 44: Diagram of Bioreactor…………………………………………………………….28
Figure 45: Diagram of UV disinfection unit…………………………………………………28
Figure 46: Chart showing general guidance for water flow capacity in steel pipes…….29
Figure 47: Chart for determining turbine type……………………………………………...29
Figure 48: Diagram showing how an Impulse turbine runs………………………………30
Figure 49: Picture of a Pelton turbine………………………………………………………..30
Figure 50: Chart showing the efficiency of a Pelton turbine………………………………30
Figure 51: Arial drone picture of existing residential loop………………………………...31

6
Abstract
At the rate the population is growing it is important to find ways to be more
efficient with the energy and water we use. The increase in population increases the
need for electricity and water, but the way we are using our sources will not leave us
with enough for future generations. The constant use of “dirty energy”, energy that
emits CO2 and other chemicals into the atmosphere, will continue to harm our
environment. A new system is needed to help preserve water and produce green
energy that will not harm the only earth we have.
Environmental Concerns
The world’s population has increased drastically over the past hundred years. In
the past 50 years the population has doubled. (coolgeography.co.uk-
PopulationGrowth). This growth will make the demand for resources rise dramatically.
The demand for energy is a major issue for the planet, as it contributes to global
warming.
The United States creates 90% of its electricity from fossil fuels, which sends
Carbon Monoxide into the air and traps solar radiation in our atmosphere. The building
sector is responsible for 46% of the energy use in the United States and 34% of this
carbon monoxide released into our atmosphere from energy use. Not only is carbon
monoxide being released, but so is methane, CFC’s (chlorofluorocarbon) and aerosols,
which are even more harmful to our atmosphere. This air pollution also causes health
problems, such as cardio-vascular disease, respiratory system health issues and even
death. 7million people died on earth in 2012 alone from air pollution. (Dotearth-
persistent-air-and-water-pollution-challenges)
It is important to use renewable resources to produce electricity to limit the
amount of air pollution and to make this earth a healthier place to live. It is vital to stop
using components that cause harm to our environment. Building more sustainably is a
great way to minimize the use of fossil fuels and other toxins that will pollute our
environment. The major environmental impact areas are energy use, water depletion,
and air and water pollution.

7
Figure 1: Diagram showing U.S. energy consumption by energy source
Figure 3: Pollution from Energy Production Figure 4: Photo from author showing
pollution over Chicago
Figure 5: Pollution over Houston, Texas
Figure 6: Pollution over Los Angeles
Figure 2: Diagram showing the carbon
monoxide released By Sector

8
Water is also a major resource that’s demand will increase outrageously, as it is a
necessity for life. It is important to know that water is used in the process of making
electricity. As the water nexus explains, water is energy and energy is water. To explain
farther water is needed to produce electricity and electricity is needed to provide water.
Although, it is not the quantity of water that should concern us, it is the quality. 71% of
the Earth’s surface is water and only 3% of it is fresh water. 2/3’s of that water is stuck
in glaciers. We are using this water inefficiently and are lowering our reservoirs and
aquifers at an extreme rate. The small amount of fresh water that we have left is
becoming contaminated by chemical leaching and algae blooms due to global warming.
“By 2025 at least 3.5 billion people—about half the world's population—will live
in areas without enough water for agriculture, industry, and human needs...
Worldwide,
water quality
conditions
appear to have
degraded in
almost all
regions with
intensive
agriculture and
in large urban
and industrial
areas.” —World
Resources
Institute,
October 2000
Figure 7: Chart showing
water consumption by
power production
technique.
Figure 8: Diagrams of
How Groundwater and
Surface water is pumped

9
Figure 9: Map showing the depletion of the world’s groundwater
Figure 10:
Photos of
Lake Mead
being Drained
by Omar
Youssef

10
Figure 11: Algae Blooms in Lake Erie Figure 12: Animas River polluted
by toxic heavy metals
Since the United States is one of the major counties with a large amount of
groundwater and reservoir depletion, it will be the main focal point for this research.
The small percentage of the water left in America that can be used is furthermore
becoming unusable. A large percentage of the water we have left is getting polluted
with chemicals from leaching and algae growth from fertilizer run off. This makes the
water unsafe and useless. With demands for resources increasing, it is important to start
using the water left more efficiently.
Figure 13: Diagram of keeping rainwater onsite by author
11
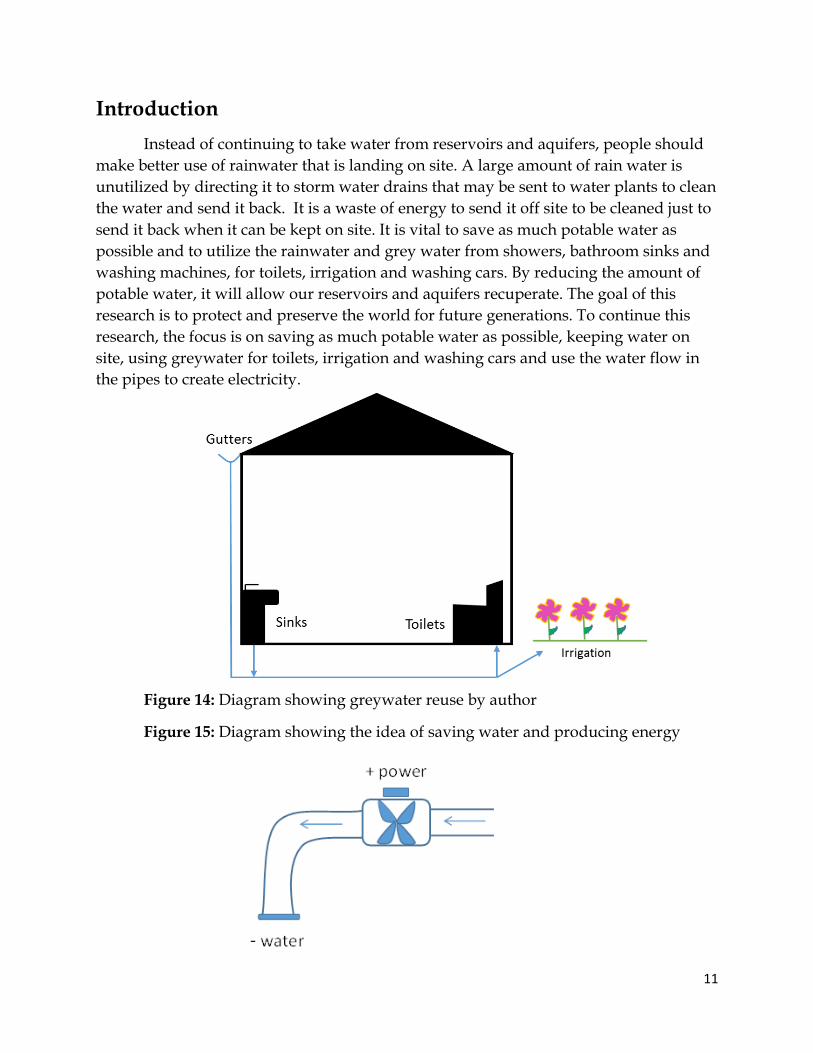
Introduction
Instead of continuing to take water from reservoirs and aquifers, people should
make better use of rainwater that is landing on site. A large amount of rain water is
unutilized by directing it to storm water drains that may be sent to water plants to clean
the water and send it back. It is a waste of energy to send it off site to be cleaned just to
send it back when it can be kept on site. It is vital to save as much potable water as
possible and to utilize the rainwater and grey water from showers, bathroom sinks and
washing machines, for toilets, irrigation and washing cars. By reducing the amount of
potable water, it will allow our reservoirs and aquifers recuperate. The goal of this
research is to protect and preserve the world for future generations. To continue this
research, the focus is on saving as much potable water as possible, keeping water on
site, using greywater for toilets, irrigation and washing cars and use the water flow in
the pipes to create electricity.
Figure 14: Diagram showing greywater reuse by author
Figure 15: Diagram showing the idea of saving water and producing energy

12
Research
The research begins with four research labs in the United States, Argonne National
Laboratory, Laurence Berkeley Research Lab, NREL- National Renewable Energy Lab
and ORNL- Oak Ridge National Lab. The research will look into whole building
systems and micro-water turbine applications.
Argonne National Laboratory
Figure 16: Pictures of Argonne National Laboratory and Campus
“Argonne’s world-renowned scientists and engineers conduct pioneering research to
take on the nation’s greatest environmental challenges” U.S. Department of Energy. It is
located in Argonne, IL and recently built a new energy science building.
Related Program
Energy
• Batteries and Energy Storage
• Energy Systems Modeling
• Materials for Energy
• Nuclear Energy
• Renewable Energy
• Smart Grid
• Transformational Manufacturing
• Transportation
Renewable Energy
• Hydropower
• Solar Energy
• Wind Power
• Geothermal Power
13
Hydropower
Variables:
• Volume of water
• Elevation of water storage
• Duration of release
• Pipe size
• Turbine size
• Flow rate
• Watts/hr
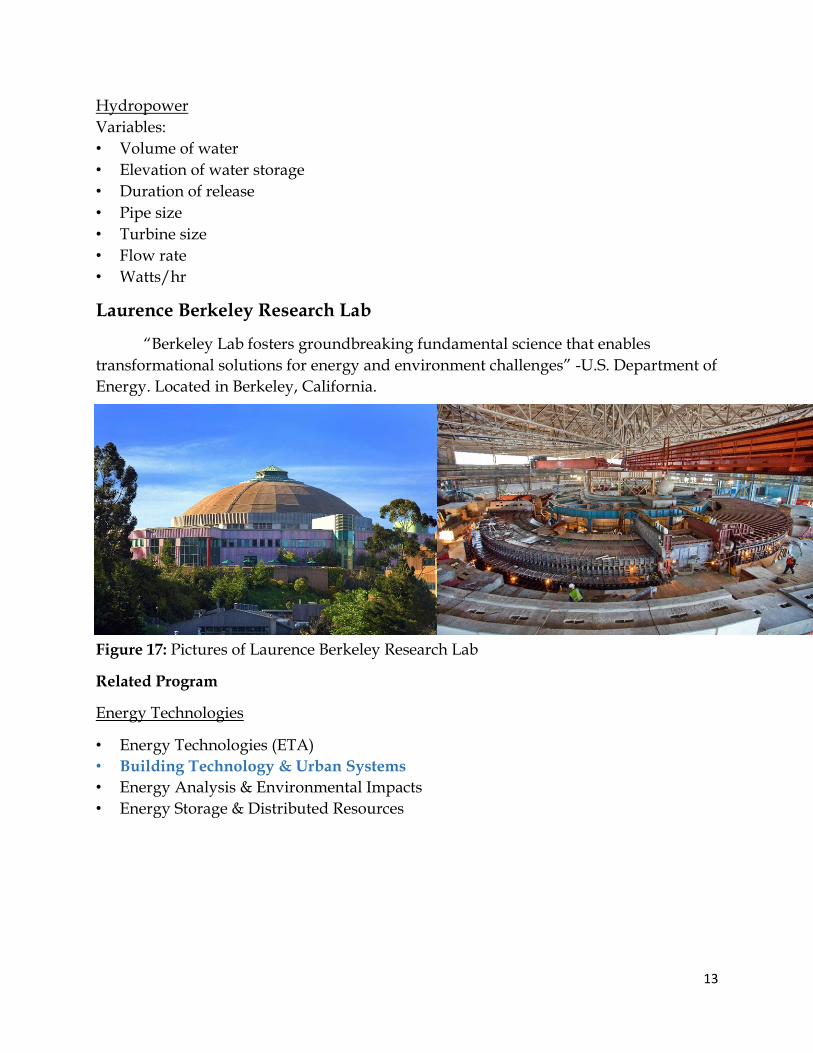
Laurence Berkeley Research Lab
“Berkeley Lab fosters groundbreaking fundamental science that enables
transformational solutions for energy and environment challenges” -U.S. Department of
Energy. Located in Berkeley, California.
Figure 17: Pictures of Laurence Berkeley Research Lab
Related Program
Energy Technologies
• Energy Technologies (ETA)
• Building Technology & Urban Systems
• Energy Analysis & Environmental Impacts
• Energy Storage & Distributed Resources
14
Building Technology & Urban Systems
• Commercial Building Systems
• Electronics, Lighting, and Networks
• High Tech and Industrial Systems
• Residential Building Systems
• Simulation Research
• Sustainable Federal Operations
• Window and Envelope Materials
Residential Building Systems
• Promoting whole building system integration
• Looks at ways to minimize energy use and improve efficiency through HVAC system
Organizational behavior
Indoor air quality
Retrofits and Whole House Energy
Ventilation and Infiltration
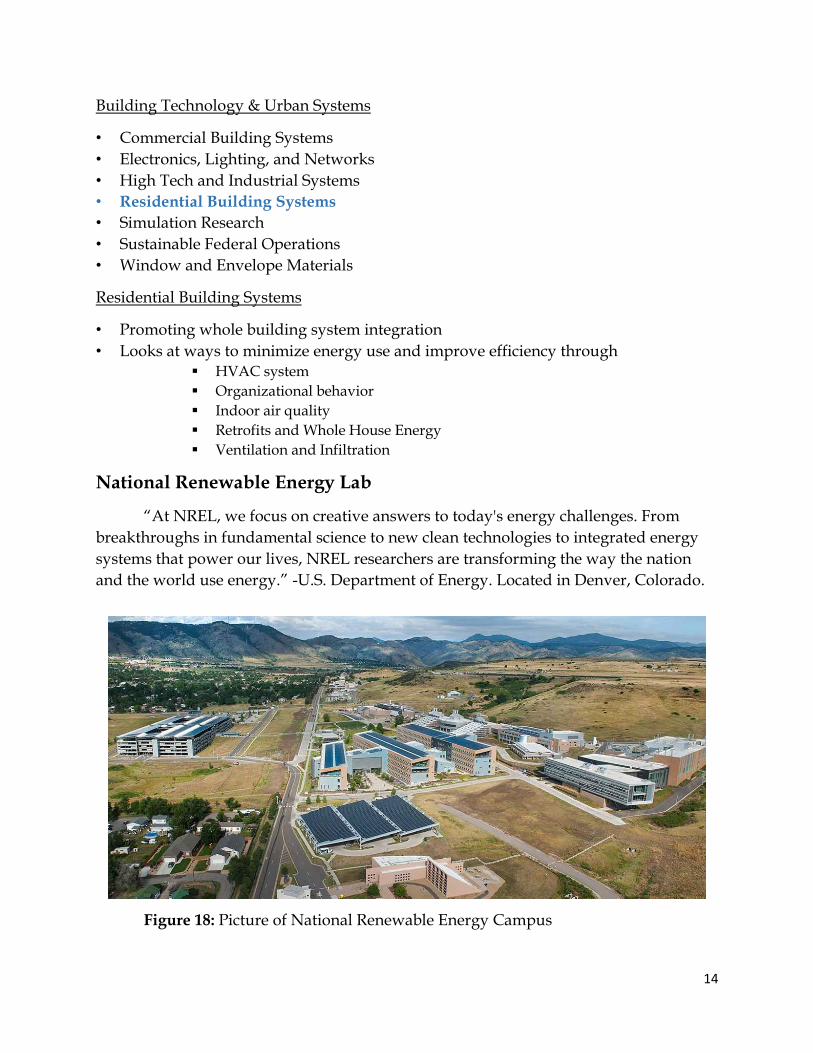
National Renewable Energy Lab
“At NREL, we focus on creative answers to today's energy challenges. From
breakthroughs in fundamental science to new clean technologies to integrated energy
systems that power our lives, NREL researchers are transforming the way the nation
and the world use energy.” -U.S. Department of Energy. Located in Denver, Colorado.
Figure 18: Picture of National Renewable Energy Campus
15
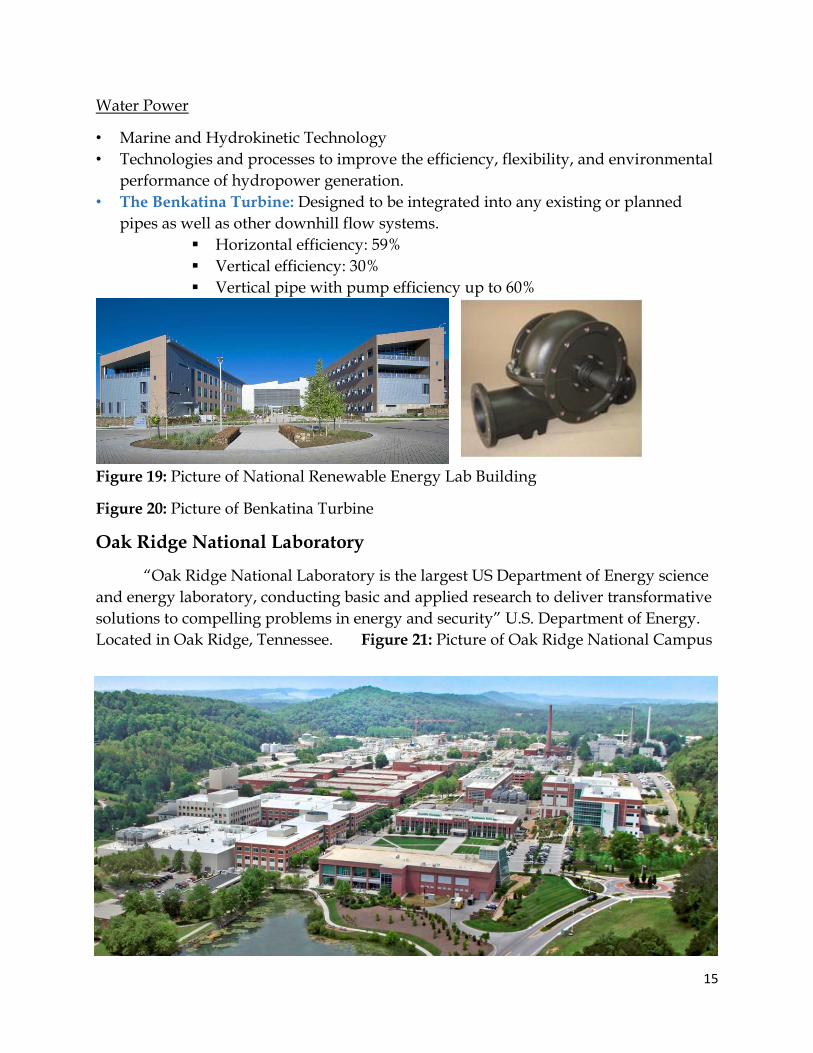
Water Power
• Marine and Hydrokinetic Technology
• Technologies and processes to improve the efficiency, flexibility, and environmental
performance of hydropower generation.
• The Benkatina Turbine: Designed to be integrated into any existing or planned
pipes as well as other downhill flow systems.
Horizontal efficiency: 59%
Vertical efficiency: 30%
Vertical pipe with pump efficiency up to 60%
Figure 19: Picture of National Renewable Energy Lab Building
Figure 20: Picture of Benkatina Turbine
Oak Ridge National Laboratory
“Oak Ridge National Laboratory is the largest US Department of Energy science
and energy laboratory, conducting basic and applied research to deliver transformative
solutions to compelling problems in energy and security” U.S. Department of Energy.
Located in Oak Ridge, Tennessee. Figure 21: Picture of Oak Ridge National Campus

16
Figure 22: Picture of
Oak Ridge National
Lab Building
Related Program
Advanced Materials
Clean Energy
National Security
Neutron Science
Nuclear Science
Supercomputing
Clean Energy
• Reducing Fossil Energy
• Transportation
• Buildings
• Energy Efficient Refrigerators
• System Biology
• Climate and Environment
Buildings
Looking towards:
• Alternative Energy Sources
• Efficient Materials
• Energy Efficient Appliances

17
Existing Technology
Each lab had a great amount of information about energy and water efficiency,
but didn’t have any information about implementing micro water turbines. The
research continued with a focus on capturing rainwater, storage and distribution of
greywater and generating power from the greywater. There were other systems that
exist that can be utilized in the following proposal to help reduce potable water and
energy use. The LucidPipe power system is utilized in Portland, Oregon to produce
energy from the flow of the water in the city pipes. The lift-base turbine works very
efficiently and does not slow down the water flow in the pipes.
Figure 23: LucidPipe Water Turbine Diagram
The HighDro Power system is used on high rise building and produces energy
from the waste water that is traveling down the
pipes. It will save a building $1,410 a year in high
rise buildings.
Figure 24: The HighDro Power Sewer Turbine and
Designer
Figure 25: The Solar Power and Pump Co. SunRotor
brand solar water pump

18
Harvesting Rainwater
After finding existing technologies that could be used in a new system, more
detailed components needed to be researched. How to capture the rain water is the first
question. There are two ways: collecting water from the roofs through gutters and pipes
and from the hardscapes with gutters and rain gardens. This water is usually directed
towards sewers and storm water drains. This water can easy be redirected to cisterns.
Although a large amount of water that can be collected from hardscapes, there are
concerns about chemicals from cars getting into the greywater that will be used. The
proposal will only be dealing with rainwater captured from the roofs of houses.
Figure 26: Diagrams by author showing rainwater harvesting techniques
The next question is what kind of cistern will be used to store the greywater. The
most common cisterns are vertical water cistern (top), underground cisterns (left) and
Cone bottom tanks (right). Vertical water cisterns are set on the ground outside, which
allows for easy maintenance. Underground Cisterns are great for keeping the water a
more consistent temperature and less likely to freeze, but is difficult for maintenance.
Cone-Bottom tanks are made to be placed on roofs or structures to allow gravity to
pressurize the water. When using cisterns that will be stored on the roof, it is important
to know how much water weighs. If you have a large cistern that needs to be stored on
the roof, you need to know if the building is structurally sound. As water gets warmer
it becomes less dense and
starts to weigh slightly
less. At 39.2 ͦF water
weighs 8.36lbs per gallon
and at 62 ͦF water weighs
8.34lbs per gallon.
Figure 27: Popular types
of water tanks/cisterns

19
Figure 28: Diagram by author showing structure is needed to support water tanks
Design Proposal
The design proposal is to collect rain water from the roofs of the building and
greywater from bathroom sinks and showers, to be reused and limit the use of potable
water. This greywater can then be used to power the building by utilizing the water
flow to create electricity through micro-water-turbines. Although this is a great way to
reduce potable water use and provide green energy for building, the proposed system
on single buildings is not cost effective.
Figure 29: Diagram by author showing single home design proposal.
Structure
20
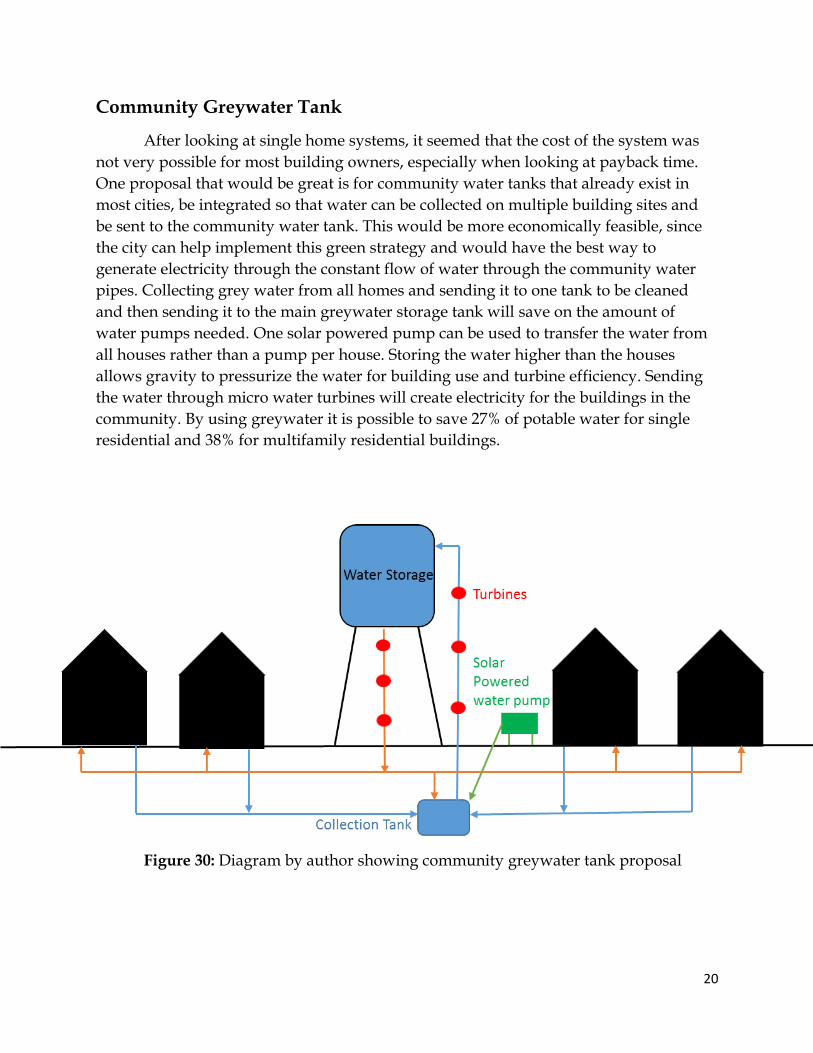
Community Greywater Tank
After looking at single home systems, it seemed that the cost of the system was
not very possible for most building owners, especially when looking at payback time.
One proposal that would be great is for community water tanks that already exist in
most cities, be integrated so that water can be collected on multiple building sites and
be sent to the community water tank. This would be more economically feasible, since
the city can help implement this green strategy and would have the best way to
generate electricity through the constant flow of water through the community water
pipes. Collecting grey water from all homes and sending it to one tank to be cleaned
and then sending it to the main greywater storage tank will save on the amount of
water pumps needed. One solar powered pump can be used to transfer the water from
all houses rather than a pump per house. Storing the water higher than the houses
allows gravity to pressurize the water for building use and turbine efficiency. Sending
the water through micro water turbines will create electricity for the buildings in the
community. By using greywater it is possible to save 27% of potable water for single
residential and 38% for multifamily residential buildings.
Figure 30: Diagram by author showing community greywater tank proposal

21
Organ Pipe Cactus National Monument Scenario
In order to test how well this system will work, the base case of Organ Pipe
Cactus Nation Monument will help decide whether or not this system will be practical.
The Organ Pipe Cactus National Monument is located in Pima County, on the boarder
of Arizona and Mexico.
There will be a focus on ten
houses located in the residential loop.
The ten houses use 77,576 kWh/yr.
Figure 31: Maps showing
location of Residential Loop in the
National Monument
1
2 3 4 5 6 7 8 9
10

22
Gathering Information for Scenario Figure 32: Revit 3D view of the
residential buildings
1. How much rain water can be captured
from homes?
2. How much greywater can be reused?
3. Where can the water be stored?
4. What type of turbine should be used?
5. How many turbines can be placed
along the system?
Figure 33: Photo showing one of the
houses that had a level 3 energy audit.

23
Calculating Rainwater Harvesting
The Eastern states get more precipitation throughout the year, so a smaller
square footage is needed to provide enough water for building use. It also doesn’t
require as big as a storage device either, since the rain falls in most of the seasons. In the
Western states more square footage is needed to catch enough water for building uses.
It also requires a larger storage device to hold water throughout the year, since rain fall
is mostly in one season and not spread across the year.
Figure 34: Map showing the annual precipitation from 2014
When sizing a water storage tank/cistern, this
equation should be used to calculate the amount of
water that can be collected from a given area.
Roof Footprint
Harvested water
(gal)
Catchment Area (𝑓𝑡2)
Rainfall Depth
(in)
0.623 Conversion
factor
= x x
Catchment Area
1,960 ft²
Rainfall Depth
10 in/yr
0.623 x x = 12,210.8 gal
x 10 houses = 122,108 gal/yr ÷ 12 months = 10,175.7 gal/m
Figure 35: Diagram from author
showing how to take the roof footprint

24
Calculating Greywater from Homes
The average four member household uses 400 gallons of water a day. 280 gallons
of that water are used indoors alone. By looking at how much water is used per fixture,
stated by EPA, the greywater collected from bathroom sinks, showers and washing
machines can be calculated. 135.8 gallons of water will be accumulated from one house
every day. Over 30 days, from all ten houses, 40,740 gallons of greywater will be
collected and 50,915.7 gallons including the rainwater that can be harvested.
Figure 36: Chart
showing
residential water
use averages
Figure 37:
Diagram showing
indoor water
usage by fixtures
Water Use
The grey water will be used for washing
toilets, irrigation and washing cars. It is
important to see if there will be enough water
for these uses. Toilets use 56 gallons per day per
household, Irrigation uses 96 gallons of water
per day per household and washing cars uses 30
gallons per car when using a house with a turn
off nozzle. Assuming they will wash their cars
once a month, all ten houses would use 45,900
gallons every month. This system allows for an
extra 5,015.7 gallons of water that can be used
for maintaining roads, flushing out sewage
pipelines and more.
Indoor Water Usage
(EPA-US)
Toilet: 26.7%Clothes Washer: 21.7%Shower: 16.8%Faucet: 15.7%Leaks: 13.7%

25
Estimating Greywater Tank Size
When sizing a greywater tank it is important to use the worst case scenario. By
looking at the average climate of Pima County, there are 3 months were the county
barely gets any rain. Extra storage is needed to collect more water for the months that
rain might not occur. Comparing the water used from toilets and irrigation and
comparing it to the water collected from fixtures, you find that 4,860 gallons are used
more than collected. Over the three months 14,580 gallons are need. Then add two more
months’ worth of water used more than collected to insure enough water is stored for
drought. Figure 38: Chart showing Average Climate in Pima County, Arizona
Grey Water Storage
The existing potable water tank
for the Organ Pipe Cactus
National Monument holds about
12,860 gallons. The tank sits at
1,886 feet above sea level, while
the houses sit at 1,680 feet above
sea level. This gives the system a
206 ft head. This is important to
know when calculating the
pressure in the system and will
create a stronger flow of water
that will pass through the
turbines. Figure 40: Map of existing
potable water tank and proposed water tank (in purple)
Figure 39: Picture of existing
potable water tank.
Average Climate of Pima County
Proposed Grey Water Tank
Existing Potable water Tank
Proposed Greywater Tank
Existing Potable water Tank

26
After estimating the storage needed for the greywater, it can be said that two
tanks, the same size as the existing potable water tank, can be used to effectively store
enough water for the ten houses. The two tanks should be stacked on top of each other
to reduce the footprint being scarred. The two tanks would hold about 25,720 gallons of
water, which is 1,420 gallons more that estimated.
Figure 41: Plan of proposed greywater reuse system with energy generation
Power lines back to grid
Turbines

27
Greywater Treatment
The greywater collected from each house will drain downhill towards the leach
field, so no pumps are needed, where the water will be treated and the sludge and
particles will be emptied right into the leach field (shown in red). The greywater needs
to go through a level of treatment so that it can be stored in a water tank for further use.
Treatment is to improve the quality of water by filter, treating or disinfecting it. The
higher the quality of water the more uses it can be used for. Since the water would be
returning to the inside of homes for flushing toilets, the maximum treatment needs to
be done to meet local regulations. Water from kitchen sinks and dish washers require
chemical treatment to kill food bacteria, which is why these sources of water will not be
used. The treatment technologies needed for the greywater being used are
sedimentation tank, sand filter, bioreactor and a disinfection unit. The sedimentation
tank is a “settling” tank that allows for heavier particles to fall to the bottom of the tank
and separate from the water. A scum skimmer may be implemented to get smaller
particles that will flat to the top. A sand filter catches suspended particles as the water
passes through the sand and gravel. Bioreactors are a semi-permeable membrane that
has a biological process that filters out suspended particles based on size and electric
charge. The last process is the disinfection unit, which can me UV or chemical based.
The UV will be used in this system, which is used to remove, deactivate or kill any
pathogenic microorganisms in order to terminate the growth and reproduction. After
the water is treated it can then be pumped up to the water tank using a solar powered
water pump (shown in blue).
Figure 42: Diagram of Sedimentation tank

28
Figure 43: Diagram of Sand filter
Figure 44: Diagram of Bioreactor
Figure 45: Diagram of UV disinfection unit
29
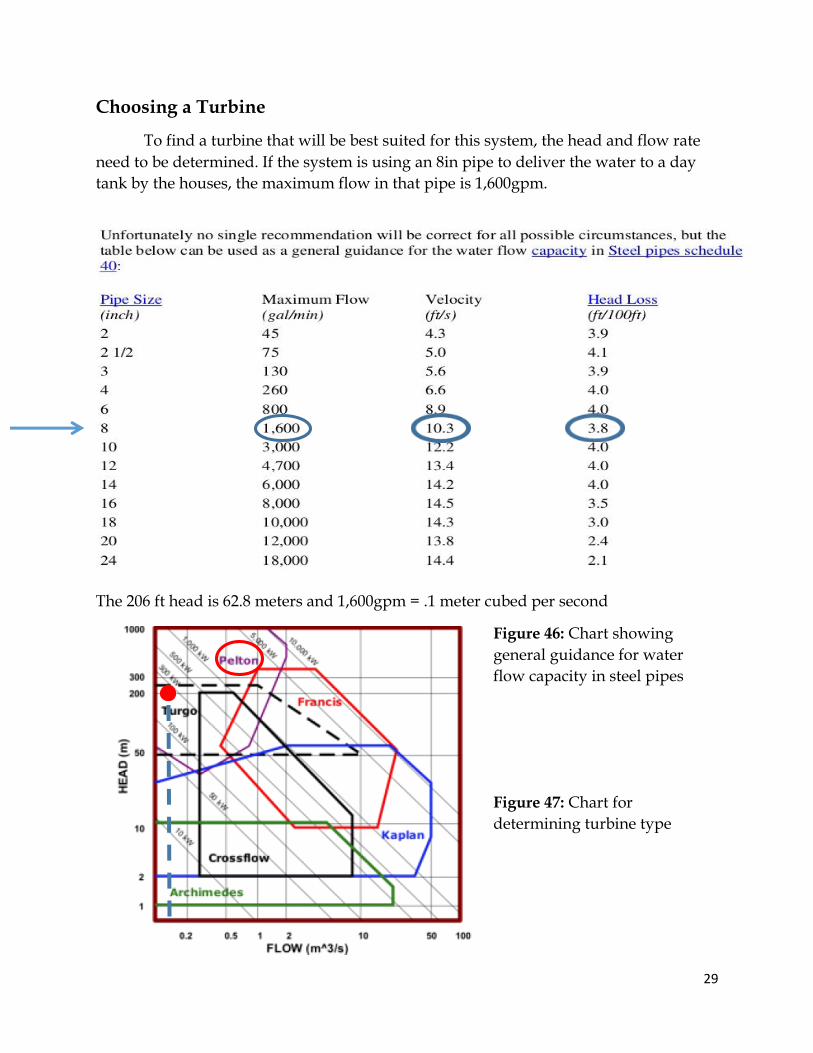
Choosing a Turbine
To find a turbine that will be best suited for this system, the head and flow rate
need to be determined. If the system is using an 8in pipe to deliver the water to a day
tank by the houses, the maximum flow in that pipe is 1,600gpm.
The 206 ft head is 62.8 meters and 1,600gpm = .1 meter cubed per second
Figure 46: Chart showing
general guidance for water
flow capacity in steel pipes
Figure 47: Chart for
determining turbine type

30
The impulse turbine is the best type
of turbine to use for the high head system.
An impulse turbine takes the total head of
incoming fluid and coverts it into a large
velocity head and sprays into buckets or
blades. Of the impulse turbines the Pelton
turbine is the most efficient over a variety
of flows. The turbine works best with a
small flow rate. Since the flow rate is rather
low the pipework can be relatively small
and makes the system less expensive and
easier to install than an equally powered
Kaplan turbine. The efficiency of the Pelton
turbine grows quickly and stays the same
efficiency as the flow increases. The
efficiency of the turbine is how well the
turbine produces electricity from the torque
of the buckets rotation. The buckets in the
Pelton turbine are able to get the best
torque from the water nozzle since it is
able to capture the full momentum of all
the water. On a “micro” scale system
Pelton turbines maintain a high efficiency
of around 80% and 90% at its peak.
Figure 48:
Diagram
showing how
an Impulse
turbine runs
Figure 49: Picture of a Pelton turbine
Figure 50: Chart showing the efficiency of
a Pelton turbine. Efficiency is the vertical
axis and flow rate is the horizontal axis.

31
Energy Generation
The energy generation from a single jet Pelton turbine on a 8 inch pipe line can
be determine by the head of the system multiplied by the water flow divided by the
system factor of the turbine. The system turbine is determined by a range from 9 – 13, 9
being a large AC (alternating Circuit) system and 13 is for a small battery-based turbine.
This system uses a medium size turbine for a system factor of 11. It is important to
include the head loss from friction in the system before finding the energy generation.
198.4 head (after head reduction) x 1,600gpm ÷ 11 = 28,858 Wh = 28.85 kWh
Each turbine can produce 28.85 kWh. In 30 days one turbine can produce 865.5
kWh. There will be 6 turbines placed along the steepest part of the pipeline to insure
water pressure(shown in pink). Over the length of a year this system can produce
62,316 kWh, while the homes use 77,576 kwh/yr. This system allows 80% of the energy
used to be from a green energy source and will limit the amount of CO2 that will be
emitted into the atmosphere. This system also saves 610,988.4 gallons of potable water
every year.
The cost of electricity is 11.78 cents/kWh and the cost of water is $2.88/ 1,000 gal.
After adding up how much water and energy this system can save it is possible to
figure out how much money can be saved every year. This system saves $7,340.82/yr
from energy savings and $1,759.65 from water savings, a total of $9,100.47 every year.
Cost estimates to build system:
Water Tank Price: $10,000/tank
Turbine Price: $10,000/set
Greywater Treatment System: $25,000
Greywater System for Homes: $15,000
Piping down to treatment and up to storage: $6,000
Yearly Maintenance: $1,000
Estimated Total Cost of System: $126,000
Payback Time: 15 years.

32
Conclusion:
This payback time may seem like a long time, but this monument will be there
for hundreds of years to come. The amount of environmental impact that this system
can have over a long amount of time will be colossal. If more communities would use
energy generation turbines within a greywater reuse system, it will have an outstanding
positive effect for the environment we need to survive. This case is a great way to
inspire others to implement a similar system in order to help improve the Earth’s
conditions from its atmosphere down to its aquifers.
Figure 51: Arial drone picture of existing residential loop

33
References
1. "2013 CEREL Annual Energy Innovation Conference." National Council for
Science and the Environment. Argonne National Laboratory, 2013. Web. 16 Feb.
2016.
2. Abbey-Lambertz, Kate. "These Disturbing Photos Show Why Algae Blooms Are
A Growing Global Water Threat." The Huffington Post. N.p., 7 Aug. 2014. Web.
10 Feb. 2016.
3. . "About NREL." National Renewable Energy Laboratory. US Department of
Energy, 2015. Web. 19 Feb. 2016.
4. "Argonne National Laboratory." Environment | Argonne National Laboratory.
US Department of Energy, n.d. Web. 19 Feb. 2016.
5. Barboza, Tony. "1 in 8 Deaths Linked to Air Pollution, World Health
Organization Says." Los Angeles Times. N.p., 25 Mar. 2014. Web. 16 Apr. 2016.
6. Barnes, Chris. "Making the Most of Used Water." A Guide to Greywater Systems.
Choice, 27 Aug. 2014. Web. 16 Dec. 2016.
7. "Catchment Area." Rainwater Harvesting. AgriLife Extension, n.d. Web. 25 Sept.
2016.
8. "Climate- Tucson, Arizona." U.S. Climate Data. World Climate, 2016. Web. 10
Nov. 2016.
9. "Current Specific Water & Sewer Rate Charges." Water Services Water and Sewer
Rates and Charges. City of Phoenix, 1 Mar. 2016. Web. 1 Dec. 2016.
10. Dell, Jan. "CH2M HILL Seeking Energy/Water Balance | Livebetter Magazine."
Livebetter Magazine. Energy and Water Division, 29 June 2011. Web. 16 Feb. 2016.
11. Gardner, Ken, and Ian Woofenden. "Hydro-Electric Turbine Buyer's Guide."
Home Power Magazine. Home Power Inc, Apr.-May 2010. Web. 16 Nov. 2016.
12. Hom, Melissa. "Renewable Energy in the Presidential Race." Enviropolitics. N.p.,
9 Nov. 2015. Web. 16 Apr. 2016.
13. "Hydropower Equation." Home Power Magazine. Home Power Inc, 2016. Web.
10 Nov. 2016.
14. LaTrace, AJ. "Here Now, Argonne National Laboratory's New Science Building."
Curbed Chicago. N.p., 11 Mar. 2014. Web. 24 Mar. 2016.
15. Ludwig, Art. "Water Storage." Water Central. Oasis Design, 2015. Web. 16 Mar.
2016.
16. McCarty, Meghan. "Good: SoCal's Air Is Better. Bad: It's Still the Worst in the
US." Southern California Public Radio. KPCC, 20 Apr. 2016. Web. 10 Feb. 2016.
17. Oak Ridge National Laboratory | ORNL. US Department of Energy, 2015. Web.
16 Feb. 2016.
18. "Oakland - East Bay Chapter NPSS." Nuclear & Plasma Sciences Society. Ed. Paul
Banchero. IEEE, 14 May 2014. Web. 16 Feb. 2016.

34
19. "Our Vision." Berkeley Lab. N.p., 28 Mar. 2016. Web. 16 Feb. 2016.
20. "Pelton and Turgo Turbines." The Hydro and Wind Company. Renewables First,
2015. Web. 20 Oct. 2016.
21. Perlman, Howard. "How Much Water Is There On, In, and above the Earth?" The
USGS Water Science School. USGS, 2 Dec. 2016. Web. 10 Mar. 2016.
22. "Residential Water Use." MAP AZ Dashboard. The University of Arizona, 17
Aug. 2016. Web. 12 Oct. 2016.
23. Revkin, Andrew C. "Updates on America's Persistent Air and Water Pollution
Challenges." Dot Earth. The New York Times, 25 Oct. 2013. Web. 10 Feb. 2016.
24. Schwartz, Rafi. "Portland Now Generates Electricity From Turbines Installed In
City Water Pipes." GOOD Magazine. Worldwide Inc, 24 Feb. 2015. Web. 10 Apr.
2016.
25. Singh, Ankit. "Hydraulic Turbine." Slide Share. Linked Corporation, 9 Sept. 2014.
Web. 20 Oct. 2016.
26. Tan, Avianne. "Navajo Nation Mourning, Pleading for Help After Toxic Mine
Spill Contaminates Rivers." RED POWER MEDIA. Word Press, 6 Dec. 2014. Web.
16 Dec. 2016.
27. "This Map Shows How Fast the World Is Depleting Irreplaceable Groundwater
Reserves." TakePart. Ed. Woody, Todd. N.p., 4 Nov. 2014. Web. 20 April. 2016.
28. "Tucson, AZ Electricity Rates." Electricity Local. N.p., 2016. Web. 1 Dec. 2016
29. "Types of Turbines." GreenBug Energy. Amundsen Davis Marketing, 20 May
2016. Web. 20 Oct. 2016.
30. Walsh, Bryan. "Water: Lake Mead Is at Record Low Levels. Is the Southwest
Drying Up? | TIME.com." Time. Ecocentric, 18 Oct. 2010. Web. Apr. 2016.
31. "Water Conservation and Washing Vehicles." Maryland. The Department of the
Environment, n.d. Web. 14 Oct. 2016.
32. "Water Consumption Fees." City of Tempe, AZ. Vision Internet, 2016. Web. 1
Dec. 2016.
33. Worland, Justin. "The Strange Cause of Air Pollution Decline in the Middle East."
Time. N.p., 21 Aug. 2015. Web. 20 April. 2016.
34. Yu, Zita L.t., J.r. Deshazo, Michael K. Stenstrom, and Yoram Cohen. "Cost-Benefit
Analysis of Onsite Residential Graywater Recycling--A Case Study: The City of
Los Angeles." Journal - American Water Works Association 107 (2015): n. pag.
Web.