green week 2012 - europa
TRANSCRIPT

Green Week 2012 4.3 « Seting targets for efficient and sustainable water use »
Definition and implementation of scenarios and targets for Sustainable Water Resource Management at River Basin Scale
by
Joaquin Andreu (Universitat Politecnica de Valencia – Spain) [email protected]

SUSTAINABILITY CONCEPT(S) -General concept: A sustainable society is a society that “meets the needs of the present generation without compromising the ability of future generations to meet their own needs, in which each human being has the opportunity to develop itself in freedom, within a well-balanced society and in harmony with its surroundings” (UN 1987).
-Simple concept: “Improving the quality of life of humans while living within the carrying capacity of supporting ecosystems” (Van de Kerk and Manuel 2008;IUCN, UNEP and WWF 1991).
-Sust. Water Resources Systems: “those systems designed and
-managed to contribute fully to the objectives of society, now and in the future, while maintaining their ecological, environmental and hydrological integrity.” (Loucks, 1997).
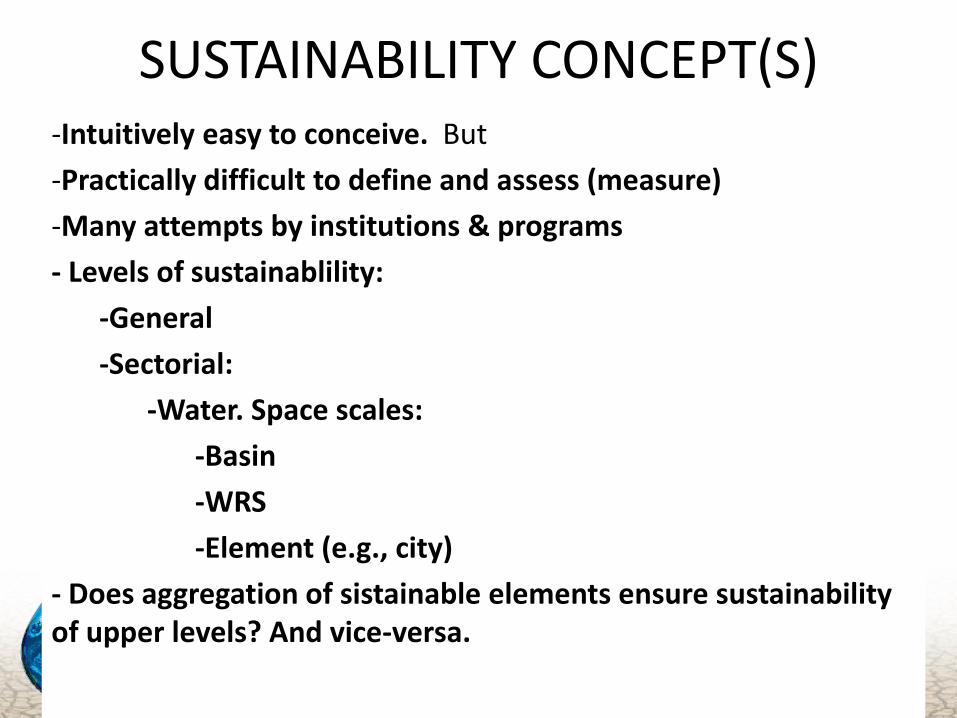
SUSTAINABILITY CONCEPT(S) -Intuitively easy to conceive. But
-Practically difficult to define and assess (measure)
-Many attempts by institutions & programs
- Levels of sustainablility:
-General
-Sectorial:
-Water. Space scales:
-Basin
-WRS
-Element (e.g., city)
- Does aggregation of sistainable elements ensure sustainability of upper levels? And vice-versa.

INDICATORS OF SUSTAINABLE DEVELOPMENT: GUIDELINES AND
METHODOLOGIES (CSD, 1995): social, environmental, economic and
ionstitutional indicators, among them:

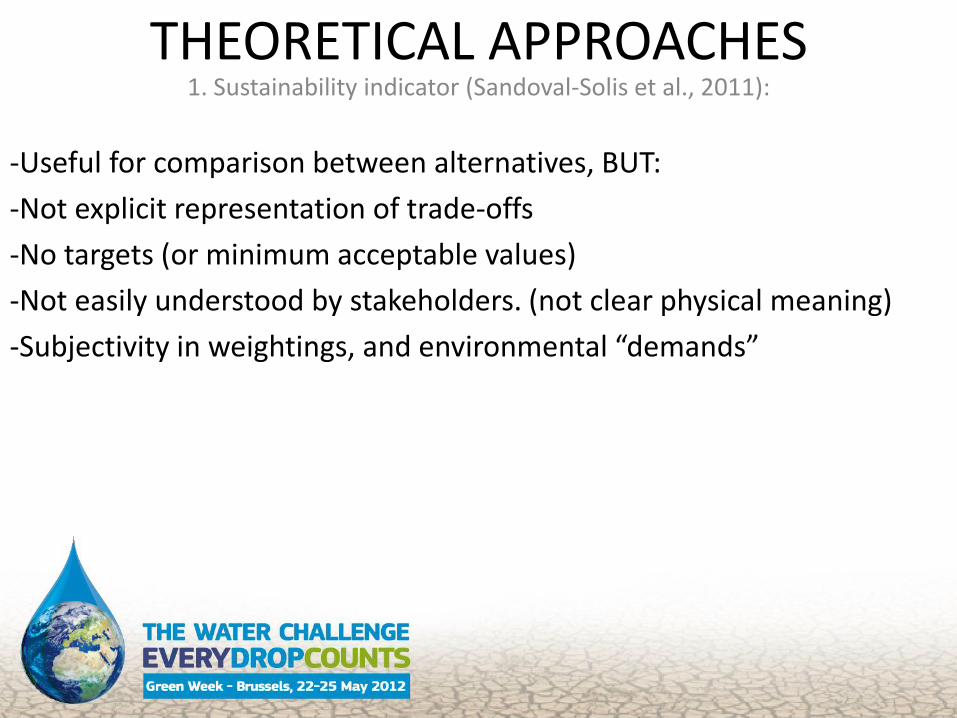
THEORETICAL APPROACHES 1. Sustainability indicator (Sandoval-Solis et al., 2011):
-From probabilistic performance criteria (e.g., reliability, resilience, vulnerability, max. Deficit, …)
-Define Sustainability Index as:

THEORETICAL APPROACHES 1. Sustainability indicator (Sandoval-Solis et al., 2011):
-SI for: user, environment, group, ¿why not basin?
-Compute SI for future scenarios using models (WEAP) in Rio Grande:
THEORETICAL APPROACHES 1. Sustainability indicator (Sandoval-Solis et al., 2011):
-Useful for comparison between alternatives, BUT:
-Not explicit representation of trade-offs
-No targets (or minimum acceptable values)
-Not easily understood by stakeholders. (not clear physical meaning)
-Subjectivity in weightings, and environmental “demands”

THEORETICAL APPROACHES 2. Sustainability of Urban Water Cycle (van Leeuwen et al., 2012):
-Propose 24 indicators grouped in Water Security, Water Quality, Drinking water, Sanitation, Infrastructures, Climate Robustness, Biodiversity, and Governance
-Results are shown for a given situation:
-Very intuitive picture
-Might be easy to obtain for cities, but not so for basins or WR Systems.
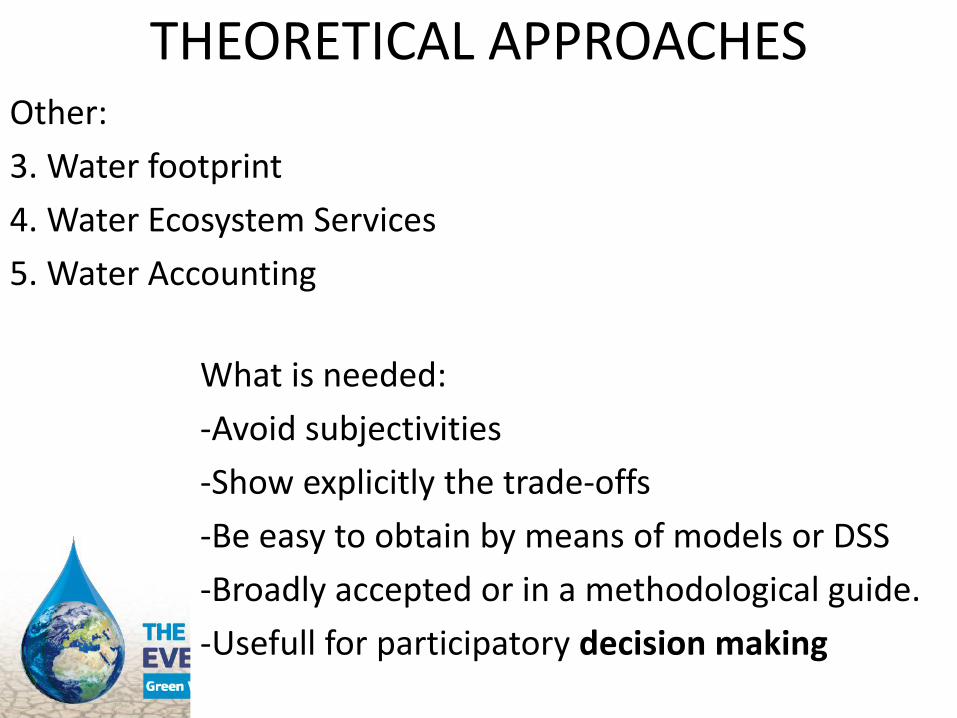
THEORETICAL APPROACHES Other:
3. Water footprint
4. Water Ecosystem Services
5. Water Accounting
What is needed:
-Avoid subjectivities
-Show explicitly the trade-offs
-Be easy to obtain by means of models or DSS
-Broadly accepted or in a methodological guide.
-Usefull for participatory decision making

PRACTICAL EXAMPLES (SPANISH BASINS)
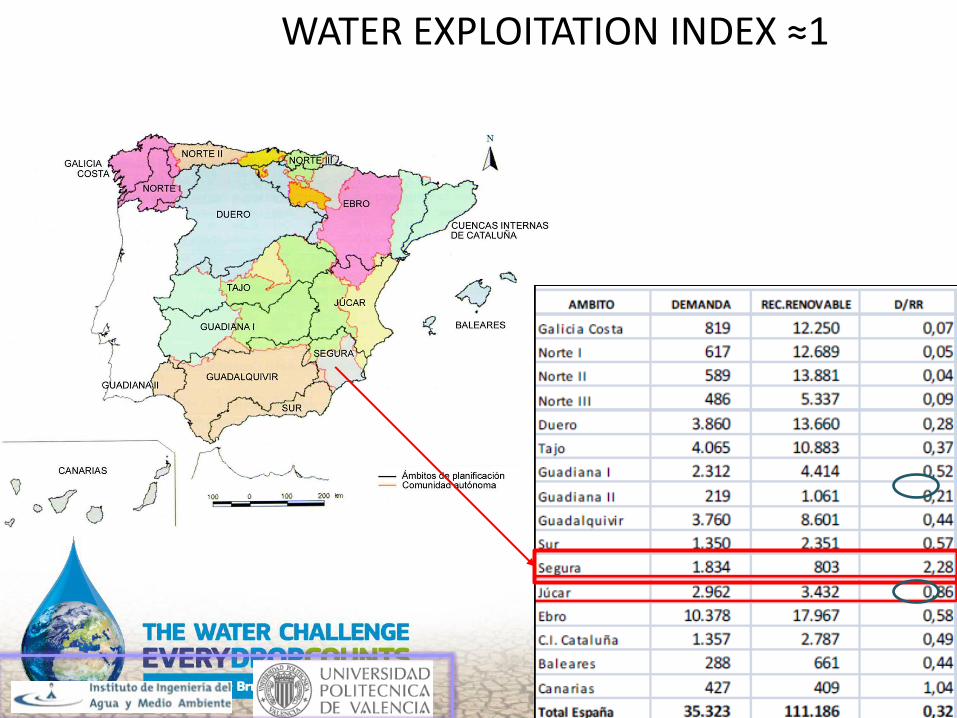
WATER EXPLOITATION INDEX ≈1

12
Source: Libro Blanco del Agua (MIMA, 1998)
Aquifer over-exploitation / Spain
Pumping/recharge ratio in
hydrogeological units

EUROPEAN WATER
FRAMEWORK
DIRECTIVE (WFD)
Article 5:
Environmental
Analysis
Surface water bodies in risk
Groundwater bodies in risk

• PERFORMANCE CRITERIA RELATED TO DEMAND SATISFACTION
• Impossible to satisty 100% demand 100% of time
• Concept of FAILURE

• Failure: When supply < demand
– Intensity, duration, magnitude
• Reliability: Probability of satisfactory supply (not in failure).
• Risk es la probability of faiulre.
• Resiliency: Average probability of system recovering when in failure. (Related to the inverse of time to get back to satisfaction situation after a failure).
• Vulnerability: Expected value of the deficits (or of the costs associated) (average deficit or average cost).
VARIABLES RELATED TO FAILURE
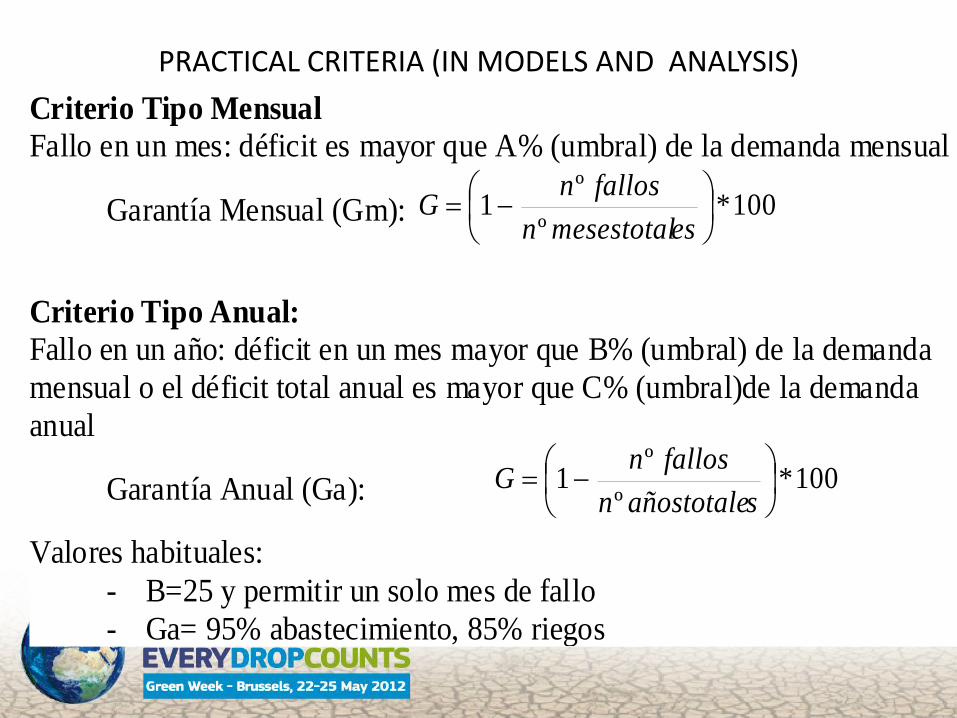
PRACTICAL CRITERIA (IN MODELS AND ANALYSIS)
Criterio Tipo Mensual
Fallo en un mes: déficit es mayor que A% (umbral) de la demanda mensual
Garantía Mensual (Gm): 100*º
º1 ÷
ø
öçè
æ-=
esmesestotaln
fallosnG
Criterio Tipo Anual:
Fallo en un año: déficit en un mes mayor que B% (umbral) de la demanda
mensual o el déficit total anual es mayor que C% (umbral)de la demanda
anual
Garantía Anual (Ga): 100*º
º1 ÷
ø
öçè
æ-=
sañostotalen
fallosnG
Valores habituales:
- B=25 y permitir un solo mes de fallo
- Ga= 95% abastecimiento, 85% riegos

• The reliability criteria based on failure frequency does not allow to capture:
– Magnitude of the failures (e.g., catastrophic)
– Duration of failure
• Criteria based on the deficit that can be assumed for given time periods.
PRACTICAL CRITERIA (IN MODELS AND ANALYSIS)

• Deficit indexes:
– Max. Monthly def.
– Máx. def. in two consecutive months
– Probability (or frequency) estimation for different magnitudesof deficit (pdf of deficits).
PRACTICAL CRITERIA (IN MODELS AND ANALYSIS)

Spanish IPH-2008
-Methodological guide for sustainable
integrated WRS `planning & management
-Each element (water body, demand, …) must
be sustainable
-The whole WRS must be sustainable
-Sets targets for performance criteria
-Sets procedures for obtaining trade-offs
between objectives
-Sets participatory processes
PRACTICAL CRITERIA (IN MODELS AND ANALYSIS)

Spanish IPH-2008
Urban demands:
DEF1month <= 10% DEM1month
DEF10years <= 8% DEMannual
Agric. demands:
DEF1year <= 50% DEMannual
DEF2years <= 75% DEMannual
DEF10years <= 100% DEMannual
PRACTICAL CRITERIA (IN MODELS AND ANALYSIS)

• FACTORS that AFFECT THE VALUES OF THE INDICATORS AND DEMAND SATISFACTION: – Hydrology (cantidad, varianza, …) – Ratio resources/demands – Infraestructures (regulación, conectividad, acuíferos, …) – MANAGEMENT OF THE W.R. SYSTEM (Operatin rules)
• Must be OPTIMAL (OPTIMIZACIÓN y/o SIMULACIÓN)
PRACTICAL CRITERIA (IN MODELS AND ANALYSIS)

ENVIRONMENTAL FLOWS AT SPANISH LAW
LAW 46/1999: environmental flows are “restricction” over
all the other demands except human supply.
IPH-2008.
- Objective of this decret is to establish criteria to
develop Water Basin Plans (as a requirement of the
European Water Framework Directive).
- It establishes methods to estimate environmental
flows.
- Also it requires to estimate the effect of
environmental flows application over the other uses of
the system.

IPH-2008. METHODS TO ESTIMATE ENVIRONMENTAL FLOWS
0
100
200
300
400
500
600
0
0.3
0.6
0.9
1.2
1.8
2.4 3
4.2 5
6.5 8
8.5
9.5 11
14
17
20
Q (m3/s)
Curva SPU
STATISTICAL APPROACHES
HABITAT SIMULATION
100%
80%
50%
30
%

¿HOW TO ESTIMATE THE EFFECT OF NEW ENVIRONMENTAL FLOWS
OVER THE SYSTEM?
JUST DO IT
EXPERTISE
JUDGEMENT
DECISSION
SUPPORT SYSTEM
(MODELS)
¿HOW TO DEFINE NEW ENVIRONMENTAL FLOWS
WITHIN THE RANGE?

SPAIN
l Water adm. at basin scale since 1927: River
Basin Agencies (Authorities) across
administrative boundaries
l Users represented at the Agencies Decision
Boards: active participation
GALICIA
PRINCIPADO DEASTURIAS
CANTABRIA
PAISVASCO
NAVARRA
ARAGON
CATALUÑA
VALENCIA
CASTILLA-LA MANCHA
MADRID
EXTREMADURA
ANDALUCIA
MURCIA
BALEARES
CANARIAS
LA RIOJA
CEUTA
MELILLA
CASTILLA-LEON
Júcar
Valencia
Map of adminitrative autonomous regions Map of River Basin Authorities

Júcar River Basin Authority (CHJ)
Total demand by uses
79%
17%
3%
1%0% Irrigation
Urban supply
Industrial supply
Cattle
Recreation
Total Demand by source of water
42%
52%
4%
0%
2%
Surface water
Groundwater
Direct WasteWater
Reuse
Desalination
Imports (MCT)
Surface (km2) 43.000
Permanent population 4.792.528
Equivalent population due to tourism
367.322
Irrigation surface (ha) 347.275
Water demand (hm3/year) (Hm3/year = Gigaliters/year)
3.172
GALICIA
PRINCIPADO DEASTURIAS
CANTABRIA
PAISVASCO
NAVARRA
ARAGON
CATALUÑA
VALENCIA
CASTILLA-LA MANCHA
MADRID
EXTREMADURA
ANDALUCIA
MURCIA
BALEARES
CANARIAS
LA RIOJA
CEUTA
MELILLA
CASTILLA-LEON
Júcar
HALF OF THE AREA IS SEMIARID
+HIGHEST
VARIABILITY IN
EUROPE
(IN SPACE AND
TIME) Pdia/Paño (%)
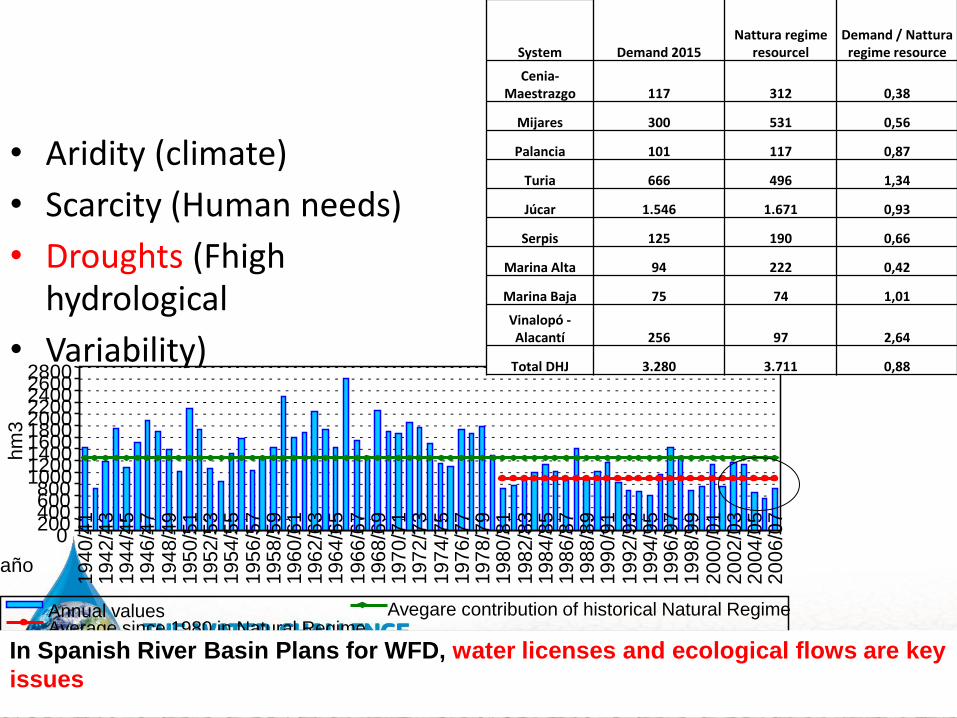
• Aridity (climate)
• Scarcity (Human needs)
• Droughts (Fhigh hydrological
• Variability)
0 200 400 600 800
1000 1200 1400 1600 1800 2000 2200 2400 2600 2800
19
40
/41
1
94
2/4
3
19
44
/45
1
94
6/4
7
19
48
/49
1
95
0/5
1
19
52
/53
1
95
4/5
5
19
56
/57
1
95
8/5
9
19
60
/61
1
96
2/6
3
19
64
/65
1
96
6/6
7
19
68
/69
1
97
0/7
1
19
72
/73
1
97
4/7
5
19
76
/77
1
97
8/7
9
19
80
/81
1
98
2/8
3
19
84
/85
1
98
6/8
7
19
88
/89
1
99
0/9
1
19
92
/93
1
99
4/9
5
19
96
/97
1
99
8/9
9
20
00
/01
2
00
2/0
3
20
04
/05
2
00
6/0
7
año
hm
3
Annual values Avegare contribution of historical Natural Regime Average since 1980 in Natural Regime
System Demand 2015 Nattura regime
resourcel Demand / Nattura regime resource
Cenia-Maestrazgo 117 312 0,38
Mijares 300 531 0,56
Palancia 101 117 0,87
Turia 666 496 1,34
Júcar 1.546 1.671 0,93
Serpis 125 190 0,66
Marina Alta 94 222 0,42
Marina Baja 75 74 1,01
Vinalopó - Alacantí 256 97 2,64
Total DHJ 3.280 3.711 0,88
In Spanish River Basin Plans for WFD, water licenses and ecological flows are key
issues


Need for tools and models • Process of making good decisions: information must be
managed and analyzed about – feasible alternatives,
– their impact on the multiple objectives,
– the tradeoffs among them, as well as
– risks associated with them.
• To elaborate and analyze such information, sound science, technology, and expertise have to be involved.
• Tools for data management and analysis, and models are needed to cope with the complexity, the basin scale scope, and the huge amount of information, alternatives, and scenarios.

Need for Decision Support Systems (DSS)
• We agree that the political process is important, but insist that debates must be on the basis of transparency and knowledge
• Frequently, decision makers, stakeholders and general public (Policy Making Actors -PMA), are not prepared to produce and understand such information.
• a transfer of technology and ideas from scientist to PMA is needed: effective transfer: PMA must be able to apply the technology easily and in a repeatable and scientifically defensible manner (NRC 2000).
• Development of DSS: best way to conduct this transfer & build a shared vision of the basin

DSS • suites of computer programs including, among others:
– geographically based design facilities,
– geographically based databases handling,
– integrated simulation and/or optimization models, including several aspects (rainfall-runoff, w.rights, w.allocation, quality, economics, …)
– capabilities for analyzing and displaying the results,
• essential feature: a unique and user friendly interface that provides easiness of data management, model use and results analysis.

WR Systems INTEGRATE at the BASIN SCALE:
WaterBodies, W.Uses (Demands), Infrastructures
AQUIFERS
Complex relationships that
affect water availability
both in SPACE &TIME
Implications on all aspects
(w. quality, environment,
economy, …) can only be
captured by means of
adequate integrated
modeling

Integrative DSS • In order to complete basin identification, and for the
development of further analysis activities, it is crucial to have
• a DSS integrating, in a single model and for the entire basin, all the relevant – surface water elements (e.g., river reaches, lakes, ...),
– aquifers,
– infrastructures (e.g., dams, reservoirs, diversions, returns, groundwater abstraction, ...),
– water uses (e.g., agricultural uses, urban uses, industrial uses, ...),
– environmental requirements on flows,
– water rights and priorities, and operating rules for the system.

DSS Shells (DSSS) • Generalized tools to build DSS,
• bring the possibility of relatively easy, systematic and homogeneous application of DSS over wide regions, as for instance many river basins in Spain
• provide guidance in the development of the DSS
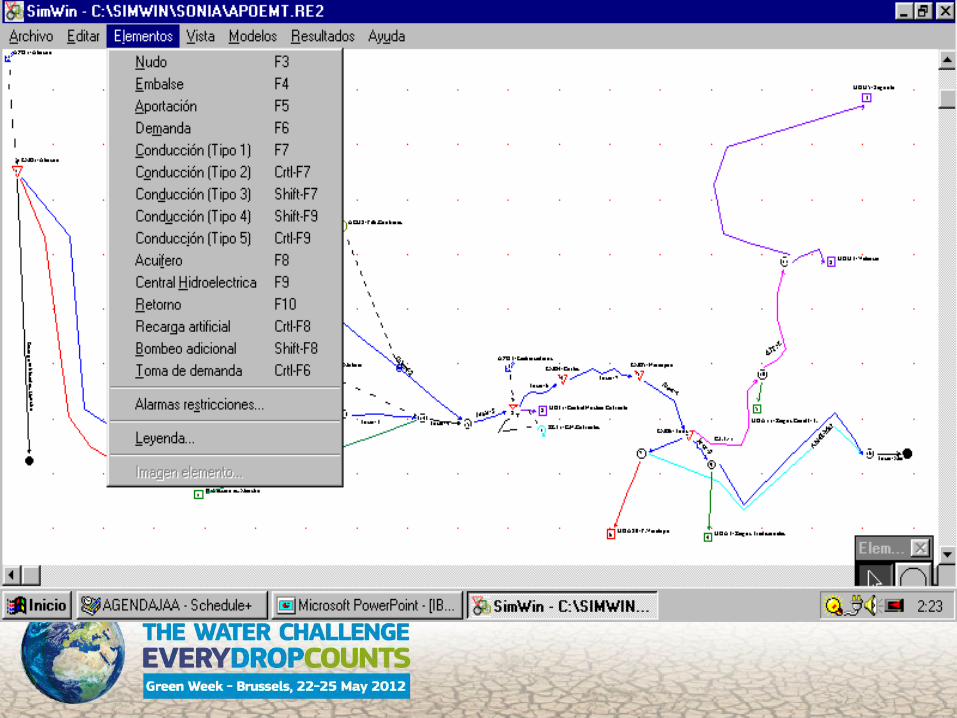
• Example: AQUATOOL DSSS (Andreu et. al. 1996),

AQUATOOL: DSSS designed for integrated
management of complex water resource systems
J. Andreu, J. Capilla, y E. Sanchis, “Generalized
decision support system for water resources planning and management including conjunctive water use”, Journal of Hydrology, Vol. 177, pp.
269-291, 1996.

NODES
SW. INFLOWS
CONDUITS (stream &
canal reaches)
HYDROELECTRIC PLANTS
ARTIFICIAL RECHARGE
DEMAND INTAKES
Additional G.W.
PUMPING
RETURNS
AQUIFER MODELS
DEMANDS
RESERVOIRS
ELEMENTS
MANAGEMENT INDICATORS
The DSS allows the user to:
Input and modify the space configuration of a
water resource system
Edit and manage geo-referenced data
bases containing physical
characteristics, management
characteristics

RESERVOIRS
PHYSICAL CHARACTERISTICS
FILTRATION (INTO AN AQUIFER) AND EVAPORATION LOSSES
OPERATING RULES

AQUIFERS
Wide range of models available to embed aquifers in the basin model: – Lumped approaches:
» Reservoir
» Single cell connected to stream
» Single cell with spring
» Multiple cells connected to stream
– Distributed approaches:
» Analytical solution for homogeneous & rectangular shape
» Numerical solution for heterogeneous and/or irregular shape:
AQUIVAL module

Integrated Basin model: Jucar
Basin
integrating Physical properties
Water rights and priorities
Operating rules (normal &
Drought)

SIMULATION
V
máx
Vmí
n
V
obj V*= (V mín +
V obj) / 2
Zon.superio
r Zon.intermed
ia Zon.
inferior
Zona de
reserva
INTERNAL PROCESS:
In every month, a network flow optimization algorithm (Out-of-kilter) finds a flow solution which is compatible with the physical restrictions, and tries to minimize weighted deviations from operating rules (Target supplies, flows, and reservoir storage); respecting priorities.
Iteration is needed to take into account non-linearities and surface-groundwater relationships.
for given hydrologic inflows
scenarios

Integrative DSS • purpose of this model is to simulate the management of
the basin
• Once the system is completely defined, the user can perform simulation runs of the management for multiple different alternatives, time horizons and scenarios, using different hydrological data and also different operating policies.
• Easiness in changing the infrastructures, scenarios, etc., and getting and analyzing the results is essential

RESULTS
•Results for all model variables (flows and state) either in
graphical or numerical way. Exporting & printing capabilities.
Mean values.
•Complete reports (data and results) in files that can be
visualized, or printed.
•multi-objective performance indicators (reliability, resiliency
and vulnerability); and environmental requirements
indicators.

Integrative DSS • Useful for the evaluation of alternatives, to analyze
planning decisions in terms of the aspects included in the model and to assess tradeoffs between alternatives.
• Provide flow conditions for the assessment of integrated water quality, environmental, and economic analysis models.

PRE-PROCESSORS
HYDROLOGY
HYDROGEOLOGY
WATER MANAGEMENT
MODELLING
SIMGES
OPTIGES
SIMRISK
POSTPROCESORS
INTEGRATED MODELING
ACTVAL
AQUIVAL
MASHWIN
OPTIRISK
PLANNING STAGE
R. TIME MANAGEMENT
RISK ESTIMATION
GESCAL: WATER QUALITY
CAUDECO: ECOLOGICAL
ECOGES: ECONOMICAL
ASPECTS
AQUATOOL MODULES
Modular structure flexibility

Water quality model coupled with a simulation model.. SIMULATES W.Q. FOR THE ENTIRE SYSTEM
Mechanicistic model for rivers and reservoirs.
Conventional constituents.
o Temperature
o Arbitrary constituents
o DO + OM
o Nitrogen cycle
o Eutrophication problem.
WATER QUALITY SIMULATION MODULE

Norg
NH4+
NO3-
Min
Nitrif
DO
Chl-a
Organic C
OrgP
Inorg P.
Sed
Desnitrif
Sed
Grow Death/Resp
Sed
Reaireation
Sed
Degrad
Mineralización
SOD
Flux
Flux
W.Q. results used to modify constraints in simulation &
to predict the impact of corrective measures in an integrated way at basin scale and
assessing the real efficiency of the measures
EUTROPHICATION PROCESSES

0
2
4
6
8
10
12
oct
-80
sep
-81
ago
-82
jul-
83
jun
-84
may
-85
abr-
86
mar
-87
feb
-88
en
e-8
9
dic
-89
no
v-9
0
oct
-91
sep
-92
ago
-93
jul-
94
jun
-95
may
-96
abr-
97
mar
-98
feb
-99
en
e-0
0
dic
-00
no
v-0
1
oct
-02
sep
-03
ago
-04
jul-
05
m3/s
Caudales. Simulacion base
0
100
200
300
400
500
600
0
0.3
0.6
0.9
1.2
1.8
2.4 3
4.2 5
6.5 8
8.5
9.5 11
14
17
20
Q (m3/s)
Curva SPU
0
100000
200000
300000
400000
500000
600000
oct
-80
ago
-81
jun
-82
abr-
83
feb
-84
dic
-84
oct
-85
ago
-86
jun
-87
abr-
88
feb
-89
dic
-89
oct
-90
ago
-91
jun
-92
abr-
93
feb
-94
dic
-94
oct
-95
ago
-96
jun
-97
abr-
98
feb
-99
dic
-99
oct
-00
ago
-01
jun
-02
abr-
03
feb
-04
dic
-04
oct
-05
Hábitat Total. (Masa28.01/Barbo/Adulto)
Bioperiodos
Especie Etapa Oct Nov Dic Ene Feb Mar Abr May Jun Jul Ago Sep
Barbo Alevín
Barbo Adulto
Cacho Alevín
Cacho Juvenil
Cacho Adulto
CAUDECO– Ecological flows module OBJECTIVE OF THE MODULE
•Estimation of Total Habitat Series in different water bodies, species and ages for different management alternatives.
INCORPORTAING ECOLOGICAL ASPECTS IN PLANNING AND MANAGEMENT
STUDIES

0
10
20
30
40
50
60
70
80
90
8100
8120
8140
8160
8180
8200
8220
8240
8260
8280
0 5 10 15 20 25 30 35 40 45
Pe
rce
nti
l de
75
% d
e s
up
era
ció
n d
e
hab
itat
. Ad
ult
o B
oga
Pro
du
cció
n M
ed
ia G
Wh
/añ
o
m3/s
Caudal ecológico: Duero en Toro
Producción media Energía Percentil Superacion Hábitat 75%
0
10
20
30
40
50
60
70
80
90
0
50
100
150
200
250
300
350
0 5 10 15 20 25 30 35 40 45
Per
cen
til d
e 75
% d
e su
per
ació
n
de
hab
itat
. Ad
ult
o B
oga
Dé
fici
t M
ed
io A
nu
al h
m3
/añ
o
m3/s
Caudal ecológico: Duero en Toro
Deficit medio demanda agraria Percentil Superacion Hábitat 75%0
50
100
150
200
250
300
350
8100
8120
8140
8160
8180
8200
8220
8240
8260
8280
0 5 10 15 20 25 30 35 40 45D
éfi
cit
Me
dio
An
ual
hm
3/a
ño
Pro
du
cció
n M
ed
ia G
Wh
/añ
o
m3/s
Caudal ecológico: Duero en Toro
Producción media Energía Deficit medio demanda agraria
TRADE-OFFS BETWEEN ENVIRONMENTAL
FLOWS, ECOLOGICAL HABITATS LEVEL, AND
ECONOMIC USES

ECONOMIC EVALUATION MODULE • ASSESS ECONOMIC VALUE OF AN ALTERNATIVE
• USED to estimate OPPORTUNITY COSTS of WATER USE and ENVIRONMENTAL FLOW increments

DSS in Planning Phase of ASA
• transparency, participation, negotiation, and conflict resolution are essential factors
• use of described Integrative DSS, for evaluation of alternatives, as shared vision of the system, generally as a result of joint model and DSS building, enhances very much this process: Jucar-Vinalopó participatory water conflict solution (CHJ, 2005b)

Technical Committee to assess the
JÚCAR-VINALOPÓ PROJECT
(CONFLICT)
Real case of application of DSS by
the

CONFEDERACIÓN HIDROGRÁFICA DEL JÚCAR
Jucar-Vinalopó Transfer under construction in 2003-2004:
- Intake in Muela de Cortes reservoir.
- Opposition from: - Lower Bassin
traditional irrigation farmers
- Ecologists

Jucar-Vinalopó conflict participatory solution
• Technical Committee: Policy Making actors + experts:
– Ministry of environment
– Regional Governments (Castilla La Mancha and Valencia)
– Jucar Basin Authority
– Traditional Farmers and industrial users of donor basin
– Farmers and urban users at receptor basin
– NGO’s (2)
– Experts from universities and other research institutions
• Working for 4 months
• Joint development of DSS

Fuente: Engineering News Record, 1993

DSS including a Simulation model of Júcar RB management
JOINT DSS DEVELOPMENT AND USE
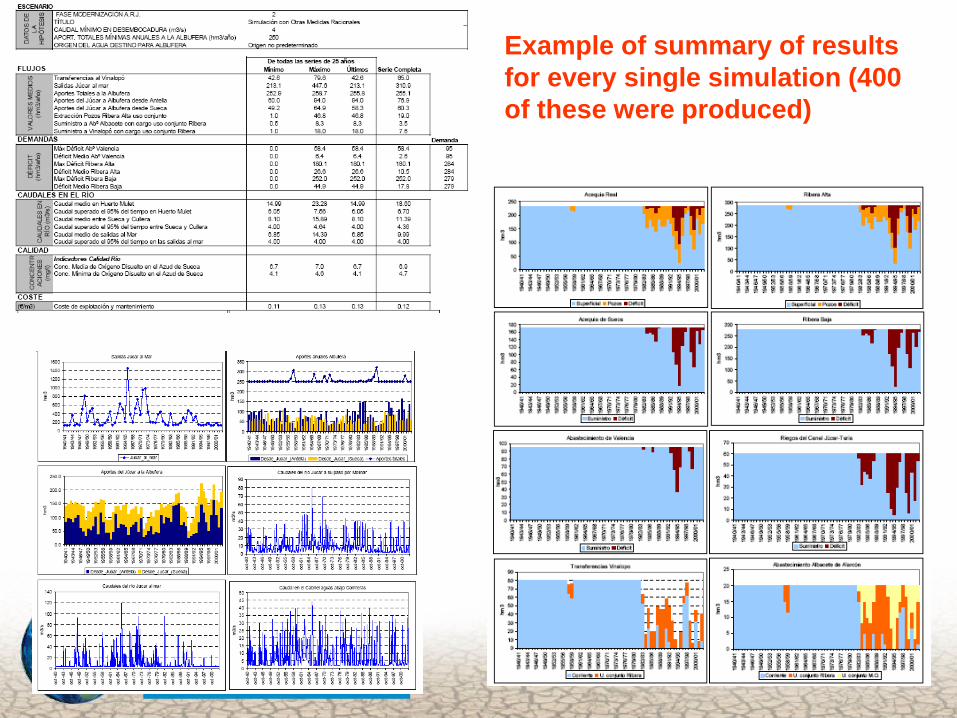
Example of summary of results
for every single simulation (400
of these were produced)

Synthesis of results:
Trade-offs between urban water deficits and environmental requirements at
Jucar River and Albufera wetland.
Déficit medio Abastecimiento de Valencia (hm3/año). Media de la última serie de 25 años.
Modernización 2ª Fase. Simulación: Otras medidas racionales sin el Vinalopó. Valores para las
diferentes alternativas de asignación a La Albufera (hm3/año) y de caudales ecológicos (m3/s)
Environmental flow
Inflows to
Albufera Lake Urb. Def.

Déficit medio Ribera Baja (hm3/año). Media de la última serie de 25 años. Modernización 2ª Fase. Simulación:
Otras medidas racionales sin el Vinalopó. Valores para las diferentes alternativas de asignación a La Albufera
(hm3/año) y de caudales ecológicos (m3/s)
Environmental flow
Inflows to
Albufera Lake
Synthesis of results:
Trade-offs between agricultural water deficits and environmental requirements at
Jucar River and Albufera wetland.
Agr. Def.


CAUDECO PROGRAM
• To estimate HTS when data on WUA-flow curves are available
• The great advantage of CAUDECO is its linkage to the simulation model SIMGES
• HTS as well as the WUA, are specific for each species (species and size class in some cases); in each study site or water body
• Results in m2 or % over maximum WUA.
• Habitat Duration Curves (HDC, accumulated frequency curves), which provide a more comprehensive result for comparing alternatives,
• HTS curves can be accumulated or aggregated for a practical evaluation of the subsystem or basin status.
=
=m
j
j iCSILONGiBIOPiQWUAHTS1
)()()(

RESULTS: TOTAL SERIES OF HABITAT
Reasons of these stress habitat situations: too much water, too little?
0
100
200
300
400
500
600
700
800
900
1000
5%
15
%
25
%
35
%
45
%
55
%
65
%
75
%
85
%
95
%
Há
bit
at
(m2)
Percentil
Carrión en Palencia/Bordallo/Adulto.Curva de duración de hábitat (m2)

DEFINING AND OPTIMIZING MINIMUM ENVIRONMENTAL FLOWS IN DUERO RIVER BASIN
“IMPLEMENTING ENVIRONMENTAL FLOWS IN COMPLEX WATER
RESOURCES SYSTEMS - CASE STUDY: THE DUERO RIVER BASIN, SPAIN.”
J. Paredes-Arquiola, F. Martinez-Capel, A. Solera, V. Aguilella.
River Research & Applications

OBJECTIVES
1. EFFECT. TO ASSES THE EFFCET OF 40 “NEW”
ENVIRONMENTAL FLOWS IN THE DUERO RIVER
BASIN OVER THE SUPPLY OF AGRICULTURAL
DEMANDS, HYDROELECTRIC PRODUCTION AND
HABITAT OF OTHER SPECIES.
2. OPTIMIZATION. TO DEFINE ENVIRONMENTAL
FLOWS IN THE BASIN THAT REPRESENT THE
MAXIMUM POTENCIAL HABITAT SITUATION
MAINTAINING RELIABILITY OF WATER SUPPLY
DEMANDS AND HYDROELECTRIC PRODUCTION
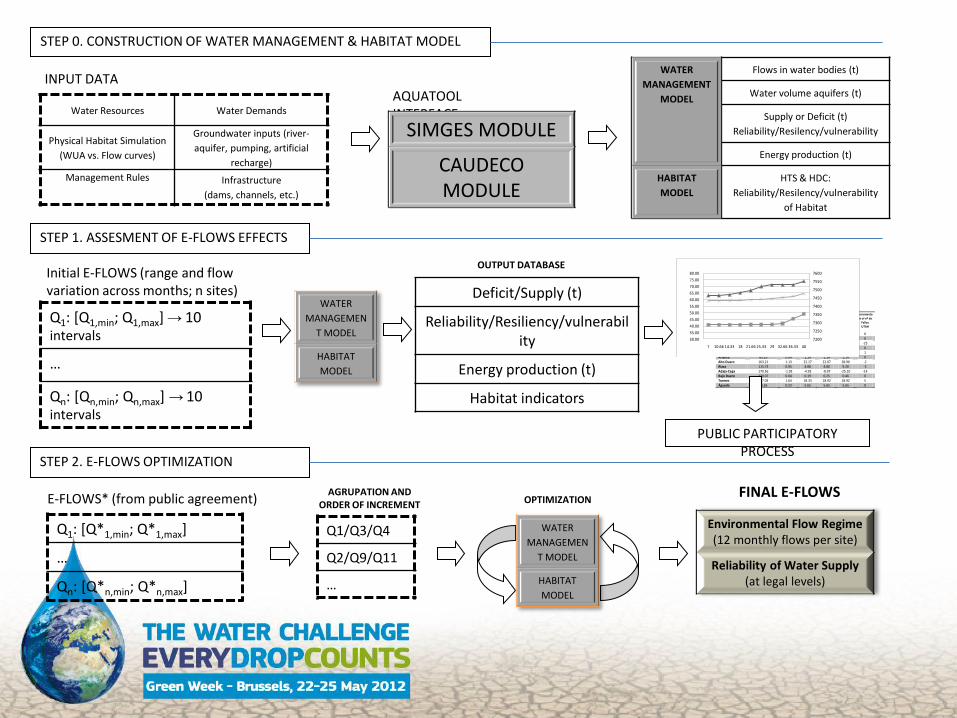
Water Resources Water Demands
Physical Habitat Simulation
(WUA vs. Flow curves)
Groundwater inputs (river-
aquifer, pumping, artificial
recharge)
Management Rules
Infrastructure
(dams, channels, etc.)
STEP 1. ASSESMENT OF E-FLOWS EFFECTS
Initial E-FLOWS (range and flow variation across months; n sites)
PUBLIC PARTICIPATORY PROCESS
E-FLOWS* (from public agreement)
STEP 2. E-FLOWS OPTIMIZATION
OPTIMIZATION AGRUPATION AND
ORDER OF INCREMENT FINAL E-FLOWS
INPUT DATA AQUATOOL INTERFACE
STEP 0. CONSTRUCTION OF WATER MANAGEMENT & HABITAT MODEL
Sistema Dotación anual (hm3)
Incrementos en % sobre Dotación anual Incremento en el nº de
Fallos UTAH
Déficit medio anual
Suma de déficit
máximo 1 año
Suma de déficit
máximo 2 años consec.
Suma de déficit
máximo 10 años consec.
Tera 133.90 1.44 18.19 21.33 21.33 0 Órbigo 432.78 0.52 0.72 0.93 7.33 0 Esla-Valderaduey 978.44 -0.16 -0.37 -0.84 -2.93 -25 Carrión 281.47 1.48 4.52 11.36 25.34 0 Pisuerga 212.26 1.43 2.92 4.19 15.39 1 Arlanza 63.25 0.04 1.14 1.14 1.14 0 Alto Duero 163.21 1.13 22.17 22.07 28.90 -2 Riaza 115.73 0.95 4.88 4.80 9.20 -5 Adaja-Cega 170.56 -1.95 -4.93 -8.07 -25.10 -14 Bajo Duero 130.07 0.04 0.19 0.25 0.46 0 Tormes 277.03 1.64 18.33 18.92 18.92 5 Águeda 15.65 0.22 5.65 5.65 5.65 0
WATER
MANAGEMENT
MODEL
Flows in water bodies (t)
Water volume aquifers (t)
Supply or Deficit (t)
Reliability/Resilency/vulnerability
Energy production (t)
HABITAT
MODEL
HTS & HDC:
Reliability/Resilency/vulnerability
of Habitat
SIMGES MODULE
CAUDECO MODULE
WATER
MANAGEMEN
T MODEL
HABITAT
MODEL
WATER
MANAGEMEN
T MODEL
HABITAT
MODEL
Environmental Flow Regime (12 monthly flows per site)
Reliability of Water Supply (at legal levels)
Q1: [Q*1,min; Q*1,max]
…
Qn: [Q*n,min; Q*n,max]
Q1/Q3/Q4
Q2/Q9/Q11
…
Q1: [Q1,min; Q1,max] → 10 intervals
…
Qn: [Qn,min; Qn,max] → 10 intervals
Deficit/Supply (t)
Reliability/Resiliency/vulnerability
Energy production (t)
Habitat indicators
7200
7250
7300
7350
7400
7450
7500
7550
7600
30.00
35.00
40.00
45.00
50.00
55.00
60.00
65.00
70.00
75.00
80.00
7 10.66 14.33 18 21.66 25.33 29 32.66 36.33 40
OUTPUT DATABASE


RESOURCES AND DEMANDS
0 5000 10000 15000
Demanda
Recurso natural
4883.64
12387.9
(hm3/año)
Tota
les
0
500
1000
1500
2000
2500
3000
Tera
Órb
igo
Esla
-Val
de
rad
ue
y
Car
rió
n
Pis
ue
rga
Arl
anza
Alt
o D
ue
ro
Ria
za
Ad
aja-
Ce
ga
Baj
o D
ue
ro
Torm
es
Águ
ed
a
175
651921
486 362117 246 290 254
662 672
49
17701436
2724
614904 844 818
219
612360
1229
857
(hm
3/a
ño
)Demanda Recurso natural

RESOURCES AND DEMANDS
0
200
400
600
800
1000
1200
1400
1600
1800
Oct Nov Dic Ene Feb Mar Abr May Jun Jul Ago Sep
Demanda agraria y recursos hídricos (hm3/año).Variabilidad temporal
Demandas Recursos

INITIAL ASSUMPTIONS
Studies about environmental flows (INFRAECO, JAN 2009)
Statistical and Habitat Simulation Results
40 environmental flows
Range of
environmental flows
Tramos analizados Rango m3/s Correspondecia modelo aquatool
general Duero
Adaja en Arévalo De 0.5 a 2 r. Adaja 452
Águeda, en Castillejo De 0.5 a 2 r. Águeda 525
Arlanzón en Villasur de Herreros De 0.5 a 2 r. Arlanzón 184
Duero en Toro De 7 a 40 r. Duero 408_b
Duero, en Quintanilla de Onésimo De 5 a 10 r. Duero 344
Duratón, aguas debajo de Las Vencias De 0.5 a 2 r. Duratón 407
Eresma, debajo de Segovia De 0.5 a 2 r. Eresma 544
Esgueva en Villanueva de los Infantes De 0.2 a 1 r. Esgueva 311
Esla, antes del Porma De 4 a 8 r. Esla 38 c
Órbigo, en La Bañeza De 2 a 10 r. Órbigo 46
Pisuerga, en Herrera de Pisuerga De 2 a 4 r. Pisuerga 57
Porma, antes del Esla De 2 a 5 r. Porma 829
Riaza, aguas abajo del embalse de Linares de Arroyo
De 0.2 a 1 Puede ser en r. Riaza 372_b o r. Riaza 372_c
Tera, en Quiruelas de Vidriales De 2 a 5 r. Tera 258
Tormes, debajo de La Almendra De 0.5 a 5 r. Tormes 412
Tuerto, en Astorga De 0.2 a 2 r. Tuerto 102

LOCATIONS
Duero en Toro
Órbigo en Cebrones
Tormes en Contiensa
Porma en Secos de Porma
Rituerto en Sauquillo de Boñices
Esgueva en Villanueva de los Infantes
Esla en Villomar
Duero en Peñafiel
Tormes aguas abajo de Villagonzalo
Zapardiel antes del DueroTormes aguas abajo de Almendra
Pisuerga entre Arlanza y Carrión
Águeda en Castillejo Martín Viejo
Duratón aguas abajo de Las Vencías
Riaza aguas abajo de Linares del Arroyo
Esla en Villalcampo
Duero en Aldeadávila
Tuerto antes de Duerna
Guareña en Toro
Adaja en Arévalo
Huebra en Puente Resbala
Esla en Bretó
Voltoya en Coca
Duero en Garray
Eresma en Segovia
Carrión en Palencia
Tera en Mozar de Valverde
Pisuerga en Herrera de Pisuerga
Arlanzón en Villasur de Herreros
Valderaduey en Santervás de Campos
Arlanza en Quintana del Puente
Duero después del río Riaza
Localización de tramos de estimación del HPU
simulado
no simulado
0 50 100 150 20025km
±Locations where E-flows were annalyzed

INITIAL ASSUMPTIONS
SIMGES model for whole Duero basin
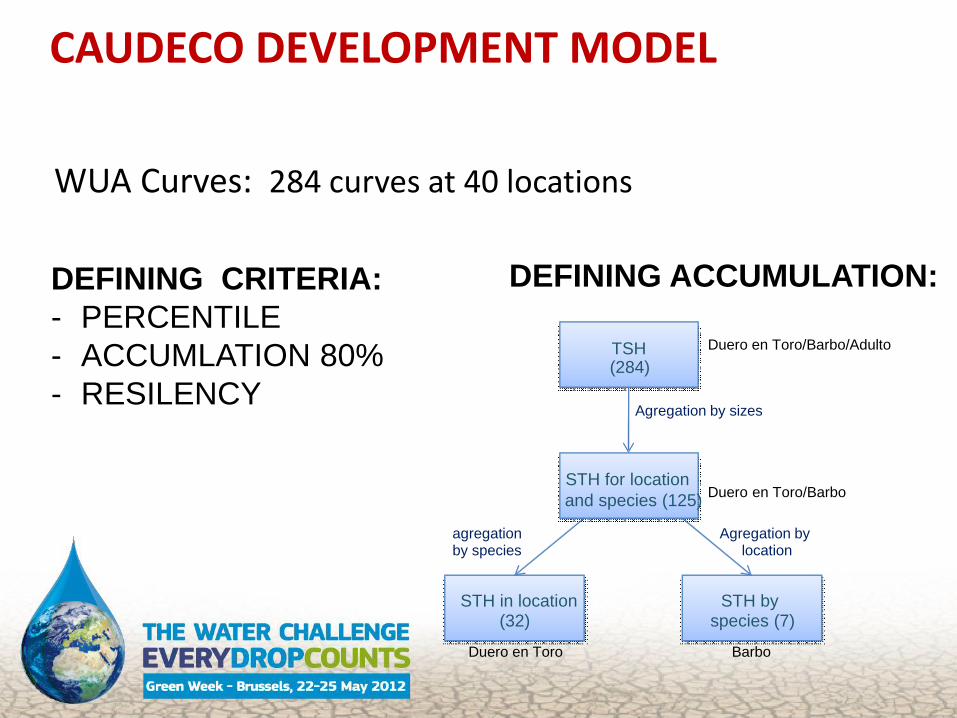
CAUDECO DEVELOPMENT MODEL
Agregation by location
Agregation by sizes
TSH (284)
STH for location
and species (125)
STH in location (32)
STH by species (7)
agregation by species
Duero en Toro/Barbo/Adulto
Duero en Toro/Barbo
Barbo Duero en Toro
WUA Curves: 284 curves at 40 locations
DEFINING CRITERIA:
- PERCENTILE
- ACCUMLATION 80%
- RESILENCY
DEFINING ACCUMULATION:

Aproach: estimation of effect of environmental flows
Range of environmental
flows
DATA BASE OF RESULTS
1 flow
Results: Reliability of water supply (urban and agricultural) and
Energy production

RESULTS. E-FLOWS WITH EFFECT ON THE WHOLE SYSTEM

RESULTS. E-FLOWS WITH EFFECT ON RELIABILITY OF WATER SUPPLY

RESULTS. E-FLOWS WITH EFFECT AT LOCAL SCALE

DSS in Planning • DSS are essential for the purpose of providing
– Integration,
– Transparency
– easiness of use by PMA and
– shared vision for conflict resolution.
• They are also very valuable for – sensitivity analysis
– risk assessment
– Trade-off assessment
– Sustainabililty assessment

DSS USE DURING NEGOTIATIONS PROVIDES MANY
ADVANTAGES:
Development of MODELS, SHARED by the technicians,
stakeholders, and policy makers: SHARED VISION OF the
SYSTEM
OBJECTIVE FRAMEWORK AND REFERENCE that allows
each group to evaluate the consequences of the alternatives that
are proposed by them and by the others.
TOOL FOR the RATIONAL ANALYSIS OF MANAGEMENT
AND OPERATION POLICIES of resulting systems (CRUCIAL
FOR REACHING AGREEMENTS AND TO AVOID FUTURE
CONFRONTATIONS)
OBJETIVITY OF TECHNICAL ASPECTS that allows
negotiations to be developed IN SOCIAL AND POLITICAL
TERMS THAT ALLOW EQUITABLE AGREEMENTS.
DSS in Planning

CONCLUSIONS
• Defining e-flows in complex basins is a difficult and
multidisciplinary task because any decision affects
many aspects of the system.
• A methodology to define e-flows in water systems is
used in Spanish basins.
• Targets for demand satisfaction and environment
satisfaction are incorporated
• It estimates the trade-offs between the environment
and hydropower production and water supply.
• Sustainability assessment is achieved indirectly by
these results. In case of agreed indicator, it could be
easily incorporated.
• Economic aspects could also be incorporated.
• Sustainability assessment must be tailored to each
case
Thank you for
your attention!