greece groundwater report - easac.eu surface area of greece is 130.100 km ... the seawater intrusion...
TRANSCRIPT

Groundwater in the Southern Member States of the European Union:
an assessment of current knowledge and future prospects
Country report for Greece
Contents
1. Introduction ............................................................................................................................. 1
2. Scope ....................................................................................................................................... 2
3. Groundwater Resources .......................................................................................................... 2
4. Groundwater Uses ................................................................................................................... 8
5. Irrigation Systems Performance in Greece ........................................................................... 11
6. Pressures and Measurements of Groundwater ...................................................................... 17
7. Institutions for Groundwater Governance and Potential Measures to
Counteract Pressures .......................................................................................................... 27
8. Economics of Water Use ...................................................................................................... 31
9. Conclusions and Recommendations ..................................................................................... 34
References ................................................................................................................................. 35

1
Greece Groundwater Report
1. Introduction
Greece is a country in South-Eastern Europe, situated on the southern end of the
Balkan Peninsula. It is bordered by Bulgaria, the Former Yugoslav Republic of
Macedonia and Albania to the north and by Turkey to the east. The Aegean Sea lies to
the east of mainland Greece, while the Ionian Sea lies to the west. Both are parts of
the eastern Mediterranean basin.
The surface area of Greece is 130.100 km2
of which 20% is distributed to its 3.000
islands, whereas, two thirds of the Greek territory is mountainous, making the country
one of the most mountainous in Europe. Greece has the longest coastline in Europe
with a total length exceeding 15.000 km of which 5% belongs to areas of unique
ecological value. The national population reaches 11 million with a density of 84
inhabitants/ km2
(one of the lowest densities in Europe). About one third of Greek
population concentrates along the coastline (Lazarou, 2006).
Greece is dependent on groundwater resources for its water supply. The main aquifers
are within carbonate rocks (karstic aquifers) and coarse grained Neogene and
Quaternary deposits (porous aquifers). The use of groundwater resources has become
particularly intensive in coastal areas during the last decades with the intense
urbanization, touristic development and irrigated land expansion. Sources of
groundwater pollution are
the seawater intrusion due to overexploitation of coastal aquifers
the fertilizers from agricultural activities and
the disposal of wastewater.
Greece is characterized by long coastline that favors hydraulic communication
between coastal aquifers and seawater, also a non homogeneous distribution of
rainfalls and water resources. Water resources are characterized by high water
requirements for agricultural and tourism during the dry period (April-late October)
when water availability is low. Greece is 31st in top 50 countries with severe water
stress. The major water use is in irrigation for agriculture; 86% of the total
consumption. The irrigated land increased greatly in last decades, as indicated by the
number of boreholes.
Water needs are mainly covered by groundwater abstracted from the aquifers via
numerous wells and boreholes (approximately 300,000 for the whole of Greece). As a
result, a negative water balance is established in the coastal aquifer systems triggering
sea water intrusion which has negative consequences in the socioeconomic
development of these areas. Many aquifer systems are reported to be affected by
quality deterioration (salinisation and nitrate pollution) due to irrational management
(Daskalaki, 2006).

2
2. Scope
The aim of this report is to give an overview of the current groundwater quality and
quantity networks and monitoring procedures of Greece. The information for this
overview was obtained through literature review. The following information and
topics are included in this report:
Groundwater resources
Groundwater uses
Pressures and measurements of groundwater
Institutions for groundwater governance and potential measures to counteract
pressures
Conclusions and recommendations
3. Groundwater resources
Greece's climate consists of three types that influence well defined regions of its
territory. Those are the Mediterranean, the Alpine and the Temperate types. The first
one features mild, wet winters and hot, dry summers. The Aegean Islands and the
south-eastern part of mainland Greece are mostly affected by this particular type. The
Alpine type is dominant mainly in Western Greece. Finally the Temperate type affects
central and north-eastern part of the country. Athens is located in a transitional area
featuring both the Mediterranean and the Alpine types.
Carbonate rocks cover more than 35% of Greece and many of them are cropping out
at the coast. The karstic aquifers in Greece can be divided in the following groups: i)
Central Greece (i.e. South Parnassos and Ghiona aquifers) with brackish water
because of seawater intrusion influence, ii) Parnitha-Pateras and Hymittos aquifers
with karstic conduits 150 m below sea level, iii) Eastern Peloponnese (Tripolis and
Argolis aquifers) with a high discharge of water to the sea from submarine springs
and iv) Crete island with the famous Almyros springs that can discharge over 50 m3/s
(Lazarou, 2006).
In Greece, the mean annual surface run-off of mainland rivers is 35 billion cubic
meters. More than 80% of the surface flows originates in eight major river basins: the
Acheloos (Central Greece), Axios, Strimonas and Aliakmonas (Macedonia), Evros
and Nestos (Thrace) and Arachtos and Kalamas (Epirus). Nine rivers flow over 100
kilometers within Greece. Four major rivers originate in neighboring countries: Evros
(Turkey), Nestos and Strymonas (Bulgaria) and Axios (FYROM). Total inflow from
upstream neighboring countries amounts to 12 billion cubic meters. Some 41 natural
lakes (19 with an area over5 km2) occupy more than 600.000 hectares or 0.5% of the
country’s total area. The largest are lakes Trichonida, Volvi and Vegoritida. Lake
Prespa is on the borders with Albania and FYROM. The number of Greek wetlands
according to the inventory of Greek Biotope/Wetland Centre (or EKBY by its Greek
initials), rises to about 400 with 10 of them designated as Ramsar wetlands of
international importance. The 14 artificial lakes (ten with an area over 5 km2) occupy
26.000 hectares.

3
Some 80-85% of freshwater resources are in the form of surface water and the rest are
groundwater. Per capita consumption of water is around 830 m3 with peaks recorded
during heat wave days and days of intensive snow fall.
The rainfall in Greece is variable in space, increasing from the south to the north, due
to the change of climatic conditions varying from dryer and warmer to humid and
cooler conditions because of the increase in latitude, and also increasing from the east
to west due to the separation of the country to two different climatic unities, brought
by the Pindos range and its extension to Peloponessos and Crete.
Western Greece accepts the majority of rainfalls, more than 1500mm/year, while
Eastern Greece, along with the islands of Aegean and Crete, have considerably
smaller rainfalls e.g. Attica’s mean interannual precipitation is approximately 400
mm/year.
Figure 1. Distribution of total precipitation in Greece
The shortage of water (drought) in a region is not only related to the availability of the
water resources, but also to the water utilization. Unfortunately, as previously
mentioned, the major users of water in Greece are mainly located in the Eastern and
Southern regions of the country, which is rather disadvantageous as compared to the
natural enrichment.
As it results from Figure 2, Greece does not present a balanced scheme of water uses,
as the rural usage takes the lion’s share of 86% (Lazarou, 2006).

4
11%
86%
1%2%
Urban use
Rural use
Industrial use
Energy use
Figure 2. Water use in Greece
Water regions of Greece
According to water resources legislation (1739/87 for the management of water
resources), Greece has been divided in 14 water regions as follows: West
Peloponnese, North Peloponnese, East Peloponnese, West Central Greece, Epirus,
Attiki, Central Greece and Evia, Thessaly, West Macedonia, Central Macedonia, East
Macedonia, Thrace, Crete and Aegean Islands (Ministry of Development, 1987). The
fourteen water regions of Greece are illustrated geographically in Figure 3.
Figure 3. Greece 14 water regions

5
Groundwater renewable resources represent 13.9% of total renewable resources in
Greece (table 1).
Groundwater abstractions in Greece can be seen in table 2. Groundwater withdrawals
on renewable resources represent the 40.9% of total demand.
Table 1: Groundwater resources in Greece (EUWI/MED, 2006)

6
Table 2: Groundwater abstractions in Greece (EUWI/MED, 2006)
Table 3: Groundwater pressure in Greece (EUWI/MED, 2006)

7
According to recent studies and the “National Programme for the Development and
Protection of Water Resources” that was prepared in 2007, by the Technical
University of Athens for the Central Water Agency
(http://www.itia.ntua.gr/g/docinfo/782/) the following results are derived:
Precipitation: 116.330 hm3/year
Evapotransporation: 59.236 hm3/year
Total renewable water resources: 57.100 hm3/year [including the water resources
originated from neighboring countries: 12.953 hm3]
Total water withdrawal: 8.243 hm3
Water withdrawal for irrigation: 6.859,5 hm3 [as percentage of total renewable
water resources: 84%]
Water withdrawal for stock farming: 106,8 hm3 [as percentage of total renewable
water resources: 1%]
Water withdrawal for households: 956,6 hm3 [as percentage of total renewable
water resources: 12%]
Water withdrawal for industry and energy: 161,4 hm3 [as percentage of total
renewable water resources: 3%]
A report “Initial Characterization of Groundwater Bodies” has been prepared by the
Institute of Geology and Mineral Exploration for the Central Water Agency, in
accordance with the Art.5 of the WFD requirements. This report has submitted to the
European Commission. The main conclusion of the research undertaken are
summarised in the following results:
Number of Water Bodies: 236
At risk : 110
At no risk: 126

8
4. Groundwater uses
Although precise estimate of the available water resources in Greece have not been
made, most authorities agree that water consumption and use constitute only a small
percentage, less than ten and fifteen per cent of the annual precipitation and water
potential, respectively (Table 5). The total annual precipitation is estimated to be
115,375x106 m³/yr and the total water potential is estimated to be 69,000x10
6 m³/yr
(including water transported to Greece from northern countries). By the beginning of
ninety’s, the total water consumption was estimated at 5,500x106 m³/yr, while by the
end of the last decade it increased of about 30%. It is estimated that water
consumption in Greece increases by more than 3% per year.
The major water use in Greece is irrigation (17- 95%) while domestic use ranges
among regions from 3 to 66% and industrial use from 0.2 to 16.0% of the total
consumption. The increased demand of water, either for urban or agricultural use,
cannot be always met despite adequate precipitation. Water imbalance is often
experienced, especially in the coastal and southeastern regions, due to temporal and
spatial variations of the precipitation, the increased water demand during the summer
months, and the difficulty of transporting water due to the mountainous terrain.
However, on an average, there is a relatively high per capita water availability, i.e.
around 5,800 m³/inh.yr, although this is lower than most European countries, but
much higher than that of other Mediterranean regions.
Greece's agriculture has been improved substantially since 1980 and additional
agricultural development mainly depends on water availability. On the other hand,
there are major losses (seepage, evaporation, leakage, etc.) from water delivered to the
agricultural sites for irrigation and the municipal sites for domestic use. In some cases,
these losses are estimated to be as much as 45%.
An alternative plan for water resources management should include the reclaimed
wastewater originating from the wastewater treatment plant effluents. This plan may
provide sufficient water for irrigation, while at the same time the pollution loads
entering the sea or inland waters will be reduced (Tsagarakis, 2002).
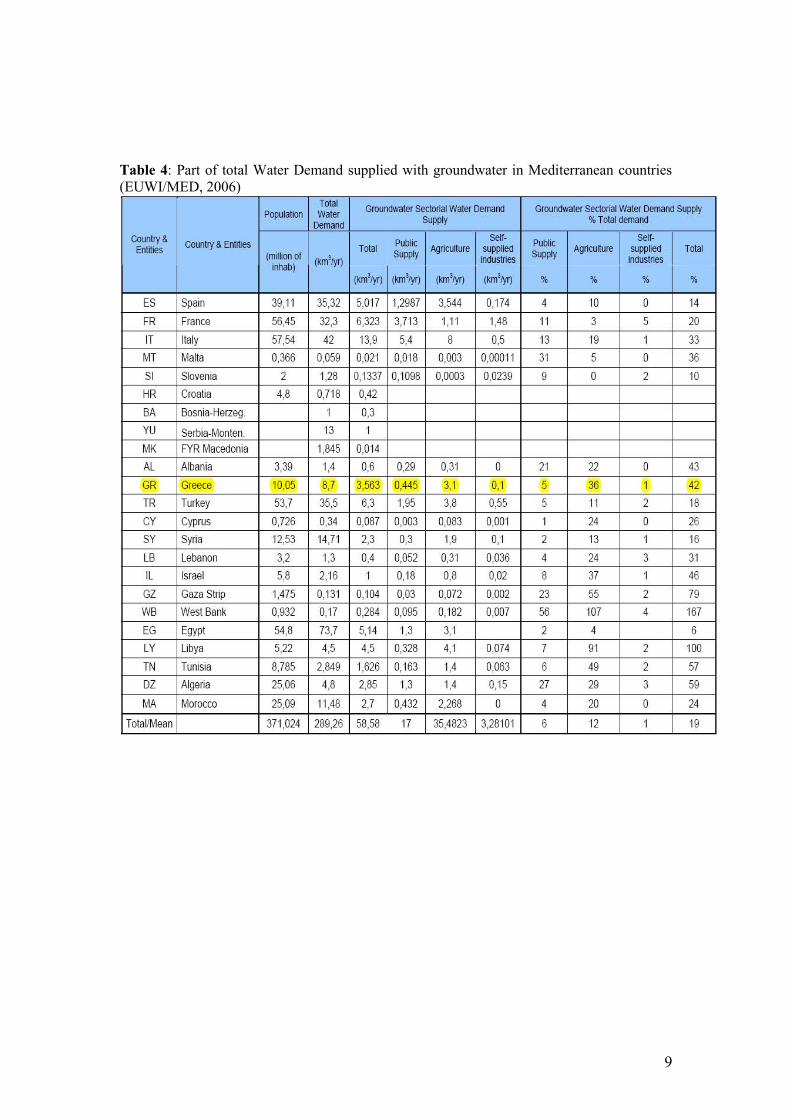
The intensive use of groundwater is shown in table 4. Groundwater use represents the
42% of the total water demand. Furthermore, the major groundwater use is agriculture
(36%), public supply (5%) and self-supplied industries (1%).
9
Table 4: Part of total Water Demand supplied with groundwater in Mediterranean countries
(EUWI/MED, 2006)

10
Table 5. Available Water Resources and Water Uses per Water Region in Greece (Tsagarakis, 2002) Water Region Area Precipitation
(mil. m³/yr)
Water potential
(mil. m³/yr)
Water use
(mil. m³/yr)
Consumption
index
(%)
Surface Ground Total Agricultural Domestic Industrial Total
1. West Peloponnese 7,301 8,031 3,050 700 3,750 560.0 23 22.0 605.0 16.1
2. North Peloponnese 7,310 6,404 2,650 900 3,550 653.5 40 68.0 761.5 21.5
3. East Peloponnese 8 , 477 5,811 1,000 950 1,950 780.0 20 25.0 825.0 42.3
4. West Central Greece 10,199 13,592 9,750 850 10,600 260.0 21 0.5 281.5 2.7
5. Epirus 10,026 17,046 8,500 250 8,750 230.0 31 4.0 265.0 3.0
6. Attiki 3,207 1,642 200 200 400 70.0 270 65.0 405.0 101.3
7. Central Greece and
Evia 12,341 9,516 1,900 1,050 2,950 380.0 36 5.5 421.5 14.3
8. Thessaly 13,377 10,426 3,250 1,350 4,600 1,060.0 65 46.0 1,171.0 25.5
9. West Macedonia 13,440 10,599 4,100 850 4,950 582.0 48 30.0 660.0 13.3
10. Central Macedonia 10,389 6,596 6,900 700 7,600 477.0 75 20.0 572.0 7.5
11. East Macedonia 7,280 4,422 4,200 550 4,750 439.0 23 9.5 471.5 9.9
12. Thrace 11,177 8,574 10,900 400 11,300 536.0 35 6.0 577.0 5.1
13. Crete 8,335 7,500 1,300 1,300 2,600 320.0 60 4.0 384.0 14.8
14. Aegean Islands 9,103 5,216 1,000 250 1,250 80.0 37 1.0 118.0 9.4
Total 131,962 115,375 58,700 10,300 69,000 6,427.5 784 306.5 7,518.0 10.9

11
5. Irrigation Systems Performance in Greece
In Greece the main user/consumer of water is agriculture. For irrigation purposes 80-
85% of the total water consumption is used. The cultivated land covers 3,470,000 ha
from which 1,430,000 ha are irrigated. The participatory irrigation projects cover
approximately 40% of the irrigated land and the private projects 60% respectively. A
significant variety of irrigation systems exist with characteristic advantages for certain
soil/climatic conditions as well as for crop requirements.
5.1. Evolution of Irrigation Systems The effort of the Governments was focused at performing broader schemes of land
improvement projects, giving priority to flood protection works in large plains
(especially in Macedonia, Thessaly and Epirus), draining of swamps and lakes,
reclamation of low lands, watershed stabilization works in mountainous areas and, of
course, irrigation. This effort started in 1925 and continued uninterruptedly since then,
the only exception being the Second World War years (1940-1944) and the years of
internal conflicts (1946-1949). As a result, both cultivated and irrigated lands were
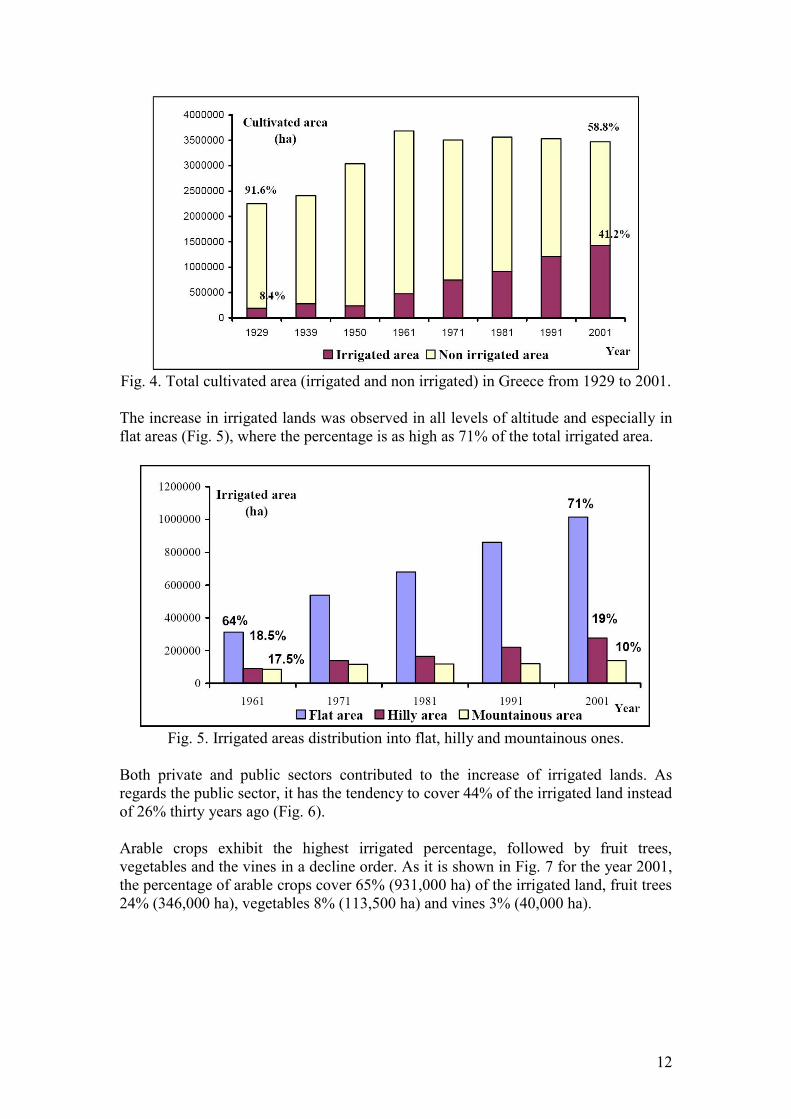
impressively increased from the beginning of 20th century (Fig. 4).
12
Fig. 4. Total cultivated area (irrigated and non irrigated) in Greece from 1929 to 2001.
The increase in irrigated lands was observed in all levels of altitude and especially in
flat areas (Fig. 5), where the percentage is as high as 71% of the total irrigated area.
Fig. 5. Irrigated areas distribution into flat, hilly and mountainous ones.
Both private and public sectors contributed to the increase of irrigated lands. As
regards the public sector, it has the tendency to cover 44% of the irrigated land instead
of 26% thirty years ago (Fig. 6).
Arable crops exhibit the highest irrigated percentage, followed by fruit trees,
vegetables and the vines in a decline order. As it is shown in Fig. 7 for the year 2001,
the percentage of arable crops cover 65% (931,000 ha) of the irrigated land, fruit trees
24% (346,000 ha), vegetables 8% (113,500 ha) and vines 3% (40,000 ha).

13
Fig. 6. Total irrigated area in Greece from 1974 to 2001.
Fig. 7. Proportions of irrigated crops (data 2001).
5.2. Irrigation Systems Management
The authorities responsible for water management of the public irrigation projects are
the Local Organization of Land Reclamation (LOLR) for projects of local importance
and the General Organization of Land Reclamation (GOLR) for projects of general
importance. The GOLR are actually second in the rank surveying the LOLR and both
are under the supervision and scientific support of the Land Reclamation Directions in
the Prefectural Services. There are 10 GOLRs and 382 LOLRs in total.
Planning and operation parameters of irrigation systems
A - Technical Parameters
After the seventies, sprinkler irrigation networks have become popular in both the
public and private sectors. In Figs. 8 and 9, the trends of the irrigation techniques for
both public and private networks are shown. Nowadays, the situation is formed as
described below.
Field water in the case of public networks is applied by means of surface irrigation,
sprinkler irrigation and drip irrigation in proportions of 37%, 53% and 10%

14
respectively, with a distinct falling tendency of surface irrigation. Water in the private
networks is applied by means of surface irrigation, sprinkler irrigation and drip
irrigation at rates of 7%, 49% and 44% respectively.
The way of irrigation water conveyance is given in figures 10 and 11. The conveyance
proportion of pumping water is increased in public networks in relation to the water
flow in open ditches. In the private networks the proportion of pumping water remains
at a high level. In public networks the conveyance of water is done mainly by means
of earthen or concrete channels with a tendency to be replaced by pipelines.
Fig. 8. The trends of irrigation techniques used in public networks.
Fig. 9. The trends of irrigation methods used in private networks.

15
Fig. 10. Conveyance of irrigation water in public networks.
Fig. 11. Conveyance of irrigation water in private networks.
Finally, the water sources differ radically between public and private networks. The
public networks, mainly use surface water, while the private ones use underground
water (Figs 12, 13). The water used in public participatory irrigation networks
originates from rivers and springs (42%), artificial lakes (25%), drilled wells and
wells (24%), natural lakes (5%), drainage ditches (4%). There is a rising interest for
artificial water reservoirs. The water used in private irrigation networks comes from
drilled wells (82%), rivers and springs (13%), drainage ditches (3%) and artificial
lakes (2%).

16
Fig. 12. Source of irrigation water in public networks.
Fig. 13. Source of irrigation water in private networks.
It is worth pointing out that in Greece there are about 200,000 drilled wells and wells
for irrigation purposes, 13 rivers with a summer discharge bigger than 3 m3/sec, 21
large lakes covering an area bigger than 320 ha, 52 big carstik springs (and thousands
minor ones) and more than 70 artificial lakes with a total effective volume bigger than
9.5 billion m3. The total annual water potential is estimated about 70 billion m
3,
including the rivers water flowing from neighboring countries.
17
6. Pressures and Measurements of Groundwater
The Hellenic Ministry for the Environment, Physical Planning and Public Works
supervises the existing national monitoring networks for water quality. This network
that measures water quality systematically since 1995, relies on existing sampling
stations, such as those set up since the 70s by the Ministry of Agriculture for monthly
monitoring of irrigation water quality (90 sampling points in rivers, 30 sampling
points in lakes plus seasonal sampling in 100 irrigation projects and 250 drillings).
The network encompasses upgraded Laboratories of the General Chemical State
Laboratory (GCSL), as well as Municipal and Research Laboratories. Monitoring is
based on 200 sampling points in lakes and rivers and samples are being analyzed for
around 69 parameters (physicochemical parameters, nutrients, heavy metals and
microbiological) on a trimester basis.
This Monitoring Network includes sampling points where water is analyzed for toxic
substances contained in Lists I and II of the EU Directive 76/464/EC. More
specifically, samples are monitored for 156 substances of Lists I (7 substances) and II
(116 substances) as well as 33 priority substances, at 50 sampling points through out
the country. For the transboundary rivers, 5 sampling points have been established at
the entry points from the upstream neighboring countries, where 5 automatic
monitoring stations have been situated at Axios, Strymonas, Nestos and Evros (2
stations) rivers.
Groundwater monitoring is carried out at approximately 400 sampling points covering
the whole country except for the Aegean islands. Sample analyses focus on nitrates of
agricultural origin. The Institute of Geology and Mineral Exploration (IGME) has also
established a national network for monitoring qualitative and quantitative properties
of groundwater, collecting systematically hydrological, hydrochemical and other data
(heavy metals, pollutants). Data are then incorporated in a GIS database for compiling
adequate timeseries and determining evolutionary trends of groundwater according to
the WFD. Pesticide residue monitoring is carried out in cooperation with the
Benakion Phytopathological Institute.
A water quality monitoring programme of rivers, lakes and groundwater, including
the determination of all heavy metals and pesticide residues has been executed and
will be continued in cooperation with the Aristotle University of Thessaloniki in the
Regions of Macedonia and Thrace, in Northern Greece.
In the frame of the obligations derived from Directive 91/676/EC, YPEHODE
assigned to the University of Patras the elaboration of a study and the organization
and operation of a Groundwater Quality Monitoring Network in the country
(monitoring parameters: NO3, NO2, NH4, Cl, SO4, ions, conductivity and pH). From
the conclusions of this study and according to the criteria of the Directive, vulnerable
zones have been designated as regards nitrate pollution of agricultural origin and
.Codes for a Good Agricultural Practice. along with Action Programs for the
promotion and implementation of such Codes, have been developed in these zones.
The National Surface and Groundwater Quality Monitoring Networks are currently
under revision and readjustment, according to the requirements of the WFD and LAW

18
3199/03. Through this activity, a coherent and comprehensive overview of the
chemical and ecological status within each River Basin District will be provided. This
overview will enable, after assessment of the reference conditions, the classification
of the surface waters into five classes, on the basis of specific quality elements and the
development of national classification.
Groundwater quality, even though generally good, is threatened by uncontrolled
wastewater disposal and salinization caused from over-extraction and seawater
intrusion at coastal aquifers. High concentrations of nitrates, deriving from
nitrogenous fertilizers and the use of livestock manure, as well as pesticide residues
have been detected in northern and western parts of the country but do not always
exceed maximum permissible values.
In Greece, the supply of clean and sanitarily appropriate water, from ground and
surface waters, to every citizen in the country, consists one of the main
responsibilities of Public Administration. The state is responsible for providing water
and wastewater services to Athens and Thessaloniki and has effectively entrusted
water services to two large companies: to EYDAP (Athens Water Supply and
Sewerage Company) in Athens, which legally has private status but is supervised by
the Ministry for the Environment, Physical Planning and Public Works and to
DEYATH in Thessaloniki, a public sector company. In cities, over 10000 municipal
companies manage water and wastewater services. In smaller towns and rural areas,
communities are directly responsible (Country Profile: Greece, 2004; Lazarou, 2006).
Groundwater Quality in Greece
According to the results of chemical analyses (Daskalaki and Voudouris, 2006) the
following general characteristics can be drawn: High values of electrical conductivity
(E.C.) along the coastline are attributed to seawater intrusion, as a result of the
intensive exploitation. The electrical conductivity shows a gradual increase from the
mountainous recharge areas towards the lowlands discharge areas. The fluctuation of
pH between 6.8 and 8.3 shows that groundwater is slightly acid to alkaline.
Groundwater contains Ca2+
>Mg2+
>Na+>K
+
and HCO3->SO4
2->Cl
->NO3
-. High
sulphate (SO42-
) concentrations in western Greece can be associated with the
dissolution of gypsum. High potassium concentration is related to mixed-type
fertilizers and/or to the presence of K-feldspar. High concentrations of Fe and Mn are
attributed to lithological conditions. High concentrations of heavy metals (Zn, Cu, Ni,
Pb) are recorded in areas with mining activities (Lavrio, Chalkidiki).
The Ca-Mg-HCO3 water type is the dominant type in Greece, representing freshwater
of recent infiltration.
The overexploitation of coastal aquifers always produces a lowering to the water table
levels. When the extracted volumes are greater than the recharge, even on local base,
a salinisation process begins in the aquifer as the seawater flows towards inland.
Seawater intrusion in most coastal areas has progressed a great distance inland with
the consequence of a chloride concentration greater than 100 mg/L. The total area of
aquifers affected by seawater intrusion due to overexploitation was estimated to be
1500 km2
(Fig. 4).

19
Locally (Macedonia, Thrace), groundwater salinity is correlated with the trapped
seawater in sediments or connate fossil water in recent deposits. The Cl- concentration
is higher at the end of the dry season (October). Seawater intrusion has been favored
by some preferential paths, depending upon the geological conditions of each area.
Because of its salt content, about 2% of seawater mixed with freshwater makes the
resulting water unusable in terms of drinking water standards. Once contaminated
with seawater, an aquifer can remain contaminated for long periods (50-600 years).
Conventional methods of groundwater treatment do not eliminate chloride ions.
Seawater intrusion in coastal karstic aquifers is a very common phenomenon due to
the connection of deep conduits of seawater with shallow inland conduits. The
position of the seawater-freshwater interface depends on the elevation of the hydraulic
head and defined as the point where the seawater pressure is equal to the respective of
freshwater. In wet period when the discharges are high the equilibrium plane is low,
while during the low discharges of the dry period seawater enters. For example, the
Almiros-Heraklion karstic spring is discharged (250x106 m
3/yr) at a distance of 1.1
km from the sea. At low discharge (dry period), the spring water is brackish due to
seawater intrusion and the concentration of chloride (Cl-) can mount to 6,000 mg/L.
Nitrate is the most abundant nutrient in groundwater and can be attributed to different
sources. In many porous aquifers, nitrate content exceed the maximum admissible
concentration of 50 mg/L set by EU Council for drinking water, rendering most of
groundwater improper for human consumption.
Figure 4. Groundwater over-exploitation and saltwater intrusion in Greece (left).
Areas affected by nitrate pollution, due to agricultural activities (>50 mg/L) (right).
The applied fertilizers [NH4NO3, (NH4)2SO4, mixed types Nitrogen Phosphate
Potassium] in cultivated areas (vineyard, cotton, tobacco, citrous), the cattle units, the
great number of industries of rustic products (cheese maker units, tanneries) in urban
areas and the disposal of domestic and industrial wastewater through rivers are the
most important sources of nitrates. In the urban areas the high nitrate concentration

20
are attributed to the direct disposal of untreated domestic wastewater in former wells
that are presently used as septic tanks.
The most vulnerable areas to nitrate pollution from agricultural activities are North
Peloponnesus, Thessaly, Kopais basin and Strimonas basin (Fig. 4). Statistical
processing of the chemical analyses results leads to the conclusion that there is a trend
of increasing concentrations of nitrates in these areas. The highest concentrations are
recorded in the dry season, due to the downward movement of shallow water, which
is rich in nitrate.
Alluvial and shallow aquifers are particularly vulnerable to nitrate pollution, whilst
deep or confined aquifers are generally better protected. However, surface or near-
surface outcrops of confined aquifers can allow nitrate to migrate towards deeper
strata. Based on the average hydraulic parameters of the alluvial aquifer of
northeastern Peloponnesus it is calculated that a period of 16.5 years is required to
restore groundwater quality to a background level of 15 mg/l nitrate, provided that
complete cessation of fertilization is enforced.
Groundwater Quality in North Peloponnesus
Groundwater plays an important role for urban and agricultural water supply in
northern part of Peloponnesus. Despite increasing environmental awareness in this
area, groundwater is a resource that is being stressed (Voudouris et al., 2005)
The northern part of the Peloponnesus, in South Greece including the Achaia and
Korinthia prefecture, has an extent of 6,000 km2 and a population of about 477,400.
Between the 1970’s and 2000’s the population grew quickly, increasing by 35%. The
population density in the coastal areas is 200 persons per km2 and it decreases to 15
persons per km2 in the mountainous area.
The water supply is mainly covered by groundwater abstracted from the alluvial
coastal aquifers via numerous wells and boreholes. The number of wells and
boreholes has reached 8,000 in Korinthia prefecture. As a result a decline of ground
water levels has been observed, since 1980’s due to overexploitation of agricultural
and municipal water intakes in coastal part of the study area combined with prolonged
drought periods. Furthermore a negative water balance is established in the coastal
aquifer systems. In these systems seawater intrusion is recorded due to over-pumping
combined with prolonged dry periods. An increase in the dissolved components in the
groundwater, especially chloride and sodium, has been observed in many boreholes
drilled into aquifers, along the coastline of the study area.
Nitrate pollution is the second major source of groundwater degradation in the study
area. Nitrate is a common contaminant identified in groundwater of the study area,
due to the irrational application of fertilizers. The common fertilizer applied
throughout the irrigation area is (NH4)2SO4, phosphate and potash. Under a
nitrification process in the presence of oxygen, ammonium is transformed into nitrate.
The high levels of nitrate are probably the result of the lack of sewage systems in
some urban areas. The main pollution source of surface water results from
uncontrolled direct disposal of raw olive mill waste effluent into the torrents and
rivers

21
Seawater intrusion occurs in some coastal aquifers, where negative water balance has
been established. High percentage of the examined samples exceeded the maximum
admissible nitrate concentration of 50 mgl-1
, set by EU for drinking water.
Groundwater in urban areas has been contaminated to varying degrees. The water
quality is classified into Ca-HCO3 type (fresh water) and Na-HCO3 or Na-Cl type
(brackish waters) in the coastal part, due to seawater intrusion.
Degradation of groundwater quality is mainly caused by: seawater intrusion and
nitrate pollution. The coastal part of this area is characterized by ongoing
urbanization, tourism development and intensive agriculture. As a result, in some
coastal aquifer systems of the study area a negative water balance is established,
triggering seawater intrusion. Intensified fertilization has led to considerable
groundwater quality deterioration, as evidenced by the increased nitrates
concentration. Other sources of groundwater pollution are leaking septic tanks in
urban areas. Groundwater alone cannot meet the water supply requirements in the
study area and thus a need exists to supplement with surface water (Voudouris et al.,
2005).
Groundwater Quality in Naxos Island, Cyclades
Naxos island is located in Cyclades Archipelago
(Aegean sea, Greece), covering an area about of 428
km2. Approximately 18,188 people inhabit the
island; the summertime population increases, due to
tourism. Average annual rainfall is 380 mm and the
real evapotranspiration is estimated to be 74 % of the
annual rainfall. The salinity of rainfall in Cyclades
Archipelago is high, due to airborne sea spray and
that has a strong effect on the chemical composition
of the groundwater of the islands.
The island is characterized by increased demands of
water, during the last decades, due to tourist development and intense irrigation.
Groundwater is the main source for domestic and irrigation uses and is a resource that
is being stressed. As a consequence, problems relevant to intensive exploitation
combined with the lack of irrational management appeared: salinization, quality
deterioration, and decline of groundwater level. Sources of groundwater pollution are
the seawater intrusion due to overexploitation of coastal aquifers, the fertilizers from
agricultural activities and the disposal of untreated waste in torrents or in old water
pumping wells.
Forty one (41) groundwater samples collected from boreholes, during August-October
2004. The samples were analyzed in the laboratory of Engineering Geology &
Hydrogeology of Aristotle University of Thessaloniki for major ions, Total Hardness
(TH) and SiO2. The water temperature (oC) at the head of the boreholes, the Electrical
Conductivity (EC) and the pH values of 87 samples (including the aforementioned 41
samples), were measured in situ. Based on the results of chemical analyses, pH values
are greater than 7, indicating the slightly alkaline character of groundwater. Electrical
conductivity values range between 270 and 14,100 μS cm-1
. High values of are

22
recorded in the coastal part of the island, due to seawater intrusion. Chloride
concentration ranges between 24 and 5460 mg L-1
. The highest Cl concentration is
29% of the chloride concentration found in seawater. Nitrate concentrations range
between 3.5-141 mg L-1
, the mean nitrate value is 27.8 mg L-1
. Nitrate concentrations
in most of the analyzed groundwater samples exceed the maximum admissible
concentration of 50 mg L-1
, that was set by EU for drinking water, due to human
activities.
Generally, a significant relationship is observed in the major ions having the different
charge but a same valence: Na+-Cl
-, Na
+-HCO3
-, K
+-HCO3
- and in the ions having
the same charge and the same valence Na+-K+, Cl--HCO3 -. Two main groundwater
types may be identified: Ca(Mg)-HCO3 (freshwater) and Na-Cl (water affected by
seawater intrusion). Results of cluster analysis identified the existence of two
aforementioned types of groundwater. It is not possible to establish a generalized
trend for temperature distribution in the island. Groundwater temperatures range from
13.6-18.5 oC in the north central part of the island, 19- 22
oC in the coastal part of the
island, 21-25.5 oC and 26.7-32.6
oC in the southwestern part of the island. High
temperature values indicate a local geothermal anomaly (Vasalakis et al., 2005).
The Hydrological Regime of the East Basin of Thessaly
A typical example of an area with a serious water shortage due to poor water
resources management and increased demand for water is the East Basin of Thessaly.
This basin constitutes part of the Pinios River basin and covers approximately 3860
km2. The current situation relative to water resources in the East basin is thoroughly
analyzed and evaluated. The average annual rainfall is approximately 530 mm and
ranges from 353- 734 mm per year. 87% of the rainfall is lost through
evapotranspiration. 45×106 m3 of surface water from the Pinios River serve irrigation
purposes (Petalas et. al., 2005)
In the basin, nearly 100% (or 30×106 m3) of the drinking water requirements and 76%
of the irrigation water requirements (145×106 m3) are met from groundwater. The
irrigation of the 75,000 ha used for agriculture in the basin requires 335×106 m3 of
water. The aquifer systems are in many cases overexploited. A continuous decline of
the water level (as much as 2m/year) has occurred in the last two decades as a result
of human activities. Despite the fact that official data on groundwater contamination
are scarce and sketchy, aquifer pollution by human activities may be serious in some
areas. In parts of some aquifers there are areas in which ΝΟ3- exceeds the 50 mg/L
limit for drinking water. Seawater intrusion occurs in the coastal areas. Valuable
wetlands have been destroyed (e.g., Lake Karla) by incorrect water resources
development and management. The human activities adversely affected the long term
established interaction between groundwater and surface water in some reaches of the
Pinios River.
The quality of groundwater is generally suitable for most uses. Groundwater quality is
most commonly affected by nonpoint source pollution and waste disposal.
Deterioration of groundwater quality in the alluvium is caused by three processes.
First, where river water recharging the aquifer is of poor quality; second, point source
pollution from dumping or sewage lagoons; and third nonpoint source pollution from
agriculture. Groundwater exploitation started at the beginning of the 1970s. The

23
amount of wells gradually increased as shown in Table 6, and so did the quantity
pumped from the aquifers. A permit system was developed in the study area entitling
the holders to drill wells and use groundwater. Permits may be for the withdrawal of a
particular quantity of water for uses as urban or agricultural use. Generally, permits
are not based on scientific criteria. About 12.000 permits for drilling wells were
recorded in the study area from 1980 to 1995. About 11.400 wells were finally drilled.
An unknown number of illegally drilled wells also exist in East basin of Thessaly, as
well as a great number of abandoned wells.
Locally, groundwater has been affected by seawater intrusion. Improper management
of fertilizers has lead to excess nitrate levels, sometimes to the point where the water
becomes unsuitable to consumption as potable water. Nitrate concentration varies
from 0.53 to 143.14 mg/L. The average concentration is 21.05 mg/L. Ammonia
concentration varies from 0 to 0.76 mg/L with an average concentration of 0.55 mg/L.
Table 7 presents chemical and physical parameters of groundwater for the period
1999-2000. Groundwater sampling included 24 wells.
Table 6:
Permits allocated annually from 1981 to 1995, that entitle the holders to drill wells
and use groundwater in the study area. 1981 1982 1983 1984 1985 1986 1987 1988 1989 1990 1991 1992 1993 1994 1995
320 431 568 1012 1284 939 320 971 860 849 461 798 852 544 620
Table 7:
Chemical parameters of groundwater in the study area during the period 1999 -2000. pH SEC
(μS/cm)
Salinity
type
Cl-
(mg/L)
CO3--
(mg/L)
HCO3-
(mg/L)
SO4--
(mg/L)
Ca++
(mg/L)
Mg++
(mg/L)
Na+
(mg/L)
Average 7.48 851 C2 -C4 49.04 26.50 326.50 52.07 66.28 43.04 75.98
Min 7.00 449 4.01 0.00 3.50 2.49 30.70 8.10 8.44
Max 7.90 2790 307.96 72.00 567.30 335.85 134.50 89.80 554.95
Distribution of arsenic in groundwater in the area of Chalkidiki, Northern
Greece
An integrate study aiming at the occurrence and distribution of arsenic in groundwater
in the area of Chalkidiki, Northern Greece has been carried out. Groundwater samples
from public water supply wells and private wells were analysed for arsenic and other
quality parameters (T, pH, EC, Ca, Mg, Na, K, Cl, HCO3, NO3, SO4, B, Fe, Mn).
Arsenic showed high spatial variation; ranged from 0.001 to 1.840 mg/L. Almost 65%
of the examined groundwaters exhibit arsenic concentrations higher than the
maximum concentration limit of 0.010 mg/L, proposed for water intended for human
consumption. Correlation analysis and principal component analysis were employed
to find out possible relationships among the examined parameters and groundwater
samples. Arsenic is highly correlated with potassium, boron, bicarbonate, sodium,
manganese and iron suggesting common geogenic origin of these elements and
conditions that enhance their mobility. Three groups of groundwater with different
physicochemical characteristics were found in the study area: (a) groundwater with
extremely high arsenic concentrations (1.6–1.9 mg/L) and high temperature (33–42
◦C) from geothermal wells, (b) groundwater with relatively high arsenic

24
concentrations (>0.050 mg/L), lower temperatures and relatively high concentrations
of major ions, iron and manganese and, (c) groundwater with low arsenic
concentrations that fulfil the proposed limits for dinking water (Kouras et al., 2007).
The role and importance of shared aquifers
Interstate borders may cross aquifers without recognising hydrological and
hydrogeological processes that may take place in different ways from each side of the
border.
In internationally shared rivers and lakes much progress was made on how to
determine what type of water resources problems are or will likely be posed for
bilateral or multilateral interstate solutions. A large number of international
agreements for solving various types of interstate surface water resources problems
are available for reference and act as precedents.
The situation is quite different in the case of transboundary groundwater resources.
Difficulties arise in scientific and technical matters (groundwater monitoring, data
interpretation, modelling), the lack of political willingness for cooperation and the
weakness of the institutions involved. Major difficulties in designing groundwater
development plans is that groundwater flow and groundwater quality are subject to
several types of uncertainties much more important than in surface hydrology. These
are related to the high variability in space and time of the hydrogeological, chemical
and biological processes. The principal challenge is to set up a cooperative framework
in which institutions involved from both sides could work together effectively.
A very characteristic case of groundwater-surface water interdependencies can be
found in the South Balkans, in the region of the Dojiran lake, internationally shared
between Greece and the Former Yugoslav Republic of Macedonia (FYROM). In the
last decade, during a multiple year’s drought period, extensive pumping from the
Greek side for irrigation may have contributed to lowering the lake’s water level
substantially (EUWI/MED, 2007).
Pinios Pilot River Basin
Pinios River (216 km) is located in the central section of mainland Greece, in
Thessaly (Thessalia) Water Region. It is located in the ecoregion 6 for both rivers -
lakes and transitional - coastal waters.The
total surface area of Pinios River Basin is
10.550 km2
(including the drainage basin of
the Former Lake Karla - about 1.050 km2).
Pinios River is rising in the Pindos
Mountains and outflows, after 216 km, in
the Aegean Sea
The number of inhabitants in the river is
about 700.000. The major cities are Larissa
and Volos. Pinios River Basin lies in an area of intense agricultural activity. The area
is not notably industrialised and food transformation and metal production industries
are the most prominent. The coastal zone is a favourite destination for many tourists
25
during the summer and as a consequence of this, the water supply requirements are
increasing during the tourist season. Other economic activities in the region are
breeding, fisheries and forestry.
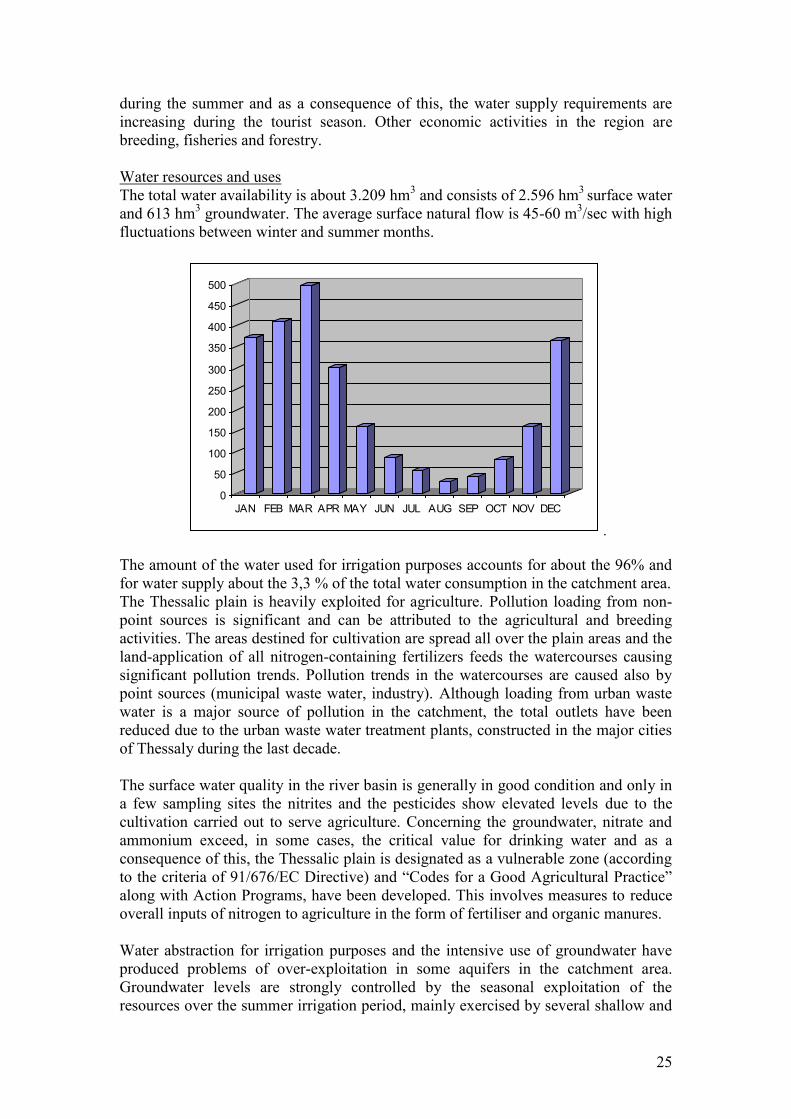
Water resources and uses
The total water availability is about 3.209 hm3 and consists of 2.596 hm
3 surface water
and 613 hm3 groundwater. The average surface natural flow is 45-60 m
3/sec with high
fluctuations between winter and summer months.
0
50
100
150
200
250
300
350
400
450
500
JAN FEB MAR APR MAY JUN JUL AUG SEP OCT NOV DEC
.
The amount of the water used for irrigation purposes accounts for about the 96% and
for water supply about the 3,3 % of the total water consumption in the catchment area.
The Thessalic plain is heavily exploited for agriculture. Pollution loading from non-
point sources is significant and can be attributed to the agricultural and breeding
activities. The areas destined for cultivation are spread all over the plain areas and the
land-application of all nitrogen-containing fertilizers feeds the watercourses causing
significant pollution trends. Pollution trends in the watercourses are caused also by
point sources (municipal waste water, industry). Although loading from urban waste
water is a major source of pollution in the catchment, the total outlets have been
reduced due to the urban waste water treatment plants, constructed in the major cities
of Thessaly during the last decade.
The surface water quality in the river basin is generally in good condition and only in
a few sampling sites the nitrites and the pesticides show elevated levels due to the
cultivation carried out to serve agriculture. Concerning the groundwater, nitrate and
ammonium exceed, in some cases, the critical value for drinking water and as a
consequence of this, the Thessalic plain is designated as a vulnerable zone (according
to the criteria of 91/676/EC Directive) and “Codes for a Good Agricultural Practice”
along with Action Programs, have been developed. This involves measures to reduce
overall inputs of nitrogen to agriculture in the form of fertiliser and organic manures.
Water abstraction for irrigation purposes and the intensive use of groundwater have
produced problems of over-exploitation in some aquifers in the catchment area.
Groundwater levels are strongly controlled by the seasonal exploitation of the
resources over the summer irrigation period, mainly exercised by several shallow and

26
often hand-dug wells. Saline water intrusion is also apparent in small parts of the
aquifers nearby the coastline, where the water levels are lower than the mean sea
level.
The aquatic environment is also affected by water level and flow regulations for flood
protection, drainage channels and the tourist infrastructure in the coastal area.
Extreme hydrologic events such as floods and droughts are quite common in the
catchment (http://www.minenv.gr/pinios/page5.html).
DRIVING FORCE PRESSURE
Agriculture Nutrient loss from agriculture
Pesticide application
Modified water use by vegetation
Abstraction for irrigation Reduction in groundwater volume
Urban activity Effluent disposal to groundwater
Industry Effluent disposal to groundwater
PRESSURE POTENTIAL IMPACT
Nutrient loss from agriculture Groundwater quality deterioration
Reduction in groundwater volume Reduced dilution of chemical fluxes
(increased concentrations)
Aquifer compaction, subsidence at surface
Modified flow
Seawater intrusion
Modified dependent terrestrial ecosystem
Modified water use by vegetation Altered aquifer recharge
Pesticide application Groundwater quality deterioration
Potential health risks on recovered water
Effluent disposal to groundwater Groundwater quality deterioration
Potential health risks on recovered water

27
7. Institutions for groundwater governance and potential measures to
counteract pressures
Institutional context
Since December 2003, a new legislative and institutional framework has been put into
force in the country. It consists of Law 3199/9-12-2003 (Official Journal of the
Government - OJG 280A/2003) on water protection and the sustainable management
of the water resources, with which the EU Water Framework Directive (WFD)
(2000/60/EC) is transposed into the national legislation. This new framework Law
foresees a radical reorientation of the respective administrative capacities in Greece
and introduces an innovative and holistic approach concerning water management that
recognizes explicitly the ecological function of water. It also lays emphasis on the
management of water on the basis of river basins as well as on the water pricing so
that it reflects its full costs. In more detail, the main objectives of the new Law
include: the long-term protection of water resources, the prevention of deterioration
and the protection and restoration/remediation of degraded water resources and
wetlands, the reduction and, in cases, the phase out of harmful and polluting
discharges, the reduction of groundwater pollution and the prevention of its further
deterioration as well as the mitigation of the effects of floods and droughts.
The Law 3199/03 also incorporates the polluter pays principle and the objective of
maintaining or reaching a good ecological status for all water resources through the
control of pollution by use of threshold levels and standards. It also introduces
innovative approaches concerning the protection of water quantity and the
transnational cooperation for the protection of transboundary water courses and lakes.
The new legislation for the protection and the sustainable management of the water
resources in Greece provides a detailed identification of 13 Regional Water
Directorates, which have the responsibility for organising and co-ordinating water
policy activities and specific Water Programmes and Action Plans with specific
measures for the River Basin Districts (RBDs) of the country. They are in charge for
implementing the WFD in the RBDs and they are supervised by the Central Water
Agency, a governmental authority with the overall responsibility for establishing the
national water policy. In the new legislation there is also consideration about the most
effective options for setting up legal coordination mechanisms relating to the
designation and management of the River Basins that cross the borders of their
competencies.
The 3199/03 Law also integrates the public participation requirements of the WFD.
The active involvement of the interested parties is ensured by their representation at
the National and Regional Water Councils that will be developed as a part of the new
administrative framework. In order to complete the transposition of the WFD, besides
this new law, further instruments, e.g. Presidential Decrees and Joint Ministerial
Decisions, have been prepared, for the incorporation of the technical provisions of the
Directive (Country Profile: Greece, 2004; Lazarou, 2006)
.

28
Management of protected areas including wetlands, was defined in 1999 (Law
2742/99) through the establishment of administrative units (Management Bodies) and
the competence of NATURA 2000 Committee, whereas in 2002, through Law
3044/02, 25 Management Bodies were established, additionally to the existing two
ones. Management of the most important protected wetland sites in Greece,
designated as Ramsar wetlands of international importance, is attained through the
establishment of these Bodies (which are financially supported, for the time being,
from the state), that will collaborate with the respective regional services to be
established according to Law 3199/03, with the mandate to develop and implement
regional water management plans.
The development of the National Strategy for the management of Water Resources is
closely linked with the efforts of Greece to comply with the Water Framework
Directive (2000/60/EC). In this context, the Hellenic Ministry for the Environment,
Physical Planning and Public Works has already proceeded to the necessary actions
for the implementation of the Directive.
The National Strategy for the management of Water Resources (NSWR) concerns the
sustainable use of existing water reserves, the efficient protection of water
ecosystems and the attainment of high quality standards for all surface and ground
water bodies by the year 2015.

29
The basic sectors of action of the NSWR are:
Integrated approach for water management: Development of Management Plans
on river basin level including transboundary water courses, based on water quality
and quantity considerations and the interaction between surface and ground
waters.
Upgrading and expansion of infrastructure: This includes the promotion of
specific measures and actions for meeting the demand for water supply through
the expansion of existing networks as well as through the decrease of losses, the
construction of new and the upgrading of existing wastewater treatment plants
with emphasis on recycling, the construction of new multi-purpose reservoirs and
finally, the establishment of more effective mechanisms for monitoring water
quality and quantity with focus on creating an updated Data Bank.
Incorporation of socio-economic considerations in water management: This
includes measures to reinforce public participation in water management efforts as
well as adaptation of pricing policies to include the social cost in water services
provision.
Preventive and remedial Measures: Protection of the aquatic environment of the
country and promotion of remedial measures, where required.
More specifically, the NSWR contains a wide series of activities according to the
requirements of the WFD that will allow meeting set targets at national, EU and
international levels, by fully implementing the WFD and law 3199/03, such as:
Participation of national experts in the Common Implementation Strategy for the
implementation of WFD
Completion of WFD transposition into national legislation.
Participation in the intercalibration exercise
Update of the National Qualitative and Quantitative water data bases
Encouragement of active involvement of all interested parties
Participation in the PRB network, established by the EC, with the Pinios Pilot
River Basin in Thessaly RBD.
Development of a new monitoring network for inland surface, transitional, coastal
and ground waters, including the development of monitoring programs for
biological quality parameters and the assessment of their ecological quality.
Categorization and determination of Reference Conditions of water bodies
Designation of heavily modified and artificial water bodies.
Development of water pricing policies that enhance the sustainability of water
resources.
Development and publication of River Basin Management Plans for each river
basin district of the country.
Furthermore, according to the requirements of the EU Directive 91/676/EEC
(transposed into national legislation with JMD 195652/ 1906/1999, OJG 1575B), four
vulnerable zones towards nitrogen pollution from agricultural run-offs have been
established and respective special Action Programmes have been planned and
adopted, according to art.5 of the Directive, focusing on the minimization of the
adverse impacts on the environment of Greece. The implementation of these
programmes is obligatory for all farmers of these vulnerable zones. These Action
Programmes include:
Action programme for Thessaly plain (JMD 25638/2905/2001, OJG 1422B)

30
Action programme for Kopaida plain (JMD 20417/2520, OJG 1195B)
Action programme for Argolida plain (JMD 20416/2519, OJG 1196B)
Action programme for Pinios basin, Prefecture of Ilia (JMD 20418/2521, OJG
1197B)
In 2001 three more areas were identified as sensitive areas (with JMD 20419/2522,
OJG 1212B). For these areas Action Programmes have been established:
Action programme for Thessaloniki plain ((JDM 16175/824 OJG 530B )
Action programme for Strimonas Basin (under finalization)
Action programme for Arta Preveza plain ((under finalization)
Finally, under the National Programme (OJG 1866/B/12.1.03) for the reduction of
toxic substances of List II of Directive 76/464/EC, three special Action Programmes
have been established: for the protection of Lake Vegoritida-Petron and Soulos
stream MD (15782/1849/2001 OJG 797B), of Koroneia lake (JDM 35308/1838, OJG
1416B) and of Pagasitikos Gulf (JDM 15784/1864, OJG 819B).

31
8. Economics of Water use
An analysis on the water uses in Greece has been undrtaken by the Athens University
of Economics and Business for the Central Water Agency, in accordance with the
Art. 5 of the WFD requirements. This study was submitted to the European
Commission, for the needs of the WFD Art. 5.
The study allows an assessment of the recovery level of water services in each sector
of the economy and assists policy making in implementing efficient, equitable and
sustainable water resources management policies in compliance with the EU
Directive. The main conclusions of the research undertaken are summarised in the
following tables:
Table A: Socioeconomic characteristics of each River Basin District
River Basin District (RBD)
Population of RBD
(2001)
Area
Of
RBD
(km2)
Domestic demand for
water (Million
Cubic Meters per year)
Demand for irrigation
water
(Million Cubic
Meters per year)
Industrial water
demand
(Million Cubic
Meters per year)
1.West Peloponnesos 331,180 7,301 23 201 3
2.North Peloponnesos 615,288 7,310 36.7 395.3 3
3. East Peloponnesos 288,285 8,477 22.1 324.9 0.03
4.West Sterea Ellada 312,516 10,199 22.4 366.5 0.35
5. Epirus 464,093 10,026 33.9 127.4 1
6. Attica 3,737,959 3,207 400 99 1.5
7. East Sterea Ellada 577,955 12,341 41.6 773.7 12.6
8.Thessaly 750,445 13,377 69 1,550 0.054
9. West Macedonia 596,891 13,440 43.7 609.4 30
10. Central Macedonia 1,362,190 10,389 99.8 527.6 80
11. East Macedonia 412,732 7,280 32 627 0.321
12.Thrace 404,182 11,177 27.9 825.2 11
13.Crete 601,131 8,335 42.33 320 4.1
14. Aegean Islands 508,807 9,103 37.19 80.20 1.24
Table B: Cost Recovery of Water Services Level in each Water District
River Basin
District (RBD)
Cost and Recovery
Domestic
Irrigation
Total
1.West
Peloponnesos
Financial Cost (€) 106,825,222 4,689,283 111,514,505
Resource Cost (€) - 0 0
Environmental Cost (€) 0 0
Agricultural Subsidies (€) - 27,196,649 27,196,649
Recovery (€) 63,420,580 3,647,690 70,105,941
Cost Recovery Level (%) 62.21 11.44 50.54
2.North Peloponnesos
Financial Cost (€) 183,128,952 3,028,191 165,264,301
Resource Cost (€) - 0 0
Environmental Cost (€) 0 0 0
Agricultural Subsidies (€) - 15,783,835 15,783,835
Recovery (€) 115,963,093 5,519,490 123,507,697
Cost Recovery Level (%) 77.31 19.41 68.22
Financial Cost (€) 152,607,460 12,656,841 186,157,143

32
3. East Peloponnesos
Resource Cost (€) - 3,510,184 3,510,184
Environmental Cost (€) 0 0 0
Agricultural Subsidies (€) - 28,941,94 28,941,994
Recovery (€) 68,631,114 5,740,844 75,121,958
Cost Recovery Level (%) 37.89 15.66 34.18
4.West Sterea
Ellada
Financial Cost (€) 106,447,222 18,603,213 125,050,435
Resource Cost (€) - 0 0
Environmental Cost (€) 0 0 0
Agricultural Subsidies (€) - 31,781,567 31,781,567
Recovery (€) 64,998,931 7,197,206 72,434,138
Cost Recovery Level (%) 61.29 14.28 46.19
5. Epirus
Financial Cost (€) 198,389,698 9,736,162 208,125,860
Resource Cost (€) - 0 0
Environmental Cost (€) 0 0 0
Agricultural Subsidies (€) - 2,826,432 2,826,432
Recovery (€) 136,499,203 2,818,647 143,671,846
Cost Recovery Level (%) 71 22.44 68.11
6. Attica
Financial Cost (€) 334,735,000 906,238 334,735
Resource Cost (€) - 0 0
Environmental Cost (€) 0 0 0
Agricultural Subsidies (€) - 7,036,644 7,036,644
Recovery (€) 361,995,000 1,691,811 363,686,811
Cost Recovery Level (%) 108.14 21.30 106.13
7. East Sterea
Ellada
Financial Cost (€) 183,128,952 3,767,101 186,896,053
Resource Cost (€) - 20,515,680 20,515,680
Environmental Cost (€) 3,117,546 3,919,685 7,037,232
Agricultural Subsidies (€) - 50,018,126 50,018,126
Recovery (€) 64,998,931 12,499,562 152,371,950
Cost Recovery Level (%) 75.1 15.98 57.61
8.Thessaly
Financial Cost (€) 473,083,126 15,090,667 488,173,793
Resource Cost (€) - 89,356,467 89,356,467
Environmental Cost (€) 2,007,512 7,129,974 9,137,486
Agricultural Subsidies (€) - 84,194,914 84,194,914
Recovery (€) 159,844,929 40,167,390 200,067,757
Cost Recovery Level (%) 33.66 6.38 29.82
9. West
Macedonia
Financial Cost (€) 289,954,174 12,874,290 302,828,464
Resource Cost (€) - 0 0
Environmental Cost (€) 3,749,696 10,785,902 14,535,598
Agricultural Subsidies (€) - 27,166,953 27,166,953
Recovery (€) 126,906,888 20,866,602 178,150,204
Cost Recovery Level (%) 53.55 41.05 51.71
10. Central Macedonia
Financial Cost (€) 376,115,174 8,123,200 384,238,374
Resource Cost (€) - 0 0
Environmental Cost (€) 9,597,394 15,281,830 16,586,149
Agricultural Subsidies (€) - 29,713,081 29,713,081
Recovery (€) 283,986,818 5,780,887 336,967,706
Cost Recovery Level (%) 86.58 12.04 78.27
Financial Cost (€) 167,868,206 9,494,351 177,362,557

33
11. East Macedonia
Resource Cost (€) - 0 0
Environmental Cost (€) 1,549,368 3,476,094.48 5,025,462
Agricultural Subsidies (€) - 20,819,898 20,819,898
Recovery (€) 134,337,440 9,252,186 143,750,126
Cost Recovery Level (%) 79.39 27.38 70.74
12.Thrace Financial Cost (€) 106,825,222 9,601,762 116,426,984
Resource Cost (€) - 0 0
Environmental Cost (€) 2,934,534 6,908,179 9,842,713
Agricultural Subsidies (€) - 40,642,261 40,642,261
Recovery (€) 113,209,011 113,209,011 130,659,923
Cost Recovery Level (%) 103.29 11.05 78.28
13.Crete
Financial Cost (€) 244,171,936 8,690,616 252,862,552
Resource Cost (€) - 0 0
Environmental Cost (€) - 0 0
Agricultural Subsidies (€) - 48,196,855 48,196,855
Recovery (€) 117,263,413 32,000,000 153,281,413
Cost Recovery Level (%) 49.67 56.25 50.91
14. Aegean Islands
Financial Cost (€) 366,257,904 1,688,152 367,946,056
Resource Cost (€) - 26,784,000 26,784,000
Environmental Cost (€) - 0 0
Agricultural Subsidies (€) - 23,276,539 23,276,539
Recovery (€) 157,258,153 919,609 158,177,763
Cost Recovery Level (%) 42.94 1.78 37.84
The mean cost recovery level for each River Basin District in Greece was found
44.49%. Providers of water and sewerage services in general do not even recover
their financial cost from revenues from customers within their water service area. It is
worth noting that the recovery level in agriculture is relatively lower compared to
domestic water use highlighting the need for policy measures to address sustainable
and efficient water resources management in this sector.

34
9. Conclusions and recommendations
Degradation of groundwater quality is mainly caused by seawater intrusion and nitrate
pollution. Many coastal aquifers in Greece are affected by seawater intrusion, due to
overexploitation. Intensified fertilization has led to considerable groundwater quality
deterioration, as evidenced by the increased nitrate concentration. Other sources of
nitrate pollution are leaking septic tanks in urban areas.
An integrated management strategy should be applied to develop new ways of
providing adequate water supply sources in Greece. This strategy could be based on
the conjunctive use of groundwater, surface water, the discharge of freshwater
springs, and the rich and high quality groundwater reserves of the mountainous
region, which are practically not exploited.
The economic value of the various groundwater uses should be evaluated, and finally,
a monitoring programme on groundwater quality should be established in order to
avoid seawater intrusion phenomena and nitrate pollution on a large scale. The
Directive 2000/60/EC and the harmonisation from Greek authorities provides new
legislation and opportunities for the sustainable management of water resources.

35
References
Country Profile: Greece, National Reporting to the Twelfth Session of the
Commission on Sustainable Development of the United Nations (UN CSD 12)
Greece, Hellenic Republic, Ministry for the Environment, Physical Planning and
Public Works, Athens, March 2004, Available at:
http://www.minenv.gr/4/41/000/csd12_final%20edition.pdf
Daskalaki, P., Voudouris, K., 2006. The Impacts of the Irrational Water Resources
Management on the Groundwater Quality of Greece, 2nd
International Conference,
Water Science and Technology - Integrated Management of Water Recourses, 23 – 26
November 2006, Athens, Hellas, AQUA 2006
EUWI/MED, Joint Mediterranean Process. 2007. Mediterranean Groundwater Report.
Technical report on groundwater management in the Mediterranean and the Water
Framework Directive. Available at:
http://forum.europa.eu.int/Public/irc/env/wfd/library?l=/framework_directive/ground
water_library/mediterranean_groundwate/_EN_1.0_&a=d
Min.Env. 2003. Groundwater Characterisation in Pinios Pilot River Basin. Hellenic
Ministry for the Environment, Physical Planning and Public Works, Institute of
Geology and Mineral Exploration (IGME), National Agricultural Research
Foundation (NAGREF), Available at: http://www.minenv.gr/pinios/page5.html
EEA. 1996. Groundwater Monitoring in Europe. European Environment Agency.
Topic report No 14/1996, Available at: http://reports.eea.europa.eu/92-9167-032-
4/en/page009.html
EEA. 1999. Groundwater quality and quantity in Europe. Copenhagen
Karamanos, A., Aggelides, S., Londra, P., 2004. Irrigation Systems Performance in
Greece, Proceedings of 2nd WASAMED (WAter SAving in MEDiterranean
agriculture), Irrigation Systems Performance, Workshop Hammamet (Tunisia), 24-28
June 2004
Koreimann, C., Grath, J., Winkler, G., Nagy, W., and Vogel, W.R. 1996.
Groundwater Monitoring in Europe, European Topic Centre on Inland Waters,
European Environment Agency.
Kouras, K., Katsoyiannis, I., Voutsa, D, 2007. Distribution of arsenic in groundwater
in the area of Chalkidiki, Northern Greece, Journal of Hazardous Materials Article in
Press
Latinopoulos, P., 2005. Valuation and Pricing of Irrigation Water: An Analysis in
Greek Agricultural Areas, Global nest Journal, Vol 7, No3, pp 323-335
Lazarou Anastasia, 2006. Country Report: Greece, Conference of the Water Directors
of the Euro- Mediterranean and Southeastern European Countries, 6 & 7 November
2006, Athens

36
Petalas, C., Pisinaras, V., Koltsida, K., and Tsihrintzis, V.A., 2005. The Hydrological
Regime of the East Basin of Thessaly, Greece, Proceedings of the 9th International
Conference on Environmental Science and Technology, Rhodes island.
Report on Greek Activities in relation to Systematic Climate Observations and Global
Climate Observing Systems (GCOS). Ministry for the Environment, Physical
Planning and Public Works October 2005, Available at:
http://unfccc.int/resource/docs/gcos/grcgcos.pdf
Tsagarakis, K.P., Paranychianakis, N.V., Angelakis, A.N. 2002. GREECE,
aqualibrium – Country Report Greece, Aqualibrium, European Water Management
Between Regulation and Competition, Available at:
http://www.oieau.fr/aqualibrium/Aqualibrium_08.pdf
The EU Water Framework Directive: Statistical aspects of the identification of
groundwater pollution trends, and aggregation of monitoring results" Final Report
December 2001, Available at: www.wfdgw.net
Vasalakis, A., Voudouris, K., Fytikas, M., and Dimopoulos, G., 2005. Groundwater
Quality in Naxos Island, Cyclades Creece, Proceedings of the 9th International
Conference on Environmental Science and Technology, Rhodes island, Greece.
Voudouris, K.S., Daskalaki, P., Antonakos, A., 2005. Water Resources and
Groundwater Quality in North Peloponnesus (Greece), Global NEST Journal, Vol 7,
No 3, pp 340-353.
Water Framework Directive, Integrated Testing of Guidance Documents in Pilot
River Basins, Pinios Pilot River Basin – Greece, Available at: www.minenv.gr
Greek Biotope/Wetland Centre (or EKBY by its Greek initials), Goulandris Natural
History Museum. http://www.ekby.gr/