grayscale and binary enhancement of dorsal hand vein images
TRANSCRIPT

Marlina Yakno. Author is with the Faculty of Electrical & Electronics Engineering, Universiti Malaysia Pahang, Pahang, Malaysia marlinayakno@ ump.edu.my. Junita Mohamed-Saleh. Author, is with the School of Electrical & Electronic Engineering, Universiti Sains Malaysia, Pulau Pinang, Malaysia, [email protected] Bakhtiar Affendi Rosdi. Author is with the School of Electrical & Electronic Engineering, Universiti Sains Malaysia, [email protected]
Abstract—Difficulty in achieving a peripheral intravenous (IV) access in pediatric and some adult patients is a clinical problem. These difficulties may lead to some negative impacts such as fainting, hematoma and pain associated with multiples punctures. The use of near-infrared imaging device to aid visualization of an IV access usually suffers from low contrast and noise due to non-illumination and thickness of hand skin. This further complicates subsequent processing such as image segmentation. In this work, two methods are proposed in two different stages; grayscale enhancement and binary enhancement for correction of low contrast and noisy images. For grayscale enhancement, a combination of histogram-based and fuzzy-based contrast enhancement algorithms are applied on hand vein images. For binary enhancement, a combination of three techniques; Artificial Neural Network pixel corrector, Binary Median Filter and Massive Noise Removal, are applied on the binary hand vein images. Comparative analysis on test images using the proposed different contrast enhancement methods has shown superior results in comparison to its counterparts.
Keywords—Image enhancement, neural network, fuzzy, hand vein imaging, peripheral intravenous access.
I. INTRODUCTION peripheral IV access is a process of invading blood vessel for the purpose of blood drawing, intravenous fluid
feeding or administration of medicine in patient's blood vessels by inserting a needle or catheter through the skin and into an underlying vein. It is often performed by medical laboratory scientists, medical practitioners, paramedics, phlebotomists and other nursing staff, particularly during medical emergency events, where a catheter is inserted into a patients’ blood vessel. A catheter, a small tube, yet is most often difficult to be placed into blood vessel, especially if a patient is at an extreme age, with chronic disease or has dark skin color [1-3].
It was reported that worldwide, 10% (i.e. more than 1 million per year) of attempts to establish an IV line has failed [4]. Although a failure is a small percentage, it has led to various negative impacts during IV access such as fainting or feeling lightheaded, hematoma (blood accumulating under the skin) and pain associated with multiple punctures to locate a
vein [3]. In addition, the frightful and stressful moments faced particularly by children patients during IV may lead to the development of severe psychological problems such as needle phobia or worse still, hospital phobia.
Near-infrared (NIR) imaging is able to offer a solution for veins visualization. This is due to its capability to penetrate up to several millimeters into a tissue (i.e. skin) with specific wavelength between 700 and 1000nm [5-7]. However, its image acquisition most often resulted in vein images with poor contrast, non-uniform gray level and noises because the acquisition is affected by luminous intensity and thickness of the back of hand skin. Several methods have been used to solve these imaging problems, focusing at grayscale or binary image enhancement.
Some image enhancement methods are able to produce better-quality image for segmentation of veins. For instance, classical grayscale enhancement technique based on histogram equalization (HE) is suitable for an overall contrast enhancement [8]. However, practically HE usually causes level saturation, an effect which degrades the appearance of an image leading to loss of information [9]. To overcome this limitation, Kumar and Prathyusha employed an extension of HE known as Contrast Limited Adaptive Histogram Equalization (CLAHE) onto vein imaging [10]. By applying an appropriate value of clipping level, a CLAHE method not only enhances the contrast, but is also able to solve the illumination problem. This method has been reported to be suitable for most medical imaging purposes [11-13]. However, if the chosen clipping level is inappropriate, CLAHE can degrade the quality of an image significantly. In addition, determination of suitable clipping level maybe time consuming.
A simple method such as unsharp masking (UM) [14-15] was also proposed to enhance image contrast. Recently, Zhao et al. presented a method to enhance hand vein images based on Butterworth High Pass Filter and HE [16]. However, the methods have a tendency for poor performance at improving the contrast of some hand vein images due to two main
Grayscale and binary enhancement of dorsal hand vein images
Marlina Yakno, Junita Mohamad-Saleh, Bakhtiar Affendi Rosdi
A
INTERNATIONAL JOURNAL OF CIRCUITS, SYSTEMS AND SIGNAL PROCESSING Volume 11, 2017
ISSN: 1998-4464 129

drawbacks. Firstly, it enhances high-contrast areas too much than areas that do not exhibit high image dynamics.Secondly, the presence of linear highpass filter makes the system extremely sensitive to noise. Consequently, some unpleasant overshoot artifacts may appear in the output image.
When dealing with binary images, the contrasts of vein patterns vary depending on the illumination of an image. A binary hand vein normally contains some noise and un-sharp edges. Thus, the quality of an image needs to be enhanced to expose the vein patterns. Shahin et al. have employed Binary Median Filter (BMF) [17] and Kumar and Prathyusha applied Massive Noise Removal (MNR) [10] to eliminate noise regions with small amount of connectivity. Work by Ding et al.
utilized the advantages of MNR and BMF into their work for the same purpose [18].
Image enhancement using fuzzy techniques had also been extensively used in medical applications especially in digital mammogram [19-20]. Fuzzy Histogram Hyperbolization (FHH) is one of fuzzy techniques which promises good enhancement results in various applications. Nevertheless, very few researchers have explored this approach for hand vein image enhancement. Also, to the best of our knowledge, no researchers have combine CLAHE with FHH for any application.
Aside from the conventional techniques, a more sophisticated technique such as the Artificial Neural Network (ANN) had also been employed for hand vein imaging. However, the ANN approach for hand vein imaging is mostly applied to vein recognition for biometric purposes [21-22]. To the best of our knowledge, no researcher has ever applied ANN technique onto binary hand vein image enhancement for medical purpose.
This paper proposes the application of CLAHE with FHH for grayscale enhancement of hand vein image. Then, using local threshold method the enhanced image is converted into binary. Finally, a combination of ANN pixel corrector, BMF and MNR techniques are applied in binary enhancement stage. With this method, the contrast of binary images can be increased and subsequently a more accurate hand vein patterns can be obtained to aid peripheral IV access. The proposed approach is compared with various existing image enhancement methods at exposing binary hand vein patterns.
II. PROPOSED SYSTEM STRUCTURE ORGANIZATION The proposed hand vein enhancement system in this work
consists of three sub-systems. Fig. 1 shows an overview of the complete system. The first sub-system is a hand vein image-acquisition which uses NIR as the optical source to capture a hand vein. Second, is an image processing component stored in a computer to enhance vein images. To extract vein patterns effectively, an ANN with 3 x 3 window template are used to classify those small regions resulted from the binarization process as the real hand-vein patterns or noise pixel. The binary input for the window template consists of various features that can possibly appear in a vein image. The third sub-system is a hand vein projection system used to project an enhanced hand vein image accurately onto a patient’s hand.
Fig.1 Schematic of hand vein image acquisition
III. HAND VEIN IMAGE ACQUISITION The hand vein image acquisition system based on IR has
been extensively used. Its principle is relatively standard to other image acquisition system. A typical image acquisition system includes a platform where the hand is positioned, IR illuminator to enlighten the hand vein, a camera to capture the hand image, a computer which stores the incoming image and runs specific application programs. The design and principle of operation of the hand vein image acquisition are discussed in the following subsections.
A. Hardware Design A Sony CCD TV camera was modified to capture dorsal
hand vein image in the NIR region. This is done by removing the IR filter in the camera. A total of 48 NIR LEDs from Vishay Corporation have been used as the LED array. These are 5 mm casing LEDs with a radiation emission peak at 890nm, placed in triple concentric arrangement with 16 in concentric circle each. The LED array is mounted symmetrically around the camera body illuminated the field-of-view. In addition, an adjustable potentiometer is equipped in NIR control board for user to change the intensity of LED’s radiation appropriately according to the environment. Fig. 2 shows a drawing of the major parts of the prototype A Dell M109S projector with a size of 9.25 × 10.5 × 3.75 cm and weight only 360 g is used to project an enhanced image onto patient’s hand. A photoelectric sensor is used to detect a presence of patient’s hand. This sensor is placed under an acrylic platform. Theoretically, when patient’s hand is placed on a photoelectric sensor, the light path is blocked by the hand causing the receiver to automatically switch on the NIR source. Finally, the I/O 24 relay driver board which powered by a Condor DC power supply is used to control the overall operations of the system.
INTERNATIONAL JOURNAL OF CIRCUITS, SYSTEMS AND SIGNAL PROCESSING Volume 11, 2017
ISSN: 1998-4464 130

Fig.2 Overall structure design of the system
B. Principle of Operation Fig. 3 shows a block diagram of the proposed system
connection structure. The hand vein image acquisition system started with an AC power from a wall socket supplying current to a Condor DC power supply causing the relay board to automatically operates and activates the camera. A flowchart of the system operation is illustrated in Fig. 4. During image acquisition, subject is requested to place his/her palm on top of the photoelectric sensor on a small platform. Once the light path of photoelectric sensor at the platform is blocked by a patient’s hand, the receiver automatically switches on the NIR source. A video of the patient’s hand is then displayed on the PC monitor. At this stage, illumination and contrast of hand vein can be adjusted using the potentiometer on the NIR control board. When illumination and contrast of hand vein are satisfactory, a grayscale image of the back of hand is captured and stored as a file in jpeg format. The image resolution is 640×480 pixels (VGA). The output of the CCD TV camera, which is an NTSC video signal of patient’s hand, is then converted to digital signal before being transmitted to the PC for image processing.
Fig.3 Block diagram of the system structure
Fig.4 Overall operation of the proposed system
IV. HAND VEIN REGION OF INTEREST EXTRACTION In hand vein imaging, region of interest (ROI) refers to the
portion of an image that contains the most important and useful information. Therefore the captured images are firstly subjected to ROI extraction for effectively and successfully carrying out the subsequent steps of the hand vein enhancement system. In general, the propose ROI extraction method involves six steps. The details of each step are described in the following sub-sections.
A. Hand Region Segmentation The ROI extraction begins with finding the optimal grey-
level threshold values, in an image histogram using Otsu’s thresholding [13]. The threshold value is used to segment a hand vein image into two main parts; hand region and the background. Once the optimal threshold value is obtained, the two optimal parts can be identified and separated.
B. Boundary Tracing In a binary image, the outline of a hand is traced using
boundary tracing algorithm to separate nonzero pixel area (i.e. the hand region) from zero pixel area (i.e. the background) to extract a patient’s hand contour.
C. Reference Point Determination After a hand contour is obtained, the next stage is
calculation of Euclidean distance to measure the distance between BPV from its reference point. Before the Euclidean distance can be computed, a reference point must can be selected. The reference point is the intersection line formed by the mid-point of hand wrist and bottom margin of a hand
INTERNATIONAL JOURNAL OF CIRCUITS, SYSTEMS AND SIGNAL PROCESSING Volume 11, 2017
ISSN: 1998-4464 131

image.
D. Features Point Selection After calculation of the Euclidean distance between BPV
and reference point, distance distribution diagrams are constructed to select feature points. The pattern of distribution diagram is rather similar to the geometric shape of a hand where the local maxima represent the finger-tips and local minima represent the finger-webs. As a result, a total of five local maxima (indicated by red points in Fig. 5(a)) and four local minima (indicated in green points in Fig. 5(b)), are selected as feature points.
In order to establish a larger size of ROI, two additional points are proposed, indicated in yellow points in Fig. 5(c). The first additional point is determined based on the mirror image distance between the second finger-web and second finger-tip. The second additional point is determined based on the mirror image distance of the fourth finger-web and the fifth finger-tip.
(a)
(b)
(c)
Fig. 5 Features points (a) local maxima (b) local minima and (c)
additional points
E. Established ROI Coordinates To extract the ROI, four coordinates have to be determined
as illustrated in Fig. 6(a). The first coordinate, P1 is established at the middle point between the second finger-web
and the first additional feature point. Next, P2 is located at the middle point between fourth finger-web and the second additional point. Then, P3 is obtained 90˚ clockwise using linear transformation from coordinate of P2 with a distance equal to the line constitute by P1−P2. The same procedure is applied in order to obtain P4 based on 90˚ counter-clockwise from coordinate of P1. As a result, ROI is defined as a square region of RP1P2P3P4 as shown in Fig. 6(a).
(a)
(b)
Fig 6 (a) Detected ROI in hand image and (b) cropped ROI with loose area.
F. ROI Extraction The extraction of ROI begins by cropping to obtain the
loose areas as indicated by yellow lines in Fig. 6(a). It contains all ROI coordinates, P1, P2, P3 and P4. Fig. 6(b) shows an example of cropped ROI region for detected ROI in Fig. 6(a). Then the cropped ROI area is rotated at an angle θ to a standard orientation as illustrated by the dotted lines in Fig. 7. To do this, the angle θ is calculated using MATLAB Four-Quadrant Inverse Tangent function, atan2.
Figure 8(a) shows an example of cropped ROI before being rotated. Figure 8(b) shows ROI of P1, P2, P3 and P4 in a standard orientation after θ rotation using MATLAB imrotate. Finally, a square region of ROI is automatically cropped using MATLAB function imcrop to obtain an ROI as shown in Figure 8(c).
Fig. 7 Rotation angle
INTERNATIONAL JOURNAL OF CIRCUITS, SYSTEMS AND SIGNAL PROCESSING Volume 11, 2017
ISSN: 1998-4464 132

(a)
(b)
(c)
Fig.8 The process of obtaining a standard orientation ROI from (a) a cropped area, (b) to a rotated ROI at angle θ and (c) the final ROI for
later processing.
V. HAND VEIN PATTERNS IMAGING In general, several stages are carried out to detect hand
veins. The proposed enhancement method used for hand vein imaging in this work involves grayscale enhancement, segmentation, binary enhancement and image evaluation. These processes are illustrated in Fig. 9. These processes are discussed as the following.
A. Grayscale Enhancement Grayscale enhancement is employed to simplify the
detection of veins from its background using an image. This work considers CLAHE method to take advantage of its capability at enhancing image contrast. Then, it applies FHH to further sharpen the vein patterns. The step for image enhancement methods as follows:
Fig. 9 Process flow diagram of proposed hand vein exposure system development
1) CLAHE As already stated, CLAHE method is an improvement over
standard HE. While HE considers the entire image, CLAHE algorithm operates by partitioning the image into a number of non-overlapping contextual regions. A histogram is calculated and constructed separately according to the size of contextual regions. Then, a clip limit value for clipping histograms is determined as a threshold. Next, the histogram is clipped according to the predefined clipping limit. The accessed clipped pixels are then distributed back to the clipped histogram. Finally, the gray level mappings were combined using bilinear interpolation in order to assemble the final enhanced image.
2) FHH It has been reported that CLAHE method may result in loss
of image information [23]. Hence, after employing CLAHE, FHH is applied for further enhancement of the vein image. FHH combines the concepts of histogram hyperbolization and fuzzy hyperbolization [24]. Basically, the algorithm works in the following sequence: • Gray Level Fuzzification: Here, a linear function is
applied as a membership function. It is given by [25]:
where gmin and gmax are the minimum and maximum value of
the gray level in an image. The image fuzzification transforms a gray level image into the range of [0, 1].
• Modification of Membership Function: A membership modification is carried out using [25]:
( )minmax
min
gggg
g ijij −
−=µ (1)
INTERNATIONAL JOURNAL OF CIRCUITS, SYSTEMS AND SIGNAL PROCESSING Volume 11, 2017
ISSN: 1998-4464 133

where fuzzifier, β is a parameter used to modify the meaning of a fuzzy set. Applying fuzzifier may result in either reducing image contrast or increasing image contrast, depending on the value of β, obtained based on trial-and-error. • Gray Level Defuzzification: A new set of gray level is
generated using [25]:
where µ(gij) is the gray level in the fuzzy membership
values, β is the fuzzifier parameter, g’ij is the new gray level values and L is the maximum number of gray levels in the original image.
B. Segmentation Segmentation is a process which partitions a digital image
into multiple regions or sets of pixels that have similar characteristics to each other [26]. A segmentation process involves either global thresholding or local thresholding. In global threshold, a distinct peak in the histogram is expected for determining the global threshold for the entire image. For hand vein images however, such peaks do not exist, and thus, it is unlikely that global thresholding can produce good results [19]. Therefore, local thresholding method is adopted in this work as it has been reported to perform better and produce more satisfactory results than global threshold [27].
To find local threshold value, the intensity values of the local neighbourhood of each pixel are first statistically examined to determine the most suitable statistical function. This is necessary as suitable statistical function is dependent upon the input image. For hand vein images used in this work, mean of local intensity has been found to be the most appropriate statistical function. It is also simple in implementation and is fast in execution.
For image window W(i,j) of size N x N, the mean value is calculated as follows [28]:
( )∑−=−=
==×=
1,1
0,0
,1 NjNi
ji
jiWNN
µ (4)
On the whole, mean of local area alone is not suitable as a
threshold, because the range of intensity values within a local neighbourhood is very small and their mean values are close to the centre pixel [29]. The situation has been improved by employing a proposed threshold value (mean - C), where C is a constant. C is determined based on trial-and-error as it is dependent upon the image.
The local threshold TL(i,j) for each centre pixel of window W(i,j) is selected as [27].
( ) ( )CjiTL −= µ, (5)
where µ is a mean and C is a constant. Window W(i,j) is
then thresholded as [28]:
( ) ( ) ( ) >
=otherwise
jiTjiWifjiW L
L
,,01
, (6)
All pixels with values above the threshold, TL are
categotized to belong to the object of the interest while pixels with values below the threshold level are categorized as background.
C. Binary Enhancement It is known that, the result of segmentation normally
contains some noise and un-sharp edges which affect the pattern of veins. Thus, the image quality needs to be further enhanced to expose the vein patterns. To achieve this, a proposed binary enhancement algorithm consisting of three stages; correction of selected pixels using an intelligent pixel corrector, smoothing of vein edges using BMF and elimination of unwanted noise using MNR, are employed. These stages are discussed as follows.
1) Intelligent Pixel Corrector An intelligent pixel corrector developed using a Multilayer
Perceptron (MLP). The MLP is trained to classify a pixel as background or vein based on its surrounding pixel. Outputs from the MLP pixel corrector are either 1 (for vein) or 0 (for background).
To develop intelligent corrector, it is necessary to gather sample data containing various features that can possibly appear in a vein image so that the MLP learns the pixel patterns. For this reason, a set of 3 x 3 binary image windows are used as the training patterns (see Fig. 10). Here x1
refers to
the pixel of interest, and x2 until x9
are its neighbouring pixels.
A total of 256 sets of 3 x 3 template windows are obtained from various hand vein images and used as the MLP’s training sample to determine the correction for pixel x1. These data sets are then randomly divided into three subsets namely the training, validation, and test set, with a ratio of 40:20:40 respectively. The binary values of each 3 x 3 window together with their corresponding desired pixel output value are used to train a MLP pixel corrector.
( ) ( )[ ]βµµ ijij gg ='
(2)
( )
−×
−−
= −−
11
1' 1
βµ ijgij e
eLg (3)
INTERNATIONAL JOURNAL OF CIRCUITS, SYSTEMS AND SIGNAL PROCESSING Volume 11, 2017
ISSN: 1998-4464 134

Fig. 10 A 3 x 3 window of binary image pixels
The proposed MLP is a three-layer feed-forward ANN with one hidden layer as shown in Fig. 11. Each layer consists of a number of processing elements which do the computation. The feed-forward MLP neural network is trained by supervised learning based on the Levernberg-Marquardt iterative back-propagation algorithm, using one to ten hidden layer neurons. For each specified number of hidden neurons, an MLP is trained 30 times to avoid local minima traps. After each iteration, the mean squared errors (MSE) of the training and validation datasets are calculated. The training process terminates when there is no further reduction in the validation MSE for 5 consecutive training iterations. The best MLP pixel corrector is selected based on one which gives the least MSE. It has to be noted that such MLP pixel corrector can be used for other vein images.
Fig. 11 Structure of a three-layer-feed-forward MLP-pixel corrector.
2) Binary Median Filter (BMF)
This stage is necessary to eliminate burrs and make the vein edges smooth. Firstly, the output of ANN pixel corrector is scanned uniformly using 5 x 5 sliding windows to. This is done by using a median value. The median is calculated by first sorting all the pixel values from the surrounding neighborhood into numerical order and then replaces the value of the center pixel m(i,j) by the median value w(i,j) as follows:
( ) ( )( )jiwmedianjim ,, = (7) 3) Massive Noise Removal (MNR)
This stage of the work aims to eliminate the remaining burss using MNR technique. It involves conversion of white pixel value of ‘1’ (foreground) to black which is ‘0’ (background) if the total value of white pixels in each object in an image is less than the minimum number of white pixels set for a connected
component. The minimum number of white pixels for connected components is also known as threshold value. In general, this technique is carried out based on four stages; connected component labeling area, component labeling area computation, threshold value determination and small objects removal.
It begins by assigning a unique label (i.e. L=1, 2, 3,…n) to each object (a group of connected pixels with intensity of 1) in a binary image by scanning the image pixel-by-pixel using 4-connectivity, from left to right and top to bottom. The area of each labeled component is then calculated. This is followed with the threshold value determination. Before the threshold value can be determined, the maximum size of connected components is defined using:
( )LL CC maxmax = (8) where CL is the connected components with a unique label and CLmax is the maximum size of connected components. Then, threshold value T is calculated using:
mCT Lmax= (9)
where m is determined based on trial-on-error as it is dependent upon the image.
Finally, MNR is represented as:
( ) <
=otherwise
TCifjiY L
10
, (10)
Based on Eq. (10), such connected component, CL which is less than the minimum threshold value is converted to background and the others remained unchanged. This stage ends the image enhancement process.
VI. IMAGE REGISTRATION AND PROJECTION Image registration is a process of overlapping two or more
images of the same scene at different times, from different viewpoints or by different sensors [30]. Image registration is crucial in this work to accurately localize and align enhanced ROI image onto a reference image at specific coordinates. It involves alignment of two types of images referred to as input and reference images. Input image is the image which has been enhanced and reference image is the original image to be registered by the input image. In this work, an enhanced ROI represents the input image and the original image represents the reference image.
In image registration process, a binary ROI is first converted to color image. This converts white foreground to red and black background to green. Then the colored ROI, is re-rotated to its original orientation using the same angle as order to align the input image into the reference image as shown in Figure 4.28, the previous feature points of P2 and P4 are used as the control points in the original image. P2 is used as the control point for left hand image while P4 as the control point for right
INTERNATIONAL JOURNAL OF CIRCUITS, SYSTEMS AND SIGNAL PROCESSING Volume 11, 2017
ISSN: 1998-4464 135

hand image. Image registration is considered successful if the enhanced image coordinates are accurately aligned onto the original coordinates of ROI in the reference image. Fig. 12 gives an example where coordinates of enhanced image, a, b, c and d are aligned and mapped onto the coordinates of reference image, P1, P2, P3 and P4, respectively.
Fig. 12 Image registration of enhanced ROI onto a reference ROI.
After image registration, a registered image is then
projected onto a patient’s hand. In this work, the hand shape and feature points are used as the basis to align the registered image accurately onto its original hand image. Fig. 13 displays an illustrative example where the coordinates of registered image, fa1, fw2, fw4 and fa2 are aligned and mapped onto the coordinates of original hand image, e, f , g and h, respectively. (i.e. vein pixels) which have been correctly identified against the entire region of the truth image. Each truth image is generated based on its grayscale image.
Fig. 13 Image projection of registered image onto its original hand
image.
VII. EVALUATION OF ENHANCED IMAGE The performance of proposed grayscale and binary enhancement approaches have been quantitatively evaluated by examining an image’s sensitivity. Sensitivity is often used to evaluate a clinical test [31]. For an enhanced binary image, sensitivity measures the proportion of positives or foregrounds. In this case, background pixels are false negatives. Sensitivity is calculated a [31]:
NegativesFalsePositivesTruePositivesTrueySensitivit+
= (11)
where true positive is the number of foreground pixels correctly classified as foreground and false negative is the number of foreground pixels incorrectly classified as background. Sensitivity has a range of [0, 1]. Higher sensitivity values signify good accuracy of classification.
Sensitivity is used to evaluate the two proposed work stages, grayscale enhancement (i.e. CLAHE with FHH) against four commonly used contrast enhancement methods: LCS, HE, and CLAHE and binary enhancement compared to the existing binarization methods; BMF, MNR and a combination of both. Standard deviation is used to evaluate a total variation of enhanced image from its truth image.
The standard deviation value of truth and enhanced images are calculated using MATLAB standard deviation function, std2. Then, the standard deviation values of truth and enhanced images are compared. A small difference of standard deviation value between truth and enhanced images signifies good overall performance of the proposed enhancement method.
VIII. RESULTS AND DISCUSSION The performance of grayscale enhancement evaluates the
ability of a method to provide high contrast between vein patterns and the background. Fig. 14(b) to Figure 14(e) show the performance of the LCS, HE, CLAHE, and CLAHE with FHH over a low contrast hand vein image. Visually, it can be seen that the output image from CLAHE with FHH (Fig. 14(e)) has the best enhancement throughout all vein regions as the contrast of vein texture and background is the largest. The vein outlines are the clearest and continuous for the proposed method. By producing higher contrast fluctuation with minimum unwanted artifacts, the proposed method is capable of strong contrast enhancement around vein patterns present in the input image. Hence, it allows easier and more effective vein segmentation.
In order to verify the effectiveness of segmentation from grayscale enhancement image, local threshold has been applied onto the images. As depicted in Fig. 14(f) to Fig. 14(i), it seems that vein patterns imaged by the proposed method (see Fig. 14(i)) reveal clearest vein patterns. However, there is still much noise in these binarized images and thus, binary enhancement has been employed.
INTERNATIONAL JOURNAL OF CIRCUITS, SYSTEMS AND SIGNAL PROCESSING Volume 11, 2017
ISSN: 1998-4464 136
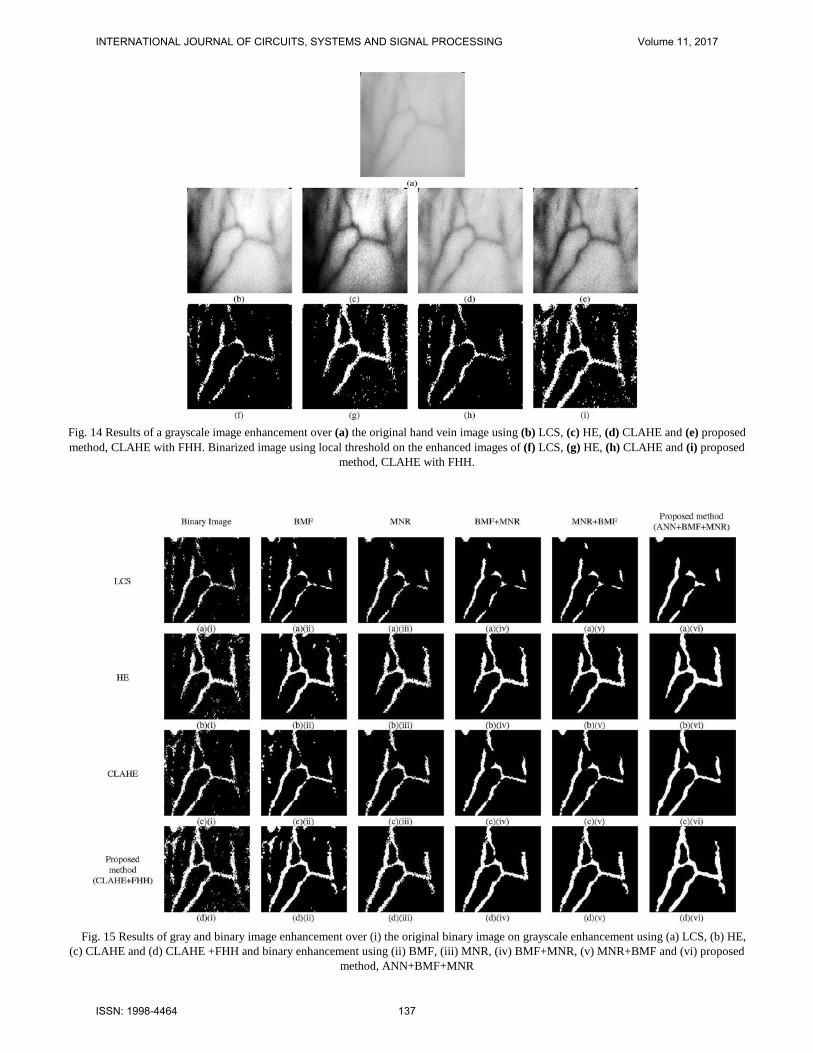
Fig. 14 Results of a grayscale image enhancement over (a) the original hand vein image using (b) LCS, (c) HE, (d) CLAHE and (e) proposed method, CLAHE with FHH. Binarized image using local threshold on the enhanced images of (f) LCS, (g) HE, (h) CLAHE and (i) proposed
method, CLAHE with FHH.
Fig. 15 Results of gray and binary image enhancement over (i) the original binary image on grayscale enhancement using (a) LCS, (b) HE,
(c) CLAHE and (d) CLAHE +FHH and binary enhancement using (ii) BMF, (iii) MNR, (iv) BMF+MNR, (v) MNR+BMF and (vi) proposed method, ANN+BMF+MNR
INTERNATIONAL JOURNAL OF CIRCUITS, SYSTEMS AND SIGNAL PROCESSING Volume 11, 2017
ISSN: 1998-4464 137

The performance of binary enhancement is analyzed both quantitatively and qualitatively, by comparing binarized image from the proposed method, ANN+BMF+MNR to BMF, MNR, BMF+MNR and MNR+BMF. The results are as shown in Fig. 15. Based on visual perception, the proposed method produces the clearest vein patterns than other methods because it is able to reveal the vein patterns more accurately for most graylevel enhancement images.
The results in Fig. 15 are also supported by the sensitivity
values depicted in Table 1. The sensitivity values for all binary enhancement methods show some increments after application of the proposed method compared to a binary image.
Nevertheless, as can be seen, after applying the proposed three-level binary enhancement, CLAHE with FHH has the highest sensitivity value compared to the other enhancement methods. Fig. 16 is additional result of CLAHE+FHH using different methods of binary enhancement.
Table 2 shows the average sensitivity value obtained from
10 test images. This table clearly shows that the proposed method is able to produce highest sensitivity for all tested images as compared to the other binary enhancement methods. As can be observed, the proposed method has increased the sensitivity value of the original image to 10.66%. These results complement the findings obtained graphically in Fig. 15.
TABLE 1. COMPARISON OF SENSITIVITY VALUE AMONG THE PROPOSED METHOD AND OTHER BINARY ENHANCEMENT METHODS
Binary BMF MNR BMF+ MNR
MNR+ BMF
ANN+BMF+MNR
LCS 0.4647 0.4336 0.4233 0.4131 0.4171 0.4976 HE 0.6762 0.6926 0.6553 0.6817 0.6824 0.7556
CLAHE 0.6700 0.6723 0.6396 0.6484 0.6572 0.7542 CLAHE+FHH 0.8485 0.8899 0.8427 0.8584 0.8844 0.9627
TABLE 2. COMPARISON OF SENSITIVITY VALUE AMONG THE PROPOSED METHOD AND OTHER BINARY ENHANCEMENT METHODS Original
Binary image BMF MNR BMF+
MNR MNR+ BMF
ANN+BMF+MNR
1 0.8485 0.8899 0.8427 0.8584 0.8844 0.9627 2 0.7704 0.7973 0.7447 0.7761 0.7752 0.8832 3 0.7422 0.7479 0.7002 0.7163 0.7151 0.8278 4 0.7004 0.6990 0.6634 0.6737 0.6718 0.8097 5 0.6730 0.6899 0.6263 0.6477 0.6492 0.8151 6 0.7807 0.7988 0.7552 0.7751 0.7751 0.9171 7 0.7715 0.7749 0.7152 0.7273 0.7239 0.8674 8 0.7644 0.7781 0.7664 0.7650 0.7650 0.8407 9 0.7317 0.7297 0.7593 0.7159 0.7798 0.8273
10 0.6585 0.6566 0.6069 0.5745 0.6196 0.7567 Average 0.7441 0.7562 0.7158 0.7230 0.7339 0.8508
Fig. 16 Results of binary enhancement using (ii) BMF, (iii) MNR, (iv) BMF+MNR, (v) MNR+BMF and (vi) proposed method,
ANN+BMF+MNR.
INTERNATIONAL JOURNAL OF CIRCUITS, SYSTEMS AND SIGNAL PROCESSING Volume 11, 2017
ISSN: 1998-4464 138

Table 3 shows the average standard deviation values obtained from 10 test images. The results in the table shows that all binary enhancement methods are able to maintain the standard deviation values closer to the truth image. However, the proposed method produced the lowest average of standard deviation values. This means that the proposed method does
not deviate far from the truth image. Figure 17 shows example results of three enhanced ROI
image which are registered onto subjects’ hands. As can been seen, the enhanced ROI image can be successfully registered onto the original coordinates of the ROI using P2 and P4 as the control points.
TABLE 3. COMPARISON OF STANDARD DEVIATION VALUES AMONG THE PROPOSED METHOD AND OTHER BINARY ENHANCEMENT METHODS
Standard Deviation of Truth Image
Δ Standard Deviation
BMF MNR BMF+ MNR MNR+ BMF ANN+BMF+MNR
1 0.3088 0.0352 0.0011 0.0028 0.0019 0.0392 2 0.2936 0.0326 0.0208 0.0203 0.0205 0.0163 3 0.3759 0.0173 0.0389 0.0388 0.0393 0.0024 4 0.2929 0.0111 0.0193 0.0217 0.0217 0.0016 5 0.3508 0.0285 0.0287 0.0281 0.0279 0.0116 6 0.3275 0.0286 0.0253 0.0241 0.0241 0.0109 7 0.3549 0.0054 0.0168 0.0248 0.0180 0.0071 8 0.2458 0.0542 0.0367 0.0359 0.0359 0.0739 9 0.2818 0.0087 0.0155 0.0061 0.0132 0.0283
10 0.4276 0.0349 0.0576 0.0689 0.586 0.0148 Average (%) 2.5200 2.652 2.7600 2.7470 2.0160
(a) (b)
(c)
Fig. 17 Three examples of enhanced vein patterns images successfully registered onto referenced ROI
INTERNATIONAL JOURNAL OF CIRCUITS, SYSTEMS AND SIGNAL PROCESSING Volume 11, 2017
ISSN: 1998-4464 139

Fig. 18 shows real results of hand vein images which are projected onto subjects’ hands. As can be seen, the enhanced vein images can be successfully projected on and aligned with their corresponding subjects’ hands. Once projection is successful detected, cropped and IV access can be easily carried out.
IX. CONCLUSION This paper presents a CLAHE with FHH methods for
grayscale vein image enhancement. It also presents a combination of three approaches; ANN pixel corrector, BMF and MNR, for binary image enhancement. The numerical
results explicate that the proposed grayscale image enhancement and binary image enhancement methods are able to successfully increase the binary hand vein image contrast. The clearly exposed vein patterns, when projected back onto patient’s hand is able to aid peripheral IV access.
In future works, ANN method could be improved towards producing better intelligent corrector for a binary vein pixel. For example, instead of combining the ANN method with the BMF and MNR, with the appropriate and precise features, the binary enhancement can be done using ANN pixel corrector only.
(a) (b)
(c)
Fig. 18 Samples of projected vein pattern images onto subjects’ hands.
INTERNATIONAL JOURNAL OF CIRCUITS, SYSTEMS AND SIGNAL PROCESSING Volume 11, 2017
ISSN: 1998-4464 140

[1] M. Sebbane, P.G. Claret, S. Lefebvre, G. Mercier, J. Rubenovitch, R. Jreige, J.J. Eledjam, J.E. Coussaye, “Predicting peripheral venous access difficulty in the emergency department using body mass index and a clinical evaluation of venous accessibility”, In The Journal of Emergency Medicine, vol. 44, pp. 299-305, 2013.
[2] M.J. Kim, J.M.Park, N.Rhee, S.M Je, S.H.Hong, Y.M.Lee, S.P.Chung, S.H.Kim, “Efficacy of VeinViewer in pediatric peripheral intravenous access: a randomized controlled trial”, European Journal of Pediatrics, vol. 171, pp. 1121—1125, 2012.
[3] J. Matthew Fields, Nicole E. Piela, Arthur K. Au, Bon S. Ku, “Risk factors associated with difficult venous access in adult ED patients”, In The American Journal of Emergency Medicine, vol. 32, pp. 1179-1182, 2014.
[4] Medical Encyclopedia, available on: http://www.nlm.nih.gov/medlineplus/ency/article/007245.htm. Assessed 1 July 2009
[5] R. Drga, D. Janáčová, “Infrared radiation, sensor, source and infrared camera measurement,” International Journal of Circuits, Systems and Signa processing, vol. 5, pp. 581-588, 2011.
[6] J. C. Graaff, N.J. Cuper, R. A. Mungra, K. Vlaardingerbroek, S.C. Numan, C. J. Kalkman, “Near‐infrared light to aid peripheral intravenous cannulation in children: a cluster randomised clinical trial of three devices”, Anaesthesia, vol. 68, pp. 835-845, 2013.
[7] M. A. Calfon, C. Vinegoni, V. Ntziachristo and F. A. Jaffer, “Intravascular near-infrared fluorescence molecular imaging of atherosclerosis: towards coronary arterial visualization of biologically high-risk plaques,” J. Biomed. Opt., vol. 15, pp. 011107, 2010.
[8] K. Singh and R. Kapoo, “Image enhancement using Exposure based Sub Image Histogram Equalization”, Pattern Recognition Letters, vol. 36, pp. 10-14, 2014.
[9] G. Hong-Seng, T. S. Tan, A. K. Ahmad Helmy, K. A. Sayuti, A. K. Rafiq, T. Weng-Kit, W. Liang-Xuan, K. T. Chaudhary, J. Ali and P. P. Yupapin , “Medical image visual appearance improvement using bihistogram bezier curve contrast enhancement: data from the osteoarthritis initiative,”The Scientific World Journal, vol. 2014, pp. 1-13, 2014.
[10] A. Kumar, and K. V. Prathyusha, “Personal authentication using hand vein triangulation and knuckle shape,” IEEE Trans. Image Process., vol. 18, pp. 2127-2136, 2009.
[11] M. A. Bennet , J. S. Poomathi , C. Kalpana , S. S. Priya, “Improvement of automatic hemorrhages detection methods in retinal imaging and image analysis”, Journal of Multidisciplinary Science and Technology, vol. 8, pp. 59-67, 2017.
[12] A. W. Setiawan, T. R. Mengko, O. S. Santoso and A. B. Suksmono, "Color retinal image enhancement using CLAHE," International Conference on ICT for Smart Society, Jakarta, 2013, pp. 1-3.
[13] Y. Zhang, X. Wu, S. Lu, H. Wang, P. Phillips, S. Wang, “Smart detection on abnormal breasts in digital mammography based on contrast-limited adaptive histogram equalization and chaotic adaptive real-coded biogeography-based optimization”, SIMULATION, vol. 92, pp. 873-885, 2016.
[14] Siddharth,R. Gupta, and V. Bhateja, “A log-ratio based unsharp masking (UM) approach for enhancement of digital mammograms”, Proceedings of the CUBE International Information Technology Conference, 2012, pp. 26-31.
[15] M. Trentacoste, R. Mantiuk, W. Heidrich, F. Dufrot, “Unsharp Masking, Countershading and Halos: Enhancements or Artifacts?”, Computer Graphics Forum,vol. 31, pp. 1467-8659, 2012
[16] J. Zhao, H. Tian, W. Xu and X. Li, “A new approach to hand vein image enhancement,” in Second International Conference on Intelligent Computation Technology and Automation, 2009, pp. 499-501.
[17] M. Shahin, A. Badawi, and M. Kamel, “Biometric authentication using fast correlation of near infrared hand vein patterns,” International Journal of Biological and Medical Sciences, vol. 2, pp. 141-148, 2007.
[18] Y. Ding, D. Zhuang and K. Wang, “A study of hand vein recognition method,” in Proceedings of the IEEE International Conference on Mechatronics & Automation, 2005, pp. 2106-2110.
[19] H. Lee and Y.P. P. Chen, “Image based computer aided diagnosis system for cancer detectio”, Expert Systems with Applications, vol. 42, pp. 5356 - 5365, 2015.
[20] A. P.James and B. V. Dasarath, “Medical image fusion: A survey of the state of the art”, Information Fusion, vol. 19, pp. 4 - 19, 2014.
[21] X. Yan, Y. Song, and X. Wei, “Parallel sub-neural network system for hand vein pattern recognition,” Chinese Optics Letters, vol. 9, pp. 051002, 2011.
[22] K. V. Kale and Y. S. Rode and M. M. Kazi and S. B. Dabhade and S. V. Chavan, “Multimodal Biometric System Using Fingernail and Finger Knuckle”, International Symposium on Computational and Business Intelligence, pp. 279-283, 2013.
[23] E. D. Pisano, E. B. Cole, B. M. Hemminger, M. J. Yaffe, S. R. Aylward, A. D. A. Maidment, R. E. Johnston, W. B. Williams, L. T. Niklason,E. F. Conant, L. L. Fajardo, D. B. Kopans, M. E. Brown, and S. M. Pizer, “Image processing algorithms for digital mammography: a pictorial essay,” Radiographics, vol. 20, pp. 1479-1491, 2000.
[24] H. R. Tizhoosh and M. Fochem, “Image enhancement with fuzzy histogram hyperbolization,” Proceeding of EUFIT, 3, 1995, pp. 1695-1698.
[25] H. R. Tizhoosh, G. Krel and B. Muchaelis, “Locally adaptive fuzzy image enhancement,” Proceedings of the International Conference on Computational Intelligence, Theory and Applications, 1997, pp. 272-276
[26] R. C. Gonzalez, and R. E. Woods, Digital Image Processing, Prentice Hall, Upper Saddle River, NJ, USA, 2010.
[27] A. Yuksel, L. Akarun and B. Sankur, “Biometric identification through hand vein patterns,” International Workshop in Emerging Techniques and Challenges for Hand-Based Biometrics (ETCHB), 2010, pp. 1-6
[28] R. Fisher, S. Perkins, A. Walker and E. Wolfart. (2003) Adaptive Thresholding. [Online].
[29] A. G. Lalkhen and A. McCluskey, “Clinical tests: sensitivity and specificity,” British Journal Anaesthesia, vol. 8, pp. 221-223, 2008.
[30] B. Zitova and J. Flusser,” Image registration methods,” Image vision and Computing, vol. 21, pp. 977-1000.
Marlina Yakno received her BEng in Electrical and Electronic Engineering from the Universiti Tenaga Nasional, Malaysia in 2007 and MSc from the Universiti Sains Malaysia in 2013. She is currently a lecturer in the Faculty of Electrical and Electronic Engineering, Universiti Malaysia Pahang. Her research interests include computer vision and computational intelligence. Junita Mohamad-Saleh received her BSc in Computer Engineering from the Case Western Reserve University, Ohio, USA in 1994, MSc from the University of Sheffield, UK, in 1996, and PhD from the University of Leeds, UK, in 2002. She is currently an associate professor in the School of Electrical and Electronic Engineering, Universiti Sains Malaysia. Her research interests include computational intelligence, tomographic imaging, and soft computing. Bakhtiar Affendi Rosdi received his BEng, MEng, and DEng in Electrical and Electronic Engineering from Tokyo Institute of Technology, Tokyo, Japan in 1999, 2004, and 2007, respectively. He is currently a senior lecturer in the School of Electrical and Electronic Engineering, Universiti Sains Malaysia. His research interests are LSI implementation of pattern recognition and image processing algorithms.
INTERNATIONAL JOURNAL OF CIRCUITS, SYSTEMS AND SIGNAL PROCESSING Volume 11, 2017
ISSN: 1998-4464 141