graph of a linear equation horizontal lines
TRANSCRIPT

Learning target:
• Students graph linear equations in standard form, ax + by = c (a or b = 0), that produce a horizontal or a vertical line.

• Progress reports sent out
• Grades will be updated within the next couple of days

Graph the linear equation x = -2.
x y

Graph the linear equation x = 3.
x y

What will the graph of x = 0 look like?

We are going to take a look at a linear equation in two variables ax + by = c, where a = 0, b = 1, and c is a constant.
Let’s pick a number for c, let’s say that c = 2. Then we have the following equation: 0 ⋅ x + 1 ⋅ y = 2

0 ⋅ x + 1 ⋅ y = 2
What will happen if we pick 7 for y?
What y value makes this equation true?

0 ⋅ x + 1 ⋅ y = 2
If x = 5, what value does y have? Explain.
If x = -5, what value does y have? Explain.
If x = 1
2, what value does y have? Explain.

0 ⋅ x + 1 ⋅ y = 2
Do you see a pattern?
What do you think the graph of y=2 will look like?
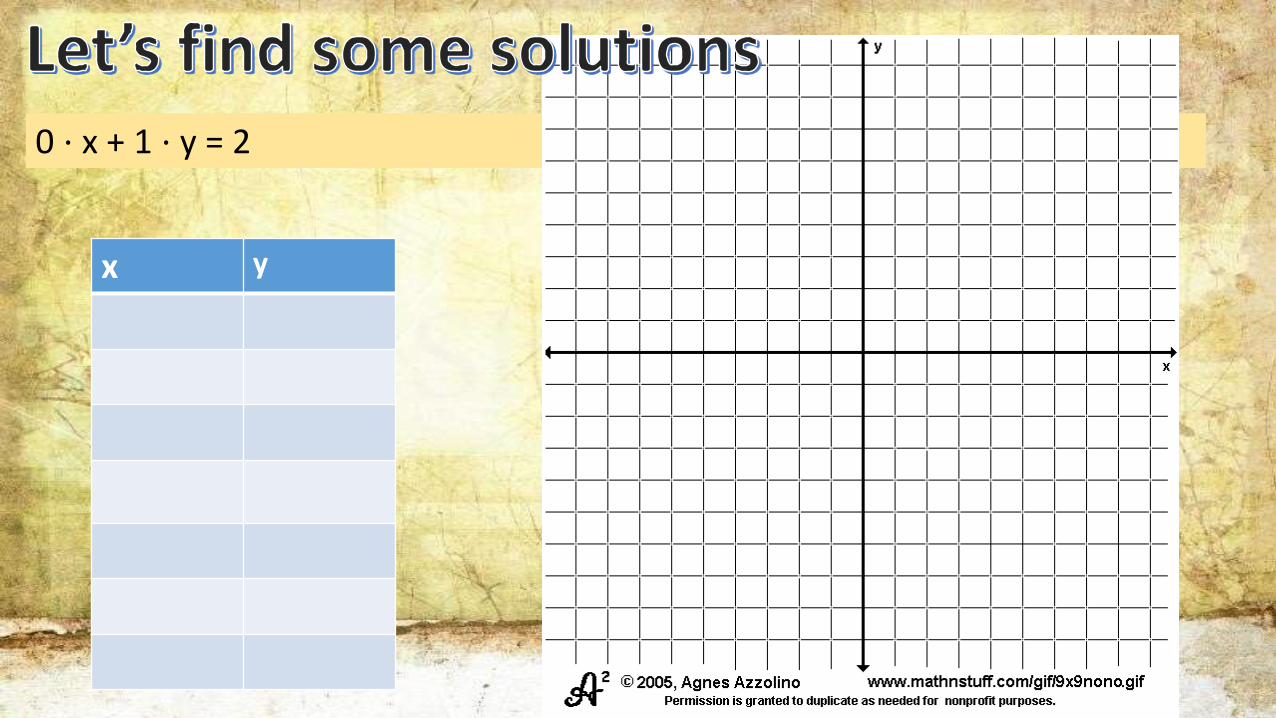
0 ⋅ x + 1 ⋅ y = 2
x y

In summary, the graph of the equation ax + by = c, where a = 0, b = 1, and c = 2, is a horizontal line passing through point (0,2).
The previous situation is not unique. That is, in the equation ax + by = c, we chose the value for c to be 2. The same reasoning can be used for any value of c. If we chose c to be 6, what do you think the graph would look like?
If we chose c to be -1/2, what do you think the graph would look like?

Notice that the equation 0 ⋅ x + 1 ⋅ y = c is equivalent to x = c. Therefore, we can make the following conclusion in the form of a theorem:
THEOREM: The graph of x = c is the vertical line passing through (0, c), where c is a constant.
*We can also say that there is only one line with the equation y = c whose graph is parallel to the x-axis that goes through the point (0, c).

Graph the linear equation y = -2.
x y

Graph the linear equation y = 3.
x y
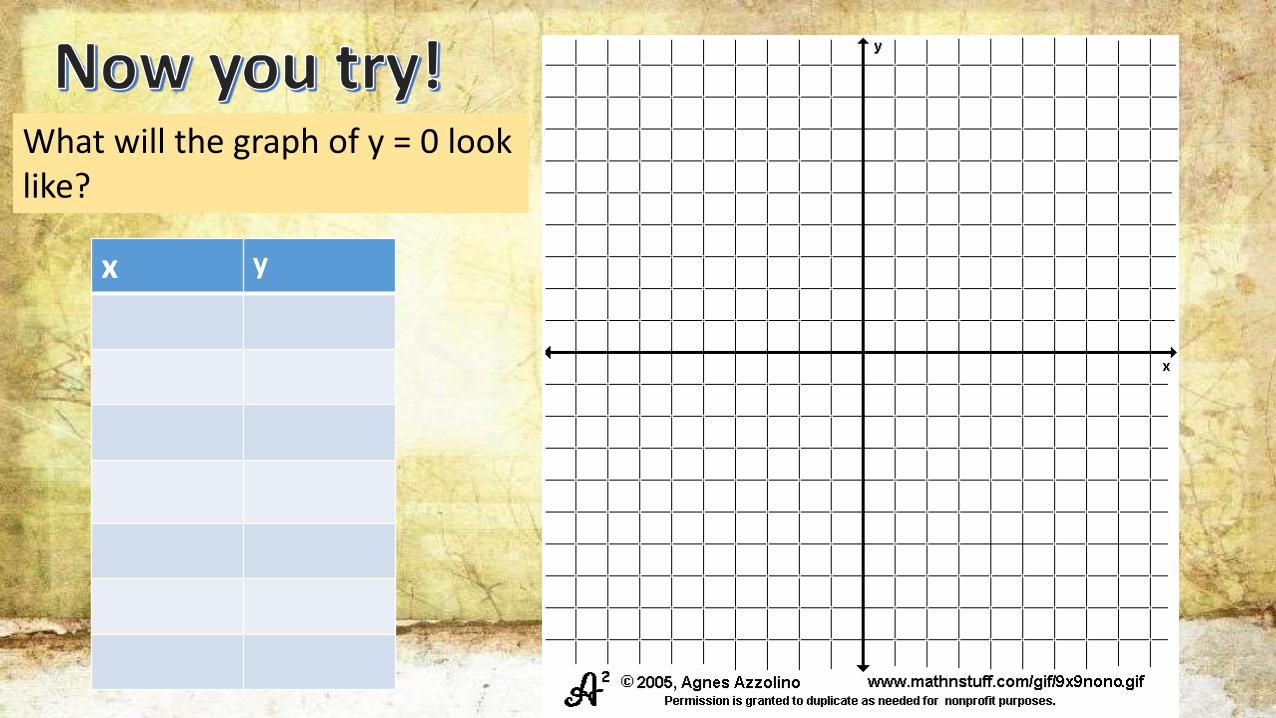
What will the graph of y = 0 look like?
x y

• The graph of the linear equation in two variables ax + by = c, where a = 1 and b = 0, is the graph of the equation x = c. The graph of x = c is the vertical line that passes through the point (c, 0).
• The graph of the linear equation in two variables ax + by = c, where a = 0 and b = 1, is the graph of the equation y = c. The graph of y = c is the horizontal line that passes through the point (0, c).
What now???• Graph of a Linear Equation – Horizontal & Vertical Lines – Practice
Problems