biostatistics - acads – hassle mabuhay · •pictogram / cartogram •cluster diagram ....
TRANSCRIPT
Biostatistics
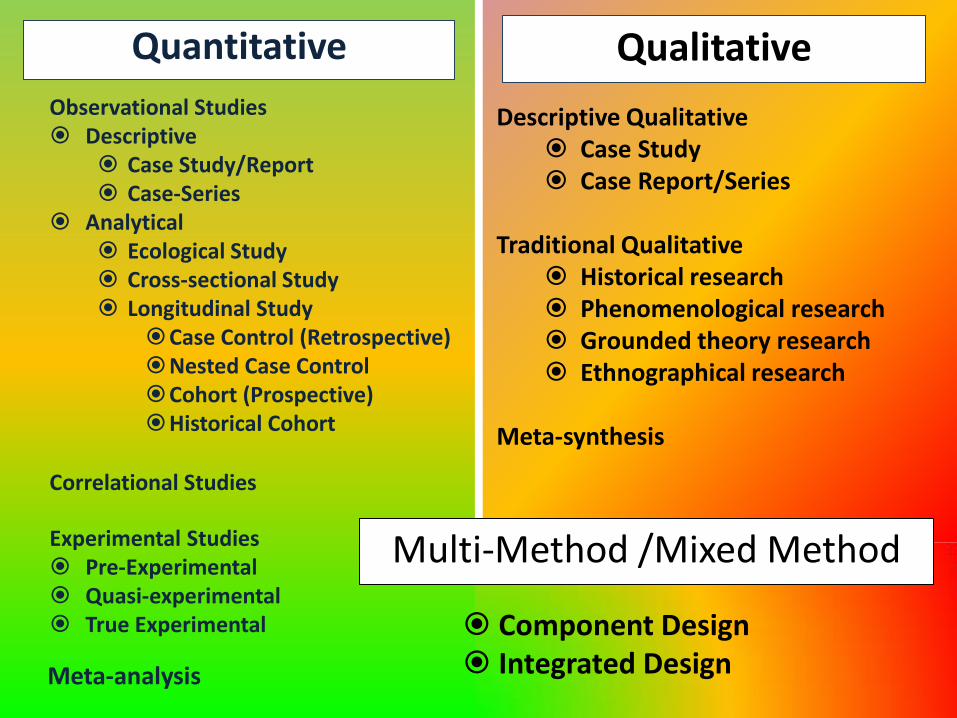
Quantitative Qualitative
Observational Studies Descriptive
Case Study/Report Case-Series
Analytical Ecological Study Cross-sectional Study Longitudinal Study
Case Control (Retrospective) Nested Case Control Cohort (Prospective) Historical Cohort
Descriptive Qualitative Case Study Case Report/Series
Traditional Qualitative
Historical research Phenomenological research Grounded theory research Ethnographical research
Meta-synthesis
Experimental Studies Pre-Experimental Quasi-experimental True Experimental
Meta-analysis
Correlational Studies
Multi-Method /Mixed Method
Component Design Integrated Design
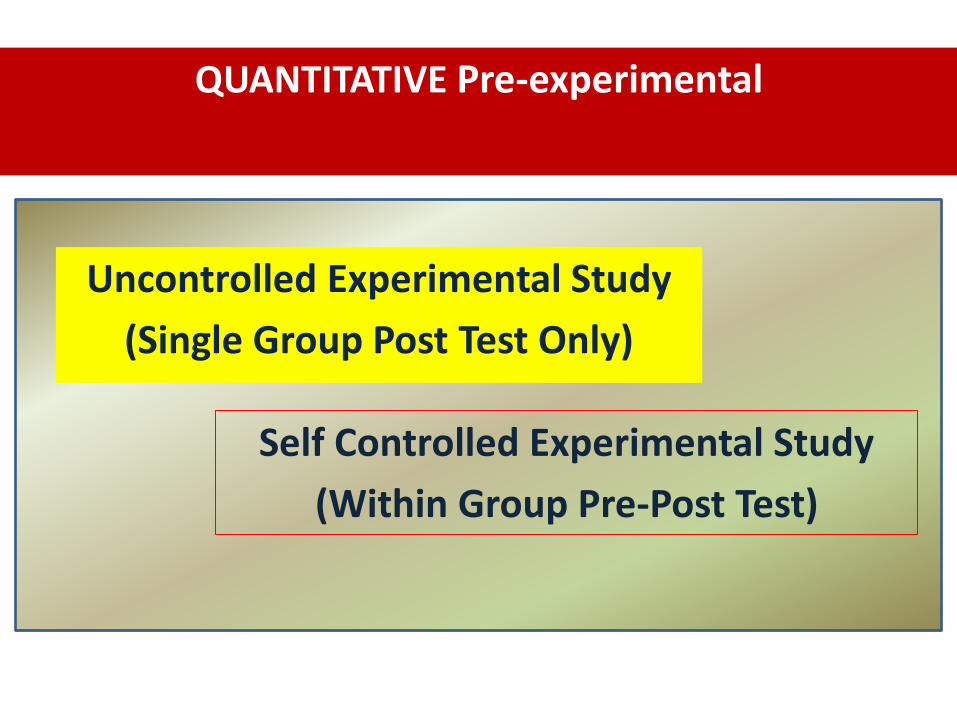
QUANTITATIVE Pre-experimental
Uncontrolled Experimental Study
(Single Group Post Test Only)
Self Controlled Experimental Study
(Within Group Pre-Post Test)
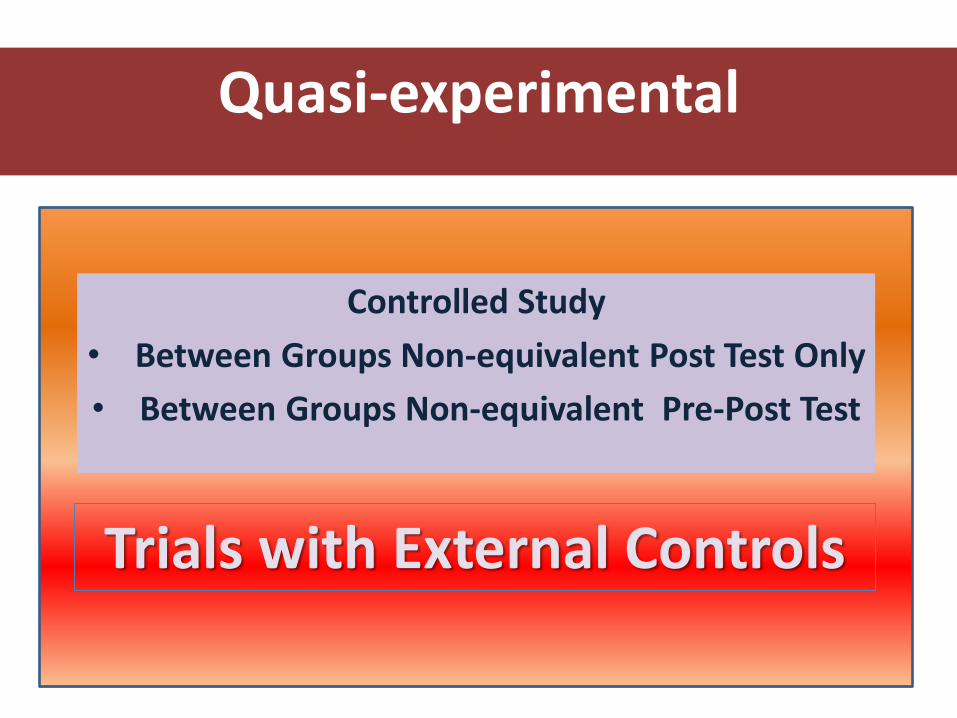
Quasi-experimental
Controlled Study
• Between Groups Non-equivalent Post Test Only
• Between Groups Non-equivalent Pre-Post Test
Trials with External Controls
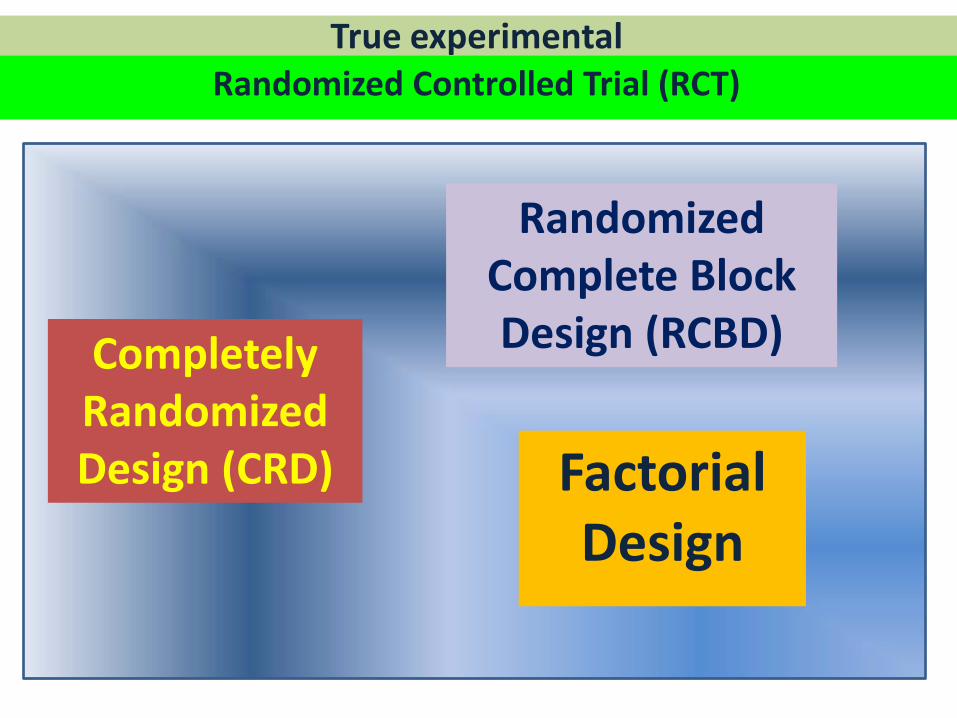
Factorial Design
True experimental Randomized Controlled Trial (RCT)
Completely Randomized Design (CRD)
Randomized Complete Block Design (RCBD)

Onset of Study
Time
Sequential Control (Crossover Design)
X X X X
Intervention
X X X X Washout
period
Experimental subjects
Controls

Pre Clinical Trial
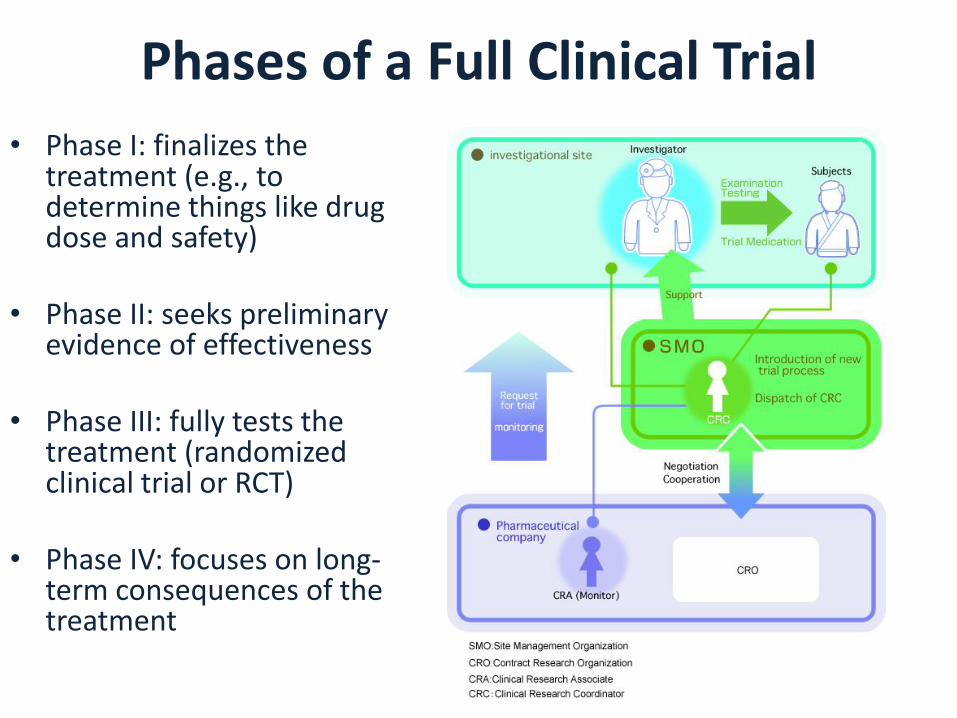
Phases of a Full Clinical Trial
• Phase I: finalizes the treatment (e.g., to determine things like drug dose and safety)
• Phase II: seeks preliminary evidence of effectiveness
• Phase III: fully tests the treatment (randomized clinical trial or RCT)
• Phase IV: focuses on long-term consequences of the treatment

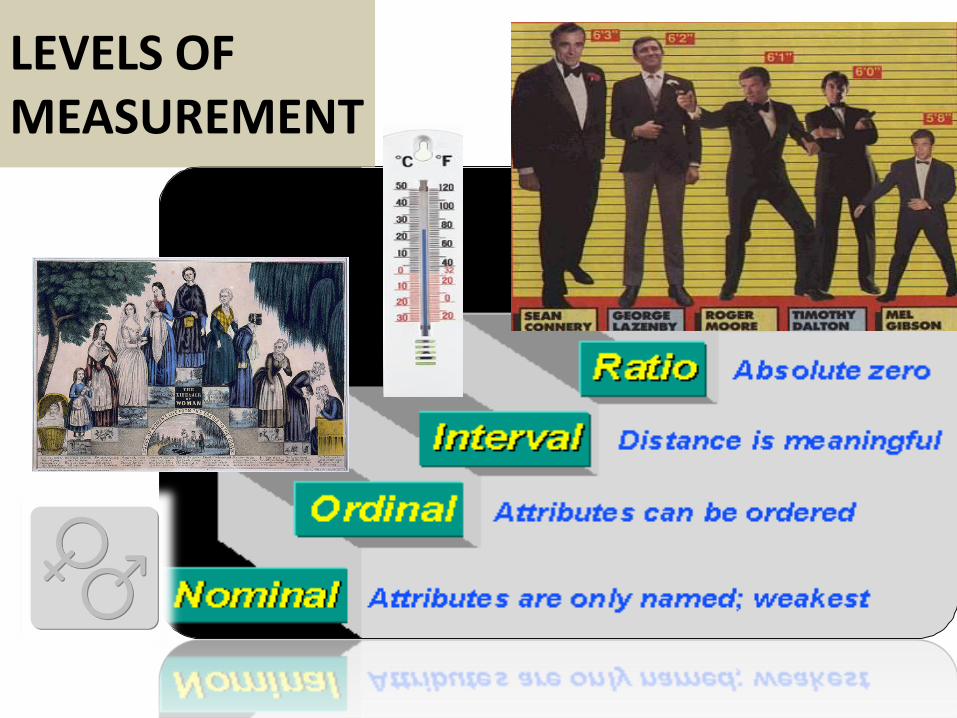
LEVELS OF MEASUREMENT
DESCRIPTIVE STATISTICS
• Descriptive Measures
• Tabular Presentation
• Graphical Presentation
• Textual Presentation
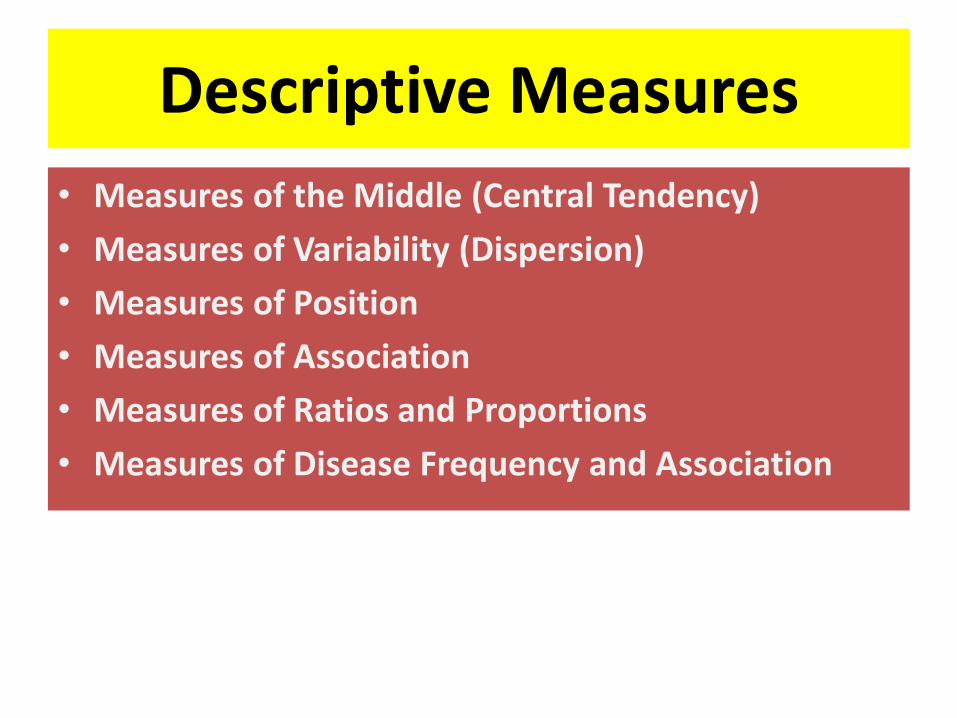
Descriptive Measures
• Measures of the Middle (Central Tendency)
• Measures of Variability (Dispersion)
• Measures of Position
• Measures of Association
• Measures of Ratios and Proportions
• Measures of Disease Frequency and Association
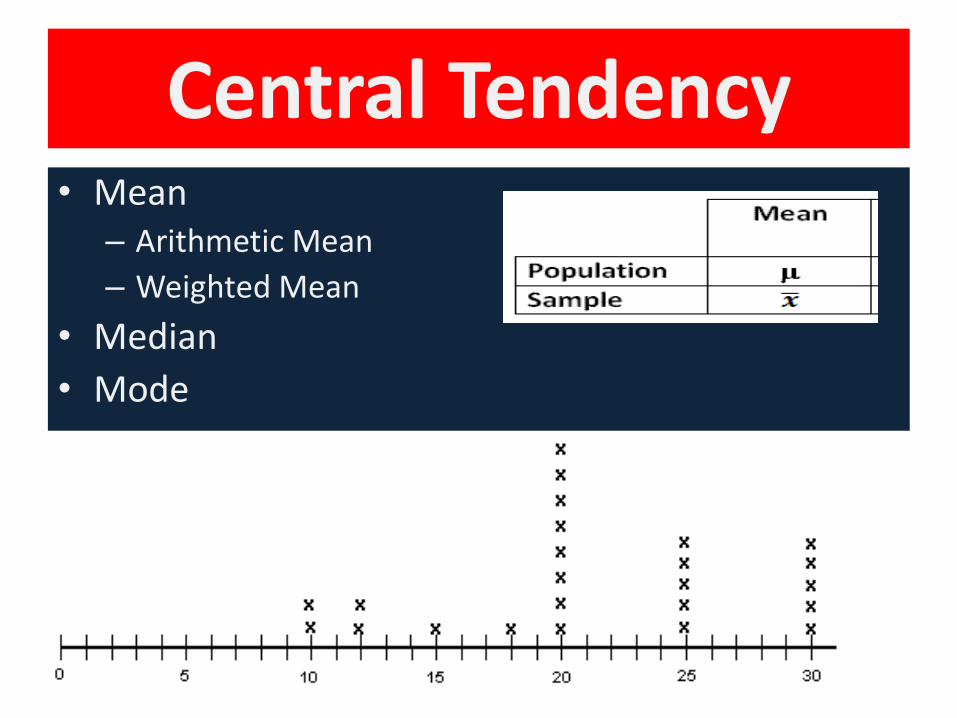
Central Tendency • Mean
– Arithmetic Mean
– Weighted Mean
• Median
• Mode
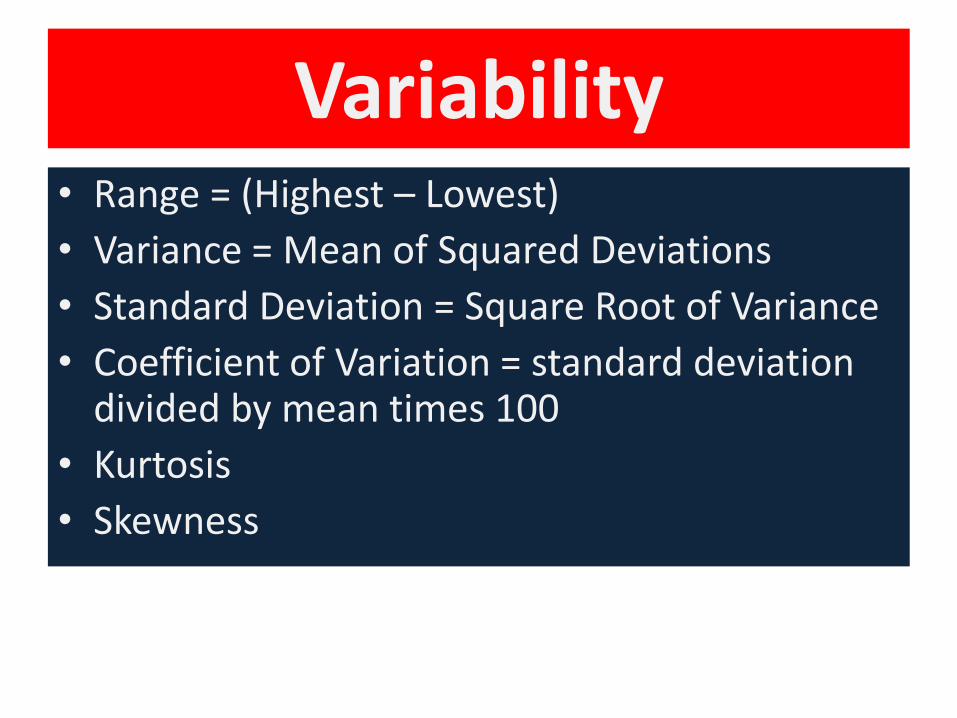
Variability • Range = (Highest – Lowest)
• Variance = Mean of Squared Deviations
• Standard Deviation = Square Root of Variance
• Coefficient of Variation = standard deviation divided by mean times 100
• Kurtosis
• Skewness

KURTOSIS
Position • Percentile
• Deciles
• Quartile
• Z score (Standard score)
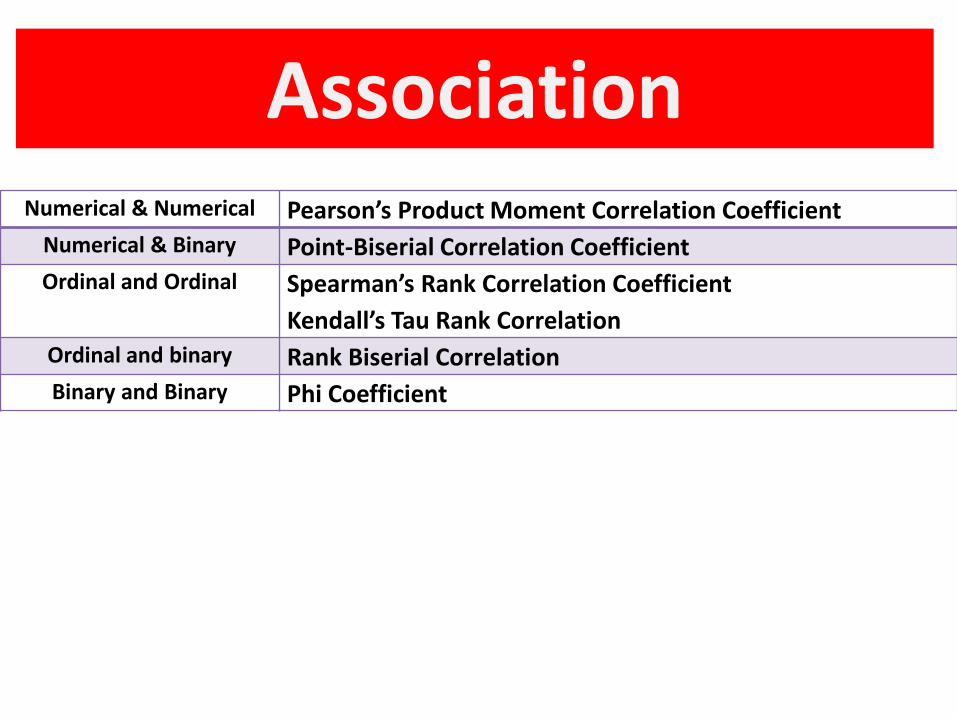
Association Numerical & Numerical Pearson’s Product Moment Correlation Coefficient
Numerical & Binary Point-Biserial Correlation Coefficient
Ordinal and Ordinal Spearman’s Rank Correlation Coefficient
Kendall’s Tau Rank Correlation
Ordinal and binary Rank Biserial Correlation
Binary and Binary Phi Coefficient
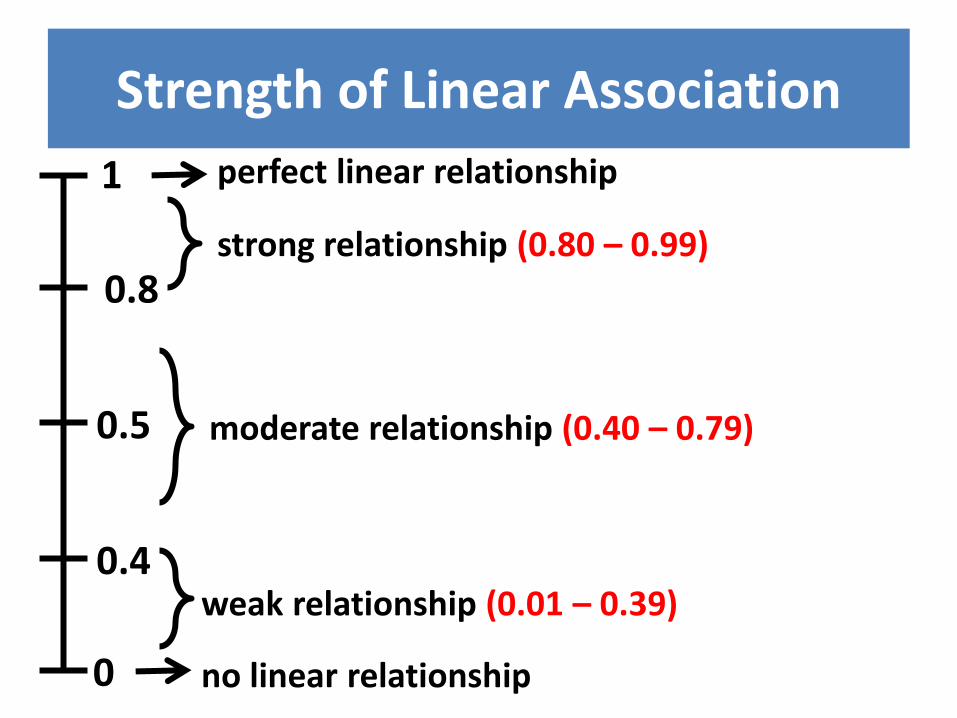
Strength of Linear Association
0
1
0.5
0.4
0.8
weak relationship (0.01 – 0.39)
strong relationship (0.80 – 0.99)
moderate relationship (0.40 – 0.79)
perfect linear relationship
no linear relationship
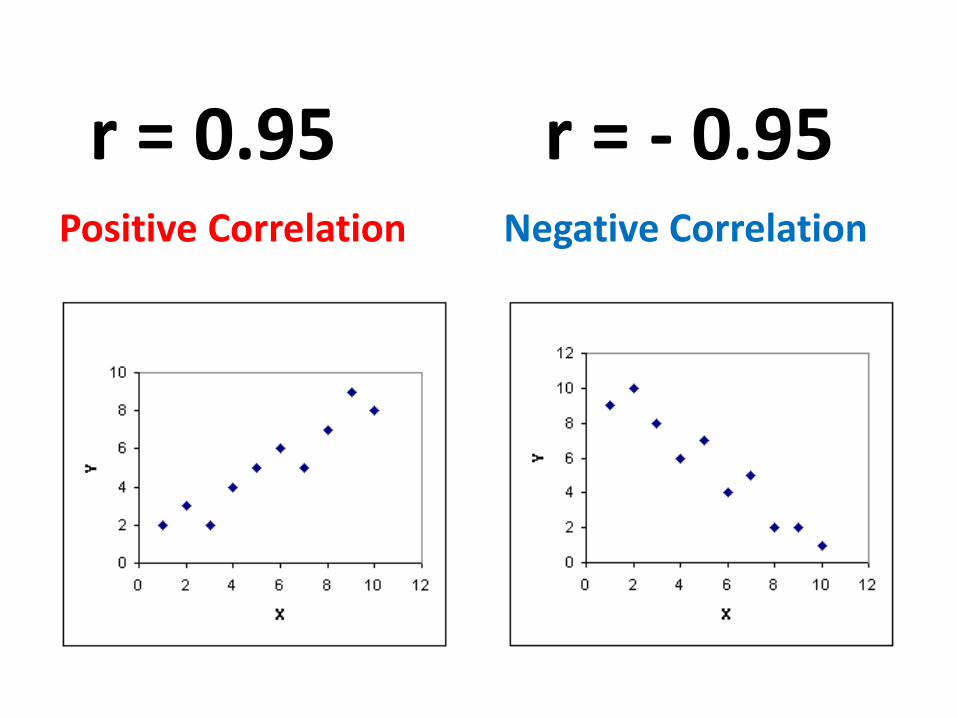
Positive Correlation
Negative Correlation
r = 0.95 r = - 0.95
Ratios and Proportions • Proportions
• Percentage
• Ratios
• Rates
Disease Frequency • Frequency of Occurrence
• Incidence Rate
• Prevalence Rate
• Risk Ratios
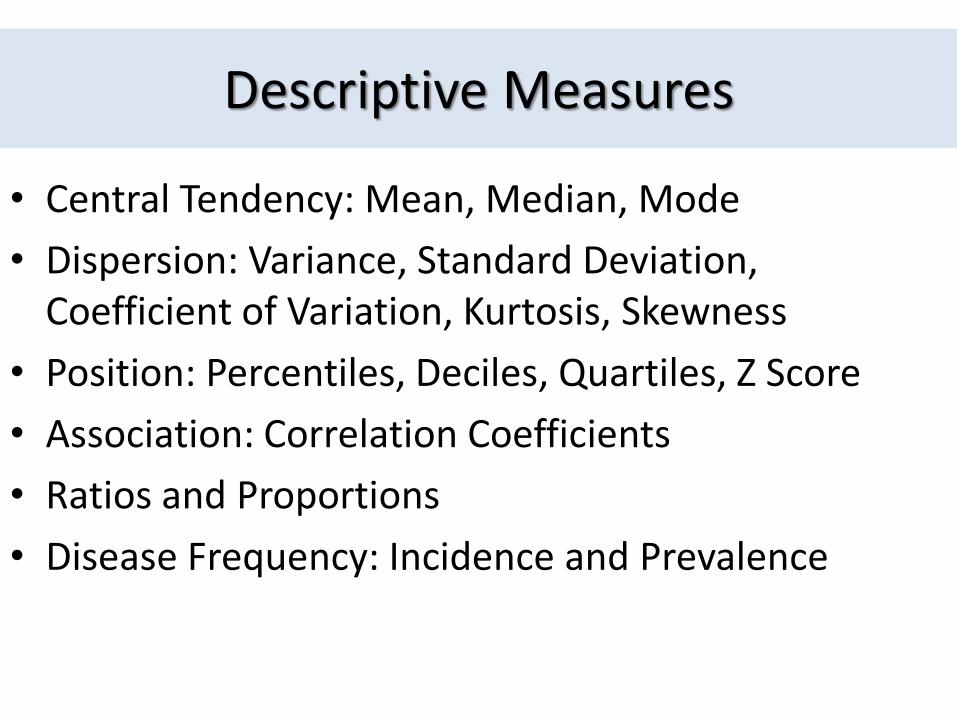
Descriptive Measures
• Central Tendency: Mean, Median, Mode
• Dispersion: Variance, Standard Deviation, Coefficient of Variation, Kurtosis, Skewness
• Position: Percentiles, Deciles, Quartiles, Z Score
• Association: Correlation Coefficients
• Ratios and Proportions
• Disease Frequency: Incidence and Prevalence
tables
• Simple Frequency Tables • Contingency Table / Cross-Tabulation • Dummy Tables • Master Tables • Summary Tables
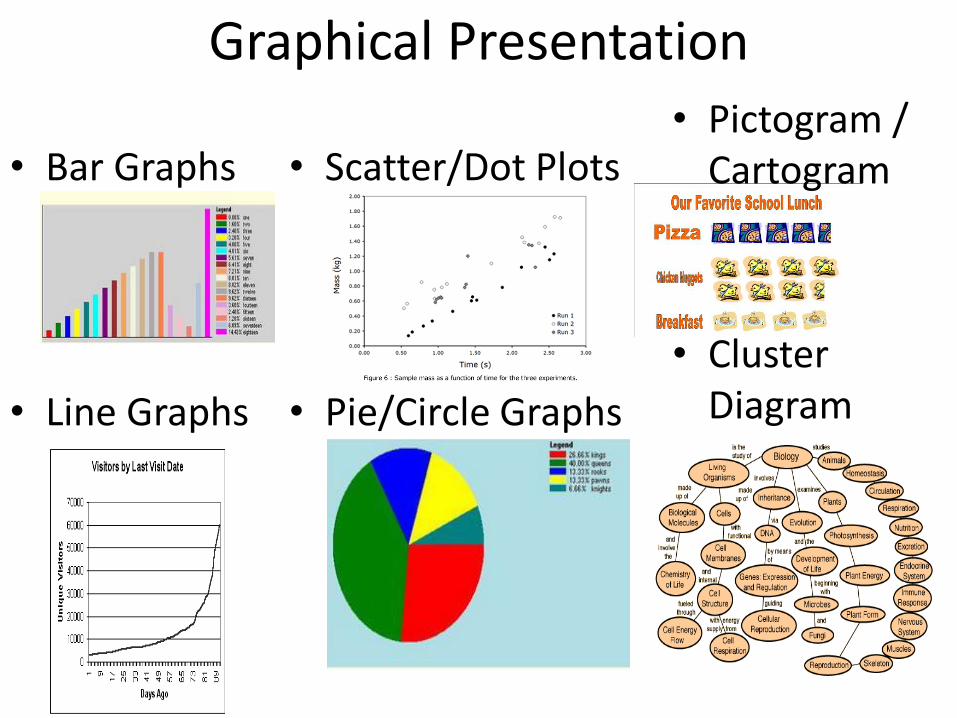
Graphical Presentation
• Bar Graphs
• Line Graphs
• Scatter/Dot Plots
• Pie/Circle Graphs
• Pictogram / Cartogram
• Cluster Diagram

Horizontal Bar Graph
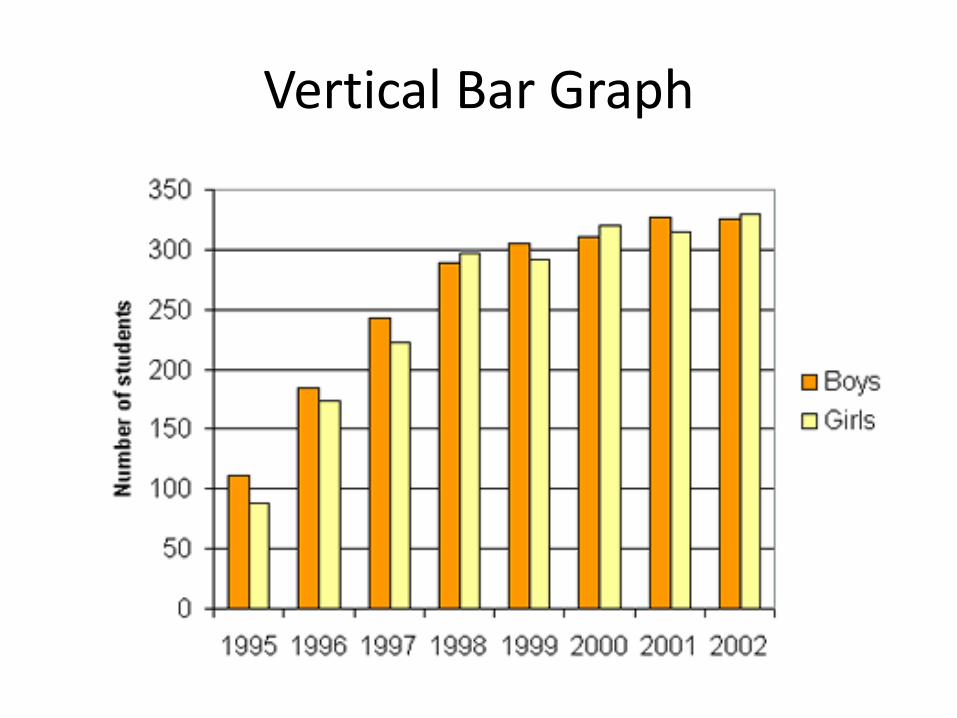
Vertical Bar Graph
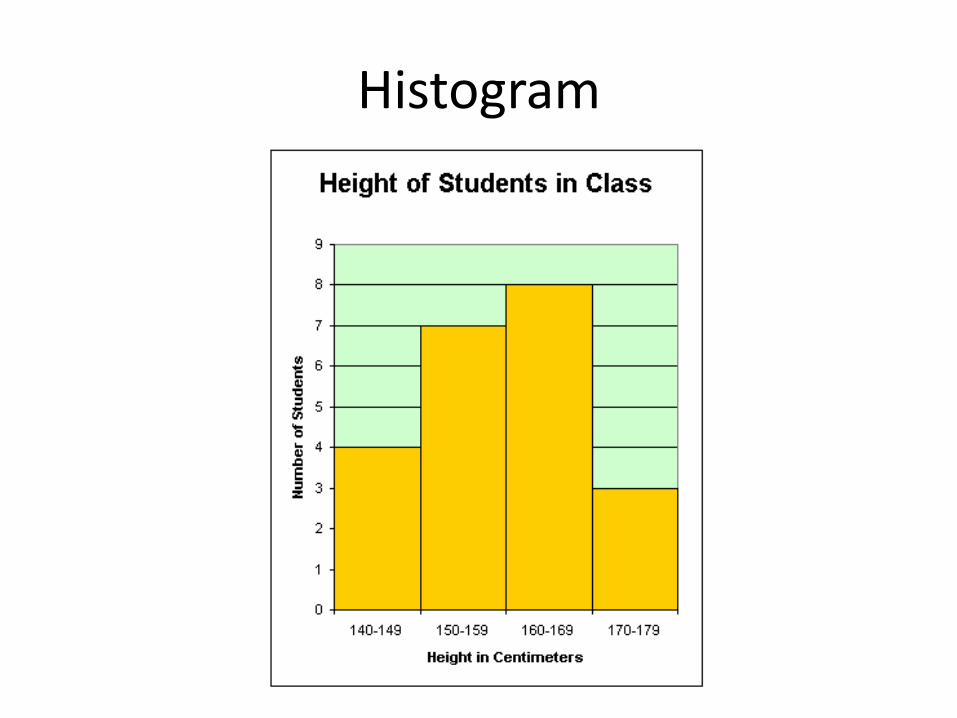
Histogram
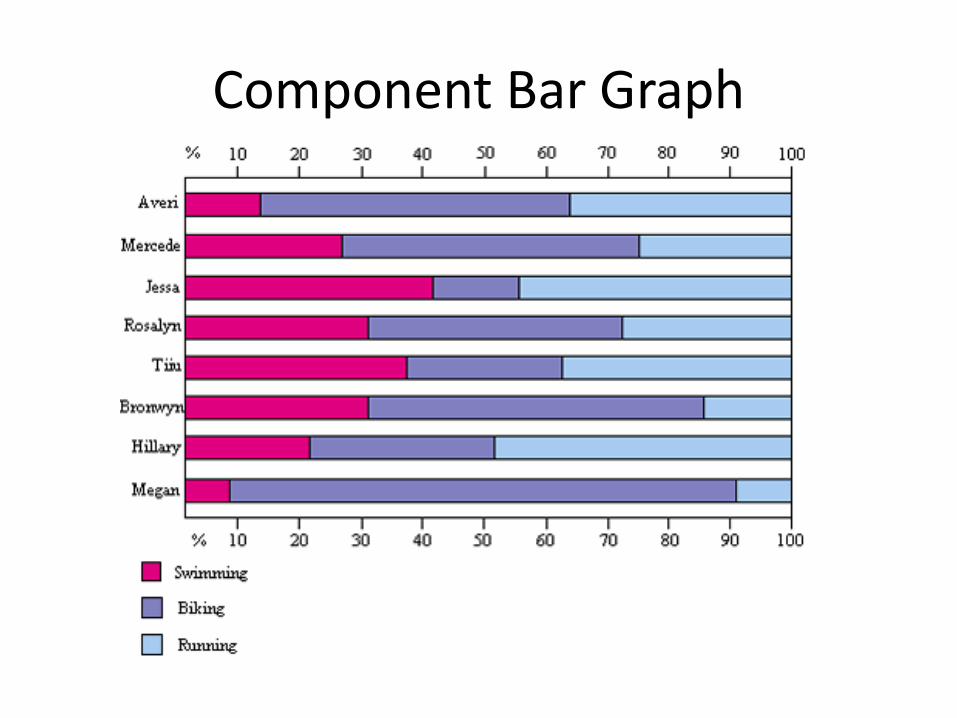
Component Bar Graph
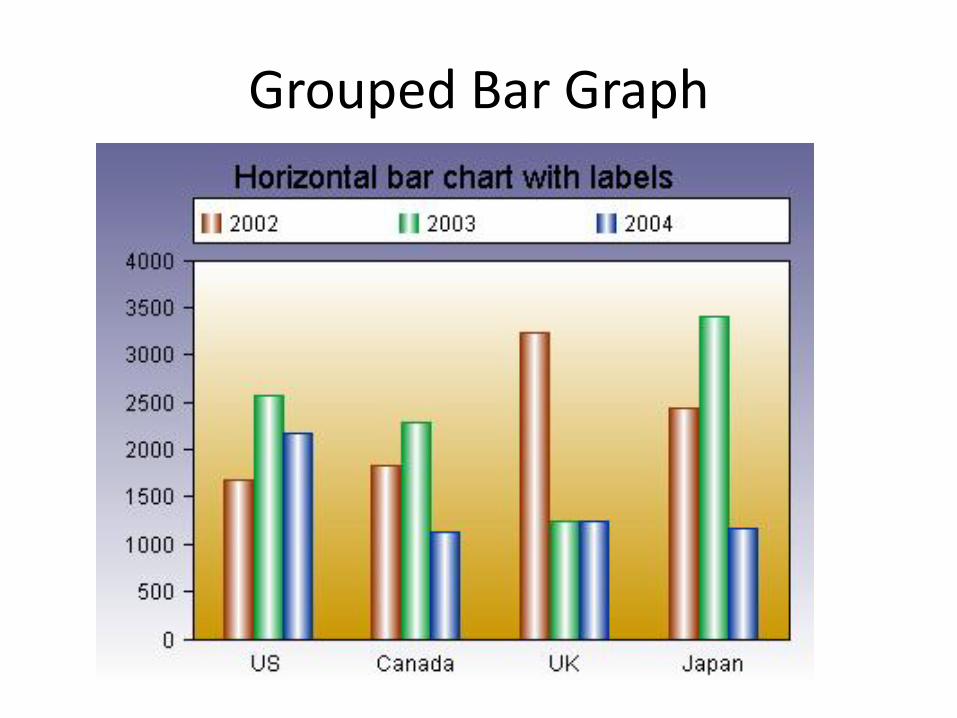
Grouped Bar Graph
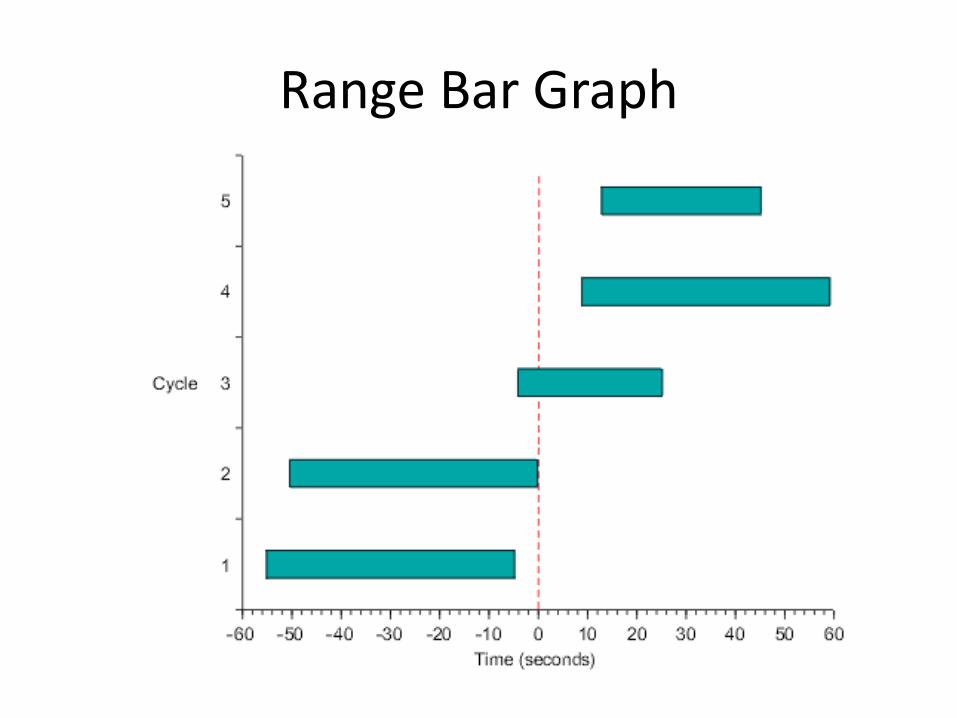
Range Bar Graph

Box and Whisker Plot
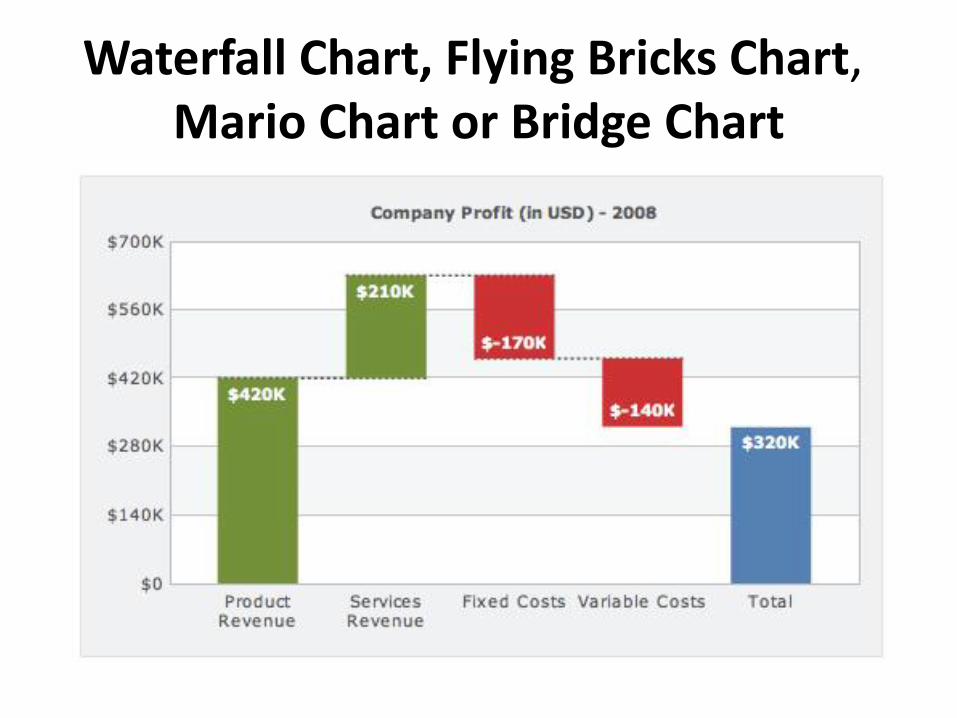
Waterfall Chart, Flying Bricks Chart, Mario Chart or Bridge Chart
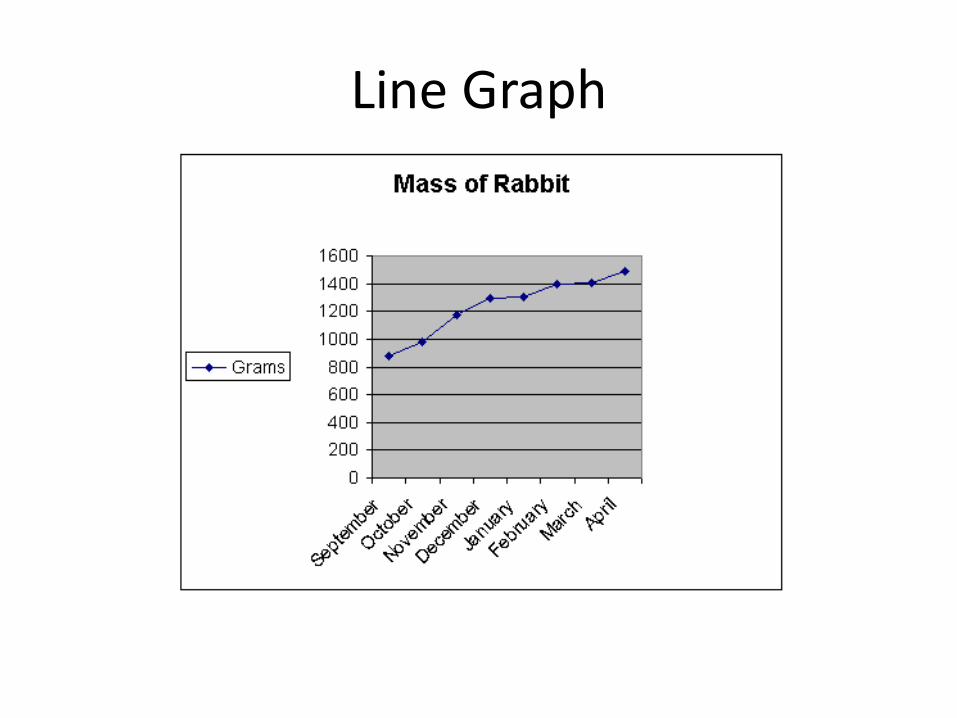
Line Graph
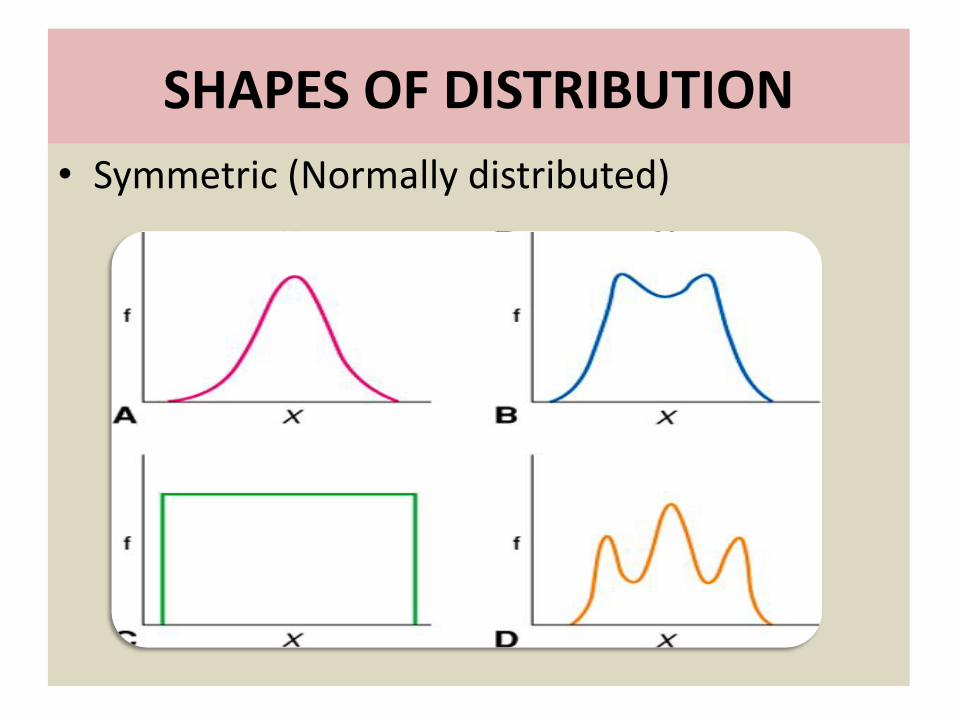
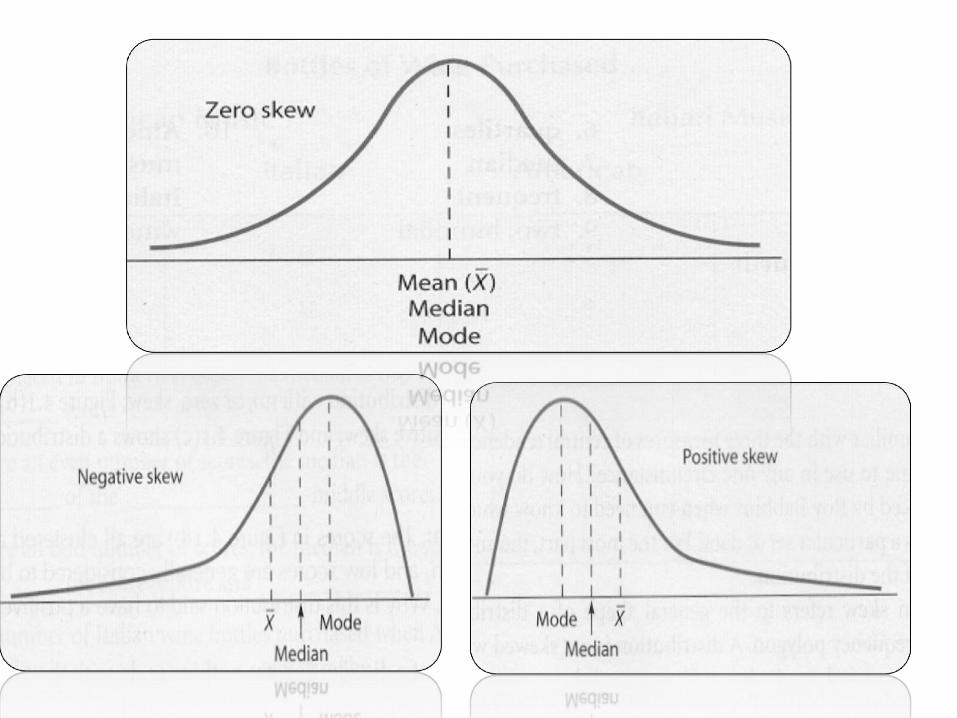
SHAPES OF DISTRIBUTION
• Symmetric (Normally distributed)
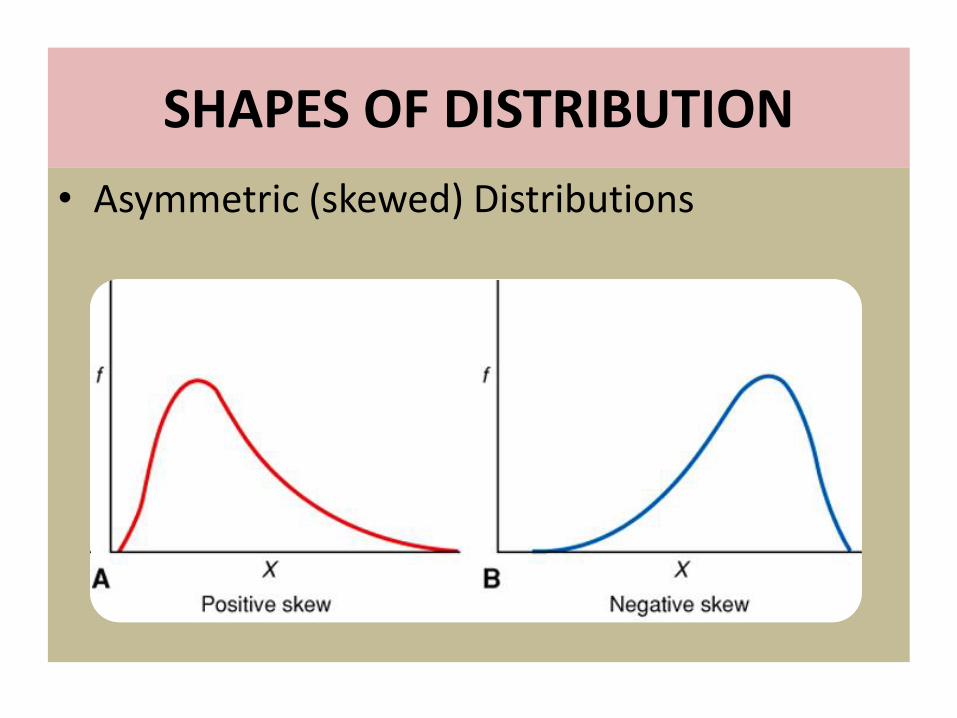
SHAPES OF DISTRIBUTION
• Asymmetric (skewed) Distributions
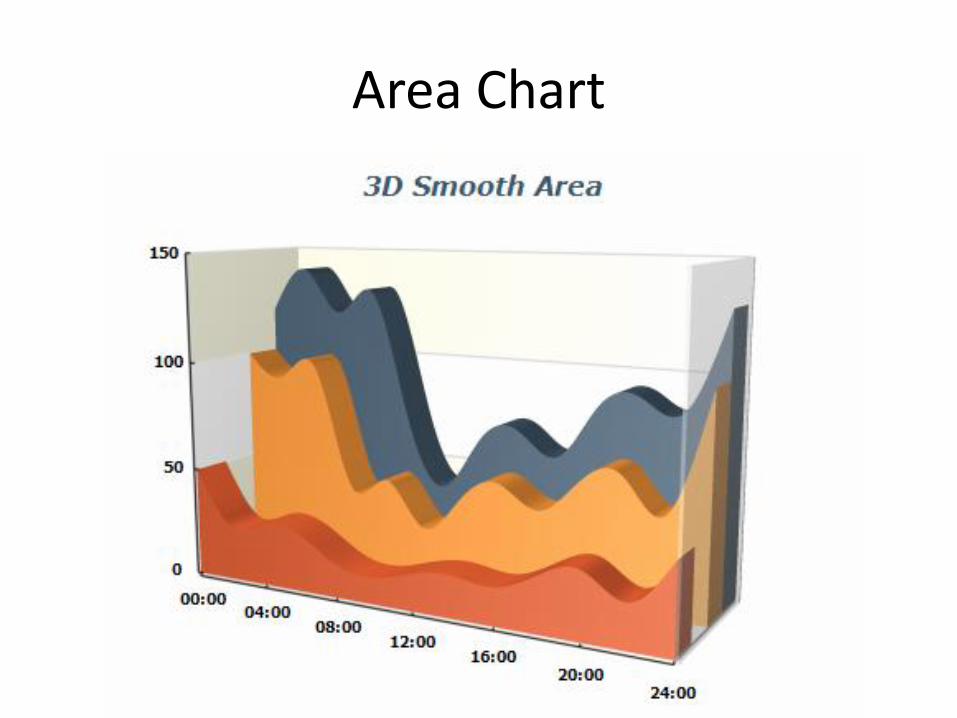
Area Chart
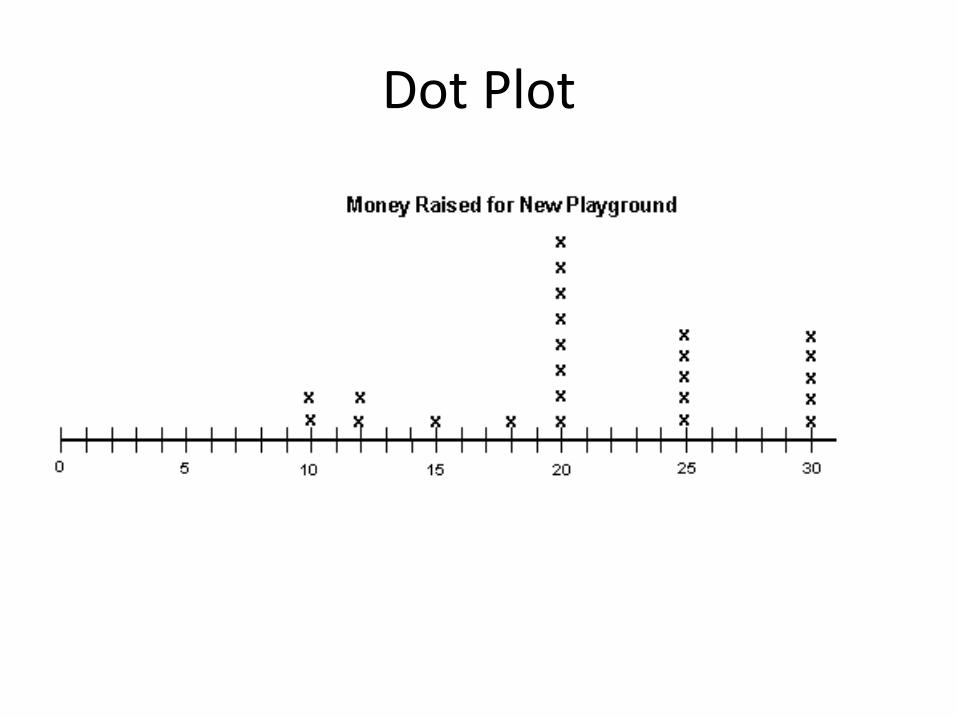
Dot Plot
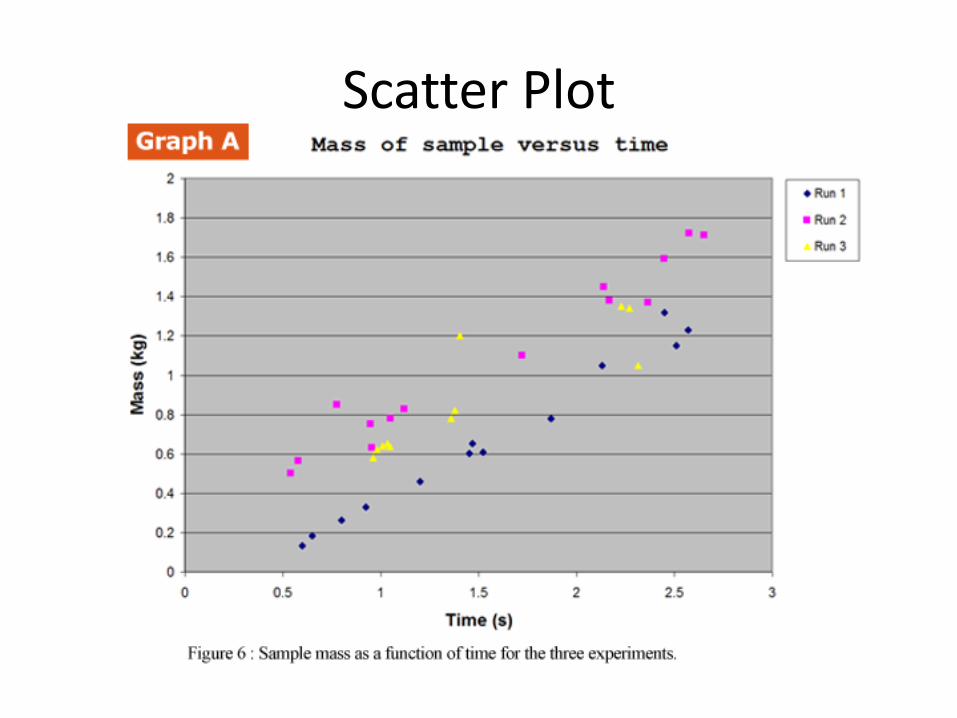
Scatter Plot
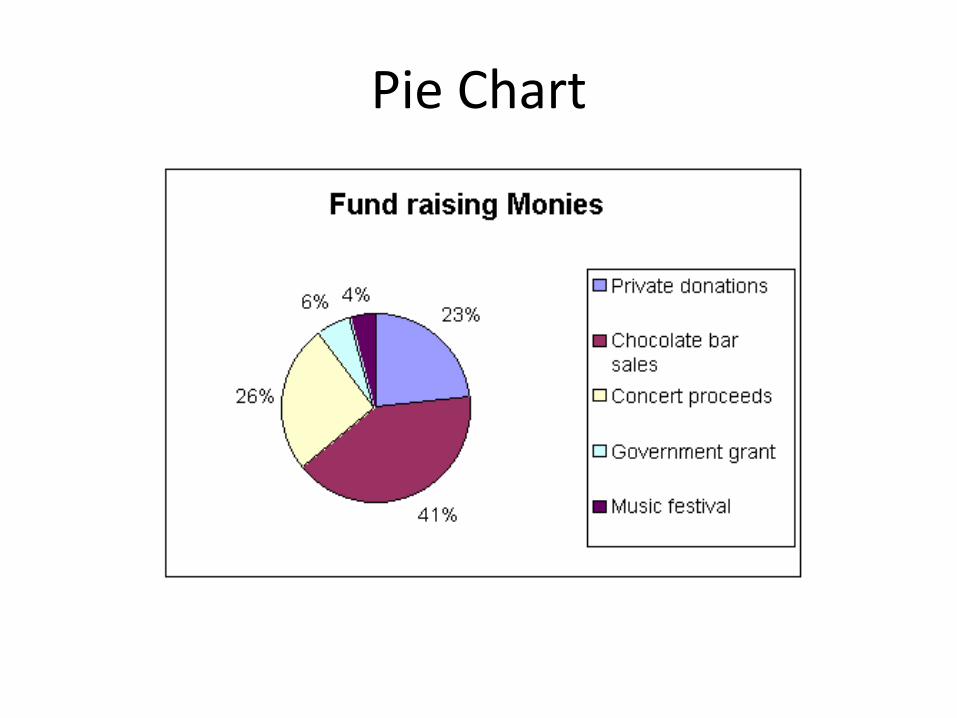
Pie Chart

Exploded Pie Chart
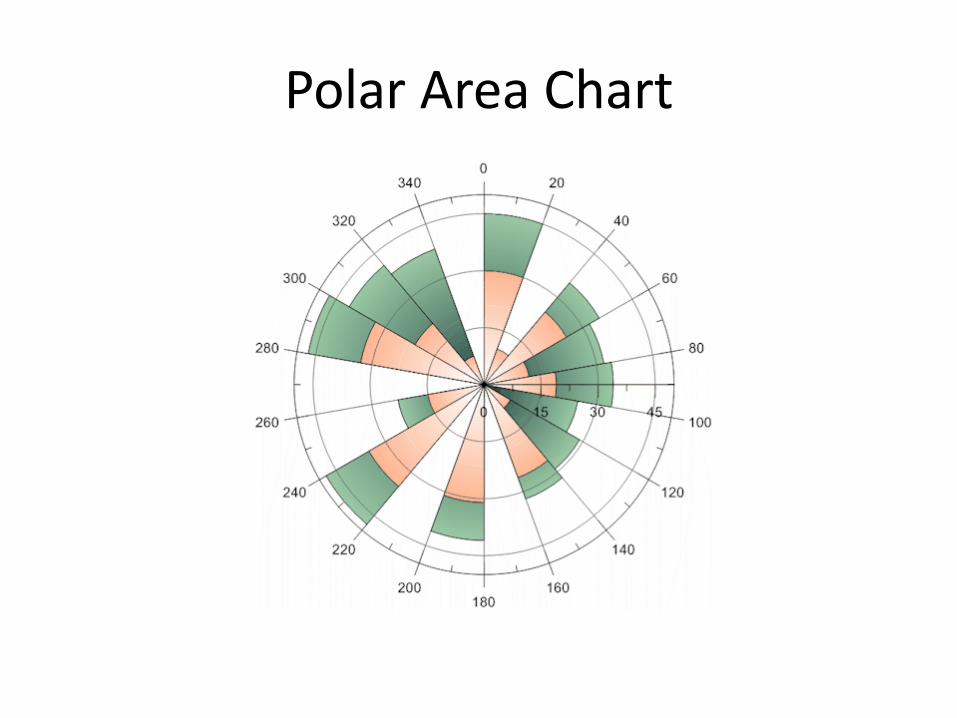
Polar Area Chart
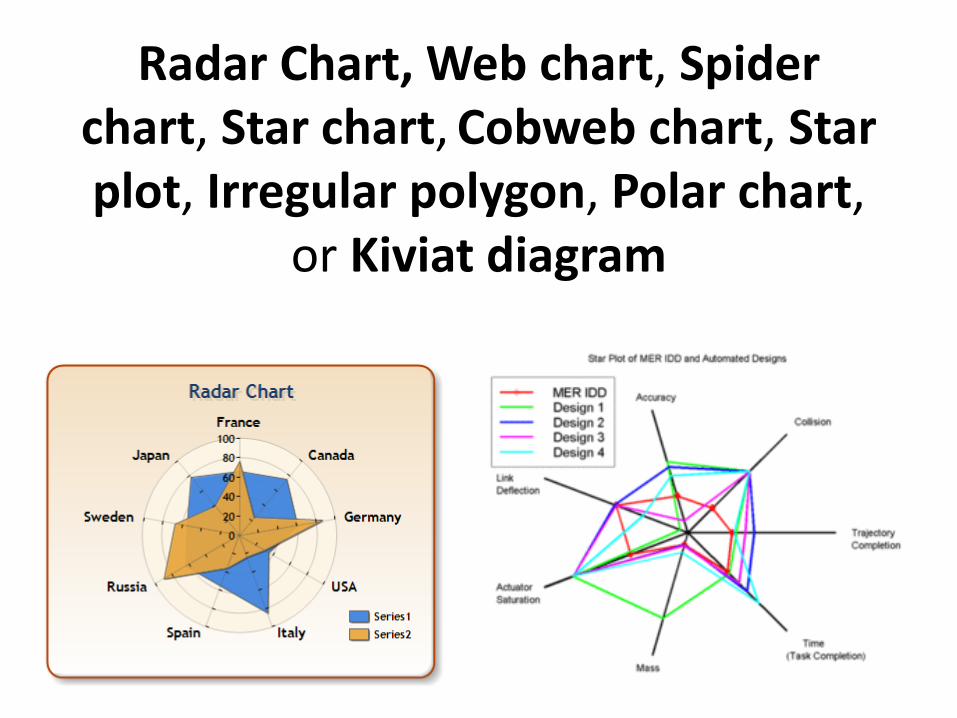
Radar Chart, Web chart, Spider chart, Star chart, Cobweb chart, Star plot, Irregular polygon, Polar chart,
or Kiviat diagram
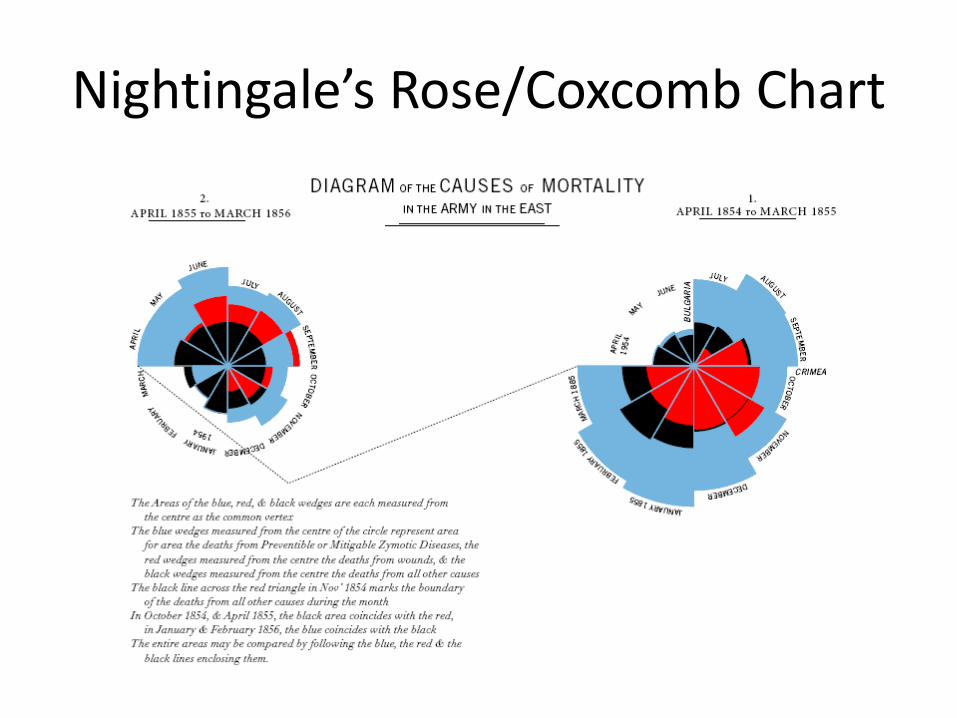
Nightingale’s Rose/Coxcomb Chart
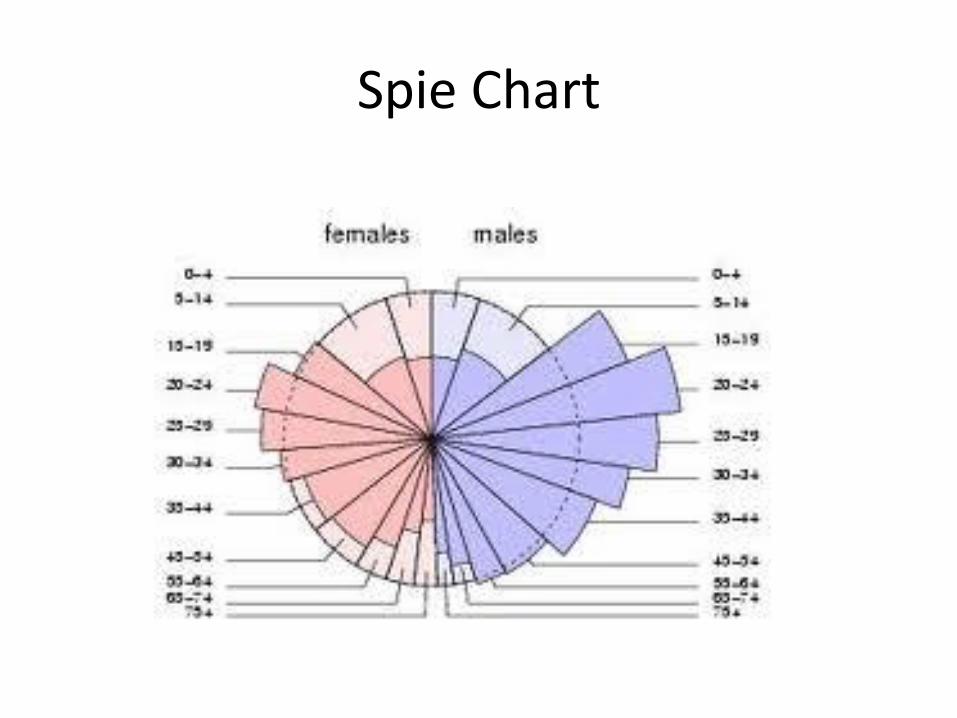
Spie Chart
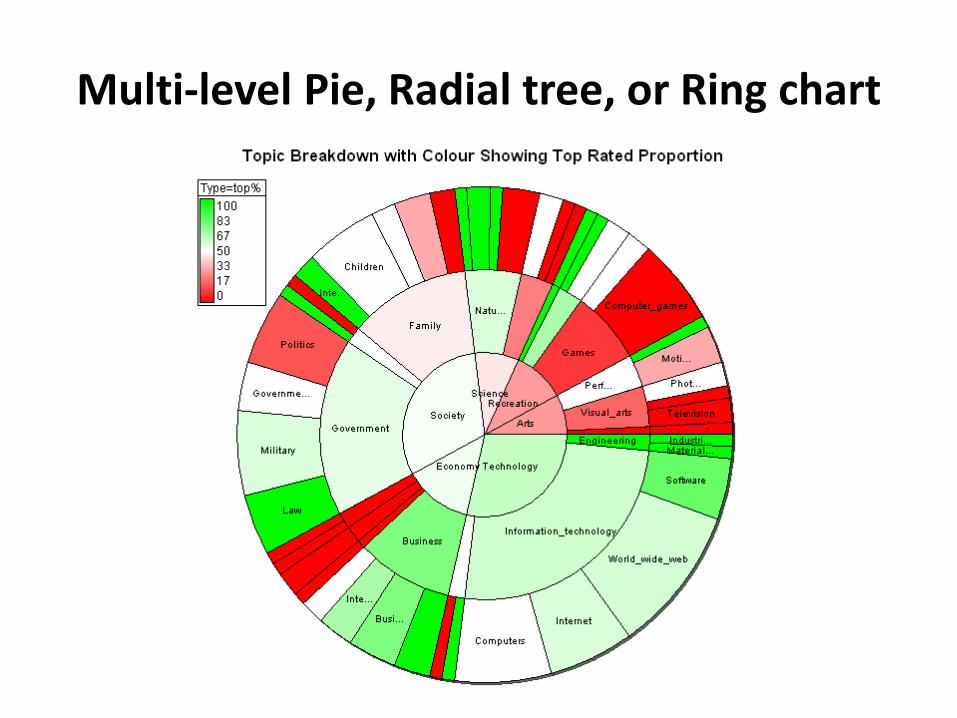
Multi-level Pie, Radial tree, or Ring chart
3-D Pie
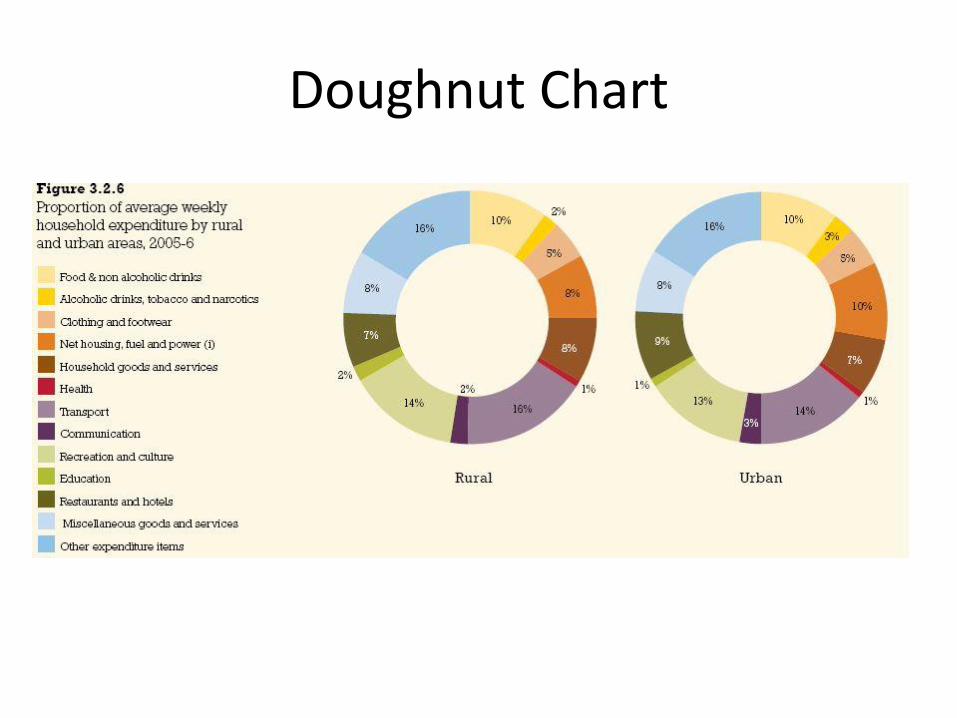
Doughnut Chart
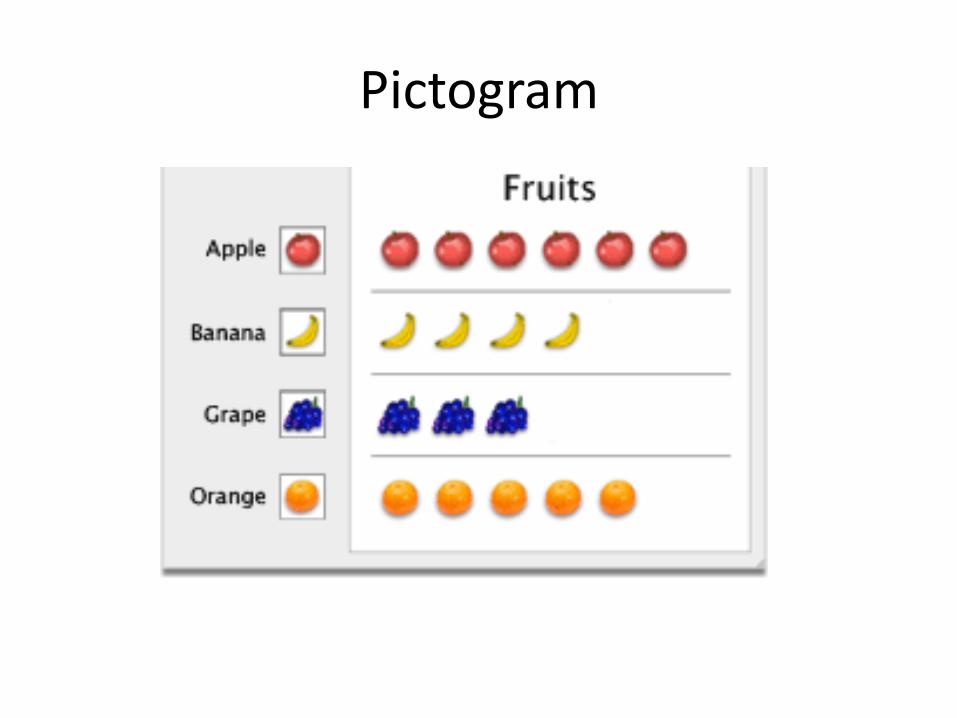
Pictogram
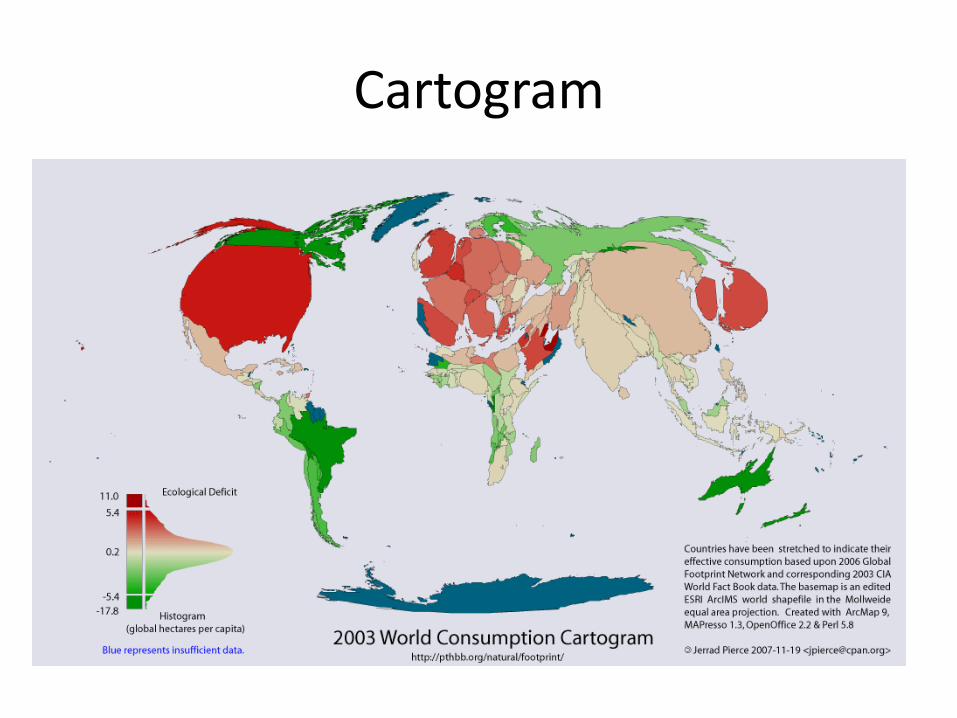
Cartogram
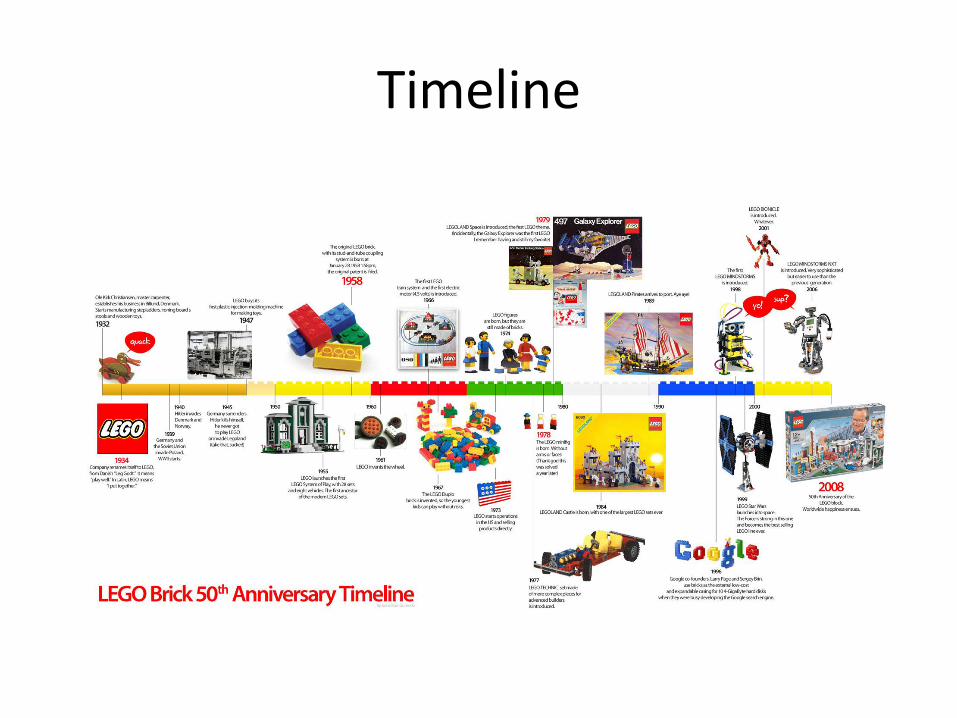
Timeline
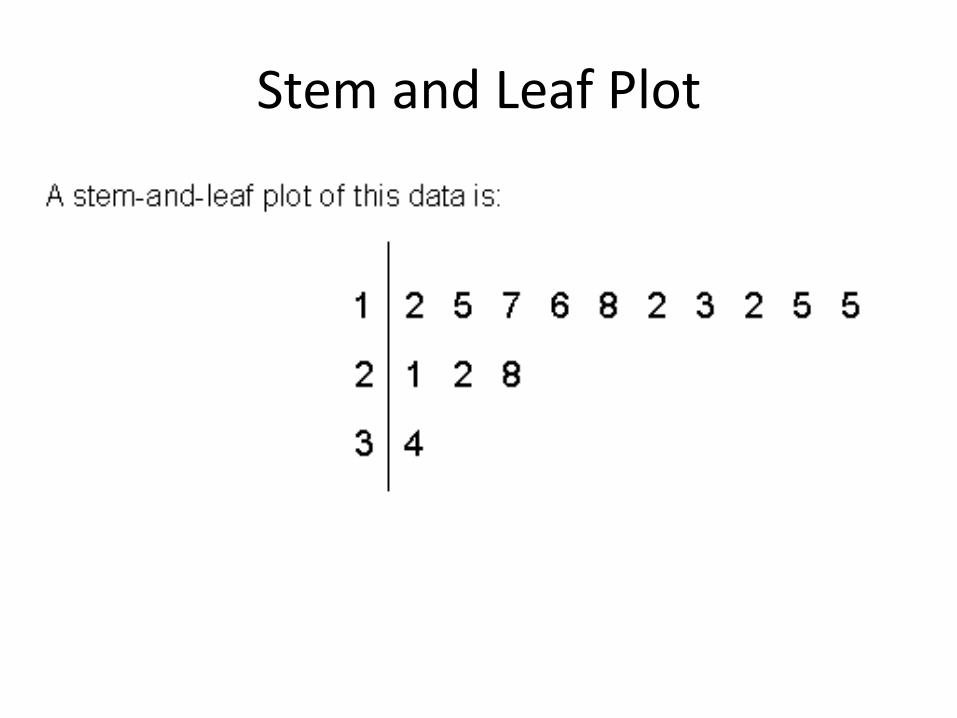
Stem and Leaf Plot
Cluster Diagrams
• Network
• Flow chart
• Organizational chart
• Tree map
• Fan chart
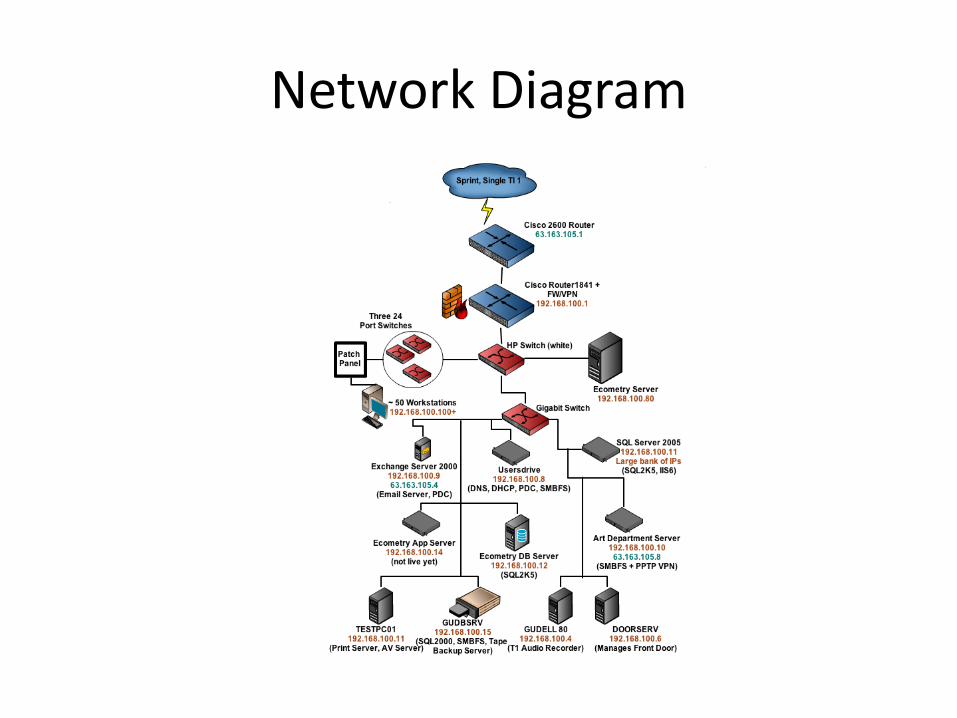
Network Diagram
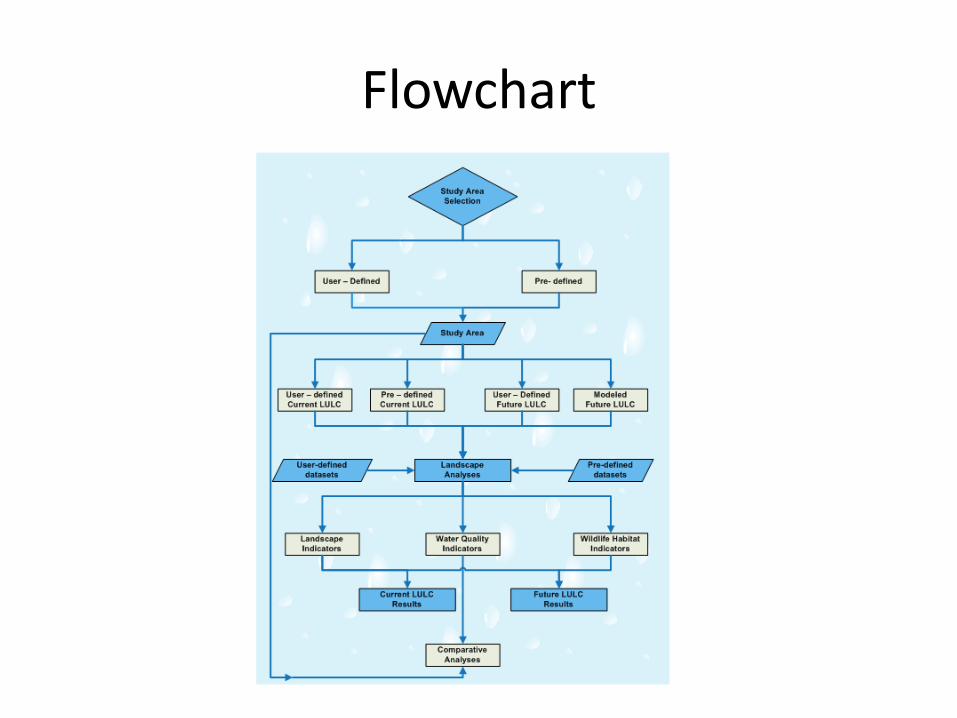
Flowchart
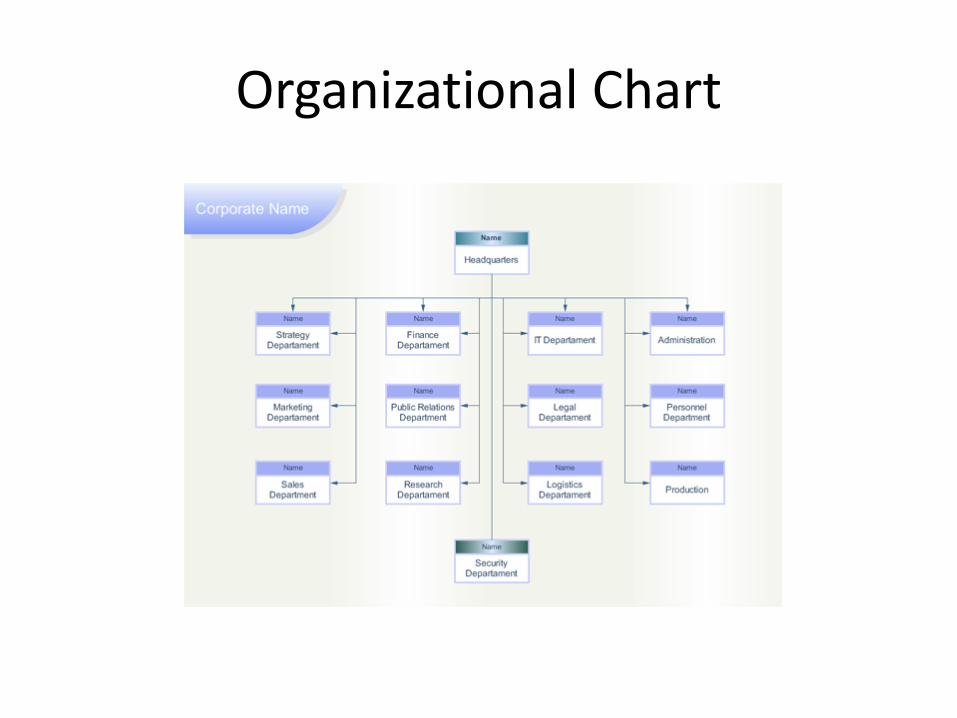
Organizational Chart
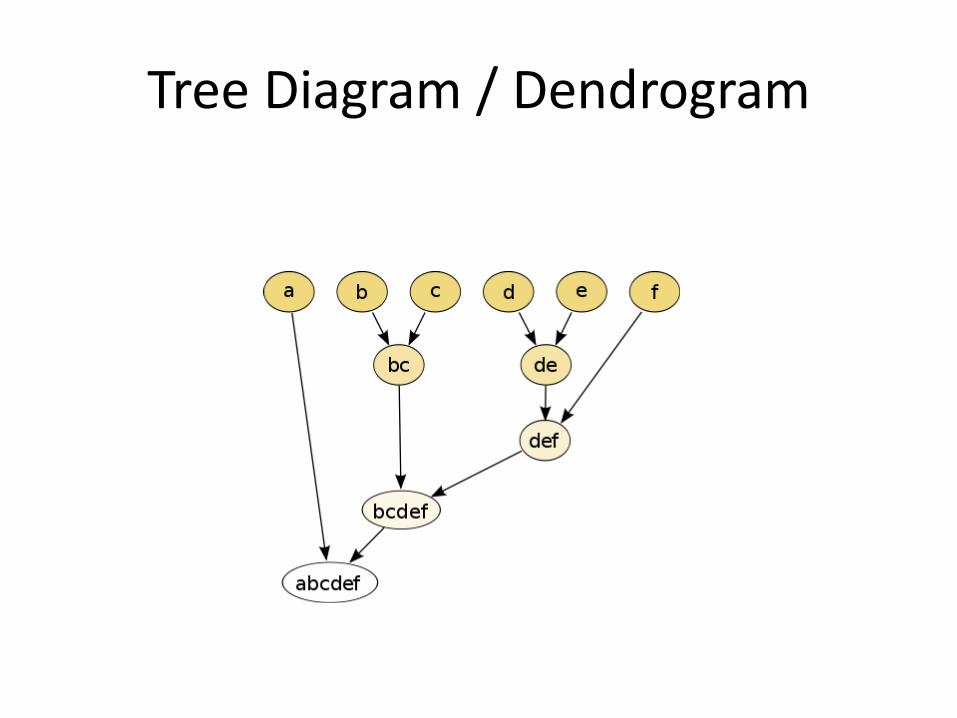
Tree Diagram / Dendrogram
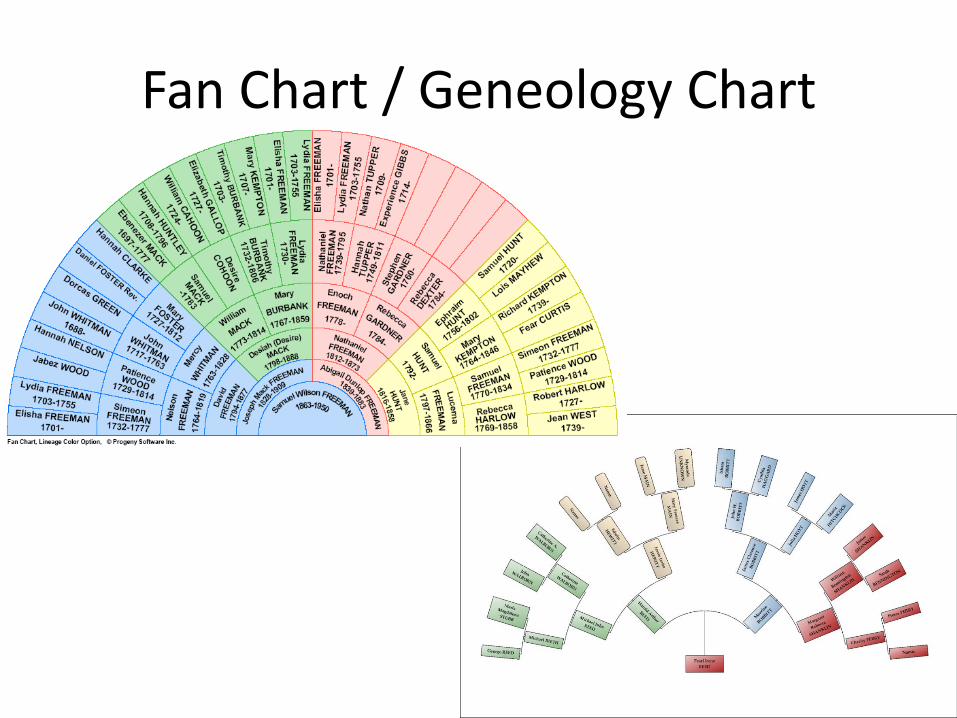
Fan Chart / Geneology Chart

Inferential Statistics 1. Student’s T-Test
2. Chi-squared Test
3. ANOVA
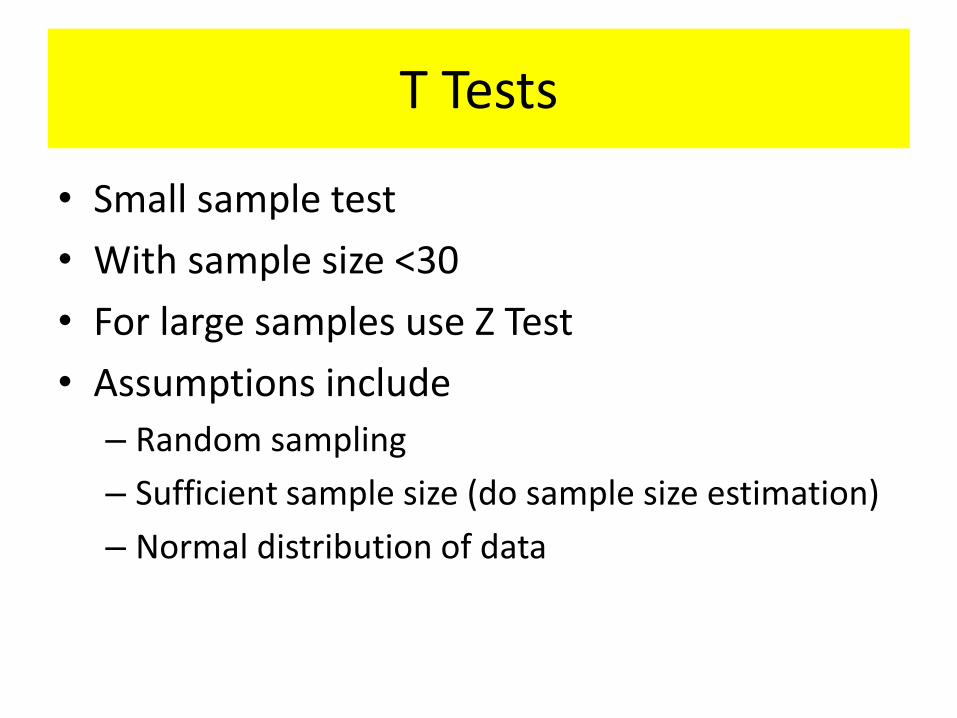
T Tests
• Small sample test
• With sample size <30
• For large samples use Z Test
• Assumptions include
– Random sampling
– Sufficient sample size (do sample size estimation)
– Normal distribution of data
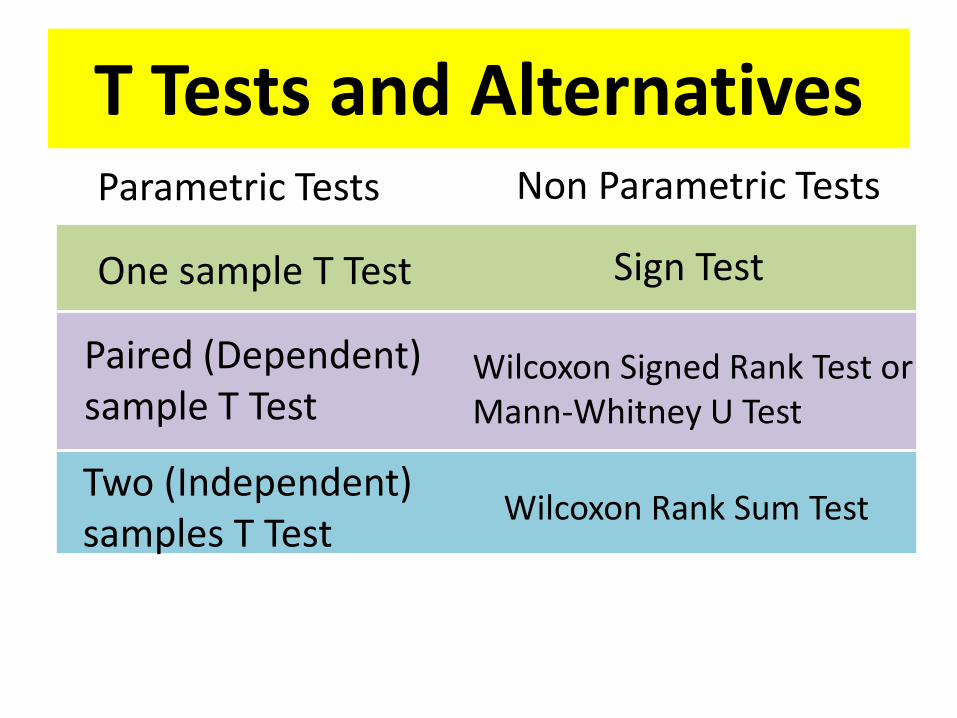
T Tests and Alternatives
One sample T Test Sign Test
Paired (Dependent) sample T Test
Wilcoxon Signed Rank Test or Mann-Whitney U Test
Two (Independent) samples T Test
Wilcoxon Rank Sum Test
Parametric Tests Non Parametric Tests
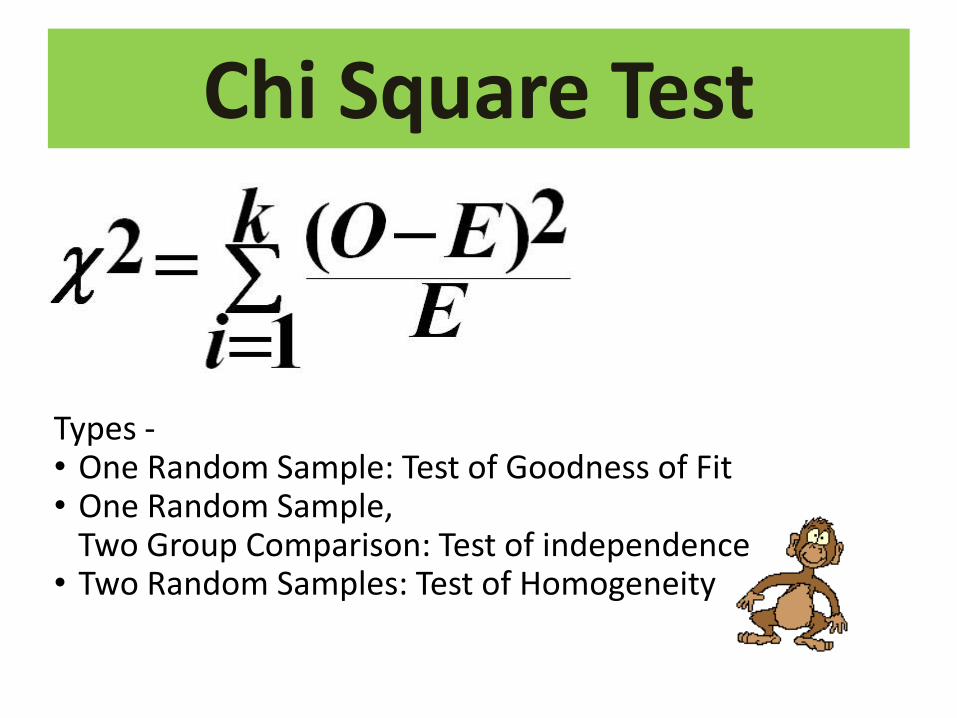
Chi Square Test
Types - • One Random Sample: Test of Goodness of Fit • One Random Sample, Two Group Comparison: Test of independence • Two Random Samples: Test of Homogeneity
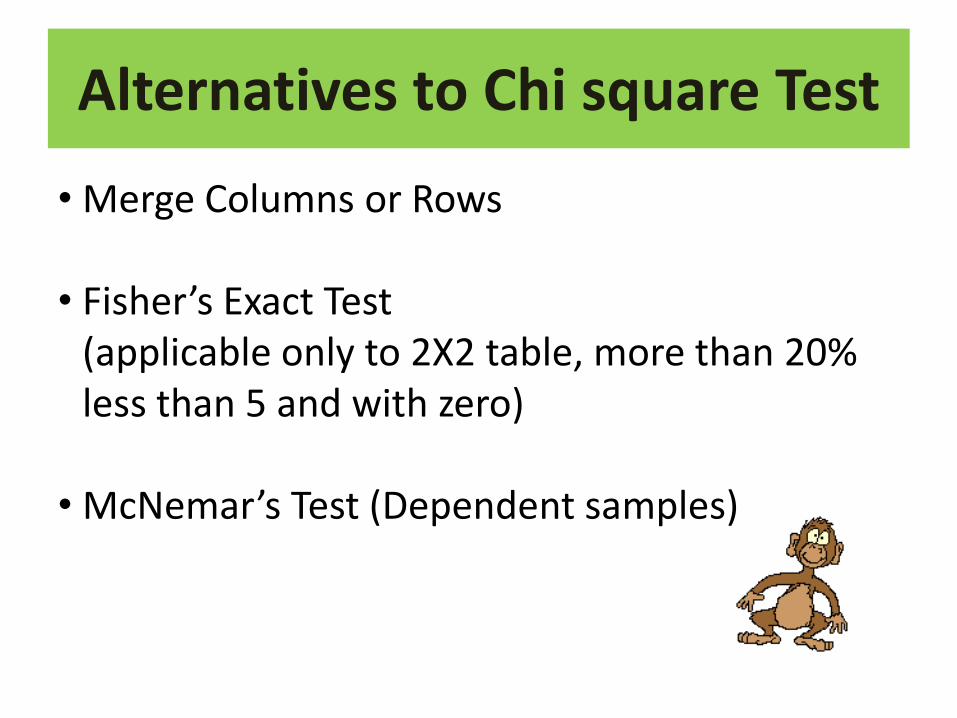
Alternatives to Chi square Test
• Merge Columns or Rows
• Fisher’s Exact Test (applicable only to 2X2 table, more than 20%
less than 5 and with zero)
• McNemar’s Test (Dependent samples)
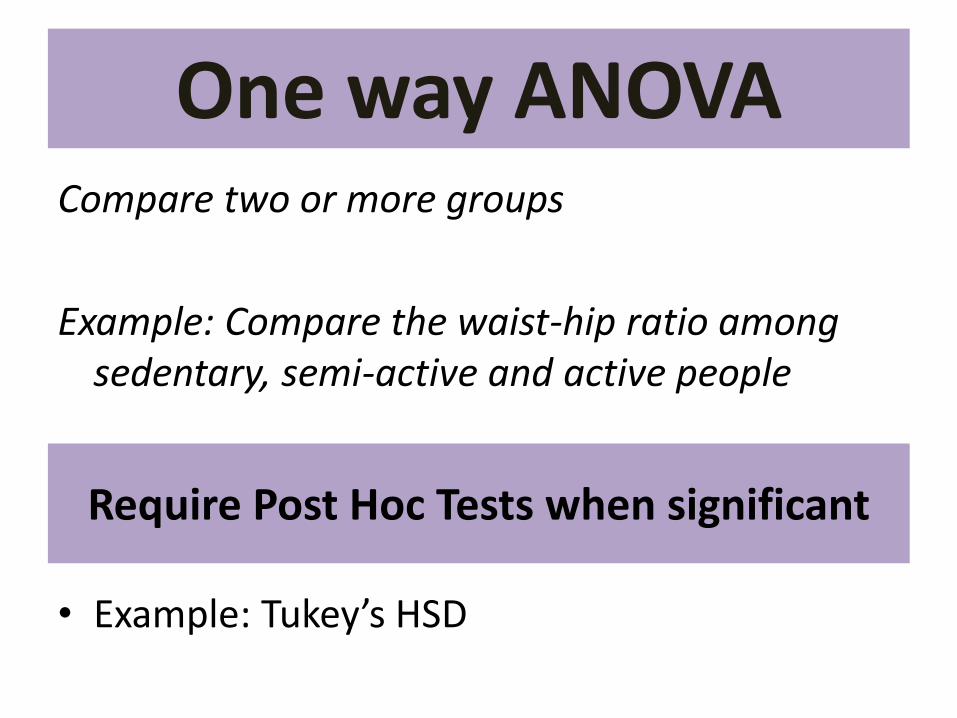
One way ANOVA Compare two or more groups
Example: Compare the waist-hip ratio among sedentary, semi-active and active people
Require Post Hoc Tests when significant
• Example: Tukey’s HSD
Alternatives • One-way ANOVA : Kruskal-Wallis
• Dependent Samples: Friedman
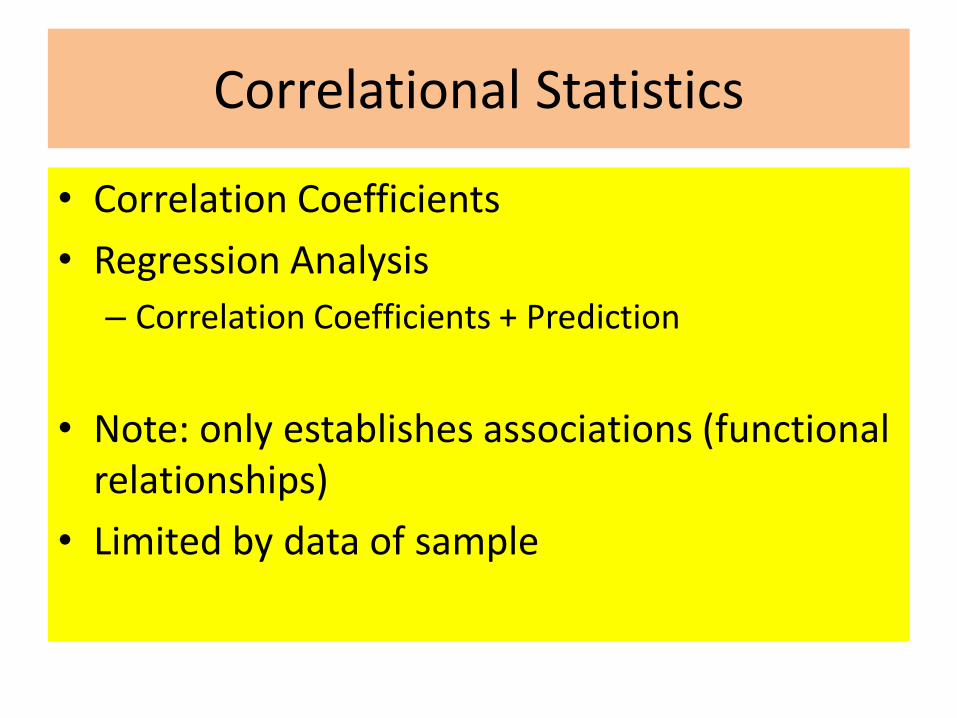
Correlational Statistics
• Correlation Coefficients
• Regression Analysis
– Correlation Coefficients + Prediction
• Note: only establishes associations (functional relationships)
• Limited by data of sample
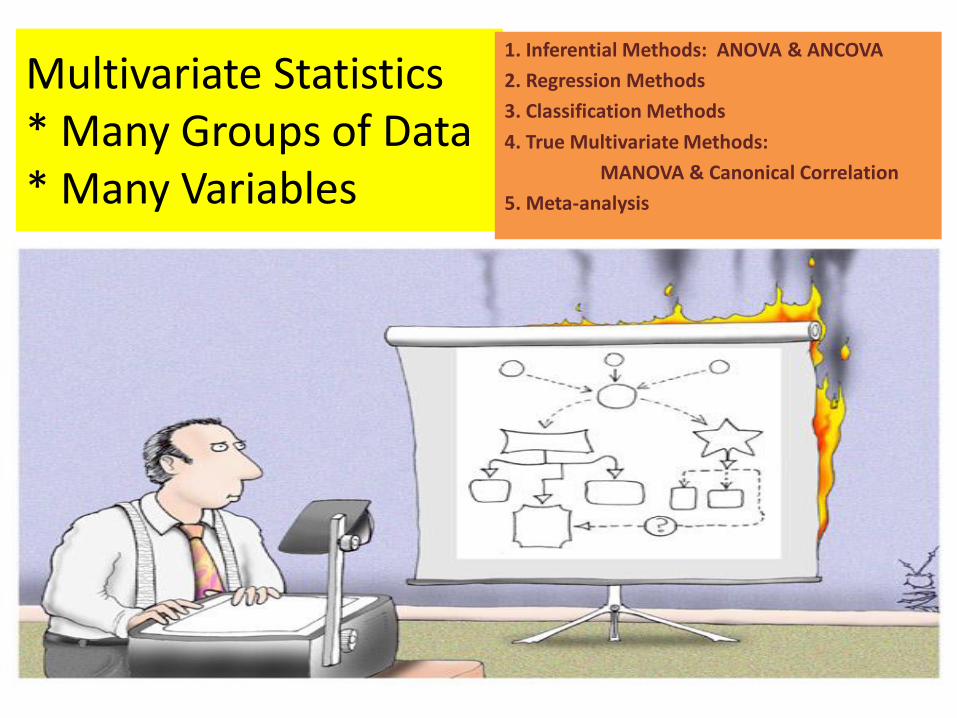
Multivariate Statistics * Many Groups of Data * Many Variables
1. Inferential Methods: ANOVA & ANCOVA
2. Regression Methods
3. Classification Methods
4. True Multivariate Methods:
MANOVA & Canonical Correlation
5. Meta-analysis
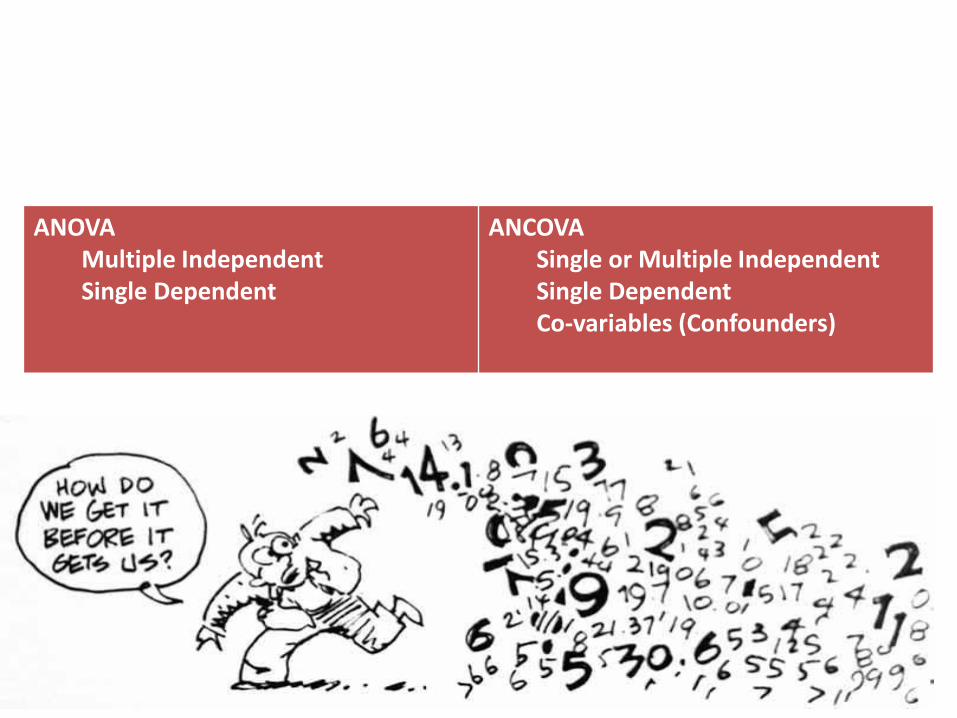
ANOVA Multiple Independent Single Dependent
ANCOVA Single or Multiple Independent Single Dependent Co-variables (Confounders)
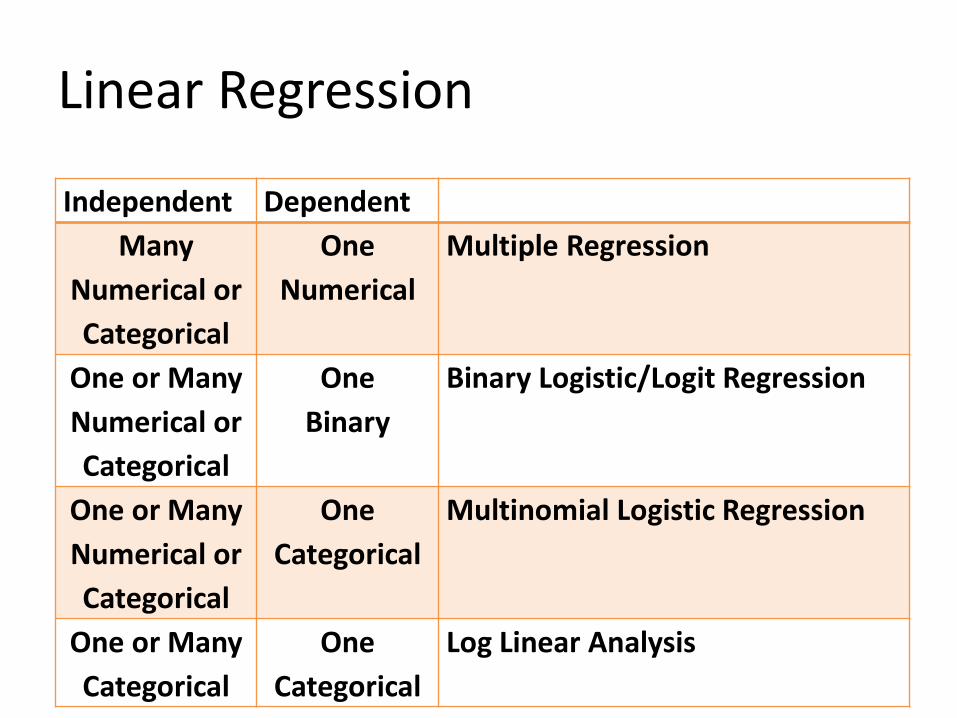
Linear Regression
Independent Dependent
Many
Numerical or
Categorical
One
Numerical
Multiple Regression
One or Many
Numerical or
Categorical
One
Binary
Binary Logistic/Logit Regression
One or Many
Numerical or
Categorical
One
Categorical
Multinomial Logistic Regression
One or Many
Categorical
One
Categorical
Log Linear Analysis
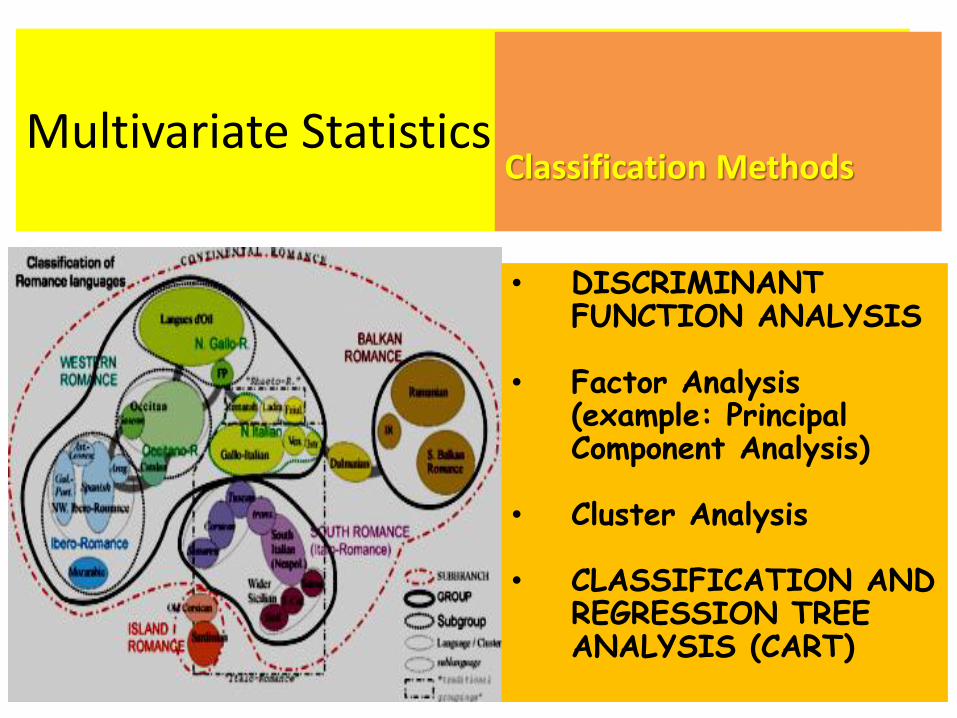
Multivariate Statistics
Classification Methods
• DISCRIMINANT FUNCTION ANALYSIS
• Factor Analysis (example: Principal Component Analysis)
• Cluster Analysis
• CLASSIFICATION AND REGRESSION TREE ANALYSIS (CART)
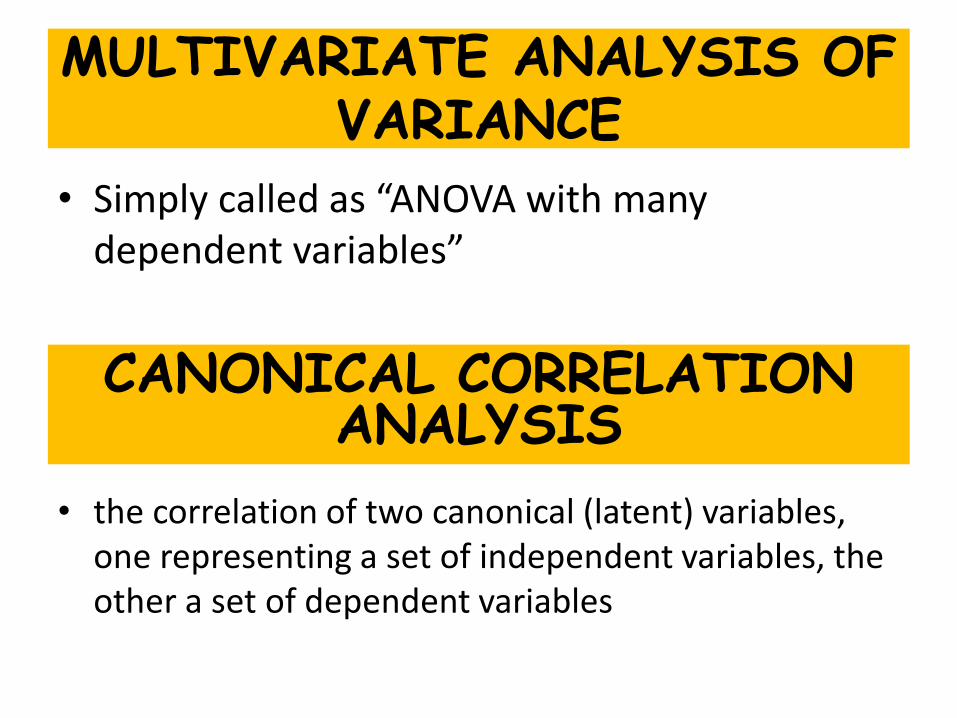
MULTIVARIATE ANALYSIS OF VARIANCE
• Simply called as “ANOVA with many dependent variables”
CANONICAL CORRELATION ANALYSIS
• the correlation of two canonical (latent) variables, one representing a set of independent variables, the other a set of dependent variables
META-ANALYSIS
• using statistical procedures to combine the results from different studies.
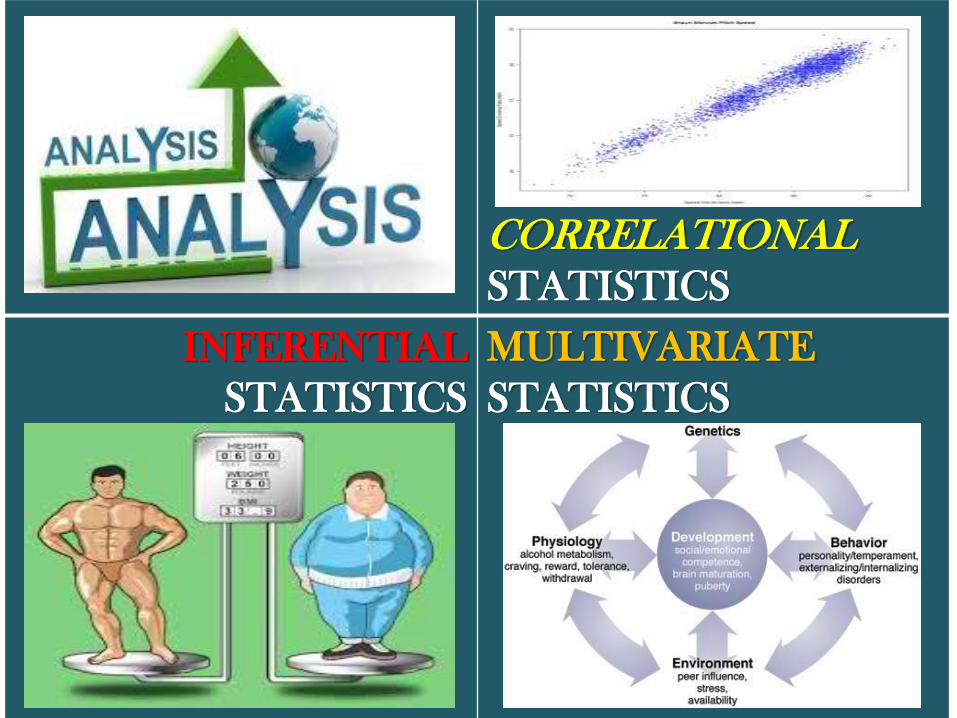
CORRELATIONAL
STATISTICS
INFERENTIAL
STATISTICS
MULTIVARIATE
STATISTICS