gps-based travel time and delay survey and traffic data analysis and visualization methodology
DESCRIPTION
Travel time and delay studies are used to evaluate traffic conditions, determine levels of service and to plan for improvements. Transportation planners and engineers of the Metro Manila Development Authority (MMDA) still employ the manual or stop watch method using a test car in obtaining travel time and delay data. This method is labor intensive and is prone to human errors as well as biases inherent in the conduct of the field surveys. Thus, it is necessary to develop and demonstrate a more efficient method of visualizing traffic characteristics using tools for assessment of road traffic conditions. This method should be an accurate and cost-effective data-gathering technique that will facilitate data analysis through spatial presentations.This paper presents a GPS-based travel time and delay survey and data analysis methodology. It introduces the development and application of a methodological framework that includes monitoring and evaluation. The proposed procedures include selection of GPS unit, verification tests, field procedure, data processing and data management, and data analysis and presentation. Data analysis and presentation through the use of digital maps is also presented wherein some of the explored traffic information outputs include corridor speed maps and travel time contour maps. Traffic information presented in the form of digital maps would be very useful for traffic planners or engineers and easy to understand for road users. Moreover, the use of GPS in this research provides fundamental inputs towards the development of a probe car system for use in travel time and delay studies in the Philippine cities.TRANSCRIPT
19th Annual Conference of the Transportation Science Society of the Philippines
Quezon City, Philippines, 9 Sept 2011
TSSP 2011 ISSN 2012-3922
GPS-based Travel Time and Delay Survey and Traffic Data Analysis
and Visualization Methodology
Reigna Jewel Ritz M. MACABABBAD
Graduate Student
Institute of Civil Engineering,
University of the Philippines
Diliman, Quezon City
1101 Philippines
E-mail: [email protected]
Jose Regin F. REGIDOR
Professor
Institute of Civil Engineering
College of Engineering
University of the Philippines
Diliman, Quezon City
1101 Philipines
E-mail: [email protected]
Abstract: Travel time and delay studies are used to evaluate traffic conditions, determine
levels of service and to plan for improvements. Transportation planners and engineers of the
Metro Manila Development Authority (MMDA) still employ the manual or stop watch
method using a test car in obtaining travel time and delay data. This method is labor intensive
and is prone to human errors as well as biases inherent in the conduct of the field surveys.
Thus, it is necessary to develop and demonstrate a more efficient method of visualizing
traffic characteristics using tools for assessment of road traffic conditions. This method
should be an accurate and cost-effective data-gathering technique that will facilitate data
analysis through spatial presentations.
This paper presents a GPS-based travel time and delay survey and data analysis methodology.
It introduces the development and application of a methodological framework that includes
monitoring and evaluation. The proposed procedures include selection of GPS unit,
verification tests, field procedure, data processing and data management, and data analysis
and presentation. Data analysis and presentation through the use of digital maps is also
presented wherein some of the explored traffic information outputs include corridor speed
maps and travel time contour maps. Traffic information presented in the form of digital maps
would be very useful for traffic planners or engineers and easy to understand for road users.
Moreover, the use of GPS in this research provides fundamental inputs towards the
development of a probe car system for use in travel time and delay studies in the Philippine
cities.
Key words: GPS, travel time, delay, methodology
1. INTRODUCTION
Travel time, a fundamental measure in transportation, is the total elapsed time necessary for a
vehicle to travel from one point to another over a specified route under existing traffic
conditions. Delay on the other hand is the time lost to travel because of traffic frictions and
traffic control devices. Travel time and delay studies are used to evaluate traffic conditions
such as the onset of congestion along major corridors, and the impacts of developments such
as transportation infrastructure, commercial, residential and industrial projects. Results are
used to determine levels of service and to plan for improvements.
Proceedings of the 19th Annual Conference of the Transportation Science Society of the Philippines (2011)
Currently, transport planners and engineers of the MMDA still employ the stop watch method
for travel time and delay data collection. This method is labor intensive and is prone to
human errors.
There are commercially available and tested devices like GPS that provide real-time
measurements of location and automated data gathering. Such devices are essential elements
of probe car systems that are already in use in other countries for accurate estimates of travel
speeds. However, there is no established methodology that would be applicable for MMDA’s
travel time and delay studies. Thus, there is a need to develop and demonstrate a more
efficient method using tools for travel time and delay surveys.
This study is part of a larger project on probe car system. The use of GPS in this research
provides fundamental inputs towards the development of a probe car system for use in travel
time and delay studies in the Philippine cities. Probe cars are usually designed to acquire
traffic information at anytime on roads from alleys to main streets at a relatively low cost.
Probe vehicle data is being utilized for many purposes such as real-time traffic management
and or creating database for traffic analysis, planning and other management. Some of the
explored outputs from probe vehicle data are social-based and individual-based outcome
maps such as corridor speeds, travel time contours, and traffic congestion 3D maps that
visualize the road transport level of service. Better information collection for abovementioned
purposes leads to less congestion and less impact to the environment which increases
certainty and opportunities for infrastructure industry.
2. OBJECTIVES
The objectives of the study are the following:
a. To develop, demonstrate and evaluate a visualization method of traffic characteristics
using tools for assessment of road traffic conditions. In line with this primary objective,
this study aims to address the following specific questions:
1. What is a suitable and practical methodology necessary in order to gather reliable
travel time and delay data of a road corridor?
2. What method of analysis and presentation or visualization of obtained data will be
used?
This method should be an accurate and cost-effective data-gathering technique that will
facilitate data analysis through spatial presentations.
b. To provide input towards the development of a probe car system.
3. REVIEW OF RELATED LITERATURE
3.1 Conventional Travel time and Delay Survey Methodology
The transport planners and engineers of MMDA use the manual test vehicle technique in
obtaining travel time and delay information. The survey is accomplished by at least two
surveyors: one driving and the other recording the time as the vehicle passes predetermined
Proceedings of the 19th Annual Conference of the Transportation Science Society of the Philippines (2011)
checkpoints. An observer with one of two stop watches is the most common method used.
The observer starts the first watch at the beginning of the test run and records the time at
various control points along the route. The second stop watch if used measures the length on
individual stopped delays. The time, location, and cause of delays are noted on forms
provided for the surveyors.
Travel time and delay study is conducted yearly for major thoroughfares such as the radial
and circumferential roads in Metro Manila. This is done through three runs: one for morning
peak, one for midday and another run for afternoon peak on a road corridor during a
particular field day. A total of six runs are performed which include northbound and
southbound travel each for peak and off-peak periods. Finally, the obtained data are recorded
as basis for transport planning and traffic operations.
3.2 GPS-based Travel Time and Delay Survey Studies
A local study by Mauricio, et al. (2003) on travel time and delay analysis using Geographic
Information System (GIS) and GPS raised the following findings:
a) GPS has provided an effective and convenient way of collecting travel data;
b) It is very capable of providing a very accurate depiction of vehicle location and speed
compared to conventional method or stop watch technique;
c) The problems encountered with the use of GPS include loss of GPS signal due to
tunnels, underpasses, flyovers, and trees.
Mauricio, et al. (2003) presented their obtained data through time-distance, speed-distance,
and distance-speed diagrams and used GIS to illustrate the study routes only. However, this
initial research did not come up with an established methodology that could easily be applied
for future travel time and delay studies.
The use of GPS for travel time data collection has been widely explored and studied since
1998. (Czerniak and Reilly, 1998; Quiroga and Bullock, 1998) Advanced technologies like
GPS-equipped probe car system that has both real time and post-processing traffic data
collection capabilities are increasingly used in other countries. (Byon, et al., 2006; Wang,
2008; McNally, et al., 2003) There are also studies that integrate GIS with GPS data for
visualization of obtained information. (Ohmori, et al., 2002 and Owusu, et al., 2006)
Most GPS-based studies on travel time data collection cover two important components
namely, the hardware and software part of the system. The hardware consists of the GPS
device, laptop, and or other equipment mounted on a test vehicle that can collect and store
traffic conditions by monitoring the location and speed of the test vehicle. On the other hand,
the software part refers to the data processing procedures and tools that can be used for post-
processing or real time monitoring of traffic data. Some good examples that developed GPS-
based travel time collection system are GPS-GIS Integrated System for Travel Time Surveys
or GISTT (Byon, et al., 2006) and GPS-Trek (Li, et al., 2002).
There are important factors such as sample size requirements that may have an impact on a
certain study. The common approach for transportation engineers is to rely only on the old
method presented by manuals to determine the sample size requirements. However, it had
been known that the old method contains systematic numerical errors and may not be
applicable to GPS-based traffic data collection. This had been thoroughly examined by Li, et

Proceedings of the 19th Annual Conference of the Transportation Science Society of the Philippines (2011)
al. (2002) wherein it was found out that five to ten samples would give reliable data for travel
time and delay studies.
4. METHODOLOGY
The methodological framework shown in Figure 1 and applied to this study is designed and
implemented with a flexibility that would facilitate the collective and progressive
development of tools and methods to be used. A survey procedure discussed in the next
section is developed based on the performed preliminary study and further refined through
case studies or application on other land developments.
Figure 1 Methodological research framework
5. DEVELOPED METHODOLOGY
The developed methodology recommended for future travel time and delay surveys consists
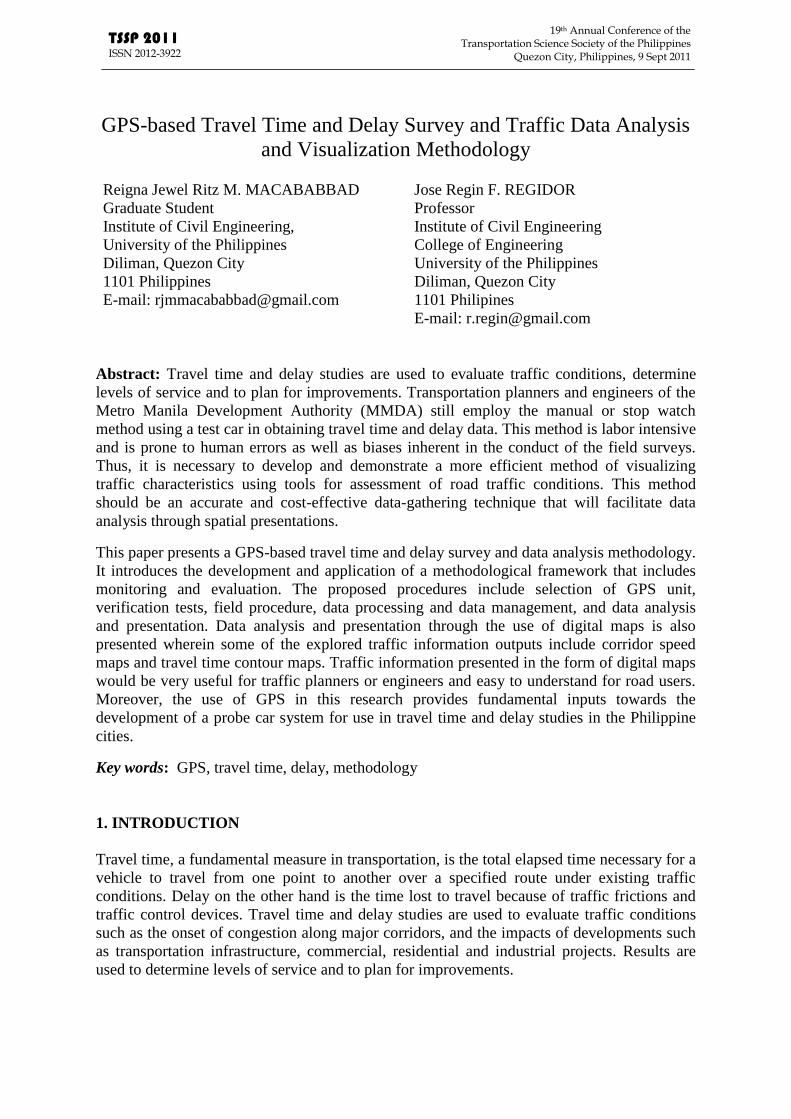
of five procedures summarized in Fig. 2. The details for connectors A, B, C, D and E in Fig.
2 are shown in Figs. 2.1 to 2.3.
Commercial GPS devices have positioning errors that may have subsequent implications in
the estimation of speeds. This must be considered and assessed whether the difference in the
average corrected speed and the average uncorrected speed is significant or not. Significance
testing particularly T-test for samples below 30 is recommended to address errors due to
positioning. The commonly used error levels or the values for α are (a) ±5% for design,
operations and evaluation studies and (b) ±10% for planning, and policy-level studies
[Turner, et. al., 1998]. Standard deviation is recommended to measure the dispersion of travel
time, delay and speed data from which reliability in the measurements can also be inferred. It
is also essential to establish confidence bounds on the calculated mean of a given data to
determine uncertainties.
6. RESULTS
6.1 Equipment and Procedures
Overall, the GPS equipment performed well and the data collection procedures utilized are
effective.

19th Annual Conference of the Transportation Science Society of the Philippines
Quezon City, Philippines, 9 Sept 2011
TSSP 2011 ISSN 2012-3922
Selection of GPS unit
Criteria
satisfied?
Criteria:
c) The device has built-in internal
memory for data storage.
d) It has PC connection capability
and included software program.
e) Cost is within budget.
Verification Test
Conduct preliminary runs on road corridors to
investigate and record possible effect of high rise
buildings, trees and overpass on the transmission of
satellite signals to the GPS device.
A
Field Procedure
Identify study area/s and corridors.
Determine sample size.
5-10 samples provide reliable data
according to a study by Li, et al. [8]. Verify
selected number of samples using
statistical measures.
Observe proper timing of data collection.
Weekday: Tue, Wed, Thu
Weekend: Sun
*on dates with no holiday
before or after survey day
Study periods:
AM peak – 7:00 to 9:00
Midday – 12:00 to 2:00
PM peak – 4:00 to 7:00
B
Data Processing and Management
Select and export GPS data from GPS device to a
computer.
Connect the GPS device to a computer thru
USB connector and transfer the data.
Save file as *.gdb.
Select data points obtained for
surveyed study corridor.
Copy and paste selected
data pts to MS Excel
worksheet.
Prepare data
worksheet in
MS Excel.
C
Data Analysis and Presentation
Account for errors due to positioning. Consider
confidence intervals and reliability. Include statistical
measures (standard dev. & significance) in the
computed speeds and travel times.
D E
NO
YES
*Repeat for each study corridor
and the considered sample size.
Figure 2. Flowchart of developed GPS-based travel time and delay survey methodology and traffic analysis
Proceedings of the 19th Annual Conference of the Transportation Science Society of the Philippines (2011)
Figure 2.1. Continuation of Figure 2 for connectors A and B
A
GPS error
B
Either on the panel
under the front
windshield of the
vehicle or secured on
top of the vehicle.
Determine a referenced location near your area. (e.g.
for this study, a point in front of the building of the
College of Education in UP Diliman with known
coordinates: 14°39'13.61"N, 121° 4'19.35"E)
Get static position data using the GPS
unit at this similar point and at one
second intervals for 20 minutes.
Compute for the standard deviation and
root mean square error of the 20-minute
data with respect to the known coordinate.
GPS set-up: in a place where it can have
unobstructed view of the sky to receive
GPS satellite signals.
One to two surveyors may perform the field surveys
Check GPS settings.
- 3D fix of satellite signals
- set correct time and date
- battery capacity must be full for
a whole day survey
- set the desired units of measure
(e.g. m, seconds, kph)
- set frequency of data collection
to one second interval
Start survey runs at a reasonable distance before
and after the end points of study corridor.
Save the entire track after every
completed survey run.
If GPS can store up to 10,000
data points, this is equivalent to
approx. 2.77 hours when
frequency of data collection is set
to one second. For 3-hour PM
peak surveys, use another GPS
unit to complete the survey run.
Raw GPS data
(travel time and
delay)
Perform validation test to determine GPS error thru
static positioning with respect to a known coordinate.
Field data collection.

Proceedings of the 19th Annual Conference of the Transportation Science Society of the Philippines (2011)
Create corridor speed maps using Adobe Phoroshop CS3/MS Paint.
D
Figure 2.2. Continuation of Figure 2 for connectors C and D
Open base map (*.jpeg or *.png format) in Adobe
Photoshop CS3.
Arbitrarily assign certain colors to represent
different travel speed ranges (e.g. red for speeds
0-10kph, orange for speeds 11-20kph, etc.)
Designate colors to the road segments according to the
computed average travel speed per segment of the
corridor. Color each segment using pen tool.
Save changes to another filename
(*.jpeg or *.png format)
Speed map
C
Compute for average travel time, speed and delay per segment of
each study corridor
Ave. travel times, speeds
and delays per segment of
study corridors
n=5 (samples)

Proceedings of the 19th Annual Conference of the Transportation Science Society of the Philippines (2011)
Create travel time contour maps using Surfer 9.0.
E Open base map (*.jpeg or *.png format) in the
plot window by clicking “new base map” icon in
the toolbar.
Open a new worksheet by clicking “new worksheet” icon in the toolbar. Create set of X, Y, Z
(latitude, longitude, travel time) data points. Obtain the X, Y points from the base map
considering the nodes or intersection points along the study corridors then input the cumulative
travel time per node as Y data.
Calculate the travel time at each node by
adding average travel times per segment
from the point of origin to other nodes.
One path from point
of origin to
destination?
YES
NO Determine the shortest
path using Djikstra’s
algorithm.
Save XYZ data as *.dat file. Open created *.dat file.
Add created contour layer to base map
by clicking “Map” icon in the menu bar
then, then the option add contour layer.
Create a grid (contour map). In
the grid options, choose “kriging”
as gridding method. Save the
created grid as *.grid file and the
grid report as *.rtf file.
The properties of the contour
layer such as opacity, background
color, lines, among others may be
adjusted as desired.
Save new contour
map as *.srf file.
Export and save it as
*.jpeg or *.png file.
Travel time
contour map
Figure 2.3. Continuation of Figure 2 for connector E
19th Annual Conference of the Transportation Science Society of the Philippines
Quezon City, Philippines, 9 Sept 2011
TSSP 2011 ISSN 2012-3922
6.1.1 Equipment Performance
The GPS unit runs on two AA batteries. During the preliminary study, alkaline batteries have
been used which last for two to three days and then they had to be discarded and replaced
with new ones. This made the researcher opt for rechargeable batteries to be used during the
validation part in order to save on added costs and reduce wastes. The rechargeable batteries
last for two to three days as well but charging it takes ten hours. The other significant
equipment problem is the limited number of data points that it can store which is 10,000 data
points only or approximately equal to 2.7 hours when frequency of data collection is set to
one second. This resulted in lost data sets specially during the PM peak period on the first
survey day for validation part. However, this is addresed by using a second GPS unit when
the memory of the first GPS unit reached 80%.
6.1.2 Personnel Compliance with Data Collection Protocol
Almost most of the traffic surveys are performed by the reseacher. However, there are few
instances when a surveyor is assigned to do the data collection wherein some errors such as
failure to check on the equipment’s frequency of data collection has resulted to unusable data.
This is due to the failure to specify procedures in advance and to adequately train the
personnel.
6.1.3 Overall Data Collection Success Rate
Despite the occurence of the data collection problems noted above, the overall data collection
success rate is approximately 95%. The five percent is due to equipment and operator error.
6.1.4 Total Resources Required
The total in-field resources required to conduct the traffic surveys amounted to approximately
8.5 hours per survey day. This is more than the seven hours that theoretically would be
required for the actual travel time and delay runs (two hours in the AM, two hours in the
midday and 3 hours in the PM peak periods). Some of the additional time is for driving to and
from the study corridors.
6.2 Travel Time and Delay Results
6.2.1 Preliminary Study
Performance of a preliminary study is a primary step in the development of travel time and
delay survey methodology and traffic data analysis. This entails determining tools and
methods to be used, learning and applying traffic survey concepts using chosen tools and
established procedures on study corridors or areas and exploring possible presentation of
traffic data analyses.
A preliminary study using test vehicle is conducted on short segments of major corridors that
are main access roads of University of the Philippines (UP) Diliman on July 13, 2010. The
point of origin or destination is set at UP Diliman and particularly in front of the Quezon
Hall. The access roads considered for network analysis are certain segments of
Commonwealth Avenue, Visayas Avenue, North Avenue, Quezon Avenue, and Katipunan
near the point of reference. The area covers MRT3 to UP, LRT2 to UP, and SM North EDSA
to UP jeepney routes.
The traffic data analyses are performed both for corridor and network levels. Traffic data
obtained using GPS device are presented in conventional travel time trajectories and speed
profiles, corridor speed maps, and travel time contours.
Proceedings of the 19th Annual Conference of the Transportation Science Society of the Philippines (2011)
The corridor speed maps for morning and afternoon peak are generated by arbitrarily
assigning certain colors to represent different travel speed ranges. Then, designating the
corresponding colors according to the average travel speeds per segment of the study
corridor. Travel time contour maps are obtained by calculating the average travel time per
segment from the origin or destination to every predetermined node along the study corridors.
Then, a resulting XYT (latitude, longitude, travel time) data file is used to create a contour
map. The contour lines in the study area indicate the amount of travel time required to reach
or leave an arbitrarily chosen point of interest.
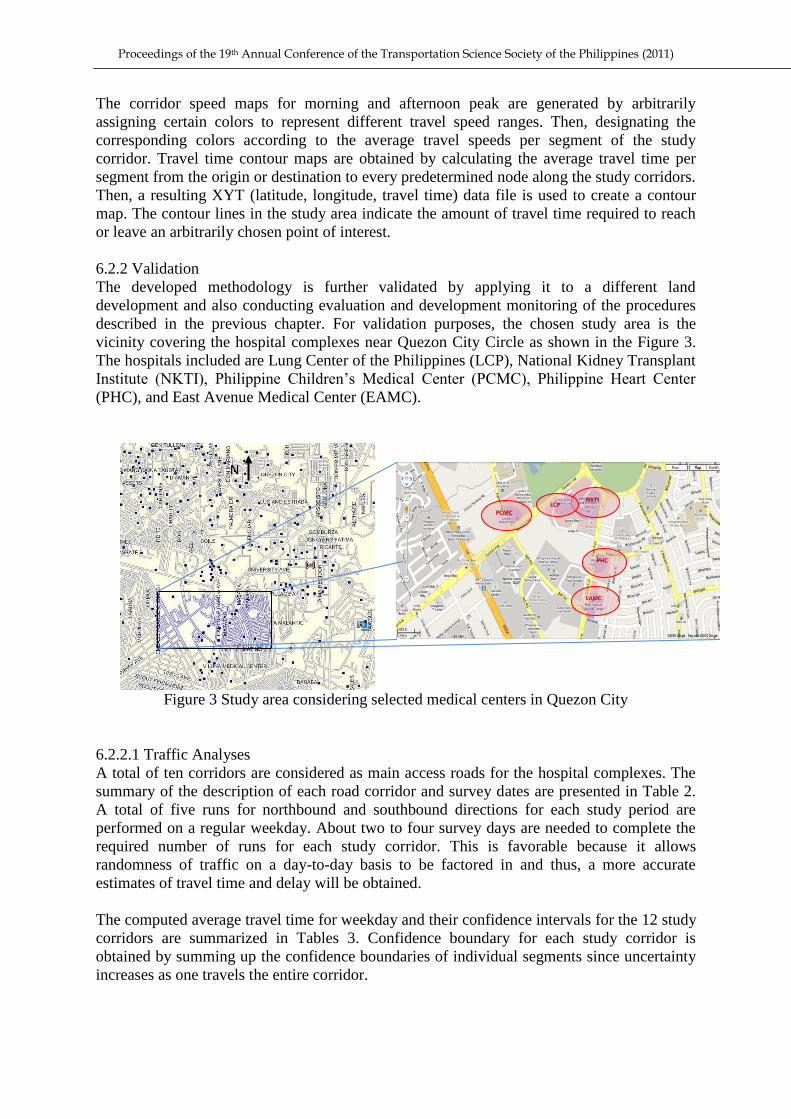
6.2.2 Validation
The developed methodology is further validated by applying it to a different land
development and also conducting evaluation and development monitoring of the procedures
described in the previous chapter. For validation purposes, the chosen study area is the
vicinity covering the hospital complexes near Quezon City Circle as shown in the Figure 3.
The hospitals included are Lung Center of the Philippines (LCP), National Kidney Transplant
Institute (NKTI), Philippine Children’s Medical Center (PCMC), Philippine Heart Center
(PHC), and East Avenue Medical Center (EAMC).
Figure 3 Study area considering selected medical centers in Quezon City
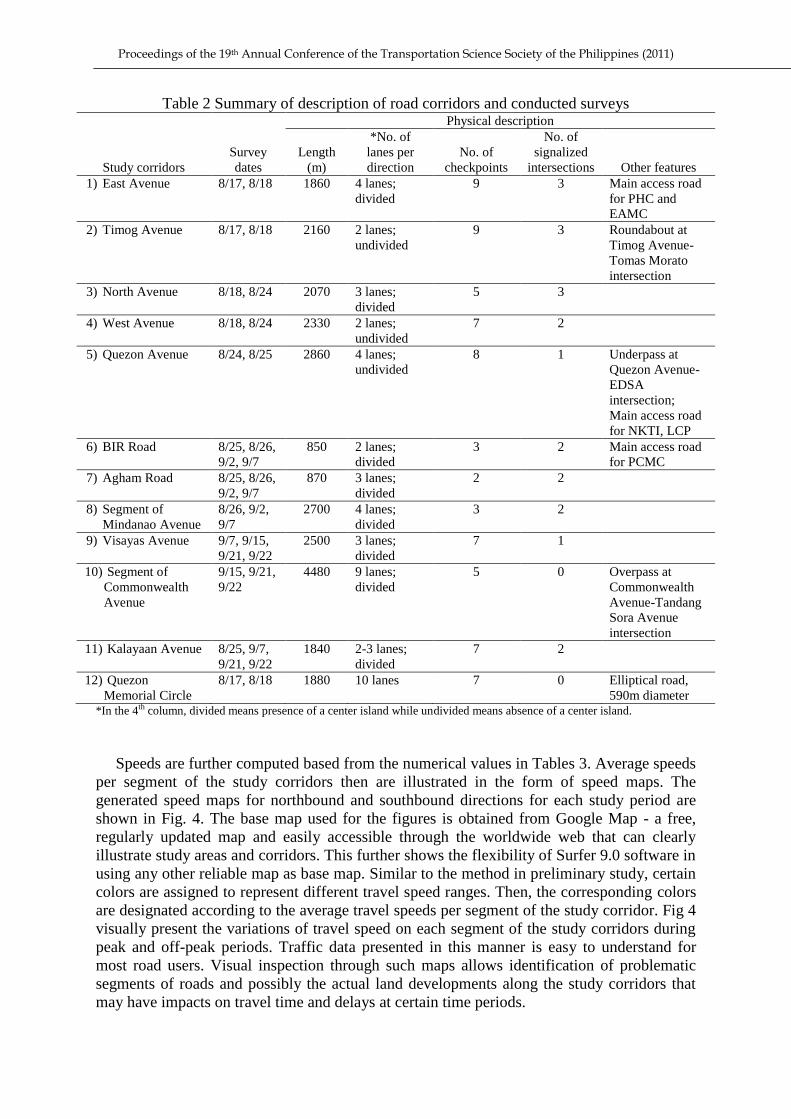
6.2.2.1 Traffic Analyses
A total of ten corridors are considered as main access roads for the hospital complexes. The
summary of the description of each road corridor and survey dates are presented in Table 2.
A total of five runs for northbound and southbound directions for each study period are
performed on a regular weekday. About two to four survey days are needed to complete the
required number of runs for each study corridor. This is favorable because it allows
randomness of traffic on a day-to-day basis to be factored in and thus, a more accurate
estimates of travel time and delay will be obtained.
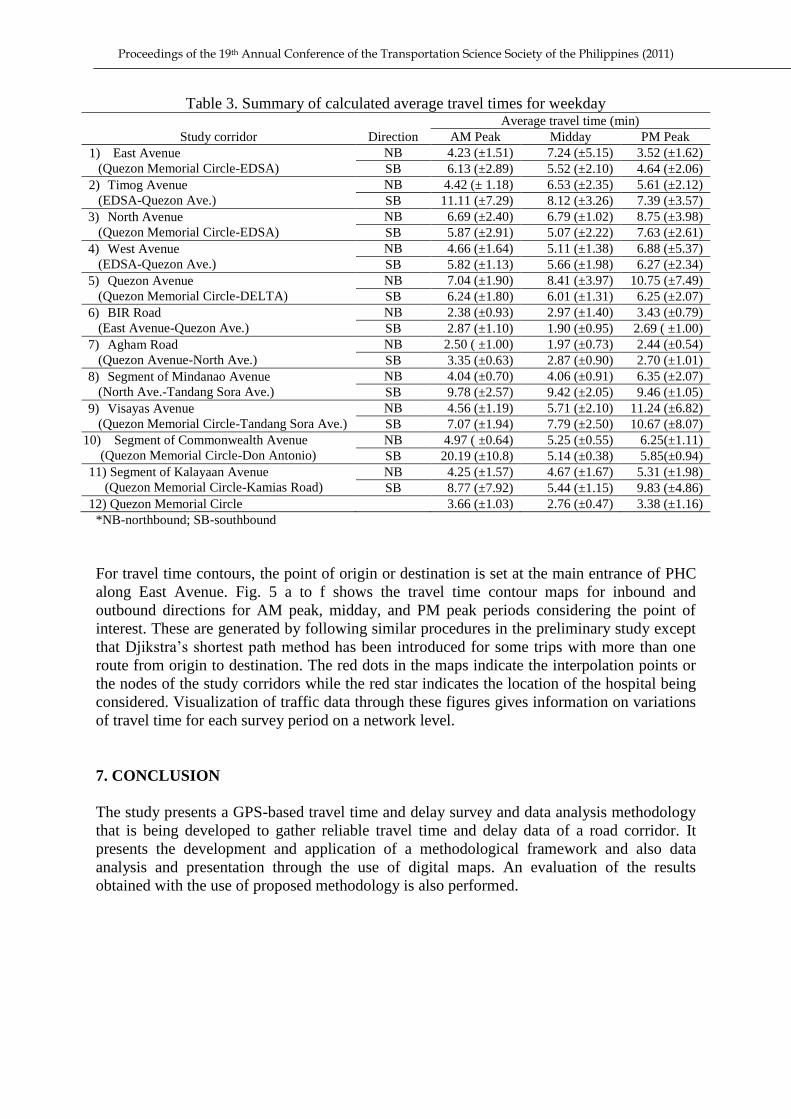
The computed average travel time for weekday and their confidence intervals for the 12 study
corridors are summarized in Tables 3. Confidence boundary for each study corridor is
obtained by summing up the confidence boundaries of individual segments since uncertainty
increases as one travels the entire corridor.
N
NKTI
PHC
EAMC
PCMC LCP
Proceedings of the 19th Annual Conference of the Transportation Science Society of the Philippines (2011)
Table 2 Summary of description of road corridors and conducted surveys
Study corridors
Survey
dates
Physical description
Length
(m)
*No. of
lanes per
direction
No. of
checkpoints
No. of
signalized
intersections Other features
1) East Avenue 8/17, 8/18 1860 4 lanes;
divided
9 3 Main access road
for PHC and
EAMC
2) Timog Avenue 8/17, 8/18 2160 2 lanes;
undivided
9 3 Roundabout at
Timog Avenue-
Tomas Morato
intersection
3) North Avenue 8/18, 8/24 2070 3 lanes;
divided
5 3
4) West Avenue 8/18, 8/24 2330 2 lanes;
undivided
7 2
5) Quezon Avenue 8/24, 8/25 2860 4 lanes;
undivided
8 1 Underpass at
Quezon Avenue-
EDSA
intersection;
Main access road
for NKTI, LCP
6) BIR Road 8/25, 8/26,
9/2, 9/7
850 2 lanes;
divided
3 2 Main access road
for PCMC
7) Agham Road 8/25, 8/26,
9/2, 9/7
870 3 lanes;
divided
2 2
8) Segment of
Mindanao Avenue
8/26, 9/2,
9/7
2700 4 lanes;
divided
3 2
9) Visayas Avenue 9/7, 9/15,
9/21, 9/22
2500 3 lanes;
divided
7 1
10) Segment of
Commonwealth
Avenue
9/15, 9/21,
9/22
4480 9 lanes;
divided
5 0 Overpass at
Commonwealth
Avenue-Tandang
Sora Avenue
intersection
11) Kalayaan Avenue 8/25, 9/7,
9/21, 9/22
1840 2-3 lanes;
divided
7 2
12) Quezon
Memorial Circle
8/17, 8/18 1880 10 lanes 7 0 Elliptical road,
590m diameter *In the 4th column, divided means presence of a center island while undivided means absence of a center island.
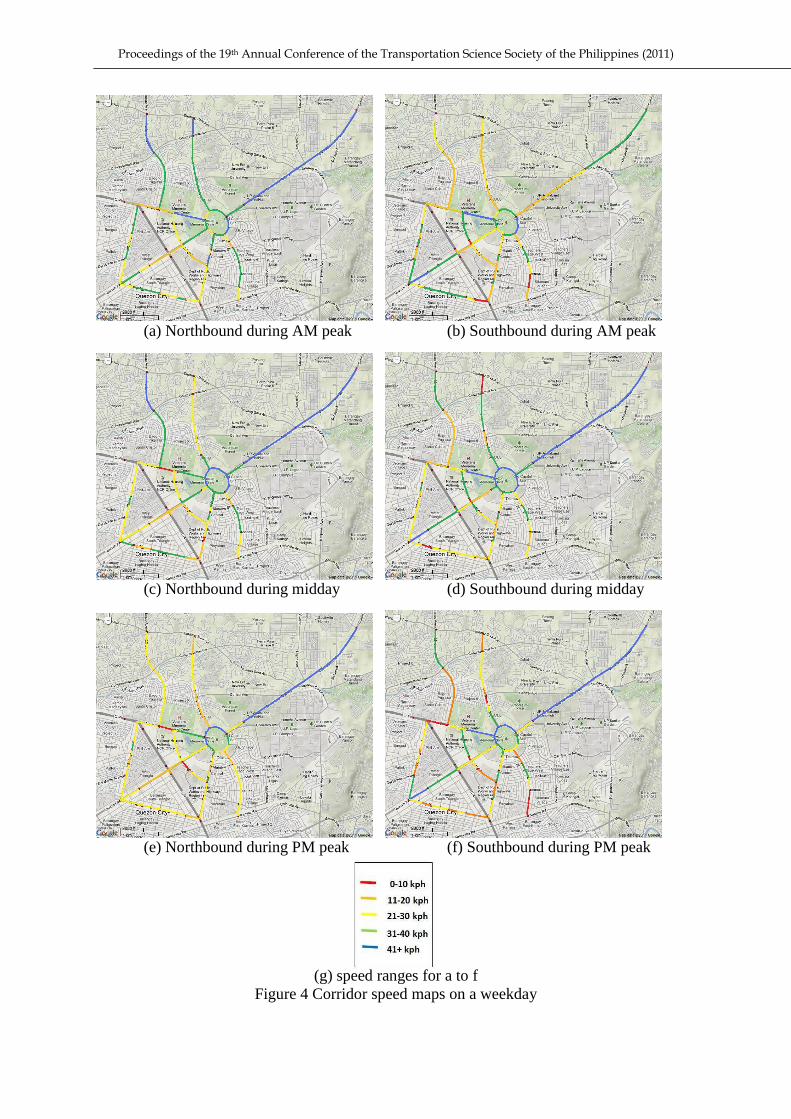
Speeds are further computed based from the numerical values in Tables 3. Average speeds
per segment of the study corridors then are illustrated in the form of speed maps. The
generated speed maps for northbound and southbound directions for each study period are
shown in Fig. 4. The base map used for the figures is obtained from Google Map - a free,
regularly updated map and easily accessible through the worldwide web that can clearly
illustrate study areas and corridors. This further shows the flexibility of Surfer 9.0 software in
using any other reliable map as base map. Similar to the method in preliminary study, certain
colors are assigned to represent different travel speed ranges. Then, the corresponding colors
are designated according to the average travel speeds per segment of the study corridor. Fig 4
visually present the variations of travel speed on each segment of the study corridors during
peak and off-peak periods. Traffic data presented in this manner is easy to understand for
most road users. Visual inspection through such maps allows identification of problematic
segments of roads and possibly the actual land developments along the study corridors that
may have impacts on travel time and delays at certain time periods.
Proceedings of the 19th Annual Conference of the Transportation Science Society of the Philippines (2011)
Table 3. Summary of calculated average travel times for weekday
Study corridor Direction
Average travel time (min)
AM Peak Midday PM Peak
1) East Avenue
(Quezon Memorial Circle-EDSA)
NB 4.23 (±1.51) 7.24 (±5.15) 3.52 (±1.62)
SB 6.13 (±2.89) 5.52 (±2.10) 4.64 (±2.06)
2) Timog Avenue
(EDSA-Quezon Ave.)
NB 4.42 (± 1.18) 6.53 (±2.35) 5.61 (±2.12)
SB 11.11 (±7.29) 8.12 (±3.26) 7.39 (±3.57)
3) North Avenue
(Quezon Memorial Circle-EDSA)
NB 6.69 (±2.40) 6.79 (±1.02) 8.75 (±3.98)
SB 5.87 (±2.91) 5.07 (±2.22) 7.63 (±2.61)
4) West Avenue
(EDSA-Quezon Ave.)
NB 4.66 (±1.64) 5.11 (±1.38) 6.88 (±5.37)
SB 5.82 (±1.13) 5.66 (±1.98) 6.27 (±2.34)
5) Quezon Avenue
(Quezon Memorial Circle-DELTA)
NB 7.04 (±1.90) 8.41 (±3.97) 10.75 (±7.49)
SB 6.24 (±1.80) 6.01 (±1.31) 6.25 (±2.07)
6) BIR Road
(East Avenue-Quezon Ave.)
NB 2.38 (±0.93) 2.97 (±1.40) 3.43 (±0.79)
SB 2.87 (±1.10) 1.90 (±0.95) 2.69 ( ±1.00)
7) Agham Road
(Quezon Avenue-North Ave.)
NB 2.50 ( ±1.00) 1.97 (±0.73) 2.44 (±0.54)
SB 3.35 (±0.63) 2.87 (±0.90) 2.70 (±1.01)
8) Segment of Mindanao Avenue
(North Ave.-Tandang Sora Ave.)
NB 4.04 (±0.70) 4.06 (±0.91) 6.35 (±2.07)
SB 9.78 (±2.57) 9.42 (±2.05) 9.46 (±1.05)
9) Visayas Avenue
(Quezon Memorial Circle-Tandang Sora Ave.)
NB 4.56 (±1.19) 5.71 (±2.10) 11.24 (±6.82)
SB 7.07 (±1.94) 7.79 (±2.50) 10.67 (±8.07)
10) Segment of Commonwealth Avenue
(Quezon Memorial Circle-Don Antonio)
NB 4.97 ( ±0.64) 5.25 (±0.55) 6.25(±1.11)
SB 20.19 (±10.8) 5.14 (±0.38) 5.85(±0.94)
11) Segment of Kalayaan Avenue
(Quezon Memorial Circle-Kamias Road)
NB 4.25 (±1.57) 4.67 (±1.67) 5.31 (±1.98)
SB 8.77 (±7.92) 5.44 (±1.15) 9.83 (±4.86)
12) Quezon Memorial Circle 3.66 (±1.03) 2.76 (±0.47) 3.38 (±1.16)
*NB-northbound; SB-southbound
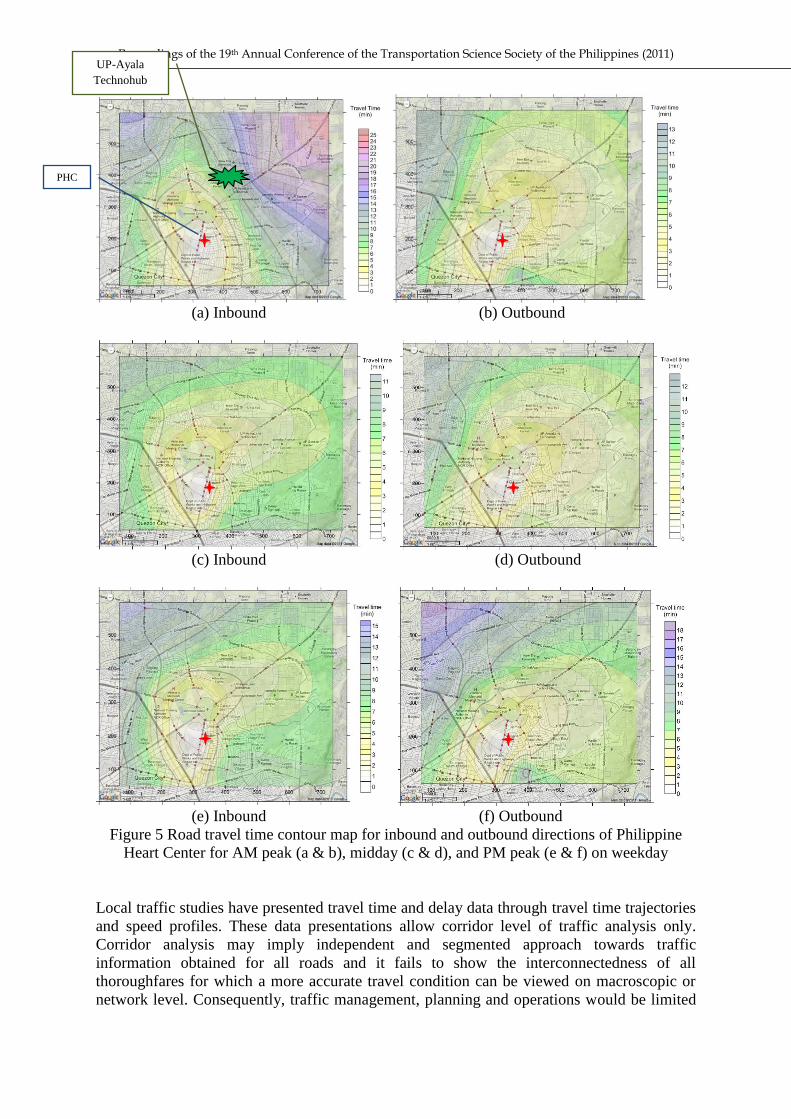
For travel time contours, the point of origin or destination is set at the main entrance of PHC
along East Avenue. Fig. 5 a to f shows the travel time contour maps for inbound and
outbound directions for AM peak, midday, and PM peak periods considering the point of
interest. These are generated by following similar procedures in the preliminary study except
that Djikstra’s shortest path method has been introduced for some trips with more than one
route from origin to destination. The red dots in the maps indicate the interpolation points or
the nodes of the study corridors while the red star indicates the location of the hospital being
considered. Visualization of traffic data through these figures gives information on variations
of travel time for each survey period on a network level.
7. CONCLUSION
The study presents a GPS-based travel time and delay survey and data analysis methodology
that is being developed to gather reliable travel time and delay data of a road corridor. It
presents the development and application of a methodological framework and also data
analysis and presentation through the use of digital maps. An evaluation of the results
obtained with the use of proposed methodology is also performed.
Proceedings of the 19th Annual Conference of the Transportation Science Society of the Philippines (2011)
(a) Northbound during AM peak (b) Southbound during AM peak
(c) Northbound during midday (d) Southbound during midday
(e) Northbound during PM peak (f) Southbound during PM peak
(g) speed ranges for a to f
Figure 4 Corridor speed maps on a weekday
Proceedings of the 19th Annual Conference of the Transportation Science Society of the Philippines (2011)
(a) Inbound (b) Outbound
(c) Inbound (d) Outbound
(e) Inbound (f) Outbound
Figure 5 Road travel time contour map for inbound and outbound directions of Philippine
Heart Center for AM peak (a & b), midday (c & d), and PM peak (e & f) on weekday
Local traffic studies have presented travel time and delay data through travel time trajectories
and speed profiles. These data presentations allow corridor level of traffic analysis only.
Corridor analysis may imply independent and segmented approach towards traffic
information obtained for all roads and it fails to show the interconnectedness of all
thoroughfares for which a more accurate travel condition can be viewed on macroscopic or
network level. Consequently, traffic management, planning and operations would be limited
PHC
UP-Ayala
Technohub
Proceedings of the 19th Annual Conference of the Transportation Science Society of the Philippines (2011)
and may be biased to corridor level decisions only instead of considering and understanding
the possible implications on a network level. In this study, traffic data are presented further
through speed maps and travel time contour maps for a network level of traffic analysis.
Visualizations of traffic data on a network level are relatively new concept in the Philippines.
Speed maps on a network level adequately illustrate the level of service of a road network. In
travel time contour map, the contour lines in the study area indicate the amount of travel time
required to reach or leave an arbitrarily chosen point of interest. Primary uses and
applications for such digital maps would help traffic engineers and planners for improved
traffic management, planning and operations and transport efficiency of goods and people.
Traffic information in the form of digital maps would have an added significance also when
they are easy to understand and very useful for road users apart from its principal technical
uses.
Travel speed maps and travel time contour maps are easy to understand and reflect accurate
travel conditions. Several uses and applications for such digital maps would help traffic
engineers and planners for improved traffic management, planning and operations and
transport efficiency of goods and people. Technical outputs presented in the form of digital
maps would be easy to understand and very useful for road users. For instance, travel time
contour maps of the PHC are valuable for faster emergency response and even for ordinary
citizens who have immediate medical needs that only the PHC could adequately provide.
These maps could also be used for critical situations like in cases of fire so that outside help
will reach the place at the soonest possible time. Such presentation of travel time data would
also be valuable when applied further to other land developments such as malls and factories.
Positional and speed data on a per second basis generated from the GPS device can be further
utilized for vehicle emission analysis by deriving acceleration and or deceleration
characteristic of the test vehicle and also for the development of drive cycles. This gives more
value to the GPS derived traffic data than the information obtained from conventional or stop
watch method.
The use of GPS in this study provides inputs towards the development of a probe car system
but to a certain degree only. This study have shown that the use of GPS device alone allows
post processing of obtained data from survey runs while the probe car system is designed for
real time update and collection of traffic information. For a probe car system to be realized,
other important IT requirements such as communication system and central facility have to
be put in place.
Further travel time and delay studies on weekends using the established methodology for the
same study area may be performed to determine the variations of traffic information and
obtain complete and reliable travel time and delay data. Improving the traffic analysis by
automating or creating a program that would facilitate easier and faster travel time and delay
computations is also recommended. The advent of cellular phones with capabilities similar to
GPS units (e.g., android phones) may also be considered for more cost-effective data
collection. However, these also need to be properly calibrated and their outputs validated for
reliability.
Proceedings of the 19th Annual Conference of the Transportation Science Society of the Philippines (2011)
ACKNOWLEDGMENT
This research was supported by the Engineering Research and Development for Technology
(ERDT) program of the Department of Science and Technology. The first author would also
like to thank the UP National Center for Transportation Studies (NCTS) for providing
assistance and resources needed in undertaking this study.
This paper was reformatted for presentation at the TSSP and is identical to the paper
submitted to EASTS Conference in Jeju, Korea last June 20-23, 2011.
REFERENCES
Byon, Y. J., Shalaby, A., and Abdulhai, B. (2006) Travel time collection and traffic monitoring via
GPS technologies. In: 2006 IEEE Intelligent Transportation Systems Conference. Toronto, Canada
17-20 September 2006.
Czerniak, R., and Reilly, J. (1998). Synthesis of highway practice 258: Applications of GPS for
surveying and other positioning needs in Departments of Transportation. Transportation Research
Board, National Research Council, Washington, D.C.
Inoue, R., Endo, S., and Shimizu, E. (2006) Visualization of road travel time in Tokyo City center
using probe vehicle data. In: Joint Symposium of Seoul Metropolitan Fora & Second International
Workshop on Ubiquitous, Pervasive and Internet Mapping. Seoul, South Korea 23-25 October
2006.
Li, S., Zhu, K., Van Gelder, B. H. W., Nagle, J., and Tuttle, C. (2002). Improving efficiency of
INDOT traffic data collection using GPS devices. Report No. FHWA/IN/JTRP-2002/I9, U.S.
Department of Transportation Federal Highway Administration and Indiana Department of
Transportation.
Li, S., Zhu, K., Van Gelder, B.H.W., Nagle, J., and Tuttle, C. (2002). Reconsideration of sample size
requirements for field traffic data collection using GPS devices. Transportation Research Board
2002 Annual Meeting CD-ROM.
Macababbad, R. J. R., and Regidor, J. R.(2009) ITS: Traffic baseline information obtained using
probe cars is the key to address Metro Manila traffic congestion. In: 17th Annual Conference of
the Transportation Science Society of the Philippines. Manila, Philippines 4 September 2009.
Mauricio, I. C., Santos, R. C., Regidor, J. R., and Tiglao, N. C. (2003) Travel time and delay analysis
using GIS and GPS. In: 5th Eastern Asia Society for Transportation Sudies Conference. ___
McNally, M. G., Marca, J. E., Rindt, C. R., and Koos, A. M. (2003) TRACER: In-vehicle, GPS-based
wireless technology for traffic surveillance and management. California PATH Research Report
UCB-ITS-PRR-2003-23, University of California, Berkeley.
Ohmori, N., Muromachi, Y., Harata, N., and Ohta, K. (2002). Analysis of day-to-day variations of
travel time using GPS and GIS. University of Tokyo, Japan.
Owusu, J., Afukaar, F., and Prah, B. E. K. (2006). Towards improving road traffic data collection:
The Use of GPS/GIS. In: 5th FIG Regional Conference. Accra, Ghana 8-11 March 2006.
Quiroga, C., and Bullock, D. (1999) Travel time information using global positioning system and
dynamic segmentation technique. In Transpotation Research Record: Journal of the
Transportation Research Board No. 1660, TRB, National Research Council, Washington, D. C.,
48-57.
Turner, S. M., Eisele, W. L., Benz, R. J., and Holdener, D. J. (1998). Travel Time Data Collection
Handbook. Report No. FHWA-PL-98-035, U.S. Department of Transportation, Washington, D.C.
Wang, W., and Mizuta, H. (2008) Probe car based traffic information system experiment in Shenyang.
In: 8th International Conference in ITS Telecommunications. Phuket, Thailand 24 October 2008.