goodyear annual report 2000
TRANSCRIPT

700-862-928-67300
A K R O N , O H I O
W W W . G O O D Y E A R . C O M
PRESSURE ALIGNMENT ROTATION TREAD
Pressure — It is important to have the proper air pressure in your tires,as underinflation is the leading cause of tire failure. It results in tirestress and irregular wear.
The correct amount of air for your tires is specified by the vehiclemanufacturer and shown on the vehicle door edge, door post, glovebox door or fuel door. It is also listed in the owner’s manual.
Check your tires’ air pressure at least once a month. This should bedone when your tires have not been driven a distance and are still cold.
Alignment — Misalignment of wheels on the front or rear of your vehi-cle can be caused by hitting a curb or pothole. It can result in unevenand rapid treadwear.
Have your vehicle’s alignment checked periodically as specified inthe owner’s manual or whenever you have an indication of trouble suchas pulling or vibration.
Also, have your tire balance checked periodically. An unbalanced tireand wheel assembly may result in irregular wear.
Rotation — Sometimes irregular tire wear can be corrected by rotatingyour tires. Consult your vehicle’s owner’s manual, the tire manufactureror your tire retailer for the appropriate rotation pattern for your vehicle.
If your tires show uneven wear, ask your tire retailer to check for andcorrect any misalignment, imbalance or other mechanical probleminvolved before rotation.
Tires should be rotated at least every 6,000 miles.
Tread — Tires must be replaced when the tread is worn down to one-sixteenth of an inch in order to prevent skidding and hydroplaning.When built-in treadwear indicators – which look like narrow strips ofsmooth rubber across the tread – appear, the tread is worn out andshould be replaced.
More Information — For more information about tire safety, visit theRubber Manufacturers Association’s Web site at www.rma.org/tiresafetyor Goodyear’s at www.goodyear.com/us/tire_school.
2000 ANNUAL REPORT
THE GOODYEAR TIRE & RU
BBER COMPAN
Y2000 ANNUAL REPORT

About the CoverWhether their age is 55, 25, or even 5,drivers around the world feel secure inknowing that the “Goodyear” on the side-wall means they are riding on the mostdurable, best-performing tires availablefor their pickup, sport utility vehicle,minivan, sedan or sports car.
The children are Kimberly Buchanan and DerekMiller. Their parents’ tires are Goodyear EagleGA, Goodyear Wrangler HT and GoodyearAquatred 3.
About the ChildrenThe children appearing on the front coverand on pages 2, 4, 6, 9, 10 and 13 of thisannual report are all family members ofGoodyear associates. Like many youth,their lives are filled with varied activities,most of which require transportation.Whether the destination is a football game,soccer practice, a dance recital or homefrom school, they travel on Goodyear tires.
About GoodyearGoodyear is the world’s largest tire company. Together with its U.S. and international sub-sidiaries and joint ventures, Goodyear manufactures and markets tires for most applications.It also manufactures and sells several lines of power transmission belts, hose and otherrubber products for the transportation industry and various industrial and consumer mar-kets, as well as rubber-related chemicals for various applications. Goodyear is the world’slargest operator of commercial truck service and tire retreading centers. In addition, itoperates more than 2,000 tire and auto service center outlets. Goodyear manufactures itsproducts in 96 facilities in 28 countries. It has sales and marketing operations in almostevery country around the world.
Financial Highlights 1
To Our Shareholders 2
Goodyear Quality Commitment 7
Innovation for Consumers 11
Financial Contents 15
Management’s Discussion and Analysis 16
Consolidated Financial Statements 32
Notes to Financial Statements 36
Supplementary Data 59
Comparison with Prior Years 60
Report of Management 61
Report of Independent Accountants 61
Board of Directors and Officers 62
Goodyear Worldwide 63
Shareholder Information 64
Trademarks or service marks owned by or licensed toThe Goodyear Tire & Rubber Company or its subsidiariesmentioned in this report include: ,Goodyear, Dunlop, Kelly, Lee, Debica, Fulda, Pneumant,Sava, Wingfoot, Aquatred, Club by Goodyear, Eagle,Eagle NCT5, Eagle Ventura, Gemini, Hi-Q, NavigatorPlatinum TE, Next-Tred, Radial Rover, Regatta, Safari,SP 40 A/S, SP Sport 3000A, Sport 9000, TensionRite,Tiempo, Truckwise, Unisteel and Wrangler.
This report is printed on recycled paper.
Writ
ing
and
phot
ogra
phy:
Goo
dyea
r Gl
obal
Com
mun
icat
ions
Desi
gn:
Brad
ley
Brow
n De
sign
Gro
up,
Inc.
Prin
ting
: Ho
echs
tett
er P
rinting
The Goodyear Tire & Rubber Company1144 East Market StreetAkron, Ohio 44316-0001www.goodyear.com
GOODYEAR | 1
T R U S TEach day, millions of people around the world put their trust inGoodyear. For more than a century, we have worked to earn – and keep – this trust.
Goodyear associates know the critical role tires play in vehicle safety. That is why their families drive on our tires.
We constantly seek ways to improve our products, to make evolutionary changes in existing designs, as well as create revolutionary new ones.
Consumers can trust that the set of Goodyear tires they buy today offers outstanding quality, durability and performance. The next set will be even better.
Financial Highlights
(Dollars in millions, except per share)
Year Ended December 31, 2000 1999
Net Sales $14,417.1 $13,355.4Net Income 40.3 243.2
— Per diluted share .25 1.53
Assets $13,568.0 $13,278.1Debt 3,585.8* 3,424.5*Equity 3,503.0 3,792.6Debt to Debt and Equity 50.6%* 47.4%*
Cash Dividends per Share $ 1.20 $ 1.20Common Shares Outstanding 157,603,962 156,335,120Shareholders of Record 28,778 28,163Average Number of Associates 106,724 100,649
*Debt and Debt to Debt and Equity exclude the Sumitomo 1.2% Convertible Note Payable Due 8/01. Refer to Note 11.
Goodyear 102nd Annual Report Akron, Ohio 44316-0001
GOODYEAR | 2
For Goodyear and our entire industry,2000 was a very difficult year.
While we had record sales, ourearnings were disappointing. Unantici-pated economic and marketplace turmoilimpacted us significantly. We tookaggressive action to temper the impactand better prepare us for the future.
In the face of these difficult condi-tions, Goodyear associates around theworld made outstanding progress inmany areas that offer long-term strate-gic value for our company.
A year that began with strong ship-ments and bright prospects for improvedprofitability became clouded by skyrock-eting raw material and energy costs, aweakening euro and a slowing U.S.economy.
Adding to the turbulence was theAugust recall of 6.5 million tires inNorth America by our competitorBridgestone/Firestone.
Overnight, tires became front-pagenews. Journalists, attorneys, politicians,automakers and government officialsscrutinized the entire industry and itsproducts.
On a positive note, after years ofgiving little thought to their tires, con-sumers began to realize tires are actuallyhighly complex products that combinehundreds of materials and compounds,are uniquely designed for a specific useand require proper care and maintenance.
Millions Turn to GoodyearConsumers – now armed with a betterunderstanding of the important roletires play in their safety and that oftheir families, friends and vehicles –began to abandon bargain brand tiresand turned to name brands they knowand trust. Millions turned to Goodyear.
In the second half of 2000, NorthAmerican replacement market shipmentsof Goodyear-brand tires grew at a pacealmost five times that of the overallmarket. Gains were made in all consumertire categories, from Aquatreds andRegattas for minivans and sedans toWranglers for sport utility vehicles andEagles for sports cars. We intend to keepthese new customers.
Clearly, Goodyear’s long-standingreputation for quality and safety stoodout from the furor and comforted con-cerned motorists. Everyone at Goodyeartakes very seriously the trust consumersput in our products and services. Wealways have, and always will.
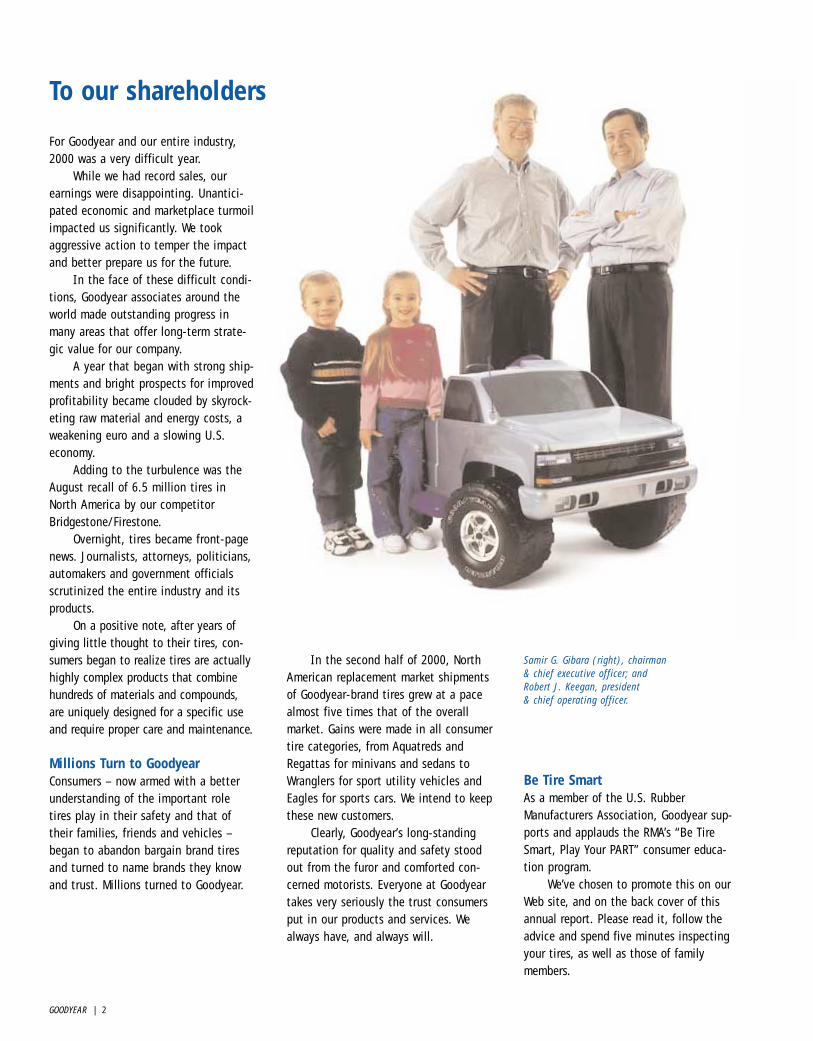
Samir G. Gibara (right), chairman& chief executive officer; and Robert J. Keegan, president & chief operating officer.
To our shareholders
Be Tire SmartAs a member of the U.S. RubberManufacturers Association, Goodyear sup-ports and applauds the RMA’s “Be TireSmart, Play Your PART” consumer educa-tion program.
We’ve chosen to promote this on ourWeb site, and on the back cover of thisannual report. Please read it, follow theadvice and spend five minutes inspectingyour tires, as well as those of familymembers.

GOODYEAR | 3
During the year, we accelerated theintegration of our Dunlop tire businessesand captured more synergies than wehad expected. This acquisition has beenboth a key to our growth strategy and asolid contributor to our financial results.The addition of the Dunlop brand givesus significantly greater strength in themarketplace.
The restructuring of our globaloperations continues. Ongoing invest-ments in productivity allowed us to fur-ther rationalize manufacturing and closesome less-efficient factories. Changes inour administrative practices enabled usto reduce our office staff. In total, dur-ing 2000 and 2001, we will reduce ourworldwide work force by almost 10,000.
We formed a joint venture withTreadco to combine our U.S. truck tireservice and retreading outlets into anetwork of almost 200 service centersand 77 retreading plants. Goodyear ownsapproximately 80 percent of the newbusiness called Wingfoot Commercial TireSystems, and is now the largest providerof truck tire services in the world.
We opened a sales and distributioncenter in Dubai, the chief port and commercial center of the United ArabEmirates. This will allow us to accessmuch more efficiently more than 40 markets in the Middle East, Africa andCentral Asia. We intend to double ourmarket share in the region.
With an eye on tomorrow, we madesignificant strides in our e-commerceefforts. Most notable is the start-up ofRubberNetwork.com, a global electronicpurchasing and procurement marketplaceestablished by Goodyear and five othertiremakers. We believe it will fundamen-tally change the industry’s purchasingpractices and reduce costs throughoutthe supply chain.
Economic ChallengesThe financial benefit of our growth inNorth America’s replacement tire marketwas not enough to offset the industry-wide challenges we faced during 2000.
Prices for oil hit record highs. Thisis significant to our results since 65 per-cent of the raw materials used in a tireare derived from oil.
Because of very competitive mar-ketplace conditions, we were not able toimmediately increase our selling pricesto offset this higher cost. We tried dur-ing the spring. Our sales fell off, andprofits quickly evaporated.
As the year 2000 ended, however,we successfully implemented priceincreases of up to 7 percent in all ofour regional replacement tire business-es. Many of our original equipment cus-tomers agreed to pay more as well.These increases should offset our high-er costs and lead to solid bottom lineprofits in 2001.
Currency movement – in particularthe euro versus the U.S. dollar andBritish pound – hurt results for Goodyearas it did other U.S.-based companieswith a significant European presence.
Pride in Our Accomplishments Our disappointment in 2000’s financialresults cannot conceal our pride in theaccomplishments achieved by Goodyearassociates this past year. They weremany. They were significant. And theywill benefit this company for years tocome.
These efforts were recognized bymany outside of our company. Customers,government agencies, professional organ-izations and journalists were amongthose praising Goodyear’s products andits actions.
Later this year, we plan to unveilseveral e-commerce initiatives focusedon dealers, distributors and truckingfleets, as well as individual consumers.
Product AdvancementsIn North America, the GoodyearAquatred 3 took its place atop our consumer tire lineup. It was joined bythe off-road Wrangler MT/R, the entry-level Club tire and several additions toour Eagle performance tire line.
Our commercial tire groups unveiledproducts for tractor-trailers, roadgraders, heavy service vehicles, farmtractors, recreational vehicles, articulat-ed dump trucks and mining trucks.
Dunlop Tires added several new sizesto its popular Radial Rover light truckand SP 40 A/S passenger car tire lines.
Kelly-Springfield introduced theKelly Safari SUV tire and the NavigatorPlatinum TE, a touring tire that featuresan 80,000 mile limited treadwear war-ranty and free road hazard protection.
Our European businesses launchedcar, truck and farm tires for ourGoodyear, Dunlop and Sava brands.These include the highly successfulGoodyear Eagle Ventura, judged the bestcar tire in the UK; Eagle NCT5; and theDunlop SP Sport 3000A.
GOODYEAR | 4
Additionally, we stepped up market-ing efforts for the Kelly brand in Europeto better take advantage of its ruggedAmerican image in the value-priced segment of that market.
In Asia and Latin America, theadvanced-technology Goodyear EagleVentura, Eagle F1 and Eagle NCT5 pas-senger car tires made successful debuts.
Innovative products from ourEngineered Products business included achemical transfer hose that can operateat temperatures up to 250 degrees andthe Goodyear TensionRite gauge, whichhelps customers eliminate the leadingcause of power transmission belt failure,improper tension.
Technology AdvancementsIn 2000, our strengthened global prod-ucts planning group worked to mergethe needs of our global customers andour regional business units to make usmore effective, efficient and profitable.
In June, we reached an agreementwith our competitor Michelin to jointlydevelop run-flat tire systems that com-bine the best of its Pax system and ourEMT breakthroughs. Our 50-50 joint ven-ture includes agreements on researchand development, licensing of eachcompany’s patents and the creation of aglobal aftermarket service network.
We are extremely proud of our EMTrun-flat technology and the benefits itis bringing automakers and motorists.We are even more excited, however,about the prospects for future run-flatsystems and technology through thishistoric joint venture.
By collaborating, these two verycompetitive companies can serve the bestinterests of consumers, automakers andour individual companies by dramaticallyspeeding the availability of run-flat tiresystems. Together, Goodyear and Michelinwill establish an industry standard and indoing so advance automotive safety.
A new standard will encourageautomakers to add run-flats as originalequipment. Consumer demand is growing.More than half of those responding to astudy of new car owners said they wouldlike run-flat tires on their next vehicle.
Also during 2000, we made strategicinvestments in companies that have rev-olutionized tire pressure monitoring andmaintenance. Our commercialization ofthese technologies from Cycloid Companyand Phase IV Engineering could hastenthe acceptance of run-flat tire systemsand the elimination of low air pressure asa safety concern. Goodyear is deeplyinvolved in the development of leading-edge automotive safety technology.
Our off-road tire business introducedadvanced technology intelligent systemsthat monitor tire performance and allowmine operators to review it on a real-time basis. Engineered Products unveileda conveyor belt monitoring program thatruns on a hand-held computer.
Manufacturing AdvancementsDuring the year we opened a secondchemical manufacturing facility inBeaumont, Texas, announced plans tobuild a molded products plant in Mexicoand signed an agreement with PhoenixAutomotive to share hose manufacturingcapacity in Europe and North America.All of these moves will better allow us toserve our customers.
In contract negotiations, Goodyearmanufacturing associates represented bythe United Steelworkers of Americaagreed to replace wage increases withstock options. This provision, unique inour industry, creates an incentive forassociates to add shareholder value andallows Goodyear to bypass some of thehigher labor costs our competitors willbe forced to absorb.

GOODYEAR | 5
IMPACT, our breakthrough tire man-ufacturing technology, is proving itsvalue through installations at threeplants. Our objective with IMPACT is notto simply automate production, it is toproduce tires with even more precisionand higher quality for our customers.
Outlook for 2001As we enter 2001, indications are thatraw material costs and currencies areslowly beginning to move in a directionthat benefits Goodyear. U.S. auto andtruck sales, however, are slowing fromprevious record high levels.
Goodyear will not wait for externalfactors to increase its profitability. Wehave been aggressively cutting coststhroughout the organization and ration-alizing production. We will be aggressivein increasing prices where market condi-tions allow.
As the replacement tire markets con-tinue their movement toward quality-ori-ented brands, Goodyear is well positionedto profitably grow our market share.
Our plans include taking advantageof the strongest tire brand line-up in theindustry. The Dunlop brand will play anincreasingly important role in NorthAmerica and Europe. We will significant-ly increase Goodyear’s and Dunlop’s marketing support to grow their marketshare during 2001.
In North America, Dunlop is posi-tioned as part of our “G3” package withthe Goodyear and Kelly brands. Thisgives our retailers the opportunity toserve all consumers whether they arebrand-, outlet- or value-oriented.
In Europe, Dunlop joined Goodyearand Fulda as our prestige brand offer-ings. Sava, Debica and Pneumant aremarketed as value-priced brands.
Our sales efforts will be supportedby targeted marketing, advertising and
public relations. We will continue addingdistribution to make it easier for con-sumers to choose tires from theGoodyear family of brands in a crowdedmulti-brand field. Our leadership inchannel management will make surethese tires are available wherever con-sumers want to buy them.
In the face of an auto industryslowdown, we expect our NorthAmerican Tire business to capture moreoriginal equipment wheel positions as agrowing number of new vehicle buyersask for Goodyear tires.
You expect Goodyear to be prof-itable even when circumstances turnagainst us. So do we.
Management Team ChangesDuring 2000, our company made severalmanagement changes that strengthenour leadership for 2001 and beyond.
Most notably, Bob Keegan joinedGoodyear as president and chief operat-ing officer on October 1. He brings 28 years of experience in the consumerproducts arena, most recently as president of Kodak’s global consumerimaging business.
Additionally, we have new leadersin four of our strategic business units.These executives are experienced andhave track records of success. Each hasinitiated changes that hold promise forthis year and the future.
Our management team is commit-ted to a dynamic strategy for 2001 andbeyond aimed at improved sales, prof-itability and cash flow.
Determined to LeadWithout a doubt, the difficult economicand marketplace conditions of 2000have slowed Goodyear’s progress. Theyhave not, however, caused us to lose ourfocus or our determination. We welcomechange in our industry. In fact, we planto aggressively lead it.
With our strategy and core valuesas guideposts, an energized leadershipteam and the unwavering dedication ofGoodyear’s associates around the world,we are committed to delivering superiorperformance to our shareholders.
Respectfully submitted,
Samir G. GibaraChairman & Chief Executive Officer
Robert J. KeeganPresident & Chief Operating Officer

Goodyear has six test tracks where skilled driversevaluate tire performanceunder varying conditions.Still more testing is done onroadways around the world.
Whether they are coming home fromcheerleading practice, on their way tothe football stadium for a game ortraveling to a competition, Kristi Price(left), Lisa Price and Ali Hershbergerride with confidence. Their parentsdrive on Goodyear Integrity, GoodyearEagle HP, Dunlop SP Sport 4000 andKelly Safari SUV tires.
GOODYEAR | 6

GOODYEAR | 7
Goodyear Quality Commitment
oodyear and Quality. The twowords are permanently joined –
and have been for more than a century.From our first carriage tire in 1898
to today’s Aquatred 3 and tomorrow’snext-generation run-flats and automatictire inflation systems, Goodyear hassought to lead the industry in the evo-lution of tires to meet continually newdemands presented by the environment,vehicles and drivers.
Our goal, each and every day, is toprovide the ultimate in quality, securityand performance. Around the world,Goodyear associates work together to
The tests continue even after a tireis approved for production. Normally hidden interior components are madevisible through X-rays, holography andshock wave analysis. Laser vibrationtests are used to review handling char-acteristics. Quality control associatesreview statistical process data and visually inspect individual tires.Randomly selected tires are sent back to our technology centers for even moreanalysis. Still more tires are evaluatedon the roadway, where real-world performance is observed and adjustedfor in future product designs.
Before any tire is sold, we know thatwith proper care it will be the safest,most reliable tire we can manufacture. We know the quality is there whether the tire is designed for use on a car, aminivan, an SUV, a truck, a bus, a tractor,an earthmover or even a jet plane.
Goodyear’s Aquatred 3 tire offersenhancements in wet and dry traction, handling, ride comfort and treadwear over its predecessor.Nearly 65 percent of Aquatred owners buy another set when it istime to replace them.
Goodyear Chemical’s newstate-of-the-science plant,built next to its existingfacility in Beaumont,Texas, produces syntheticrubber and specialty poly-mers for use in tires andother rubber products.
Gimprove our manufacturing systems, ourprocesses, our products and our services.This quality commitment ensuresGoodyear tires, engineered products,chemicals and services offer our cus-tomers superior performance, value and dependability.
In our technology centers, engineersuse advanced computer software, finiteelement analysis and proprietary model-ing programs to develop and test new tiredesigns. Working with our automotivecustomers, we simulate dynamic vehiclebehavior and study how tires performwhen braking, steering, accelerating andskidding under an almost endless varietyof operating conditions. Data analyzedwith Goodyear-developed software allowsour engineers to map treadwear and treadcontact pressures.
Our engineers’ resources alsoinclude computational tools in tiremechanics, materials and manufacturingdeveloped through our seven-year part-nership with the U.S. Department ofEnergy’s Sandia National Laboratories.
Rigorous TestingOnce our engineers are satisfied – andonly when they are satisfied – highlyskilled technicians use the computer-generated design specifications to buildtest tires that undergo rigorous evalua-tion in the laboratory and at our six tireevaluation tracks. Our tire tests loggedmore than 100 million miles last year.

GOODYEAR | 8
Technology for TomorrowGoodyear has made quantum leaps intire performance and durability in recentyears. One example is our ultra-tensilesteel technology, which was developedas the next-generation of passenger tirereinforcement. The world’s strongest tirereinforcement material, ultra-tensilesteel is 40 percent stronger than con-ventional tire wire and, as a sidewallreinforcement, can improve cut resist-ance, handling performance in wet anddry conditions, ride comfort, fuel effi-ciency and treadwear.
This technology allowed the furtherevolution of the run-flat tire. Formotorists, run-flat tires mean they cansafely drive with a damaged tire untilreaching a Goodyear retailer to repair orreplace it.
Goodyear’s next-generation of run-flat tires will use technologies developedthrough our joint ventures with Michelinand help set a new standard for theindustry. Our partnerships with CycloidCompany and Phase IV Engineering willimprove air pressure monitoring systemsand lead to tires that re-inflate them-selves.
Our advancements in polymer sci-ence and rubber compounding have ledto tires with outstanding traction andlong treadwear. Since 1991, three succes-sive generations of Aquatred tires haveexceeded previous levels of traction onrain-soaked roads. Today’s Aquatred 3 hasoutstanding wet and dry traction, plus an80,000-mile limited treadwear warranty.New winter tires from both Goodyear andDunlop offer secure traction on ice, snowor slush.
In our factories, we have begun tomake use of IMPACT, our advanced tiremanufacturing system. Goodyear wouldnot settle for a process that just pro-duces less expensive tires. We insisted onachieving higher levels of precision,quality and manufacturing flexibility. Thisresults in tires of greater uniformity forimproved ride, handling, treadwear anddurability. IMPACT reaffirms our high-quality, low-cost manufacturing leader-ship for the new millennium.
But, even with our latest technolo-gy and manufacturing improvements,tires are not indestructible. The demandsplaced on them, the speeds at whichthey’re driven and the environment inwhich they must perform have becomemore challenging. Even the best tire can fail if it is run under-inflated oroverloaded, or is subjected to a severeimpact.
Goodyear researchers and engineers –working on their own and in collabora-tion with partners around the world –are pushing the limits of technology,nearing breakthroughs that hold thepromise for significantly enhanced tireperformance, durability and safety in the future.
As part of our historic joint venture withMichelin, we are producing Goodyear-designed Pax run-flat tires for evaluationby automakers.
Goodyear has partneredwith Cycloid Company toexpand use of its continu-ous tire pressure monitor-ing and inflation system toautomobiles, light trucks and vans.
The popular Dunlop Radial Rover light truck tire offers sportutility vehicle owners an ideal balance of smooth, quiet on-road performance and off-road traction and durability.

GOODYEAR | 9
Soccer is a year-round sport. Theseyoung players, Carrington Chatman(left), Zachary Clarke and KeeganDare, travel safely every day. Theyand their parents ride on GoodyearRegatta, Goodyear Wrangler ST,Goodyear Wrangler RT/S andGoodyear Wrangler AP tires.
Goodyear Eagle LS tires arechecked before testing on a Chrysler PT Cruiser. Theoriginal equipment tireoffers responsive steeringand a quiet ride to driversof Motor Trend magazine’s2001 Car of the Year.
GOODYEAR | 10
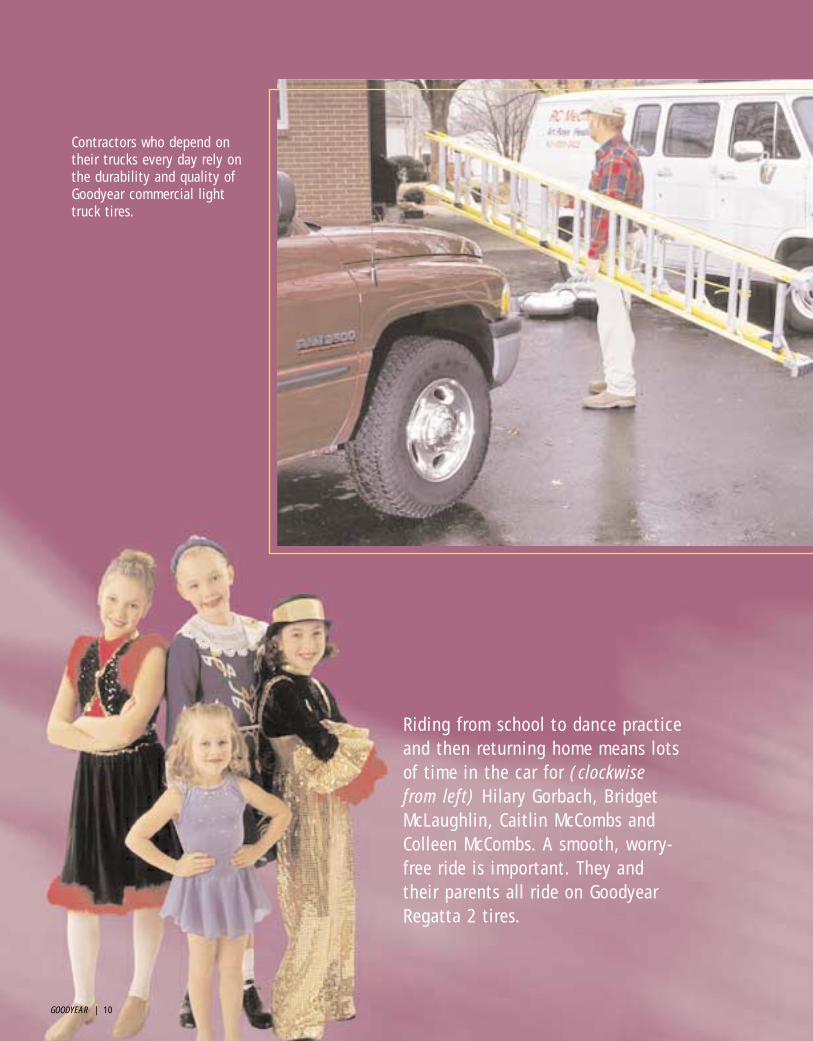
Contractors who depend ontheir trucks every day rely onthe durability and quality ofGoodyear commercial lighttruck tires.
Riding from school to dance practiceand then returning home means lotsof time in the car for (clockwisefrom left) Hilary Gorbach, BridgetMcLaughlin, Caitlin McCombs andColleen McCombs. A smooth, worry-free ride is important. They andtheir parents all ride on GoodyearRegatta 2 tires.

GOODYEAR | 11
oodyear’s customer list extendsfar beyond the tire dealers, mass
merchandisers and manufacturers ofvehicles of all kinds that most wouldexpect. It includes individual motorists,trucking companies, mine operators,farmers, governments and race car drivers, as well as your friends andneighbors.
Goodyear’s position as the world’slargest tiremaker often overshadows thefact that the company also is a majorretailer of tires and automotive services.We are the world’s largest operator ofcommercial truck service and tireretreading centers. We own more than2,000 auto, tire and service centers.
Today’s Aquatred 3 surpasses itspredecessors by setting new standardsfor dry traction, durability, treadwear andride comfort, as well as wet traction.Consumers said they wanted more thanthe world’s best rain tire. Goodyear delivered.
Goodyear’s success with run-flattires in the 1990s prompted imitation.Automakers and consumers became con-fused by the competitive choices. Toaddress this, Goodyear joined with itscompetitor Michelin to deliver an his-toric technology-sharing joint venture.The two companies intend to set a newrun-flat tire standard, ending the confu-sion and making it easy for automakersand consumers to enjoy the advantagesof run-flat tires.
Goodyear’s Wrangler MT/R off-roadtire is winning fans thanks to itsdurability, traction and puncture-resistant sidewalls.
Innovation for Consumers
GThis first-hand knowledge of con-
sumer needs is used to develop sales andmarketing programs for our partners,including tire dealers who operate morethan 70,000 outlets around the world.
Associates in our EngineeredProducts and Chemicals businesses workwith distributors around the world tokeep the wheels of industry turningwith their lines of power transmissionbelts, hoses, conveyor belts, moldedrubber products, air springs and rubberpolymers.
Working closely with individualswho use Goodyear products and services,and learning about their needs andwants, has led to hundreds of innovativeconsumer-focused products.
Since Goodyear set the standard in1905 with the Straight Side tire, whichutilized higher air pressure to give earlymotorists better riding cars, we haveconstantly listened to consumers andresponded by delivering products tomeet their needs.
From the Lifeguard tire in the1930s and the all-season Tiempo in the1970s to the Aquatred and EMT run-flatof the 1990s, Goodyear has focused onconsumers.
Goodyear industrial hose customers are seeingfaster, more accurate deliveries thanks to the addition of a new distribution center inColumbus, Ohio.

GOODYEAR | 12
Tomorrow’s consumer-driven innova-tions – everything from tires with cus-tom-designed treads to computerizedtechnology that allows tires to monitortheir own air pressure and add morewhen it’s needed – are being developedin our technology centers.
To satisfy the needs of our originalequipment customers, Goodyear operatesseveral facilities in which we mounttires onto wheels and ship them on ajust-in-time basis, in sequenced order,to auto and truck assembly plants. Withthis tire-and-wheel system as a base, weare working with automakers to delivermore-advanced systems that includeadditional suspension components.
Outside of our better-known tirebusiness, Goodyear Engineered Productswas built on supplying products thatsatisfy specific customer needs. Whetherthe need is a chemical transfer hosethat can withstand 250-degree tempera-tures, noise-reducing belt and sprocketpower transmission systems or conveyorbelts with built-in sensors that can alertoperators to possible damage, GoodyearEngineered Products delivers for its customers.
Goodyear’s Chemicals business isfocused on providing high-quality spe-cialty polymers, chemical resins and rub-ber chemicals for a broad range of cus-tomers. In addition to the expectedapplications in tires, belts and hoses,Goodyear rubber and chemicals are usedin such items as golf balls, shoes, paint,bandages, carpeting and asphalt.
Service That Keeps Cars RollingOur growing service businesses includesegments focused on consumer vehiclessuch as passenger cars and light trucks,as well as commercial vehicles such asover-the-road trucks.
In the United States, GeminiAutomotive Care is the name consumersare growing accustomed to when lookingfor honest, quality auto service. Geminiassociates focus on putting customers
The Kelly Safari SUV tire offers truck tire toughness andrugged looks with the handling and smooth ride of a passenger car tire.
and customer needs first. Goodyear oper-ates more than 700 of the 1,700 Geminilocations in the United States, withindependent dealers owning the rest.
J. D. Power and Associates ratedGoodyear’s automotive service centersamong the best passenger and light trucktire retailers in the United States. It con-sidered people, service, facilities, reputa-tion and product selection.
They earned three awards from theU.S. Car Care Council for helping womenand families shop more confidently fortires and automotive repair.
With its distinctive V-Tred design, Goodyear’sEagle Ventura performance tire offers out-standing handling on wet and dry roads whileproviding a quiet, comfortable ride. Versionsof the popular tire, tailored to each market,are sold in Asia, Europe and South America.
With more than 1,700 loca-tions – 700 of them ownedand operated by Goodyear –Gemini’s distinctive blue-and-gold elliptical logo is becom-ing a familiar sight all overthe United States. Geminiassociates bring a new levelof customer service to thetire and auto care business.

GOODYEAR | 13
Stranded truckers know help is justa phone call away 24 hours a day,anywhere in North America, withTruckwise, Goodyear’s network ofmore than 500 commercial trucktire centers.
After school is out for the day, manyteenagers head for a car to carry them toextra-curricular activities, part-time jobs or a friend’s home for studying. AnthonyValentine (left), Shelley Buchanan and BrianGorbach know that their tires will get themwherever they are going. They and their parents ride on Goodyear Eagle GT II,Goodyear Eagle ST and Goodyear Regatta 2 tires.

GOODYEAR | 14
North American truck drivers look toTruckwise, our network of more than 500commercial tire centers that are dedicat-ed to providing fleets and owner-opera-tors with “cradle to grave” tire service.Goodyear’s Wingfoot Commercial TireSystems business manages about 200 ofthese locations, with independent deal-ers owning the rest. Truckwise centersoffer Goodyear Unisteel tires, genuineNext-Tred retreads and maintenance. Inaddition, all Truckwise centers provide24-hour emergency roadside service.
In the United Kingdom, Goodyear’sHi-Q retail stores were voted “best ofthe tests” by a popular magazine in acomparison of quick-fit tire chains inJanuary 2001. Of the more than 400outlets, Goodyear owns and operatesabout half.
Strength Fosters GrowthTo remain successful, Goodyear is accel-erating its efforts to be even morefocused on consumers. Our history ofinnovation, growing retail presence andextensive consumer relationships servesas a solid foundation for this change.
We do not intend to neglect ourexisting distribution channels. To thecontrary, we will foster their growth. Ourobjective is to take advantage of ourretail and consumer-focused strengths
and our strong brand names to increaseour presence and profitability in all distri-bution channels – including e-commerce.
No competitor can match Goodyear’sselection of market-driven products orgenerate the consumer preferencethrough its brands. Our strong brandrecognition is enhanced daily by theworld’s largest airship fleet. Goodyear’ssix blimps help television networksbroadcast hundreds of events a year andare seen by millions of consumers. Ourposition as the exclusive tire forNASCAR’s top series adds more exposureto the circuit’s brand-loyal fans.
We will get even closer to the peo-ple who use our products and services sowe can better learn what they want,what they need and – most importantly –what they will buy.
As Goodyear continues this transfor-mation, we will move from being focusedon our customers’ needs to beingobsessed with those needs. This will lead to more innovation and moreopportunity for consumers to selectGoodyear as the company they trust tofill their tire, engineered products,chemicals and service needs.
From the track to the pits and everywherein between, Goodyear tires are seen bymillions of brand-loyal race fans on carsdriven by NASCAR’s biggest stars.
Dunlop’s Sport 9000 high performance tire is sold in NorthAmerica, Europe and Japan.
GOODYEAR | 15
Management’s Discussion and Analysis 16
Consolidated Financial Statements 32
Notes to Financial Statements 36
Supplementary Data 59
Comparison with Prior Years 60
Report of Management 61
Report of Independent Accountants 61
Board of Directors and Officers 62
Goodyear Worldwide 63
Shareholder Information 64
2000 FINANCIAL REVIEW
GOODYEAR | 166
RESULTS OF OPERATIONS(All per share amounts are diluted)
CONSOLIDATEDNet sales in 2000 were $14.42 billion, compared to $13.36 bil-lion in 1999 and $13.08 billion in 1998.
Net income was $40.3 million or $.25 per share in 2000,compared to $243.2 million or $1.53 per share in 1999 and$637.5 million or $4.03 per share in 1998. Net income in 1998included a loss of $34.7 million or $.22 per share on the sale ofthe Company’s oil transportation business.
Accounting ChangesDuring 2000, the Company made the following accounting andreporting changes:
The Company changed its inventory costing method from last-in first-out (LIFO) to first-in first-out (FIFO) for domestic inventories. The change was made in part to achieve a bettermatching of revenues and expenses. The change increased netincome by $44.4 million or $.28 per share in 2000 and $2.1 mil-lion or $.01 per share in 1999. Net income in 1998 was reducedby $44.8 million or $.28 per share. Prior periods have beenrestated to reflect this change.
The Company began reporting expenses for transportation ofproducts to customers as a component of Cost of Goods Sold as a result of the adoption of EITF Issue No. 00-10, “Accounting for Shipping and Handling Fees and Costs”. These costs hadpreviously been reported as a reduction of Net Sales. Transporta-tion costs totaled $526.2 million, $474.9 million and $455.3million in 2000, 1999 and 1998, respectively. The Company alsobegan reporting equity in earnings of affiliates separately on theConsolidated Statement of Income. Prior periods have beenreclassified to reflect these changes.
Net SalesWorldwide tire unit sales in 2000 were 223.3 million units, anincrease of 22.8 million units or 11.4% compared to 1999. TheDunlop businesses acquired from Sumitomo Rubber Industries Ltd.(SRI) on September 1, 1999 contributed 37.3 million units in2000, compared to 14.4 million units in 1999. North American(U.S. and Canada) volume increased 6.9 million units or 6.3% in2000 (including an increase of 8.2 million units from Dunlopoperations), while international unit sales increased 15.9 millionunits or 17.5% (including an increase of 14.7 million units con-tributed by Dunlop operations). Worldwide replacement unit salesincreased 11.7% in 2000, primarily in the European Union andNorth America. Original equipment (OE) unit sales were 10.7%higher in 2000, increasing in all regions outside of North America.
Worldwide tire unit sales in 1999 were 12.9 million units, or6.9%, higher than in 1998. The Dunlop businesses contributed14.4 million units during the last four months of 1999. NorthAmerican Tire volume increased more than 4 million units, whichincluded 4.1 million units contributed by the Dunlop businesses.North American Tire performance was limited by capacity con-straints in certain passenger and truck tire lines resulting fromhigher than anticipated demand from the Company’s OE cus-tomers and national chain merchandisers in the North Americanreplacement market, coupled with closing the Gadsden, Alabamamanufacturing facility and the inability to replace lost capacityto meet increased demand. Total North American volumeincreased 3.8% from 1998 while international unit salesincreased 10.7%. Worldwide OE unit sales rose 8.2% from 1998,while replacement unit sales increased 6.3%. Both the OE andreplacement markets benefited in 1999 from increased volume inNorth America, Europe and Asia. Significant decreases in OE andreplacement unit sales were experienced in Latin American mar-kets in 1999.
Sales increased in 2000 due primarily to higher tire unit salesresulting from the acquisition of the Dunlop businesses. TheDunlop businesses contributed $2.26 billion to 2000 sales, com-pared to $873.4 million in 1999. North American Tire shipmentsin 2000 were adversely impacted by production cutbacks by orig-inal equipment customers in the auto and commercial truckindustries. Revenues in 2000 were adversely affected by continu-ing worldwide competitive pricing pressures and a shift in mix tolower priced tires. In addition, price increases implemented inearly 2000 were met with resistance in the marketplace and as aresult negatively impacted sales of commercial tires in Europeand North America. Price increases were implemented in early2001 in the North American and European replacement markets.
Revenues in 2000 also were adversely impacted by the effectof currency translations on international results, primarily inEurope, where the average value of the Euro versus the U.S. dollar dropped 13.0% from the 1999 average rate. The Companyestimates that versus 1999, currency movements adverselyaffected revenues in 2000 by approximately $450 million.
MANAGEMENT’S DISCUSSION AND ANALYSISOF FINANCIAL CONDITION AND RESULTS OF OPERATIONS

Revenues increased in 1999 due primarily to higher tire unitsales. The Dunlop businesses contributed $873.4 million to1999 sales. Revenues in 1999 were adversely affected by continued worldwide competitive pricing pressures, weak economic conditions in emerging markets and lower unit salesof engineered products. Revenues in 1999 also were adverselyimpacted by the effect of currency translations on internationalresults. The Company estimates that versus 1998, currencymovements adversely affected revenues in 1999 by approxi-mately $390 million.
Cost of Goods SoldCost of goods sold (CGS) was 80.7% of sales in 2000, comparedto 81.1% in 1999 and 78.1% in 1998. Costs in 2000 were favor-ably impacted by the effects of rationalization actions, ongoingcost containment measures and synergies realized in part fromthe strategic alliance with Sumitomo. Margins were adverselyaffected by the worldwide competitive pricing environment and achange in product and market mix to lower margin tires. In addi-tion, costs in 2000 reflected significantly higher energy prices,higher raw material and labor costs and production cutbacks toalign inventory with demand.
The previously mentioned change in inventory costing meth-ods from LIFO to FIFO for domestic inventories reduced CGS by$58.4 million in 2000 and $3.4 million in 1999. CGS in 1998 wasincreased by $72.3 million.
Cost of goods sold in future periods is likely to be unfavorablyimpacted by anticipated increases in energy and raw materialprices. In addition, the Company negotiated a new labor agree-ment in the United States that is anticipated to result in highercosts in future periods. These costs may not be recoverable inthe market due to pricing pressures present in today’s highlycompetitive market.
Cost of goods sold increased in dollars and as a percent tosales in 1999 due primarily to higher unit costs associated withlower production levels resulting from the Company’s program torealign capacity and reduce inventories. Also reflected arehigher research and development costs. In addition, theCompany incurred operating charges for inventory writeoffs andadjustments. These charges relate primarily to inventory write-offs resulting from the realignment of North American tire brandpositioning and replacement market distribution strategies andthe exit from the Championship Auto Racing Teams and IndyRacing League (CART/IRL) racing series. Cost of goods sold in1999 also reflected a change in product and market mix tolower priced and lower margin tires and lower margin channelsof distribution.
Research and development expenditures in 2000 were $423.1million, compared to $438.0 million in 1999 and $420.7 millionin 1998. Research and development expenditures in 2001 areexpected to be approximately $400 million.
SAGSelling, administrative and general expense (SAG) in 2000 was15.5% of sales, compared to 15.1% in 1999 and 14.4% in 1998.SAG increased in dollars and as a percent to sales in both 2000and 1999 due to the acquisition of, and higher SAG levels at, theDunlop businesses acquired on September 1, 1999. SAG benefitedin 2000 and 1999 from the favorable impact of ongoing world-wide cost containment measures.
Interest ExpenseInterest expense in 2000 was $282.6 million, compared to $179.4million in 1999 and $147.8 million in 1998. Interest expenseincreased due to higher debt levels incurred primarily to fund theacquisition of the Dunlop businesses, increased market interestrates and an increase in the Company’s cost of borrowing.
Other (Income) and ExpenseOther (income) and expense was $27.8 million in 2000, com-pared to $(147.1) million in 1999 and $(76.5) million in 1998. Again of $5.0 million ($3.2 million after tax or $.02 per share)was recorded in 2000 on the sale of land at a manufacturingfacility in Mexico.
During 1999, other (income) and expense included a gaintotaling $149.7 million ($143.7 million after tax or $.90 pershare) on the change in control of 25% of the European busi-nesses contributed to Goodyear Dunlop Tires Europe B.V. by theCompany. In addition, proceeds of $17.0 million ($11.1 millionafter tax or $.07 per share) were realized in 1999 from theCompany’s sale of customer lists and formulations in connectionwith its exit from the production of certain rubber chemicals.Interest income increased in 1999 due primarily to higher inter-est rates received on time deposits.
The Company recorded gains in 1998 totaling $123.8 million($76.4 million after tax or $.48 per share) on the disposition ofa latex processing facility in Georgia and the sale of six distribu-tion facilities in North America and certain other real estate. Acharge of $15.9 million ($10.4 million after tax or $.07 pershare) was recorded in 1998 for the settlement of several relatedlawsuits involving employment matters in Latin America. Interestincome decreased in 1998 due primarily to lower levels of timedeposits worldwide.
For further information, refer to the note to the financialstatements No. 4, Other (Income) and Expense.
GOODYEAR | 17
MANAGEMENT’S DISCUSSION AND ANALYSISOF FINANCIAL CONDITION AND RESULTS OF OPERATIONS (CONT INUED)
GOODYEAR | 18
Foreign Currency ExchangeForeign currency exchange gains were $6.7 million in 2000,$27.6 million in 1999 and $2.6 million in 1998. Foreign currencyexchange in 1999 benefited from the impact of currency move-ments on U.S. dollar denominated monetary items, primarily inBrazil.
Equity in Earnings of AffiliatesEquity in earnings of affiliates was a loss of $22.4 million in2000, compared to income of $10.3 million in 1999 and $10.6million in 1998. The loss in 2000 was due primarily to operatinglosses and rationalization charges incurred by South Pacific Tyres,Ltd. (SPT), an Australian tire manufacturer in which the Companyowns a 50% equity interest. The Company’s share of rationaliza-tion charges recorded by SPT in 2000 totaled $16.1 million($10.5 million after tax or $.07 per share).
Income TaxesThe Company’s effective tax rate was 20.0%, 16.7% and 26.8%in 2000, 1999 and 1998, respectively. The effective rate in 2000increased from 1999 due to the nontaxable character of the$149.7 million gain in 1999 resulting from the change in controlof 25% of the Company’s businesses contributed to the Europeanjoint venture with Sumitomo.
For further information, refer to the note to the financialstatements No. 16, Income Taxes.
OutlookSales and earnings in future periods are likely to be unfavorablyimpacted if the dollar strengthens versus various foreign curren-cies. In addition, anticipated continued lower OE demand, alongwith increases in energy and raw material prices and labor costs,which may not be recoverable in the market due to pricing pressures present in today’s highly competitive market, are alsoexpected to adversely affect earnings. The Company is unable to predict the impact of currency fluctuations and economic conditions on its sales and earnings in future periods. Similarly,continued volatile economic conditions in emerging marketscould adversely affect sales and earnings in future periods.
Discontinued OperationsOn July 30, 1998 the Company completed the sale of substan-tially all of the assets and liabilities of its oil transportationbusiness. The loss on the sale, net of income from operationsduring 1998, totaled $34.7 million after tax or $.22 per share.
The transaction was accounted for as a sale of discontinuedoperations and prior period financial information has beenrestated as required. For further information, refer to the note tothe financial statements No. 22, Discontinued Operations.
RATIONALIZATION ACTIVITY2000 Rationalization Actions - The Company recorded rationaliza-tion charges totaling $118.2 million in the fourth quarter of2000 ($93.7 million after tax or $.59 per share) related to globalworkforce reductions and manufacturing facility consolidations inEurope, Latin America and Asia. The Company also recorded ratio-nalization charges totaling $1.2 million in the third quarter of2000 ($1.2 million after tax or $.01 per share) related to theclosing of its tire manufacturing facility in Italy initiated in 1999(which is for negotiated benefits accepted in the third quarter of2000). The Company also recorded net rationalization chargestotaling $4.7 million ($5.2 million after tax or $.03 per share) inthe second quarter of 2000 related to the closure of the Italianmanufacturing facility (which is for negotiated benefits acceptedin the second quarter of 2000) and associate reductions due tosales office consolidation in Europe following the Company’sDunlop acquisition. In the fourth quarter of 1999, the Companytook a charge for the closure of the Italian facility, however thatcharge did not include certain associate benefit amounts thathad not been negotiated at that time.
The Company anticipates recording additional rationalizationcharges in income in the first quarter of 2001 of approximately$60 million to $65 million. These charges will be for consolida-tions at manufacturing facilities and additional global workforcereductions of approximately 1,300 associates. The Companyanticipates that, through these actions, it will reduce costs byapproximately $150 million in 2001 and approximately $250 mil-lion annually thereafter.
MANAGEMENT’S DISCUSSION AND ANALYSISOF FINANCIAL CONDITION AND RESULTS OF OPERATIONS (CONT INUED)

GOODYEAR | 19
1999 Rationalization Actions - Rationalization actionsapproved in the first quarter of 1999 to reduce costs andincrease productivity and efficiency consisted of the terminationof tire production at the Gadsden, Alabama manufacturing facil-ity and the downsizing and consolidation of tire manufacturingfacilities at Freeport, Illinois and 12 other locations in Europeand Latin America, as well as certain asset sales and other exitcosts. The plan provided for the release of approximately 4,000associates worldwide, other exit costs related to the plant down-sizing and consolidation actions, additional costs related to theexit from Formula 1 racing and the anticipated loss on the saleof a rubber plantation in Asia. The Company decided to resumetire production in a portion of the Gadsden plant, resulting in areduction of the number of associates to be released by approxi-mately 500 and the reversal of $44.7 million. The balance of the$167.4 million charge was $6.4 million at December 31, 1999,and these actions were completed during 2000.
During the third quarter of 1999, continued competitive con-ditions in the markets served by the Company resulted in theapproval of a number of rationalization actions. The plans con-sisted of the decision to terminate tire production at theArgentina manufacturing facility, the reduction of staffing levelsin North American Tire operations and the exit from theCART/IRL racing series. The planned actions relate to the reduc-tion of approximately 340 associates, early termination ofcontracts with various racing teams and the writeoff of equip-ment taken out of service. Of the $46.5 million of chargesrecorded, $19.2 million related to non-cash writeoffs and $27.3million related to future cash outflows. The remaining balancewas $13.0 million at December 31, 1999, and these actions werecompleted during 2000.
The Company committed to rationalization actions in thefourth quarter of 1999 to reduce costs and increase productivity.The plans related to the reduction of approximately 800 associ-ates in North America and a facility in Europe, as well as theCompany’s exit from the CART/IRL racing series. The Companyexpects these actions to be completed during 2001. TheCompany recorded charges of $26.2 million, all of which relatedto future cash outflows. The balance remaining was $4.3 millionand $21.8 million at December 31, 2000 and 1999, respectively.
During 1999, the Company recorded net rationalizationcharges of $171.6 million ($132.5 million after tax or $.84 pershare). The charges for rationalization plans adopted in 1999were as follows:
(In millions) Pretax After Tax Per Share
First quarter 1999 program $167.4 $116.0 $ .74Third quarter 1999 program 46.5 42.4 .27Fourth quarter 1999 program 26.2 19.3 .12Total 1999 rationalization charges $240.1 $177.7 $1.13
The rationalization charges reversed and credited toRationalizations on the Consolidated Statement of Income during1999 were as follows:
(In millions) Pretax After Tax Per Share
Second quarter 1999 $ (9.6) $ (6.0) $ (.04)Third quarter 1999 (40.4) (26.7) (.17)Fourth quarter 1999 (18.5) (12.5) (.08)Total 1999 rationalization credits $(68.5) $(45.2) $(.29)
MANAGEMENT’S DISCUSSION AND ANALYSISOF FINANCIAL CONDITION AND RESULTS OF OPERATIONS (CONT INUED)
GOODYEAR | 20
The $68.5 million of reversals consisted of $44.7 million relatedto the decision to resume production of certain passenger tirelines in a portion of the Gadsden, Alabama facility due to higher-than-expected demand in North America and the high cost oftime delays associated with installing additional capacity atother plants. Of the $44.7 million reversed, $38.9 million relatedto pension curtailment costs and associate severance costs notrequired and $5.8 million related primarily to noncancellablecontracts again utilized. Additionally, the reversals consisted of$6.8 million related to the abandonment of the plan to relocatecertain agricultural tire production to Turkey due to rationaliza-tion opportunities presented by the Dunlop joint venture inEurope and production difficulties following a major earthquakein Turkey. The remaining $17.0 million of the reversals resultedfrom the evaluation of the reserves at each balance sheet dateand the identification of amounts no longer needed for theirintended purposes, primarily related to the 1997 and the 1996rationalization programs.
1998 Rationalization Actions - During 1998, the Company didnot adopt any rationalization plans. The Company continued toimplement previously adopted rationalization programs and alsoreversed and credited to Rationalizations $29.7 million ($19.6million after tax or $.12 per share) of charges originally made inrespect of the 1997 rationalization program, which consisted of$22.0 million resulting from favorable settlement of obligationsrelated to the Company’s exit from the Formula 1 racing seriesand $7.7 million related to plant downsizing and closure activi-ties.
2000 ProgramThe Company committed to rationalization actions in the secondand fourth quarters to reduce costs and increase productivity andefficiency. These actions consisted of global workforce reductionsand manufacturing facility consolidations in Europe, LatinAmerica and Asia. The Company recorded charges totaling $119.4million ($95.0 million after tax or $.59 per share), of which$86.4 million related to future cash outflows, primarily for asso-ciate severance costs and $33.0 million related to non-cashwriteoffs.
Under the 2000 program, 500 associates were released in2000 at a cost of $19.4 million. The Company plans to releaseapproximately 5,100 more associates under the above programsduring 2001. The remaining reserve for costs related to the com-pletion of the 2000 program was $82.0 million at December 31,2000.
1999 ProgramThe Company committed to a number of rationalization actionsin the first, third and fourth quarters of 1999 totaling $240.1million. An additional charge totaling $6.0 million ($6.0 millionafter tax or $.04 per share) related to the 1999 program wasrecorded in 2000, resulting from contract settlements negotiatedin the second, third and fourth quarters as part of the closure ofthe Company’s tire manufacturing facility in Italy. These chargesare for associates who accepted negotiated benefits in thoserespective periods. The balance of the provisions recorded underthe 1999 program totaled $4.3 million and $41.2 million atDecember 31, 2000 and 1999, respectively. The Companyreversed $1.3 million of rationalization reserves during the sec-ond quarter of 2000 identified as no longer needed for theiroriginally intended purposes.
Under the 1999 program, approximately 450 associates werereleased in 2000 at a cost of $30.6 million. These associateswere primarily hourly and staff associates in Italy and productionand support associates at a Latin American facility. The Companyplans to release approximately 350 more associates under the1999 program during 2001. The remaining reserve for associate-related costs related to the completion of the 1999 program was$4.3 million and $29.4 million at December 31, 2000 and 1999,respectively.
Rationalization costs, other than for associate-related costs,totaling $11.0 million were incurred during 2000. These costswere primarily for contract settlement costs as a result of theCompany’s exit from the Championship Auto Racing Teams andIndy Racing League (CART/IRL) racing series. These actions werecompleted during 1999. The remaining reserve for other thanassociate-related costs related to the completion of the 1999program was $11.8 million at December 31, 1999.
Previous ProgramsThe Company has completed the actions under its rationalizationprograms from previous periods, with the exception of deferredbenefit payments to associates who have been released and pay-ments under noncancellable leases.
MANAGEMENT’S DISCUSSION AND ANALYSISOF FINANCIAL CONDITION AND RESULTS OF OPERATIONS (CONT INUED)

GOODYEAR | 21
Dunlop ProgramThe following rationalization actions have been recorded asadjustments to the purchase price allocation in respect of theacquired Dunlop businesses, and did not affect the ConsolidatedStatement of Income.
The Company committed to certain rationalization actionsrelated to the Dunlop businesses acquired from Sumitomo onSeptember 1, 1999, for the purpose of optimizing market growthopportunities and maximizing cost efficiencies. The Companyrecorded costs in 1999 and 2000 totaling $67.1 million, substan-tially all of which were for future cash outflows. Under theserationalization programs, associate-related costs for the releaseor relocation of approximately 2,000 production, support, techni-cal, retail and administrative associates totaling $52.8 millionwere recorded, and rationalization costs, other than associate-related costs, totaling $14.3 million were recorded primarily forlease cancellations and future rental payments under noncan-cellable leases. Through December 31, 2000, costs totaling $38.9million had been incurred. The remaining balance of these provi-sions at December 31, 2000 totaled $28.2 million.
The Company expects that these actions will be completedduring 2001, except for future rental payments under noncan-cellable leases. Annual pretax savings of approximately $300million are expected when the planned actions have been fullyimplemented.
For further information, refer to the note to the financialstatements No. 3, Rationalizations.
Strategic AllianceOn September 1, 1999, the Company commenced operationsunder a global alliance with Sumitomo Rubber Industries Ltd.(“Sumitomo”) which included, among other things, the formationof tire manufacturing and sales joint ventures. In addition to itsbusinesses contributed to the joint ventures, the Company paid$931.6 million to Sumitomo and its affiliates, which wasfinanced by the issuance of additional debt.
Under the global alliance agreements, the Company acquired75%, and Sumitomo owned 25%, of Goodyear Dunlop TiresEurope B.V., a Netherlands holding company. Concurrently, theholding company acquired substantially all of Sumitomo’s tirebusinesses in Europe, including eight tire manufacturing plantslocated in England, France and Germany and sales and distribu-tion operations in 18 European countries, and most of theCompany’s tire businesses in Europe. Excluded from the Europeanjoint venture are the Company’s tire businesses in Poland (otherthan a sales company), Slovenia and Turkey (as well as Moroccoand South Africa), the Company’s aircraft tire businesses, and theCompany’s textile, steel tire cord and tire mold manufacturingplants, a technical center and related facilities located inLuxembourg.
The Company also acquired 75%, and Sumitomo acquired25%, of Goodyear Dunlop Tires North America Ltd., a holdingcompany that purchased Sumitomo’s tire manufacturing opera-tions in North America and certain of its related tire sales anddistribution operations. In addition, the Company acquired 100%of the balance of Sumitomo’s Dunlop Tire distribution and salesoperations in the United States and Canada. The Company alsoacquired a 25% (and Sumitomo acquired a 75%) equity interestin each of two tire companies in Japan, one for the distributionand sale of Goodyear-brand passenger and truck tires in thereplacement market in Japan and the other for the distributionand sale of Goodyear-brand and Dunlop-brand tires to originalequipment manufacturers in Japan. The Company transferred cer-tain assets of its subsidiary located in Japan in exchange forsuch equity interests and approximately $27 million in cash.
The Company also acquired a 51% (and Sumitomo acquired a49%) equity interest in a company that will coordinate and dis-seminate commercialized tire technology among the Company,Sumitomo, the joint ventures and their respective affiliates, andan 80% (and Sumitomo acquired a 20%) equity interest in aglobal purchasing company. The global alliance Agreements alsoprovided for the investment by the Company and Sumitomo inthe common stock of the other.
The Company accounted for the strategic alliance using thepurchase method. The cost of the acquired businesses totaledapproximately $1.24 billion, including the cash payment of$931.6 million and the fair value of 25% of the Goodyear busi-nesses contributed to the European joint venture, or $307million. In addition, the Dunlop businesses contributed to thejoint venture companies by Sumitomo included $130 million ofdebt. The Company will amortize substantially all of the approxi-mately $367 million of goodwill recorded on the transaction on astraight-line basis over 40 years. The Company recognized a gainof $149.7 million ($143.7 million after tax or $.90 per share) onthe change of control of 25% of the businesses it contributed tothe European joint venture.
MANAGEMENT’S DISCUSSION AND ANALYSISOF FINANCIAL CONDITION AND RESULTS OF OPERATIONS (CONT INUED)

GOODYEAR | 22
In connection with the acquisition of the Dunlop businesses,the Company undertook an extensive analysis and assessment ofthe various activities of the combined businesses in order tooptimize market growth opportunities as well as maximize costefficiencies. The actions under the plan included the downsizingor consolidation of various manufacturing, sales, support anddistribution operations. The Company has finalized and imple-mented the integration plan and recorded $67.1 million asadjustments to the acquisition cost since September 1, 1999.Although the integration plan has been implemented, certainactions have not yet been fully executed and will be completedin 2001.
For further information, refer to the notes to the financialstatements No. 2, Strategic Alliance, No. 3, Rationalizations andNo. 8, Investments.
Year 2000In preparation for the rollover to the year 2000, during 1997,1998 and 1999 the Company inventoried and assessed all datesensitive technical infrastructure and information and transactionprocessing computer systems (“I/T Systems”) and its potentiallydate sensitive manufacturing and other operating systems(“Process Systems”), including those that use embedded technol-ogy such as micro-controllers and micro-processors, to determinethe actions required to render the I/T Systems and ProcessSystems year 2000 compliant. The Company tested and, whennecessary, remediated or replaced non-compliant I/T Systemsprior to December 31, 1999.
The Company’s year 2000 compliance efforts were successful.Its ability to manufacture and distribute its products was notimpaired by year 2000 issues and it did not incur liability forbreach of contract or other harm arising out of any failure of itsI/T Systems and Process Systems to be year 2000 compliant.
The EuroOn January 1, 2002, the Euro will become the sole lawful cur-rency of each member state of the European Monetary Union. TheCompany is actively preparing for the conversion of all informa-tion systems software to the Euro, which will become thefunctional currency of most of its European businesses. This conversion will not have a material impact on results of opera-tions, financial position or liquidity of its European operations.
Recently Issued Accounting StandardsOn January 1, 2001, the Company adopted Statement ofFinancial Accounting Standards No. 133, “Accounting forDerivative Instruments and Hedging Activities”, as amended andinterpreted (SFAS 133). SFAS 133 requires all derivatives to berecognized as assets or liabilities and measured at fair value.Changes in such fair value will impact earnings to the extent ofany ineffectiveness in hedging relationships. The adoption ofSFAS 133 did not result in any significant adverse impact on theCompany’s interest rate or foreign exchange risk managementactivities, and did not have a material impact on the Company’sresults of operations, financial position or liquidity. Results ofoperations and financial position in this Annual Report do notreflect the adoption of SFAS 133.
SEGMENT INFORMATIONSegment information reflects the strategic business units of theCompany, which are organized to meet customer requirementsand global competition. The tire business is managed on aregional basis. Engineered Products and Chemical Products aremanaged on a global basis.
Results of operations in the tire and engineered productsbusiness segments were measured based on net sales to unaffili-ated customers and EBIT. Results of operations of the chemicalbusiness included transfers to other segments. EBIT is computedas follows: net sales less cost of goods sold, selling, administra-tive and general expense (including allocated centraladministrative expenses) and equity in earnings of affiliatedcompanies.
Segment EBIT was $599.0 million in 2000, $544.6 million in1999 and $1.05 billion in 1998. Segment operating margin in2000 was 4.0%, compared to 3.9% in 1999 and 7.8% in 1998.
During 2000, the Company made the previously mentionedchange in its inventory costing method for domestic inventories.Prior periods have been restated. The change increased segmentoperating income by $58.4 million in 2000 and $3.4 million in1999, but decreased segment operating income by $72.3 millionin 1998.
Segment EBIT does not include the previously discussed ratio-nalizations and certain items reported in Other (Income) andExpense. For further information, refer to the note to the finan-cial statements No. 20, Business Segments.
MANAGEMENT’S DISCUSSION AND ANALYSISOF FINANCIAL CONDITION AND RESULTS OF OPERATIONS (CONT INUED)
GOODYEAR | 23
North American TireNorth American Tire segment sales in 2000 were $7.11 billion,increasing 7.0% from $6.65 billion in 1999 and 9.3% from $6.51billion in 1998.
Unit sales in 2000 were 115.9 million, increasing 6.3% from1999 and 10.4% from 1998. Dunlop operations contributed 12.3million units in 2000, compared to 4.1 million in 1999.Replacement unit sales in 2000 increased 10.7% from 1999 and13.3% from 1998. Original equipment volume in 2000 decreased2.1% from 1999 but increased 4.5% from 1998.
Sales in 2000 increased from 1999 due to the acquisition ofthe Dunlop businesses in the United States and Canada. TheDunlop businesses contributed $755.0 million to sales in 2000,compared to $252.3 million in 1999. Sales in the last fourmonths of 2000 benefited from increased volume resulting fromthe recall of 6.5 million Firestone tires. Sales reflected improvedcustomer fill rates from 1999, but revenues were adverselyimpacted by reduced tire shipments resulting from productioncutbacks by original equipment customers in the auto and com-mercial truck industries. In addition, price increases implementedearlier in 2000 met with resistance in the marketplace and as aresult negatively impacted sales of commercial tires in NorthAmerica. Price increases were implemented in early 2001 in thereplacement market.
Sales in 1999 increased from 1998 due to higher tire unitsales resulting from the acquisition of the Dunlop businesses.Revenues in 1999 were adversely impacted by competitive pric-ing pressures and a shift in mix to lower margin tires. TheCompany also experienced unanticipated product shortages ofcertain passenger and truck tire lines and sizes.
North American Tire segment EBIT was $260.7 million in2000, compared to $26.3 million in 1999 and $314.2 million in1998. Operating margin in 2000 was 3.7%, compared to .4% in1999 and 4.8% in 1998. The change in inventory costing meth-ods increased operating income by $46.5 million in 2000 and$6.5 million in 1999, but decreased operating income by $65.3million in 1998.
EBIT in 2000 increased from 1999 due to the acquisition ofthe Dunlop businesses, lower SAG resulting from cost reductionprograms and the inclusion of nonrecurring costs in EBIT in1999. EBIT in 2000 also benefited from increased consumerreplacement shipments due to the Firestone recall. EBIT wasadversely affected by significantly higher energy costs, increasedraw material and labor costs and production cutbacks to betteralign inventory with OE demand.
EBIT in 1999 decreased from 1998 due primarily to increasedproduction costs associated with higher unit volumes, shifts inmix to lower margin tires, competitive pricing conditions,reduced capacity utilization rates during the first half of 1999due to realignment of capacity and inventory reduction measures,increased distribution costs, higher labor costs and higherresearch and development costs. EBIT in 1999 also includedcharges for inventory writeoffs and adjustments resulting primar-ily from the realignment of brand positioning and replacementmarket distribution strategies occasioned by the addition of theDunlop brand on September 1, 1999 and from the Company’s exitfrom CART/IRL racing. EBIT was favorably affected in 1999 bythe acquisition of the Dunlop Tire businesses in the UnitedStates and Canada.
EBIT in 2000 did not include net rationalization credits total-ing $.7 million. EBIT in 1999 did not include net rationalizationcharges totaling $71.5 million. EBIT in 1998 did not include $7.7million of credits resulting from rationalization reversals andgains on asset sales totaling $44.1 million.
Revenues and EBIT in the North American Tire segment maybe adversely affected in future periods by the effects of contin-ued competitive pricing conditions, lower demand by OEcustomers, changes in mix, rising raw material and energy pricesand currency translations. General economic conditions mayaffect demand from OE customers.
MANAGEMENT’S DISCUSSION AND ANALYSISOF FINANCIAL CONDITION AND RESULTS OF OPERATIONS (CONT INUED)

GOODYEAR | 24
European Union TireEuropean Union Tire segment sales in 2000 were $3.20 billion,increasing 21.0% from $2.64 billion in 1999 and 49.5% from$2.14 billion in 1998.
Unit sales in 2000 were 60.3 million, increasing 31.8% from1999 and 70.1% from 1998. Dunlop operations contributed 25.0million units in 2000, compared to 10.3 million in 1999.Replacement unit sales in 2000 increased 28.6% from 1999 and67.7% from 1998. Original equipment volume in 2000 increased39.8% from 1999 and 76.0% from 1998.
Sales in 2000 increased from 1999 due to the acquisition ofthe Dunlop businesses. The Dunlop businesses contributed $1.50billion to sales in 2000, compared to $621.1 million in 1999.Revenues were adversely impacted by the decrease in the valueof the Euro versus the U.S. dollar, competitive pricing, especiallyin England and Germany, lower volume in some market segmentsand a change in mix to lower priced tires. The Company esti-mates that the effects of currency translation adversely affectedEuropean Union Tire segment sales by approximately $300 mil-lion in 2000.
Revenues in 1999 increased from 1998 due to higher tire unitsales resulting from the acquisition of the Dunlop businesses,which contributed $621.1 million to 1999 sales. Revenues in1999 were adversely impacted by the effects of currency transla-tion and competitive pricing pressures.
European Union Tire segment EBIT was $88.7 million in 2000,decreasing 52.8% from $188.0 million in 1999 and 55.6% from$199.7 million in 1998. Operating margin in 2000 was 2.8%,compared to 7.1% in 1999 and 9.3% in 1998.
EBIT in 2000 decreased from 1999 due to competitive marketconditions, manufacturing inefficiencies resulting from the relo-cation of tire production from England to the European continentand the closure of a tire plant in Italy, and higher raw materialand energy prices. In addition, the Company estimates that theeffects of currency translations reduced operating income byapproximately $20 million in 2000. EBIT was favorably affectedin 2000 by higher tire unit sales resulting from the acquisition ofthe Dunlop businesses.
EBIT in 1999 decreased from 1998 due primarily to lower mar-gins as a result of pricing pressures. EBIT in 1999 was alsoadversely impacted by increased costs resulting from ongoingprograms to align production with inventory, the effects of cur-rency translations and higher SAG.
EBIT in 2000 did not include net rationalization charges total-ing $23.3 million. EBIT in 1999 did not include netrationalization charges totaling $2.8 million. A gain totaling$149.7 million resulting from the change in control of 25% ofthe Company’s businesses contributed to the European joint ven-ture was also not included in 1999 EBIT. EBIT in 1998 did notinclude gains totaling $3.2 million from asset sales.
The Company anticipates that it may incur additional rational-ization charges totaling approximately $10 million to $12 millionin 2001, related to the closure of its tire manufacturing facilityin Italy. These charges will be recorded as associates acceptnegotiated benefits.
The Company anticipates continued fluctuations in the valueof the U.S. dollar relative to the Euro and other WesternEuropean currencies. Revenues and EBIT in the European UnionTire segment may be adversely affected in future periods by theeffects of currency translations, continued competitive pricingconditions, changes in mix and rising raw material and energyprices.
Eastern Europe, Africa and Middle East TireEastern Europe, Africa and Middle East Tire (“Eastern EuropeTire”) segment sales in 2000 were $793.0 million, decreasing2.4% from $812.9 million in 1999 and 8.6% from $867.4 millionin 1998.
Unit sales in 2000 were 15.6 million, decreasing 1.5% from1999 but increasing .7% from 1998. Replacement unit sales in2000 decreased 3.7% from 1999 and 1.3% from 1998. Originalequipment volume in 2000 increased 7.4% from 1999 and 8.3%from 1998.
Revenues in 2000 decreased from 1999 due to a downturn inthe replacement market and the effects of currency translation,but benefited from generally improved pricing in the region anda general improvement in the economic conditions in EasternEurope and South Africa. The Company estimates that the effectsof currency translation adversely affected Eastern Europe Tiresegment sales by approximately $75 million in 2000.
MANAGEMENT’S DISCUSSION AND ANALYSISOF FINANCIAL CONDITION AND RESULTS OF OPERATIONS (CONT INUED)

GOODYEAR | 25
Revenues in 1999 decreased from 1998 despite higher tireunit sales, due primarily to the effects of currency translation,competitive pricing conditions and adverse economic conditionsin Eastern Europe, South Africa and Turkey. Revenues were favor-ably impacted in 1999 by the acquisition of a majority interestin tire manufacturing operations in Slovenia in the third quarterof 1998.
Eastern Europe Tire EBIT was $54.6 million in 2000, increas-ing 9.6% from $49.8 million in 1999 but decreasing 46.7% from$102.4 million in 1998. Operating margin in 2000 was 6.9%,compared to 6.1% in 1999 and 11.8% in 1998.
EBIT in 2000 increased from 1999 due primarily to increasedfactory utilization levels and improved market conditions. EBIT in2000 was adversely impacted by an industry-wide strike inTurkey.
EBIT in 1999 decreased from 1998 due primarily to lower rev-enues, increased production unit costs associated with programsto realign capacity and reduce inventories, the impact of a majorearthquake on the Turkish economy and adverse economic condi-tions in Eastern Europe and South Africa.
EBIT in 2000 did not include net rationalization charges total-ing $9.6 million. EBIT in 1999 did not include net rationalizationcharges totaling $.3 million. EBIT in 1998 did not include gainson asset sales totaling $.9 million.
The Company anticipates continued fluctuations in the valueof the U.S. dollar relative to the various currencies in the mar-kets served by Eastern Europe Tire. Revenues and EBIT in theEastern Europe Tire segment may be adversely affected in futureperiods by the effects of continued competitive pricing condi-tions, changes in mix, rising raw material and energy prices andcurrency translations.
Latin American TireLatin American Tire segment sales in 2000 were $1.05 billion,increasing 10.5% from $948.1 million in 1999 but decreasing17.5% from $1.27 billion in 1998.
Unit sales in 2000 were 19.7 million, increasing 11.0% from1999 but decreasing 5.3% from 1998. Replacement unit sales in2000 increased 5.2% from 1999 but decreased 4.7% from 1998.Original equipment volume in 2000 increased 34.2% from 1999but decreased 7.2% from 1998.
Revenues in 2000 increased from 1999 due primarily to highertire unit sales, but were adversely affected by competitive pric-ing pressures.
Revenues in 1999 decreased from 1998 due primarily to sig-nificantly lower tire unit sales due primarily to the continuingeconomic downturn in the region, competitive pricing pressuresand the effects of currency translations.
Latin American Tire segment EBIT was $69.8 million in 2000,increasing 3.1% from $67.7 million in 1999 but decreasing62.5% from $186.1 million in 1998. Operating margin in 2000was 6.7%, compared to 7.1% in 1999 and 14.7% in 1998.
EBIT in 2000 increased from 1999 due to higher tire unitsales, but was adversely affected by continued pricing pressuresand higher raw material and labor costs.
EBIT in 1999 decreased from 1998 due to lower revenues,competitive pricing and increased unit costs resulting from lowerlevels of capacity utilization necessary to align production withdemand and reduce inventory.
EBIT in 2000 did not include rationalization charges totaling$65.7 million and a $5.0 million gain on the sale of land at amanufacturing facility in Mexico. EBIT in 1999 did not includerationalization charges totaling $77.3 million. EBIT in 1998 didnot include a charge for a lawsuit settlement totaling $14.1 mil-lion and gains on asset sales totaling $3.4 million.
The Company anticipates continued fluctuations in the value ofthe U.S. dollar relative to Latin American currencies. Revenues andEBIT in future periods may be adversely affected by the effects ofcontinued competitive pricing conditions, changes in mix, risingraw material and energy prices, continued volatile economic condi-tions and currency translations.
MANAGEMENT’S DISCUSSION AND ANALYSISOF FINANCIAL CONDITION AND RESULTS OF OPERATIONS (CONT INUED)

GOODYEAR | 26
Asia TireAsia Tire segment sales in 2000 were $524.6 million, decreasing11.6% from $593.2 million in 1999 but increasing 1.0% from$519.3 million in 1998.
Unit sales in 2000 were 11.8 million, decreasing 2.1% from1999 but increasing 8.9% from 1998. Replacement unit sales in2000 decreased 8.7% from 1999 and 6.8% from 1998. Originalequipment volume in 2000 increased 24.5% from 1999 and117.8% from 1998.
Revenues in 2000 decreased from 1999 due primarily to theabsence of the replacement tire business transferred to theCompany’s non-consolidated joint venture with Sumitomo inJapan, which contributed revenues of approximately $49.7 mil-lion in 1999. In addition, revenues were adversely affected bycompetitive pricing, a less favorable product mix and currencytranslations.
Revenues in 1999 increased from 1998 due primarily to highertire unit sales, the favorable impact of currency translations andimproving economic conditions in the region. Revenues in 1999were adversely affected by competitive pricing pressures and thetransfer of businesses to the non-consolidated Asia joint venturewith Sumitomo.
Asia Tire segment EBIT was $17.9 million in 2000, decreasing31.2% from $26.0 million in 1999 but increasing 138.7% from$7.5 million in 1998. Operating margin in 2000 was 3.4%, com-pared to 4.4% in 1999 and 1.4% in 1998.
EBIT in 2000 decreased from 1999 due primarily to lower tireunit sales, competitive pricing conditions driven in part byincreased low cost imports into the region and a shift in mix tolower margin tires, higher raw material and energy costs andprice competition.
EBIT in 1999 increased from 1998 due primarily to higher rev-enues and lower raw material costs, but was adversely impactedby a charge of $5.2 million to write off obsolete equipment inIndia.
EBIT in 2000 did not include rationalization charges totaling$3.3 million. EBIT in 1999 did not include rationalizationcharges totaling $1.5 million. EBIT in 1998 did not include gainson asset sales totaling $10.1 million.
The Company anticipates continued fluctuations in the valueof the U.S. dollar relative to Asian currencies. Revenues and EBITin future periods may be adversely affected by the effects of cur-rency translations, continued competitive pricing conditions,changes in mix and rising raw material prices.
Sales and EBIT of the Asia Tire segment do not include SouthPacific Tyres Ltd. (SPT), a tire manufacturer in Australia and NewZealand, which is 50% owned by the Company. Results of opera-tions of SPT are not reported in segment results and are reflectedin the Company’s Consolidated Statement of Income using theequity method.
The following table presents the sales and operating incomeof the Company’s Asia Tire segment together with 100% of thesales and EBIT of SPT:
(In millions) 2000 1999 1998
Net Sales:Asia Tire Segment $ 524.6 $ 593.2 $ 519.3SPT 563.6 674.5 654.0
$1,088.2 $1,267.7 $1,173.3
EBIT:Asia Tire Segment $ 17.9 $ 26.0 $ 7.5SPT (11.1) 31.2 47.2
$ 6.8 $ 57.2 $ 54.7
SPT sales in 2000 were $563.6 million, decreasing 16.4% from$674.5 million in 1999 and 13.8% from $654.0 million in 1998.Revenues in 2000 decreased from 1999 due to competitive pres-sures from low cost imported tires and the effects of currencytranslation. Revenues in 1999 increased from 1998 due primarilyto the effects of currency translations and increased export sales.
SPT EBIT was a loss of $11.1 million in 2000, compared toincome of $31.2 million in 1999 and $47.2 million in 1998. EBITin 2000 decreased from 1999 due to production inefficienciesand higher raw material costs. EBIT in 1999 decreased from 1998due primarily to increased competition in the Australian replace-ment market, particularly passenger, and lower OE and exportmargins.
SPT EBIT in 2000 did not include rationalization chargestotaling $32.2 million.
MANAGEMENT’S DISCUSSION AND ANALYSISOF FINANCIAL CONDITION AND RESULTS OF OPERATIONS (CONT INUED)
GOODYEAR | 27
Engineered ProductsEngineered Products segment sales in 2000 were $1.17 billion,decreasing 4.9% from $1.23 billion in 1999 and 9.8% from $1.30billion in 1998.
Revenues in 2000 decreased from 1999 due primarily to theCompany’s exit from the interior trim business in 1999, whichcontributed revenues of approximately $71.0 million in that year.In addition, revenues were adversely affected by reduced demandfor conveyor belting for the mining and agriculture industriesand reduced demand for hose and power transmission products inthe North American replacement market.
Revenues in 1999 decreased from 1998 due primarily to lowerunit sales resulting from the exit from the interior trim businessand reduced demand for conveyor belting from the mining andagriculture industries, unfavorable currency translation andadverse economic conditions in Latin America and South Africa.
Engineered Products segment EBIT in 2000 was $43.1 million,decreasing 38.8% from $70.4 million in 1999 and 61.4% from$111.7 million in 1998. Operating margin in 2000 was 3.7%,compared to 5.7% in 1999 and 8.6% in 1998.
EBIT in 2000 decreased from 1999 due primarily to reduceddemand, reduced capacity utilization, higher raw material costsand competitive pricing. EBIT in 1999 decreased from 1998 dueprimarily to lower revenues, increased costs resulting from prod-uct adjustments and idle plant costs required to align productionwith demand and reduce inventories.
EBIT in 2000 did not include net rationalization charges of$3.8 million. EBIT in 1999 did not include net rationalizationcharges totaling $8.8 million. EBIT in 1998 did not include acharge for a lawsuit settlement totaling $1.8 million and a gainon an asset sale totaling $.6 million.
The Company anticipates continued fluctuations in the valueof the U.S. dollar relative to currencies in the markets served bythe Engineered Products segment. Revenues and EBIT in theEngineered Products segment may be adversely affected in futureperiods by competitive pricing pressures, currency translations,expected continuing unfavorable economic conditions in certainmarkets, adverse economic conditions globally in the mining,construction and agriculture industries and increasing rawmaterial and energy prices.
Chemical ProductsChemical Products segment sales in 2000 were $1.13 billion,increasing 18.9% from $949.8 million in 1999 and 13.8% from$993.0 million in 1998. Approximately 50% of Chemical Productssales are to the Company’s other segments.
Revenues in 2000 increased from 1999 due primarily to priceincreases and higher sales volume. Revenues in 1999 decreasedfrom 1998 due primarily to competitive pricing pressures.
Chemical Products segment EBIT in 2000 was $64.2 million,decreasing 44.8% from $116.4 million in 1999 and 51.6% from$132.7 million in 1998. Operating margin in 2000 was 5.7%,compared to 12.3% in 1999 and 13.4% in 1998.
EBIT in 2000 decreased from 1999 due primarily to increasedraw material and energy prices and the inability to recover costincreases due to the competitive pricing environment. EBIT in1999 decreased from 1998 due primarily to competitive pricingpressures.
EBIT in 1999 did not include a net rationalization charge of$2.5 million and third quarter proceeds of $17 million from thesale of customer lists and formulations in connection with theCompany’s exit from the production of certain rubber chemicals.EBIT in 1998 did not include gains on asset sales totaling $61.5million.
Revenues and EBIT in the Chemical Products segment may beadversely affected in future periods by competitive pricing pres-sures and increasing raw material and energy prices.
MANAGEMENT’S DISCUSSION AND ANALYSISOF FINANCIAL CONDITION AND RESULTS OF OPERATIONS (CONT INUED)

GOODYEAR | 28
LIQUIDITY AND CAPITAL RESOURCES
OPERATING ACTIVITIESNet cash provided by operating activities was $509.8 million dur-ing 2000, as reported on the Consolidated Statement of CashFlows. Inventories increased, although working capital require-ments decreased for receivables and payables.
INVESTING ACTIVITIESNet cash used in investing activities was $468.4 million during2000. Capital expenditures in 2000 were $614.5 million, of which$330.4 million was used on projects to increase capacity andimprove productivity and $284.1 million was used for tire moldsand various other projects. Capital expenditures are expected toapproximate $550 million to $600 million in 2001. At December31, 2000, the Company had binding commitments for land,buildings and equipment of $177.1 million. Depreciation andamortization are expected to be in the range of $600 million to$700 million in 2001.
(In millions) 2000 1999 1998
Capital expenditures $614.5 $805.0 $838.4Depreciation 593.6 557.6 487.8Amortization 36.7 24.1 18.1
Investing activities in 2000 included the sale of leasehold inter-ests in, and the sale and leaseback of, various distributionfacilities in the United States. The Company also acquired amajority ownership interest in a retreading production and distri-bution operation in the United States.
Investing activities in 1999 included a cash payment of$931.6 million for the acquisition of majority interests in theDunlop Tire businesses in Europe and North America. The assetacquisition amount of $892.0 million reflected on the Company’sConsolidated Statement of Cash Flows is net of cash received.Other investing activities in 1999 included the net proceeds of$27 million from the sale of assets to the Japanese joint ven-tures formed under the strategic alliance, which are 25% ownedby the Company, and the $17 million of proceeds from the saleof customer lists and formulations in connection with theCompany’s exit from the production of certain rubber chemicals.
Investing activities in 1998 included acquisitions of majorityownership interests in tire manufacturers in Slovenia, India andJapan. In addition, the Company raised its ownership to 100% ofthe Company’s tire and engineered products subsidiary in SouthAfrica and the Brad Ragan subsidiary in the United States.Investing activities in 1998 also included the divestitures of theCompany’s oil transportation business, a latex processing facilityin Georgia, six distribution facilities in North America and othermiscellaneous real estate.
For further information on investing activities, refer to thenotes to the financial statements No. 2, Strategic Alliance andNo. 8, Investments.
FINANCING ACTIVITIESNet cash used in financing activities was $3.6 million during2000.
(Dollars in millions) 2000 1999 1998
Consolidated Debt $3,585.8 $3,424.5 $1,975.8Debt to Debt and Equity 50.6% 47.4% 33.5%
During 2000, the Company issued $300 million of its 8.125%Notes due 2003 and $300 million of its 8.50% Notes due 2007.The Company also issued e400 million ($384.4 million at June6, 2000) of its 6.375% Notes due 2005. The proceeds from theissuance of these Notes were used to repay outstanding commer-cial paper and short term bank borrowings.
In connection with the Company’s planned strategic alliancewith Sumitomo Rubber Industries, Ltd., on February 25, 1999 theCompany issued to Sumitomo at par a 1.2% Convertible Note DueAugust 16, 2000 in the principal amount of ¥13,073,070,934(equivalent to $108.0 million at February 25, 1999). TheCompany’s Note was convertible during the period beginning July16, 2000 through August 15, 2000 into 2,281,115 shares of theCommon Stock, without par value, of the Company at a conver-sion price of ¥5,731 per share, subject to certain adjustments.Consolidated Debt and Debt to Debt and Equity as stated abovedo not reflect the issuance of the Company’s 1.2% ConvertibleNote.
MANAGEMENT’S DISCUSSION AND ANALYSISOF FINANCIAL CONDITION AND RESULTS OF OPERATIONS (CONT INUED)

GOODYEAR | 29
In addition, on February 25, 1999 the Company purchased atpar from Sumitomo a 1.2% Convertible Note Due August 16,2000 in the principal amount of ¥13,073,070,934 (also equiva-lent to $108.0 million at February 25, 1999). The Sumitomo Notewas convertible during the period beginning July 16, 2000through August 15, 2000 into 24,254,306 shares of the CommonStock, ¥50 par value per share, of Sumitomo at a conversionprice of ¥539 per share, subject to certain adjustments. On July27, 2000 the Company converted the Sumitomo Note into24,254,306 shares of Sumitomo Common Stock. As a result, theCompany owns 10% of Sumitomo’s outstanding shares. The fairvalue of the Sumitomo Common Stock at December 31, 2000 was$100.9 million. For further information, refer to the note to thefinancial statements No. 8, Investments.
On June 14, 1999, the Company and Sumitomo agreed thatthey would not redeem their respective Notes and would convertthe Notes, subject to the condition that the global alliancebetween the Company and Sumitomo was operating at July 1,2000. On July 7, 2000, the Company and Sumitomo amended thePurchase Agreement and on August 15, 2000: (1) Sumitomo con-verted ¥6,536,535,167 principal amount of the Company’s Noteinto approximately 1,138,030 shares of the Common Stock of theCompany; (2) the Company paid ¥223,933,167 of interest on theNote; and (3) Sumitomo surrendered the Note and the Companyissued a replacement note in the principal amount of¥6,536,535,767 due on August 16, 2001 and payable at theCompany’s option in cash or in shares of Common Stock at aconversion price of ¥5,731, subject to adjustment. The replace-ment note bears interest at the rate of 1.2% per annum fromAugust 15, 2000 until the fifteenth day prior to maturity (or, ifearlier, conversion) and is convertible into Common Stock of theCompany at a conversion price of ¥5,731 per share, subject toadjustment, at any time prior to maturity. On January 15, 2001,Sumitomo gave notice to the Company that it will convert thereplacement note into approximately 1,140,866 shares of theCommon Stock of the Company on February 6, 2001.
Credit SourcesSubstantial short term and long term credit sources are availableto the Company globally under normal commercial practices. AtDecember 31, 2000, the Company had an aggregate of $297.7million of commercial paper outstanding. In addition, atDecember 31, 2000, the Company had short term committed anduncommitted bank credit arrangements totaling $2.2 billion, ofwhich $.93 billion were unused. The Company also had availablelong term credit arrangements at December 31, 2000 totaling$3.5 billion, of which $1.5 billion were unused.
The Company is a party to two revolving credit facility agree-ments, consisting of a $750 million five-year revolving creditfacility and a $750 million 364-day revolving credit facility.
The $750 million five-year facility agreement is with 27domestic and international banks and provides that the Companymay borrow at any time until August 15, 2005, when the com-mitment terminates and any outstanding loans mature. TheCompany pays a commitment fee ranging from 12.5 to 25 basispoints on the entire amount of the commitment (whether or notborrowed) and a usage fee on amounts borrowed (other than ona competitive bid or prime rate basis) ranging from 37.5 to 100basis points. These fees may fluctuate quarterly within theseranges based upon the Company’s leverage. During 2000, com-mitment fees ranged from 7.5 to 15 basis points and usage feesranged from 22.5 to 45 basis points. Commitment and usage feespaid during 2000 averaged 12.5 basis points.
The $750 million 364-day credit facility agreement is with 27 domestic and international banks and provides that theCompany may borrow until August 15, 2001, on which date thefacility commitment terminates, except as it may be extended ona bank by bank basis. If a bank does not extend its commitmentif requested to do so, the Company may obtain from such bank atwo year term loan up to the amount of such bank’s commitment.The Company pays a commitment fee ranging from 10 to 20points on the entire amount of the commitment (whether or notborrowed) and a usage fee on amounts borrowed (other than ona competitive bid or prime rate basis) ranging from 40 to 105basis points. These fees may fluctuate quarterly within theseranges based upon the Company’s leverage. Under both agree-ments, a utilization fee of 25 basis points per annum is chargedeach day on which the sum of the outstanding loans exceeds50% of the total facility.
MANAGEMENT’S DISCUSSION AND ANALYSISOF FINANCIAL CONDITION AND RESULTS OF OPERATIONS (CONT INUED)
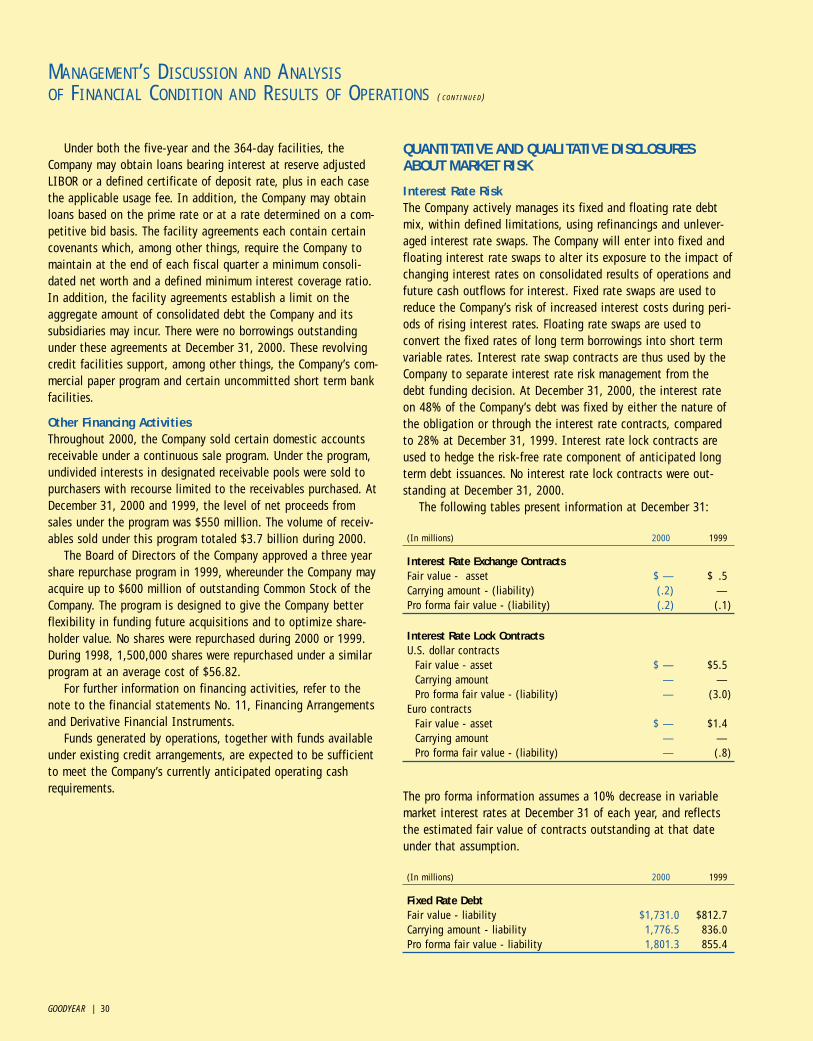
GOODYEAR | 30
Under both the five-year and the 364-day facilities, theCompany may obtain loans bearing interest at reserve adjustedLIBOR or a defined certificate of deposit rate, plus in each casethe applicable usage fee. In addition, the Company may obtainloans based on the prime rate or at a rate determined on a com-petitive bid basis. The facility agreements each contain certaincovenants which, among other things, require the Company tomaintain at the end of each fiscal quarter a minimum consoli-dated net worth and a defined minimum interest coverage ratio.In addition, the facility agreements establish a limit on theaggregate amount of consolidated debt the Company and itssubsidiaries may incur. There were no borrowings outstandingunder these agreements at December 31, 2000. These revolvingcredit facilities support, among other things, the Company’s com-mercial paper program and certain uncommitted short term bankfacilities.
Other Financing ActivitiesThroughout 2000, the Company sold certain domestic accountsreceivable under a continuous sale program. Under the program,undivided interests in designated receivable pools were sold topurchasers with recourse limited to the receivables purchased. AtDecember 31, 2000 and 1999, the level of net proceeds fromsales under the program was $550 million. The volume of receiv-ables sold under this program totaled $3.7 billion during 2000.
The Board of Directors of the Company approved a three yearshare repurchase program in 1999, whereunder the Company mayacquire up to $600 million of outstanding Common Stock of theCompany. The program is designed to give the Company betterflexibility in funding future acquisitions and to optimize share-holder value. No shares were repurchased during 2000 or 1999.During 1998, 1,500,000 shares were repurchased under a similarprogram at an average cost of $56.82.
For further information on financing activities, refer to thenote to the financial statements No. 11, Financing Arrangementsand Derivative Financial Instruments.
Funds generated by operations, together with funds availableunder existing credit arrangements, are expected to be sufficientto meet the Company’s currently anticipated operating cashrequirements.
QUANTITATIVE AND QUALITATIVE DISCLOSURESABOUT MARKET RISK
Interest Rate RiskThe Company actively manages its fixed and floating rate debtmix, within defined limitations, using refinancings and unlever-aged interest rate swaps. The Company will enter into fixed andfloating interest rate swaps to alter its exposure to the impact ofchanging interest rates on consolidated results of operations andfuture cash outflows for interest. Fixed rate swaps are used toreduce the Company’s risk of increased interest costs during peri-ods of rising interest rates. Floating rate swaps are used toconvert the fixed rates of long term borrowings into short termvariable rates. Interest rate swap contracts are thus used by theCompany to separate interest rate risk management from thedebt funding decision. At December 31, 2000, the interest rateon 48% of the Company’s debt was fixed by either the nature ofthe obligation or through the interest rate contracts, comparedto 28% at December 31, 1999. Interest rate lock contracts areused to hedge the risk-free rate component of anticipated longterm debt issuances. No interest rate lock contracts were out-standing at December 31, 2000.
The following tables present information at December 31:
(In millions) 2000 1999
Interest Rate Exchange ContractsFair value - asset $ — $ .5Carrying amount - (liability) (.2) —Pro forma fair value - (liability) (.2) (.1)
Interest Rate Lock ContractsU.S. dollar contracts
Fair value - asset $ — $5.5Carrying amount — —Pro forma fair value - (liability) — (3.0)
Euro contractsFair value - asset $ — $1.4Carrying amount — —Pro forma fair value - (liability) — (.8)
The pro forma information assumes a 10% decrease in variablemarket interest rates at December 31 of each year, and reflectsthe estimated fair value of contracts outstanding at that dateunder that assumption.
(In millions) 2000 1999
Fixed Rate DebtFair value - liability $1,731.0 $812.7Carrying amount - liability 1,776.5 836.0Pro forma fair value - liability 1,801.3 855.4
MANAGEMENT’S DISCUSSION AND ANALYSISOF FINANCIAL CONDITION AND RESULTS OF OPERATIONS (CONT INUED)

GOODYEAR | 31
The pro forma information assumes a 100 basis point decrease inmarket interest rates at December 31 of each year, and reflectsthe estimated fair value of fixed rate debt outstanding at thatdate under that assumption.
The sensitivity to changes in interest rates of the Company’sinterest rate contracts and fixed rate debt was determined with avaluation model based upon net modified duration analysis. Themodel assumes a parallel shift in the yield curve, and the preci-sion of the model decreases as the assumed change in interestrates increases.
Foreign Currency Exchange RiskIn order to reduce the impact of changes in foreign exchangerates on consolidated results of operations and future foreigncurrency denominated cash flows, the Company was a party tovarious foreign currency forward exchange contracts at December31, 2000 and 1999. These contracts reduce exposure to currencymovements affecting existing foreign currency denominatedassets, liabilities and firm commitments resulting primarily fromtrade receivables and payables, equipment acquisitions, inter-company loans and the Company’s foreign currency-denominatedborrowings in the U.S. The contract maturities match the maturi-ties of the currency positions. Changes in the fair value offorward exchange contracts are substantially offset by changes inthe fair value of the hedged positions.
The following table presents information at December 31:
(In millions) 2000 1999
Fair value - favorable $24.0 $58.7Carrying amount - asset 23.0 58.0Pro forma change in fair value 33.3 13.1
The pro forma information assumes a 10% change in foreignexchange rates at December 31 of each year, and reflects theestimated change in the fair value of contracts outstanding atthat date under that assumption.
The sensitivity to changes in exchange rates of the Company’sforeign currency positions was determined using current marketpricing models.
For further information on interest rate contracts and foreigncurrency exchange contracts, refer to the note to the financialstatements No. 11, Financing Arrangements and DerivativeFinancial Instruments.
FORWARD-LOOKING INFORMATION - SAFE HARBOR STATEMENTCertain information set forth herein (other than historical dataand information) may constitute forward-looking statementsregarding events and trends that may affect the Company’sfuture operating results and financial position. The words “esti-mate,” “expect,” “intend” and “project,” as well as other wordsor expressions of similar meaning, are intended to identify for-ward-looking statements. Readers are cautioned not to placeundue reliance on forward-looking statements, which speak onlyas of the date of this annual report. Such statements are basedon current expectations, are inherently uncertain, are subject torisks and should be viewed with caution. Actual results and expe-rience may differ materially from the forward-looking statementsas a result of many factors, including: changes in general eco-nomic and monetary conditions in the various markets served bythe Company’s operations; price and product competition;increased competitive activity; demand for Goodyear’s products;fluctuations in the prices paid for raw materials and energy; theability to control costs and expenses; changes in the monetarypolicies of various countries where the Company has significantoperations; changes in interest rates; and other unanticipatedevents and conditions. It is not possible to foresee or identify allsuch factors. Goodyear disclaims any intention, commitment orobligation to revise or update any forward-looking statement, orto disclose any facts, events or circumstances that occur afterthe date hereof that may affect the accuracy of any forward-looking statement.
MANAGEMENT’S DISCUSSION AND ANALYSISOF FINANCIAL CONDITION AND RESULTS OF OPERATIONS (CONT INUED)
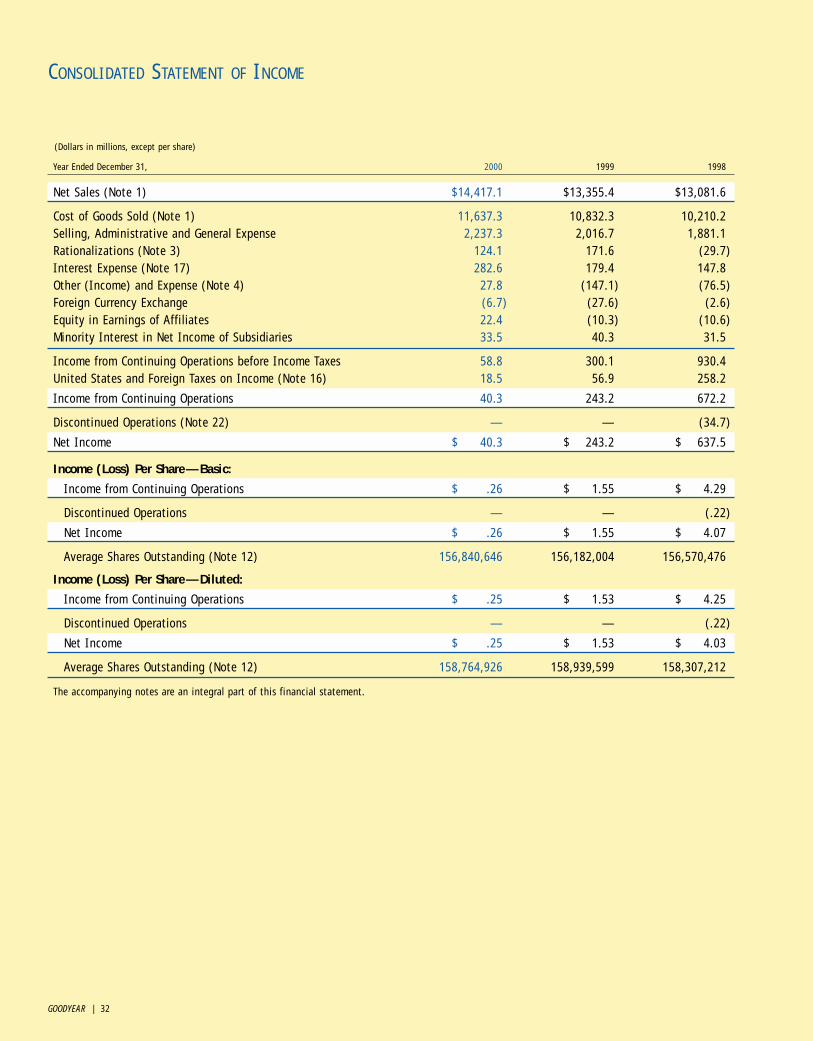
GOODYEAR | 32
CONSOLIDATED STATEMENT OF INCOME
(Dollars in millions, except per share)
Year Ended December 31, 2000 1999 1998
Net Sales (Note 1) $14,417.1 $13,355.4 $13,081.6
Cost of Goods Sold (Note 1) 11,637.3 10,832.3 10,210.2Selling, Administrative and General Expense 2,237.3 2,016.7 1,881.1Rationalizations (Note 3) 124.1 171.6 (29.7)Interest Expense (Note 17) 282.6 179.4 147.8Other (Income) and Expense (Note 4) 27.8 (147.1) (76.5)Foreign Currency Exchange (6.7) (27.6) (2.6)Equity in Earnings of Affiliates 22.4 (10.3) (10.6)Minority Interest in Net Income of Subsidiaries 33.5 40.3 31.5
Income from Continuing Operations before Income Taxes 58.8 300.1 930.4United States and Foreign Taxes on Income (Note 16) 18.5 56.9 258.2
Income from Continuing Operations 40.3 243.2 672.2
Discontinued Operations (Note 22) — — (34.7)
Net Income $ 40.3 $ 243.2 $ 637.5
Income (Loss) Per Share—Basic:
Income from Continuing Operations $ .26 $ 1.55 $ 4.29
Discontinued Operations — — (.22)
Net Income $ .26 $ 1.55 $ 4.07
Average Shares Outstanding (Note 12) 156,840,646 156,182,004 156,570,476
Income (Loss) Per Share—Diluted:
Income from Continuing Operations $ .25 $ 1.53 $ 4.25
Discontinued Operations — — (.22)
Net Income $ .25 $ 1.53 $ 4.03
Average Shares Outstanding (Note 12) 158,764,926 158,939,599 158,307,212
The accompanying notes are an integral part of this financial statement.

GOODYEAR | 33
(Dollars in millions)
December 31, 2000 1999
AssetsCurrent Assets:
Cash and cash equivalents $ 252.9 $ 241.3Accounts and notes receivable (Note 5) 2,074.7 2,296.3 Inventories (Note 7) 2,879.7 2,570.0Sumitomo 1.2% Convertible Note Receivable Due 8/00 (Note 8) — 107.2Prepaid expenses and other current assets 259.9 165.1
Total Current Assets 5,467.2 5,379.9
Long Term Accounts and Notes Receivable 92.8 97.7Investments in Affiliates, at equity 102.0 115.4Other Assets (Note 8) 183.8 79.0Goodwill (Note 6) 588.4 516.9Deferred Charges 1,612.8 1,328.2Properties and Plants (Note 9) 5,521.0 5,761.0
Total Assets $13,568.0 $13,278.1
LiabilitiesCurrent Liabilities:
Accounts payable-trade $ 1,505.2 $ 1,417.5Compensation and benefits (Notes 14, 15) 823.6 794.5Other current liabilities 395.6 294.5United States and foreign taxes 208.4 249.0Notes payable to banks (Note 11) 1,077.0 862.3Sumitomo 1.2% Convertible Note Payable Due 8/01 (Note 8) 56.9 127.8Long term debt due within one year 159.2 214.3
Total Current Liabilities 4,225.9 3,959.9
Long Term Debt (Note 11) 2,349.6 2,347.9Compensation and Benefits (Notes 14, 15) 2,310.5 2,137.4Other Long Term Liabilities 334.1 149.1Minority Equity in Subsidiaries 844.9 891.2
Total Liabilities 10,065.0 9,485.5
Shareholders’ EquityPreferred Stock, no par value: Authorized, 50,000,000 shares, unissued — —Common Stock, no par value: Authorized, 300,000,000 shares
Outstanding shares, 157,603,962 (156,335,120 in 1999) 157.6 156.3Capital Surplus 1,092.4 1,029.6Retained Earnings 3,558.8 3,706.9Accumulated Other Comprehensive Income (Note 21) (1,305.8) (1,100.2)
Total Shareholders’ Equity 3,503.0 3,792.6
Total Liabilities and Shareholders’ Equity $13,568.0 $13,278.1
The accompanying notes are an integral part of this financial statement.
CONSOLIDATED BALANCE SHEET

GOODYEAR | 34
AccumulatedOther Total
Common Stock Capital Retained Comprehensive Shareholders’(Dollars in millions, except per share) Shares Amount Surplus Earnings Income Equity
Balance at December 31, 1997 as reported 156,588,783 $156.6 $1,061.6 $2,983.4 $ (806.1) $3,395.5(after deducting 39,089,885 treasury shares)
Cumulative effect on prior years of changein inventory costing method (Note 7) 218.2 218.2
Comprehensive income:Net income 637.5Foreign currency translation (99.6)Minimum pension liability (net of tax of $.2) 1.9
Total comprehensive income 539.8Cash dividends—$1.20 per share (187.9) (187.9)Common stock acquired (1,500,000) (1.5) (83.7) (85.2)Common stock issued from treasury:
Stock compensation plans 854,752 .8 38.0 38.8
Balance at December 31, 1998 155,943,535 155.9 1,015.9 3,651.2 (903.8) 3,919.2(after deducting 39,735,133 treasury shares)
Comprehensive income:Net income 243.2Foreign currency translation (212.2)Less reclassification adjustment for
recognition of FCTA in net income due to the sale of subsidiaries 17.6
Minimum pension liability (net of tax of $6.3) 11.0Unrealized investment loss (net of tax of $7.8) (12.8)
Total comprehensive income 46.8Cash dividends—$1.20 per share (187.5) (187.5)Common stock issued from treasury:
Stock compensation plans 391,585 .4 13.7 14.1
Balance at December 31, 1999 156,335,120 156.3 1,029.6 3,706.9 (1,100.2) 3,792.6(after deducting 39,343,548 treasury shares)
Comprehensive income:Net income 40.3Foreign currency translation (201.7)Minimum pension liability (net of tax of $4.1) (6.7)Unrealized investment gain (net of tax of $1.7) 2.8
Total comprehensive income (165.3)Cash dividends—$1.20 per share (188.4) (188.4)Common stock issued from treasury:
Conversion of 1.2% Convertible Note Payable 1,138,030 1.1 58.8 59.9Stock compensation plans 130,812 .2 4.0 4.2
Balance at December 31, 2000 157,603,962 $157.6 $1,092.4 $3,558.8 $(1,305.8) $3,503.0(after deducting 38,074,706 treasury shares)
The accompanying notes are an integral part of this financial statement.
CONSOLIDATED STATEMENT OF SHAREHOLDERS’ EQUITY

GOODYEAR | 35
(Dollars in millions)
Year Ended December 31, 2000 1999 1998
Cash Flows from Operating Activities:
Net Income $ 40.3 $ 243.2 $ 637.5
Adjustments to reconcile net income to cash flows from operating activities:
Depreciation and amortization 630.3 581.7 505.9Deferred tax provision (138.9) (141.0) 117.4Discontinued operations (Note 22) — — 49.5Rationalizations (Note 3) 100.1 132.5 (19.6)Asset sales (Note 4) (3.2) (154.8) (75.8)
Changes in operating assets and liabilities, netof acquisitions and dispositions:
Accounts and notes receivable 136.0 13.4 35.6Inventories (382.6) 273.4 (243.1)Accounts payable—trade 139.9 (83.4) (74.6)Domestic pension funding (5.3) (47.3) (83.5)Other assets and liabilities (6.8) (183.0) (410.2)
Total adjustments 469.5 391.5 (198.4)
Total cash flows from operating activities 509.8 634.7 439.1
Cash Flows from Investing Activities:Capital expenditures (614.5) (805.0) (838.4)Short term securities acquired (24.4) (54.2) (18.3)Short term securities redeemed 26.1 59.5 18.6Asset dispositions 172.6 49.5 493.3Asset acquisitions (Notes 2, 8) — (892.0) (217.9)Other transactions (28.2) (159.8) (138.8)
Total cash flows from investing activities (468.4) (1,802.0) (701.5)
Cash Flows from Financing Activities:Short term debt incurred 1,199.2 2,111.8 447.4Short term debt paid (1,908.2) (727.1) (98.8)Long term debt incurred 1,145.9 20.5 325.4Long term debt paid (229.2) (48.7) (193.4)Common stock issued (Notes 8, 12) 4.2 14.1 38.8Common stock acquired — — (85.2)Joint venture dividends paid to Sumitomo (27.1) — —Dividends paid to Goodyear shareholders (188.4) (187.5) (187.9)
Total cash flows from financing activities (3.6) 1,183.1 246.3
Effect of Exchange Rate Changes on Cash and Cash Equivalents (26.2) (13.5) (3.5)
Net Change in Cash and Cash Equivalents 11.6 2.3 (19.6)Cash and Cash Equivalents at Beginning of the Period 241.3 239.0 258.6
Cash and Cash Equivalents at End of the Period $ 252.9 $ 241.3 $ 239.0
The accompanying notes are an integral part of this financial statement.
CONSOLIDATED STATEMENT OF CASH FLOWS

GOODYEAR | 36
NOTE 1
ACCOUNTING POLICIESA summary of the significant accounting policies used in thepreparation of the accompanying financial statements follows:
Principles of ConsolidationThe consolidated financial statements include the accounts of allmajority-owned subsidiaries in which no substantive participatingrights are held by minority shareholders. All significant inter-company transactions have been eliminated.
The Company’s investments in majority-owned subsidiaries in which substantive participating rights are held by minorityshareholders and in 20% to 50% owned companies in which ithas the ability to exercise significant influence over operatingand financial policies are accounted for using the equity method.Accordingly, the Company’s share of the earnings of thesecompanies is included in consolidated net income. Investmentsin other companies are carried at cost.
Revenue RecognitionRevenues are recognized when finished products are shipped tounaffiliated customers and both title and the risks and rewardsof ownership are transferred, or services have been rendered andaccepted. Appropriate provision is made for uncollectibleaccounts.
Consolidated Statement of Cash FlowsCash and cash equivalents include cash on hand and in the bankas well as all short term securities held for the primary purposeof general liquidity. Such securities normally mature within threemonths from the date of acquisition. Cash flows associated withitems intended as hedges of identifiable transactions or eventsare classified in the same category as the cash flows from theitems being hedged.
Inventory PricingDuring the fourth quarter of 2000, the Company changed itsmethod of inventory costing from last-in first-out (LIFO) to first-in first-out (FIFO) for domestic inventories. Prior periods havebeen restated to reflect this change. Worldwide inventories arestated at the lower of cost or market. Cost is determined usingFIFO or the average cost method. Refer to Note 7.
Income TaxesIncome taxes are recognized during the year in which trans-actions enter into the determination of financial statementincome, with deferred taxes being provided for temporary differ-ences between amounts of assets and liabilities for financialreporting purposes and such amounts as measured by tax laws.Refer to Note 16.
InvestmentsInvestments in marketable equity securities are stated at fairvalue. Fair value is determined using quoted market prices at the end of the reporting period and, when appropriate, exchangerates at that date. Unrealized gains and losses on marketableequity securities classified as available-for-sale are recorded in Accumulated Other Comprehensive Income, net of tax. Referto Notes 8, 21.
GoodwillGoodwill is recorded when the cost of acquired businesses exceedsthe fair value of the identifiable net assets acquired. Goodwill isamortized over its estimated useful life, based on an evaluationof all relevant factors. Substantially all goodwill resulting fromthe strategic alliance with Sumitomo and other acquisitions inNorth America and the European Union is amortized on a straight-line basis over 40 years. Goodwill resulting from acquisitions in emerging markets is amortized on a straight-line basis overperiods ranging from 20–40 years. The carrying amount andestimated useful life of goodwill are reviewed whenever events or changes in circumstances indicate that revisions may bewarranted. Refer to Note 6.
Properties and PlantsProperties and plants are stated at cost. Depreciation is computedusing the straight-line method. Accelerated depreciation is usedfor income tax purposes, where permitted. Refer to Note 9.
Stock-Based CompensationCompensation cost for stock options is measured as the excess, ifany, of the quoted market price of the Company’s common stockat the date of the grant over the amount an employee must payto acquire the stock. Compensation cost for stock appreciationrights and performance units is recorded based on the quotedmarket price of the Company’s stock at the end of the reportingperiod. Refer to Note 12.
Advertising CostsCosts incurred for producing and communicating advertising aregenerally expensed when incurred. Costs incurred under theCompany’s domestic cooperative advertising program with dealersand franchisees are recorded subsequent to the first time theadvertising takes place, as related revenues are recognized. Refer to Note 19.
Foreign Currency TranslationFinancial statements of international subsidiaries are translatedinto U.S. dollars using the exchange rate at each balance sheetdate for assets and liabilities and a weighted-average exchangerate for each period for revenues, expenses, gains and losses.Where the local currency is the functional currency, translationadjustments are recorded as Accumulated Other ComprehensiveIncome. Where the U.S. dollar is the functional currency,translation adjustments are recorded in income.
NOTES TO FINANCIAL STATEMENTS

GOODYEAR | 37
Derivative Financial InstrumentsDerivative financial instrument contracts are utilized by theCompany to manage interest rate and foreign exchange risks. The Company has established a control environment thatincludes policies and procedures for risk assessment and theapproval, reporting and monitoring of derivative financialinstrument activities. Company policy prohibits holding orissuing derivative financial instruments for trading purposes.
The Company adopted Statement of Financial AccountingStandards No. 133, as amended and interpreted, on January 1,2001. Results of operations and financial position in this Annual Report do not reflect the adoption of this standard.
To qualify for hedge accounting, the contracts must meetdefined correlation and effectiveness criteria, be designated ashedges and result in cash flows and financial statement effectswhich substantially offset those of the position being hedged.Amounts receivable or payable under derivative financialinstrument contracts, when recognized are reported on theConsolidated Balance Sheet as both current and long termreceivables or liabilities.
Interest Rate Contracts—The differentials to be received orpaid under interest rate exchange contracts are recognized inincome over the life of the contracts as adjustments to InterestExpense. The settlement amounts received or paid under interestrate lock contracts are recognized in income over the life of theassociated debt as adjustments to interest expense.
Foreign Exchange Contracts—As exchange rates change, gains and losses on contracts designated as hedges of existingassets and liabilities are recognized in income as ForeignCurrency Exchange, while gains and losses on contracts desig-nated as hedges of net investments in foreign subsidiaries arerecognized in Shareholders’ Equity as Accumulated OtherComprehensive Income. Gains and losses on contracts designatedas hedges of identifiable foreign currency firm commitments arenot recognized until included in the measurement of the relatedforeign currency transaction.
Gains and losses on terminations of hedge contracts arerecognized as Other (Income) and Expense when terminated inconjunction with the termination of the hedged position, or tothe extent that such position remains outstanding, deferred asPrepaid Expenses or Deferred Charges and amortized to InterestExpense or Foreign Currency Exchange over the remaining life ofthat position. Derivative financial instruments that the Companytemporarily continues to hold after the early termination of ahedged position, or that otherwise no longer qualify for hedgeaccounting, are marked-to-market, with gains and losses recog-nized in income as Other (Income) and Expense. Refer to Note 11.
Environmental Cleanup MattersThe Company expenses environmental expenditures related toexisting conditions resulting from past or current operations andfrom which no current or future benefit is discernible. Expendi-tures that extend the life of the related property or mitigate or prevent future environmental contamination are capitalized. The Company determines its liability on a site by site basis andrecords a liability at the time when it is probable and can bereasonably estimated. The Company’s estimated liability isreduced to reflect the anticipated participation of other poten-tially responsible parties in those instances where it is probablethat such parties are legally responsible and financially capableof paying their respective shares of the relevant costs. Theestimated liability of the Company is not discounted or reducedfor possible recoveries from insurance carriers. Refer to Note 23.
Use of EstimatesThe preparation of financial statements in conformity withgenerally accepted accounting principles requires management to make estimates and assumptions that affect the amountsreported in the consolidated financial statements and relatednotes to financial statements. Changes in such estimates mayaffect amounts reported in future periods.
Per Share of Common StockBasic earnings per share have been computed based on theaverage number of common shares outstanding. Diluted earningsper share reflects the dilutive impact of outstanding stockoptions, computed using the treasury stock method, the Company’s1.2% Convertible Note Payable Due 8/01 and performance units.All earnings per share amounts in these notes to financial state-ments are diluted, unless otherwise noted. Refer to Note 12.
ReclassificationDuring 2000, the Company began reporting expenses for trans-portation of products to customers as a component of Cost ofGoods Sold as a result of the adoption of EITF Issue No. 00-10,“Accounting for Shipping and Handling Fees and Costs”. Thesecosts had previously been reported as a reduction of Net Sales.Transportation costs totaled $526.2 million, $474.9 million and$455.3 million in 2000, 1999 and 1998, respectively. Additionally,the Company began reporting equity in earnings of affiliates sepa-rately on the Consolidated Statement of Income. Prior periodshave been reclassified to reflect these changes.
Certain other items previously reported in specific financial statement captions have been reclassified to conform to the2000 presentation.
NOTES TO FINANCIAL STATEMENTS (CONT INUED)
GOODYEAR | 38
NOTE 2
STRATEGIC ALLIANCEOn September 1, 1999, the Company commenced operationsunder a global alliance with Sumitomo Rubber Industries Ltd.(“Sumitomo”) which included, among other things, the formationof tire manufacturing and sales joint ventures. In addition to its businesses contributed to the joint ventures, the Companypaid $931.6 million to Sumitomo and its affiliates, which wasfinanced by the issuance of additional debt.
Under the global alliance agreements, the Company acquired75%, and Sumitomo owned 25%, of Goodyear Dunlop TiresEurope B.V., a Netherlands holding company. Concurrently, theholding company acquired substantially all of Sumitomo’s tirebusinesses in Europe, including eight tire manufacturing plantslocated in England, France and Germany and sales and distri-bution operations in 18 European countries, and most of theCompany’s tire businesses in Europe. Excluded from the Europeanjoint venture are the Company’s tire businesses in Poland (other than a sales company), Slovenia and Turkey (as well asMorocco and South Africa), the Company’s aircraft tire busi-nesses, and the Company’s textile, steel tire cord and tire moldmanufacturing plants, a technical center and related facilitieslocated in Luxembourg.
The Company also acquired 75%, and Sumitomo acquired 25%, of Goodyear Dunlop Tires North America Ltd., a holdingcompany that purchased Sumitomo’s tire manufacturing opera-tions in North America and certain of its related tire sales anddistribution operations. In addition, the Company acquired 100%of the balance of Sumitomo’s Dunlop Tire distribution and salesoperations in the United States and Canada. The Company alsoacquired a 25% (and Sumitomo acquired a 75%) equity interestin each of two tire companies in Japan, one for the distributionand sale of Goodyear-brand passenger and truck tires in thereplacement market in Japan and the other for the distributionand sale of Goodyear-brand and Dunlop-brand tires to originalequipment manufacturers in Japan. The Company transferredcertain assets of its subsidiary located in Japan in exchange forsuch equity interests and approximately $27 million in cash.
The Company also acquired a 51% (and Sumitomo acquired a49%) equity interest in a company that will coordinate anddisseminate commercialized tire technology among the Company,Sumitomo, the joint ventures and their respective affiliates, and an 80% (and Sumitomo acquired a 20%) equity interest in a global purchasing company. The global alliance Agreementsalso provided for the investment by the Company and Sumitomoin the common stock of the other. Refer to Note 8.
The Company accounted for the strategic alliance using thepurchase method. The cost of the acquired businesses totaledapproximately $1.24 billion, including the cash payment of $931.6 million and the fair value of 25% of the Goodyearbusinesses contributed to the European joint venture, or $307 million. In addition, the Dunlop businesses contributed bySumitomo included $130 million of debt. The Company will amor-tize substantially all of the approximately $367 million ofgoodwill recorded on a straight-line basis over 40 years. TheCompany recognized a gain of $149.7 million ($143.7 millionafter tax or $.90 per share) on the change of control of 25% ofthe businesses it contributed to the European joint venture.
The following table presents supplemental pro forma esti-mated results of operations for 1999 and 1998 as if the jointventures had commenced operations on January 1, 1998.Historical results of the acquired businesses have been adjustedto exclude non-recurring items and to reflect changes in thecarrying amounts and depreciable lives of certain fixed assets.The pro forma information also reflects amortization of goodwillrecorded by the Company and interest expense at 6% associatedwith the debt incurred to finance the Company’s cash payment of $931.6 million to Sumitomo and its affiliates.
Year Ended December 31,(In millions, except per share) 1999 1998
(Unaudited) (Unaudited)
Net Sales $14,970.1 $15,600.0
Net Income $ 243.7 $ 631.6
Net Income Per Share—Basic $ 1.56 $ 4.03
Net Income Per Share—Diluted $ 1.53 $ 3.99
NOTES TO FINANCIAL STATEMENTS (CONT INUED)
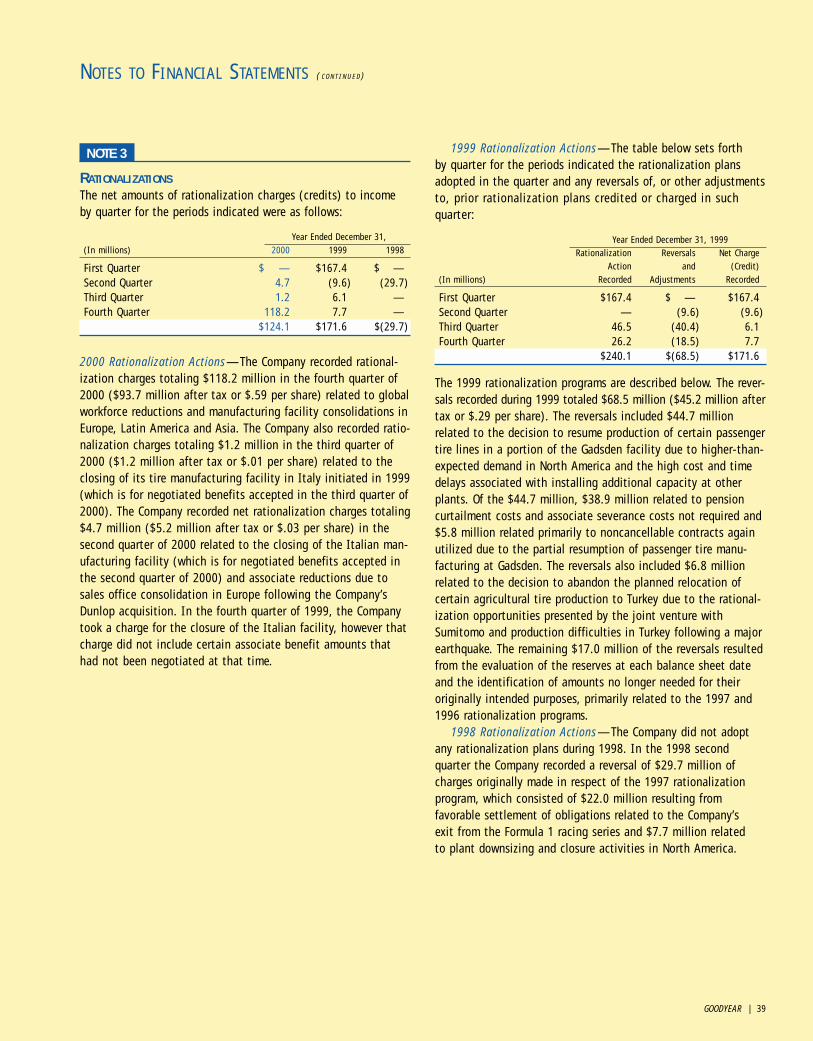
GOODYEAR | 39
NOTE 3
RATIONALIZATIONSThe net amounts of rationalization charges (credits) to incomeby quarter for the periods indicated were as follows:
Year Ended December 31,(In millions) 2000 1999 1998
First Quarter $ — $167.4 $ —Second Quarter 4.7 (9.6) (29.7)Third Quarter 1.2 6.1 —Fourth Quarter 118.2 7.7 —
$124.1 $171.6 $(29.7)
2000 Rationalization Actions—The Company recorded rational-ization charges totaling $118.2 million in the fourth quarter of2000 ($93.7 million after tax or $.59 per share) related to globalworkforce reductions and manufacturing facility consolidations inEurope, Latin America and Asia. The Company also recorded ratio-nalization charges totaling $1.2 million in the third quarter of2000 ($1.2 million after tax or $.01 per share) related to theclosing of its tire manufacturing facility in Italy initiated in 1999(which is for negotiated benefits accepted in the third quarter of2000). The Company recorded net rationalization charges totaling$4.7 million ($5.2 million after tax or $.03 per share) in thesecond quarter of 2000 related to the closing of the Italian man-ufacturing facility (which is for negotiated benefits accepted inthe second quarter of 2000) and associate reductions due tosales office consolidation in Europe following the Company’sDunlop acquisition. In the fourth quarter of 1999, the Companytook a charge for the closure of the Italian facility, however thatcharge did not include certain associate benefit amounts thathad not been negotiated at that time.
1999 Rationalization Actions—The table below sets forth by quarter for the periods indicated the rationalization plansadopted in the quarter and any reversals of, or other adjustmentsto, prior rationalization plans credited or charged in suchquarter:
Year Ended December 31, 1999Rationalization Reversals Net Charge
Action and (Credit)(In millions) Recorded Adjustments Recorded
First Quarter $167.4 $ — $167.4Second Quarter — (9.6) (9.6)Third Quarter 46.5 (40.4) 6.1Fourth Quarter 26.2 (18.5) 7.7
$240.1 $(68.5) $171.6
The 1999 rationalization programs are described below. The rever-sals recorded during 1999 totaled $68.5 million ($45.2 million aftertax or $.29 per share). The reversals included $44.7 millionrelated to the decision to resume production of certain passengertire lines in a portion of the Gadsden facility due to higher-than-expected demand in North America and the high cost and timedelays associated with installing additional capacity at otherplants. Of the $44.7 million, $38.9 million related to pensioncurtailment costs and associate severance costs not required and$5.8 million related primarily to noncancellable contracts againutilized due to the partial resumption of passenger tire manu-facturing at Gadsden. The reversals also included $6.8 millionrelated to the decision to abandon the planned relocation ofcertain agricultural tire production to Turkey due to the rational-ization opportunities presented by the joint venture withSumitomo and production difficulties in Turkey following a majorearthquake. The remaining $17.0 million of the reversals resultedfrom the evaluation of the reserves at each balance sheet dateand the identification of amounts no longer needed for theiroriginally intended purposes, primarily related to the 1997 and1996 rationalization programs.
1998 Rationalization Actions—The Company did not adoptany rationalization plans during 1998. In the 1998 secondquarter the Company recorded a reversal of $29.7 million ofcharges originally made in respect of the 1997 rationalizationprogram, which consisted of $22.0 million resulting fromfavorable settlement of obligations related to the Company’s exit from the Formula 1 racing series and $7.7 million related to plant downsizing and closure activities in North America.
NOTES TO FINANCIAL STATEMENTS (CONT INUED)
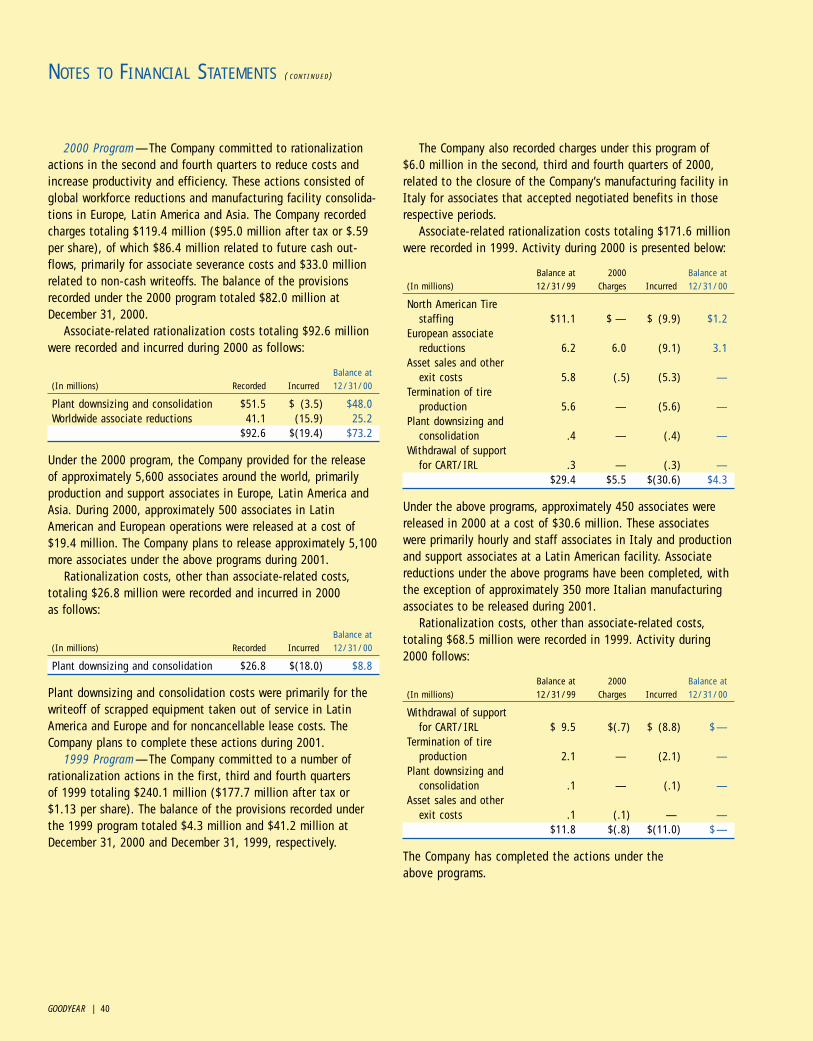
GOODYEAR | 40
2000 Program—The Company committed to rationalizationactions in the second and fourth quarters to reduce costs andincrease productivity and efficiency. These actions consisted ofglobal workforce reductions and manufacturing facility consolida-tions in Europe, Latin America and Asia. The Company recordedcharges totaling $119.4 million ($95.0 million after tax or $.59per share), of which $86.4 million related to future cash out-flows, primarily for associate severance costs and $33.0 millionrelated to non-cash writeoffs. The balance of the provisionsrecorded under the 2000 program totaled $82.0 million atDecember 31, 2000.
Associate-related rationalization costs totaling $92.6 millionwere recorded and incurred during 2000 as follows:
Balance at(In millions) Recorded Incurred 12/31/00
Plant downsizing and consolidation $51.5 $ (3.5) $48.0Worldwide associate reductions 41.1 (15.9) 25.2
$92.6 $(19.4) $73.2
Under the 2000 program, the Company provided for the releaseof approximately 5,600 associates around the world, primarilyproduction and support associates in Europe, Latin America andAsia. During 2000, approximately 500 associates in LatinAmerican and European operations were released at a cost of$19.4 million. The Company plans to release approximately 5,100more associates under the above programs during 2001.
Rationalization costs, other than associate-related costs,totaling $26.8 million were recorded and incurred in 2000 as follows:
Balance at(In millions) Recorded Incurred 12/31/00
Plant downsizing and consolidation $26.8 $(18.0) $8.8
Plant downsizing and consolidation costs were primarily for thewriteoff of scrapped equipment taken out of service in LatinAmerica and Europe and for noncancellable lease costs. TheCompany plans to complete these actions during 2001.
1999 Program—The Company committed to a number ofrationalization actions in the first, third and fourth quarters of 1999 totaling $240.1 million ($177.7 million after tax or$1.13 per share). The balance of the provisions recorded underthe 1999 program totaled $4.3 million and $41.2 million atDecember 31, 2000 and December 31, 1999, respectively.
The Company also recorded charges under this program of $6.0 million in the second, third and fourth quarters of 2000,related to the closure of the Company’s manufacturing facility inItaly for associates that accepted negotiated benefits in thoserespective periods.
Associate-related rationalization costs totaling $171.6 millionwere recorded in 1999. Activity during 2000 is presented below:
Balance at 2000 Balance at(In millions) 12/31/99 Charges Incurred 12/31/00
North American Tire staffing $11.1 $ — $ (9.9) $1.2
European associate reductions 6.2 6.0 (9.1) 3.1
Asset sales and other exit costs 5.8 (.5) (5.3) —
Termination of tire production 5.6 — (5.6) —
Plant downsizing and consolidation .4 — (.4) —
Withdrawal of support for CART/IRL .3 — (.3) —
$29.4 $5.5 $(30.6) $4.3
Under the above programs, approximately 450 associates werereleased in 2000 at a cost of $30.6 million. These associateswere primarily hourly and staff associates in Italy and productionand support associates at a Latin American facility. Associatereductions under the above programs have been completed, withthe exception of approximately 350 more Italian manufacturingassociates to be released during 2001.
Rationalization costs, other than associate-related costs,totaling $68.5 million were recorded in 1999. Activity during2000 follows:
Balance at 2000 Balance at(In millions) 12/31/99 Charges Incurred 12/31/00
Withdrawal of support for CART/IRL $ 9.5 $(.7) $ (8.8) $—
Termination of tire production 2.1 — (2.1) —
Plant downsizing and consolidation .1 — (.1) —
Asset sales and other exit costs .1 (.1) — —
$11.8 $(.8) $(11.0) $—
The Company has completed the actions under the above programs.
NOTES TO FINANCIAL STATEMENTS (CONT INUED)

GOODYEAR | 41
Dunlop RationalizationsThe following rationalization actions have been recorded asadjustments to the purchase price allocation in respect of theacquired Dunlop businesses, and did not affect the ConsolidatedStatement of Income.
The Company committed to certain rationalization actionsrelated to the Dunlop businesses acquired from Sumitomo onSeptember 1, 1999, for the purpose of optimizing market growthopportunities and maximizing cost efficiencies. The Companyrecorded costs in 1999 and 2000 totaling $67.1 million, substan-tially all of which were for future cash outflows. Under theserationalization programs, associate-related costs for the releaseor relocation of approximately 2,000 production, support, tech-nical, retail and administrative associates totaling $52.8 millionwere recorded, and rationalization costs, other than associate-related costs, totaling $14.3 million were recorded primarily forlease cancellations and noncancellable leases. Through December31, 2000, costs totaling $38.9 million had been incurred. Theremaining balance of these provisions at December 31, 2000totaled $28.2 million.
During 2000, associate-related costs totaling $48.4 millionwere recorded for the release of approximately 1,900 associates.Approximately 1,200 associates were released during 2000 at acost of $34.0 million. The Company plans to release approxi-mately 700 more associates under this program during 2001. The following table presents activity during 2000:
Balance at 2000 Balance at(In millions) 12/31/99 Charges Incurred 12/31/00
$3.3 $48.4 $(34.0) $17.7
During 2000, rationalization costs, other than associate-relatedcosts, totaling $11.8 million were recorded. The following tablepresents activity during 2000:
Balance at 2000 Balance at(In millions) 12/31/99 Charges Incurred 12/31/00
$2.1 $11.8 $ (3.4) $10.5
The Company has finalized and implemented the Dunlop integra-tion plan. Although the integration plan has been implemented,certain actions have not yet been fully executed and will becompleted in 2001.
NOTE 4
OTHER (INCOME) AND EXPENSE
(In millions) 2000 1999 1998
Asset sales $ (5.0) $(166.7) $(123.8)Interest income (13.9) (16.3) (12.8)Financing fees and
financial instruments 44.8 41.1 43.1Lawsuit settlement — — 15.9Miscellaneous 1.9 (5.2) 1.1
$ 27.8 $(147.1) $ (76.5)
During 2000, the Company recorded a gain of $5.0 million ($3.2 million after tax or $.02 per share) on the sale of land at a manufacturing facility in Mexico. During 1999, the Companyrecorded a gain of $149.7 million ($143.7 million after tax or$.90 per share) on the change in control of 25% of the Europeanbusinesses contributed to Goodyear Dunlop Tires Europe B.V. bythe Company. In addition, proceeds of $17.0 million ($11.1 millionafter tax or $.07 per share) were realized in 1999 from theCompany’s sale of customer lists and formulations in connectionwith its exit from the production of certain rubber chemicals. The Company recorded gains in 1998 totaling $123.8 million($76.4 million after tax or $.48 per share) on the disposition ofa latex processing facility in Georgia, six distribution facilities in North America and certain other real estate.
Interest income consists of amounts earned on deposits,primarily from funds invested in time deposits in Latin Americaand Asia, pending remittance or reinvestment in the regions. AtDecember 31, 2000, $93.2 million or 36.9% of the Company’scash, cash equivalents and short term securities were concen-trated in Latin America, primarily Brazil ($90.3 million or 37.1%at December 31, 1999) and $65.8 million or 26.0% were concen-trated in Asia ($58.8 million or 24.2% at December 31, 1999).Dividends received by the Company and domestic subsidiariesfrom its consolidated international operations for 2000, 1999 and1998 were $102.2 million, $352.4 million and $215.9 million,respectively.
Financing fees and financial instruments consists primarily of fees paid under the Company’s domestic accounts receivablecontinuous sale programs. Refer to Note 5.
In 1998, the Company recorded a charge of $15.9 million($10.4 million after tax or $.07 per share) for the settlement of several related lawsuits involving employment matters in Latin America.
NOTES TO FINANCIAL STATEMENTS (CONT INUED)

GOODYEAR | 42
NOTE 5
ACCOUNTS AND NOTES RECEIVABLE
(In millions) 2000 1999
Accounts and notes receivable $2,168.0 $2,378.2Allowance for doubtful accounts (93.3) (81.9)
$2,074.7 $2,296.3
Throughout the year, the Company sold certain domesticaccounts receivable under a continuous sale program. Under theprogram, undivided interests in designated receivable pools weresold to the purchaser with recourse limited to the receivablespurchased. At December 31, 2000 and 1999, the level of netproceeds from sales under the program was $550 million. Thevolume of receivables sold under this program totaled $3.7 billion during 2000. The balance of the uncollected portion ofreceivables sold under that and other agreements was $604.2million at December 31, 2000 and $565.6 million at December31, 1999. Fees paid by the Company under these agreements arebased on certain variable market rate indices and are recorded asOther (Income) and Expense. Refer to Note 4.
NOTE 6
GOODWILL
(In millions) 2000 1999
Goodwill $669.6 $572.4Accumulated amortization (81.2) (55.5)
$588.4 $516.9
Amortization of goodwill totaled $25.7 million, $24.1 million and$18.1 million in 2000, 1999 and 1998, respectively.
NOTE 7
INVENTORIES
(In millions) 2000 1999
Raw materials $ 480.4 $ 490.6Work in process 123.5 124.0Finished product 2,275.8 1,955.4
$2,879.7 $2,570.0
During the fourth quarter of 2000, the Company changed itsmethod of inventory costing from last-in first-out (LIFO) to first-in first-out (FIFO) for domestic inventories. Prior periods havebeen restated to reflect this change. The method was changed inpart to achieve a better matching of revenues and expenses. Thechange increased net income in 2000 by $44.4 million ($.28 perbasic and diluted share), and increased retained earnings foryears prior to 1998 by $218.2 million.
The following table presents the effect of the change on earn-ings for 1999 and 1998:
(In millions, except per share) 1999 1998
Income from Continuing Operations as reported $241.1 $717.0Change in inventory costing method 2.1 (44.8)Income from Continuing Operations as restated 243.2 672.2
Discontinued Operations – (34.7)Net Income as restated $243.2 $637.5
Income (Loss) Per Share – Basic:Income from Continuing Operations as reported $ 1.54 $ 4.58Change in inventory costing method .01 (.29)Income from Continuing Operations as restated 1.55 4.29
Discontinued Operations – (.22)Net Income as restated $ 1.55 $ 4.07
Income (Loss) Per Share – Diluted:Income from Continuing Operations as reported $ 1.52 $ 4.53Change in inventory costing method .01 (.28)Income from Continuing Operations as restated 1.53 4.25
Discontinued Operations – (.22)Net Income as restated $ 1.53 $ 4.03
NOTES TO FINANCIAL STATEMENTS (CONT INUED)

GOODYEAR | 43
NOTE 8
INVESTMENTS
InvestmentsOn February 25, 1999, the Company purchased at par fromSumitomo a 1.2% Convertible Note Due August 16, 2000, in theprincipal amount of ¥13,073,070,934 (the “Sumitomo Note”).The Sumitomo Note was convertible, if not earlier redeemed,during the period beginning July 16, 2000 through August 15,2000 into 24,254,306 shares of the Common Stock, ¥50 parvalue per share, of Sumitomo at a conversion price of ¥539 per share, subject to certain adjustments. On August 15, 2000,the Company converted the entire principal amount of theSumitomo Note into shares of the Common Stock of Sumitomo(the “Sumitomo Investment”). The Company has classified theSumitomo Investment as available-for-sale, as provided inStatement of Financial Accounting Standards No. 115, “Accountingfor Certain Investments in Debt and Equity Securities”.
The fair value of the Sumitomo Investment was $100.9 mil-lion at December 31, 2000, and is included in Other Assets onthe Consolidated Balance Sheet. Changes in the fair value of theSumitomo Investment are reported in the Consolidated BalanceSheet as Accumulated Other Comprehensive Income. The Com-pany’s 1.2% Convertible Note Payable Due August 16, 2001 inthe principal amount of ¥6,536,535,767 has been designated asa hedge of the exchange exposure of the Sumitomo Investment.To the extent the hedge is effective, the effect of exchange ratechanges on the Company’s Note are reported on the ConsolidatedBalance Sheet as Accumulated Other Comprehensive Income. At December 31, 2000 the gross unrealized holding loss on theSumitomo Investment, net of the hedge, totaled $16.1 million($10.0 million after tax).
Effective January 1, 2001, the Company adopted Statement of Financial Accounting Standards No. 133, “Accounting forDerivative Instruments and Hedging Activities”, as amended andinterpreted (SFAS 133). Pursuant to the adoption of SFAS 133,effective January 1, 2001 the Company redesignated its 1.2%Convertible Note Payable as a hedge of its investment insubsidiaries in Japan.
Noncash Investing and Financing ActivitiesThe Consolidated Statement of Cash Flows is presented net of the following transactions:
In connection with the Company’s strategic alliance withSumitomo, on February 25, 1999 the Company issued toSumitomo at par its 1.2% Convertible Note Due August 16, 2000,in the principal amount of ¥13,073,070,934 pursuant to a Note Purchase Agreement dated February 25, 1999 (the “NoteAgreement”). The Company’s Note was convertible during the
period beginning July 16, 2000 through August 15, 2000 into2,281,115 shares of the Common Stock, without par value, of the Company at a conversion price of ¥5,731 per share, subjectto certain adjustments. In addition, on February 25, 1999, theCompany purchased at par from Sumitomo a 1.2% ConvertibleNote Due August 16, 2000, in the principal amount of¥13,073,070,934 (the “Sumitomo Note”). The Sumitomo Notewas convertible, if not earlier redeemed, during the periodbeginning July 16, 2000 through August 15, 2000 into24,254,306 shares of the Common Stock, ¥50 par value pershare, of Sumitomo at a conversion price of ¥539 per share,subject to certain adjustments. The Company converted theSumitomo Note in its entirety on July 27, 2000 into 24,254,306shares of the Common Stock of Sumitomo, which represents 10%of Sumitomo’s outstanding shares. The principal amount of eachNote was equivalent to $108.0 million at February 25, 1999.
On June 14, 1999, the Company and Sumitomo agreed thatthey would not redeem the respective Notes and would convertthe Notes, subject to the condition that the global alliancebetween the Company and Sumitomo was operating at July 1,2000. On July 7, 2000, the Company and Sumitomo amended the Note Agreement and on August 15, 2000: (1) Sumitomo converted ¥6,536,535,167 principal amount of the Note intoapproximately 1,138,030 shares of the Common Stock of theCompany; (2) the Company paid ¥223,933,167 of interest on the Note; and (3) Sumitomo surrendered the Note and theCompany issued a replacement note in the principal amount of¥6,536,535,767 due on August 16, 2001 and payable at theCompany’s option in cash or in shares of Common Stock at aconversion price of ¥5,731, subject to adjustment. The replace-ment note bears interest at the rate of 1.2% per annum fromAugust 15, 2000 until the fifteenth day prior to maturity (or, ifearlier, conversion) and is convertible into Common Stock of theCompany at a conversion price of ¥5,731 per share, subject toadjustment, at any time prior to maturity.
The acquisition cost of the strategic alliance with Sumitomoin 1999 included the approximately $307 million fair value of25% of the Company’s businesses contributed to the Europeanjoint venture. The Company also acquired debt totaling $130 mil-lion in Dunlop’s European and North American businesses.
In 2000, the Company acquired a majority ownership interestin a retreading production and distribution operation in theUnited States, and recorded a liability for the expected futurepayment of $72.5 million. In 1999, the Company’s Slovenian tiremanufacturing subsidiary recorded fixed assets totaling $43.4million acquired under a capital lease. In 1998, the Companyacquired a majority ownership interest in an Indian tire manufac-turer and assumed $103 million of debt.
NOTES TO FINANCIAL STATEMENTS (CONT INUED)

GOODYEAR | 44
NOTES TO FINANCIAL STATEMENTS (CONT INUED)
NOTE 9
PROPERTIES AND PLANTS
2000 1999(In millions) Owned Capital Leases Total Owned Capital Leases Total
Properties and plants, at cost:Land and improvements $ 390.3- $ 20.7 $ 411.0 $ 445.4 $ 11.7 $ 457.1Buildings and improvements 1,683.4 108.5 1,791.9 1,652.9 96.6 1,749.5Machinery and equipment 8,537.5 92.3 8,629.8 8,234.8 148.3 8,383.1Construction in progress 550.9 — 550.9 722.7 — 722.7
11,162.1 221.5 11,383.6 11,055.8 256.6 11,312.4
Accumulated depreciation (5,785.5) (77.1) (5,862.6) (5,470.9) (80.5) (5,551.4)$ 5,376.6 $144.4 $ 5,521.0 $ 5,584.9 $176.1 $ 5,761.0
The weighted average useful lives of property used in arriving at the annual amount of depreciation provided are as follows: buildingsand improvements, approximately 18 years; machinery and equipment, approximately 10 years.
NOTE 10
LEASED ASSETSNet rental expense charged to income follows:
(In millions) 2000 1999 1998
Gross rental expense $291.4 $260.4 $240.6Sublease rental income (70.6) (72.5) (65.9)
$220.8 $187.9 $174.7
The Company enters into capital and operating leases primarily for its vehicles, data processing equipment and its wholesale and retaildistribution facilities under varying terms and conditions, including the Company’s sublease of some of its domestic retail distributionnetwork to independent dealers. Many of the leases provide that the Company will pay taxes assessed against leased property and thecost of insurance and maintenance.
While substantially all subleases and some operating leases are cancelable for periods beyond 2001, management expects that inthe normal course of its business nearly all of its independent dealer distribution network will be actively operated. As leases and sub-leases for existing locations expire, the Company would normally expect to renew the leases or substitute another more favorable retaillocation.
The following table presents minimum future lease payments:
2006 and (In millions) 2001 2002 2003 2004 2005 beyond Total
Capital LeasesMinimum lease payments $ 28.7 $ 9.0 $ 7.4 $ 6.1 $ 4.7 $ 25.7 $ 81.6Minimum sublease rentals (.2) (.1) – – – – (.3)
$ 28.5 $ 8.9 $ 7.4 $ 6.1 $ 4.7 $ 25.7 $ 81.3
Imputed interest (17.7)Executory costs (1.4)Present value $ 62.2
Operating LeasesMinimum lease payments $358.9 $182.4 $142.9 $105.1 $103.2 $209.7 $1,102.2Minimum sublease rentals (43.8) (35.8) (27.6) (19.2) (11.4) (18.2) (156.0)
$315.1 $146.6 $115.3 $ 85.9 $ 91.8 $191.5 $ 946.2
Imputed interest (207.8)Present value $ 738.4
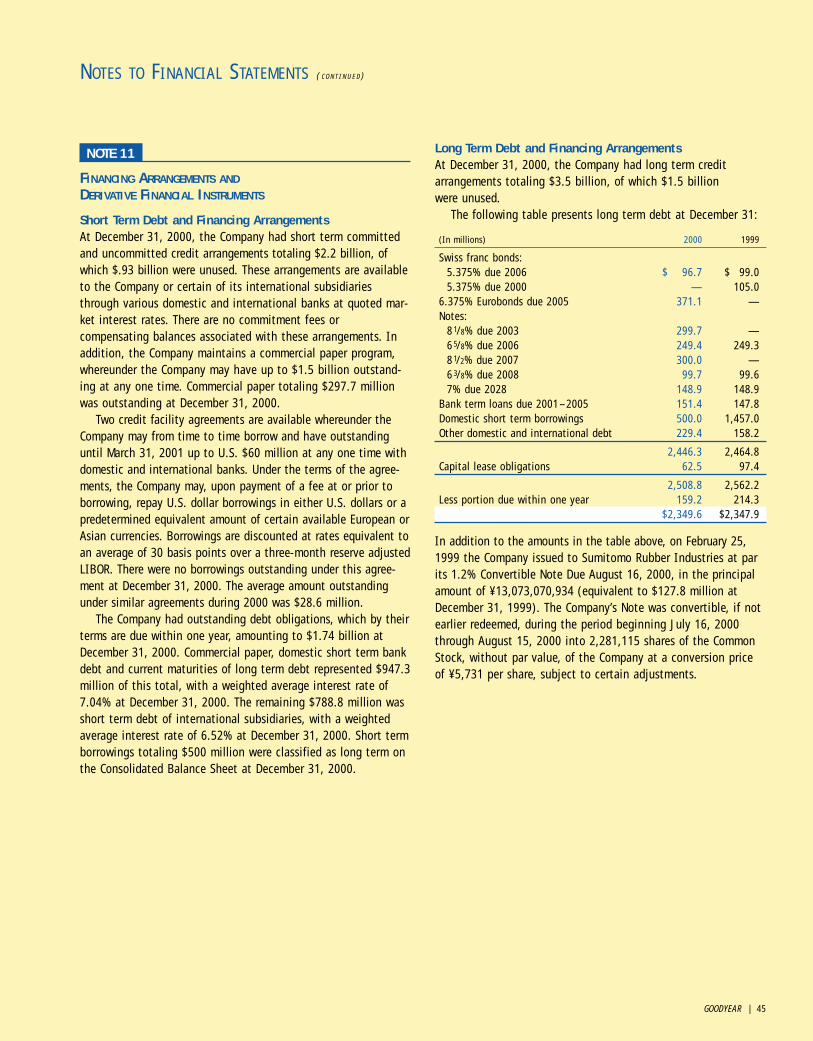
GOODYEAR | 45
NOTE 11
FINANCING ARRANGEMENTS ANDDERIVATIVE FINANCIAL INSTRUMENTS
Short Term Debt and Financing ArrangementsAt December 31, 2000, the Company had short term committedand uncommitted credit arrangements totaling $2.2 billion, ofwhich $.93 billion were unused. These arrangements are availableto the Company or certain of its international subsidiariesthrough various domestic and international banks at quoted mar-ket interest rates. There are no commitment fees orcompensating balances associated with these arrangements. Inaddition, the Company maintains a commercial paper program,whereunder the Company may have up to $1.5 billion outstand-ing at any one time. Commercial paper totaling $297.7 millionwas outstanding at December 31, 2000.
Two credit facility agreements are available whereunder theCompany may from time to time borrow and have outstandinguntil March 31, 2001 up to U.S. $60 million at any one time withdomestic and international banks. Under the terms of the agree-ments, the Company may, upon payment of a fee at or prior toborrowing, repay U.S. dollar borrowings in either U.S. dollars or apredetermined equivalent amount of certain available European orAsian currencies. Borrowings are discounted at rates equivalent toan average of 30 basis points over a three-month reserve adjustedLIBOR. There were no borrowings outstanding under this agree-ment at December 31, 2000. The average amount outstandingunder similar agreements during 2000 was $28.6 million.
The Company had outstanding debt obligations, which by theirterms are due within one year, amounting to $1.74 billion atDecember 31, 2000. Commercial paper, domestic short term bankdebt and current maturities of long term debt represented $947.3million of this total, with a weighted average interest rate of7.04% at December 31, 2000. The remaining $788.8 million wasshort term debt of international subsidiaries, with a weightedaverage interest rate of 6.52% at December 31, 2000. Short termborrowings totaling $500 million were classified as long term onthe Consolidated Balance Sheet at December 31, 2000.
Long Term Debt and Financing ArrangementsAt December 31, 2000, the Company had long term creditarrangements totaling $3.5 billion, of which $1.5 billion were unused.
The following table presents long term debt at December 31:
(In millions) 2000 1999
Swiss franc bonds:5.375% due 2006 $ 96.7 $ 99.05.375% due 2000 — 105.0
6.375% Eurobonds due 2005 371.1 —Notes:
81/8% due 2003 299.7 —65/8% due 2006 249.4 249.381/2% due 2007 300.0 —63/8% due 2008 99.7 99.67% due 2028 148.9 148.9
Bank term loans due 2001–2005 151.4 147.8Domestic short term borrowings 500.0 1,457.0Other domestic and international debt 229.4 158.2
2,446.3 2,464.8Capital lease obligations 62.5 97.4
2,508.8 2,562.2Less portion due within one year 159.2 214.3
$2,349.6 $2,347.9
In addition to the amounts in the table above, on February 25,1999 the Company issued to Sumitomo Rubber Industries at parits 1.2% Convertible Note Due August 16, 2000, in the principalamount of ¥13,073,070,934 (equivalent to $127.8 million atDecember 31, 1999). The Company’s Note was convertible, if notearlier redeemed, during the period beginning July 16, 2000through August 15, 2000 into 2,281,115 shares of the CommonStock, without par value, of the Company at a conversion priceof ¥5,731 per share, subject to certain adjustments.
NOTES TO FINANCIAL STATEMENTS (CONT INUED)
GOODYEAR | 46
On July 7, 2000, the Company and Sumitomo amended the Purchase Agreement and on August 15, 2000: (1) Sumitomoconverted ¥6,536,535,167 principal amount of the Note intoapproximately 1,138,030 shares of the Common Stock of theCompany; (2) the Company paid ¥223,933,167 of interest on the Note; and (3) Sumitomo surrendered the Note and theCompany issued a replacement note in the principal amount of ¥6,536,535,767 due on August 16, 2001 (equivalent to $56.9million at December 31, 2000) and payable at the Company’soption in cash or in shares of Common Stock at a conversionprice of ¥5,731, subject to adjustment. The replacement notebears interest at the rate of 1.2% per annum from August 15,2000 until the fifteenth day prior to maturity (or, if earlier,conversion) and is convertible into Common Stock of theCompany at a conversion price of ¥5,731 per share, subject toadjustment, at any time prior to maturity. On January 1, 2001,the Company designated its Note as a hedge of its investment insubsidiaries in Japan. On January 15, 2001, Sumitomo gavenotice to the Company that it will convert the replacement noteinto approximately 1,140,866 shares of Common Stock of theCompany on February 6, 2001.
At December 31, 2000, the fair value of the Company’s longterm fixed rate debt amounted to $1.73 billion, compared to its carrying amount of $1.78 billion ($812.7 million and $836.0 million, respectively, at December 31, 1999). The differ-ence was attributable primarily to the long term public bondsissued in 2000 and 1999. The fair value was estimated usingquoted market prices or discounted future cash flows. The fairvalue of the Company’s variable rate debt approximated itscarrying amount at December 31, 2000 and 1999.
The Swiss franc bonds were hedged by foreign exchangecontracts at December 31, 2000 and 1999, as discussed below.
The Company has designated e200 million principal amount ofthe Eurobonds as hedging the exposure to the impact ofEuro/U.S. dollar exchange rate movements on the equity of cer-tain of its subsidiaries in Europe. The remaining e200 millionprincipal amount is hedged by foreign exchange contracts, asdiscussed below.
The Notes have an aggregate face amount of $1.1 billion and are reported net of unamortized discount aggregating $2.3 million ($500.0 million and $2.2 million, respectively, atDecember 31, 1999).
The bank term loans due 2001 through 2005 are comprised of $11.4 million of fixed rate agreements bearing interest at aweighted average rate of 5.18% and a $140 million agreementbearing interest at a floating rate based upon LIBOR plus a fixedspread, including a $50 million floating rate agreement thatallows the bank to terminate the loan in 2002 or convert theloan to a fixed interest rate of 7.19% until maturity in 2005.
All commercial paper outstanding, which was issued for termsof less than 154 days, and certain domestic short term bank bor-rowings outstanding, which by their terms are or were due withinone year, are classified as long term debt on the ConsolidatedBalance Sheet at December 31, 2000 and 1999. These obliga-tions are supported by lending commitments under the tworevolving credit facilities described below. It is the Company’sintent to maintain these debt obligations as long term.
Other domestic and international debt consisted of fixed and floating rate bank loans denominated in U.S. dollars andother currencies and maturing in 2001–2008. The weightedaverage interest rate in effect under these loans was 7.73% atDecember 31, 2000.
The Company is a party to two revolving credit facility agree-ments, consisting of a $750 million five-year revolving creditfacility and a $750 million 364-day revolving credit facility.
The $750 million five-year facility agreement is with 27domestic and international banks and provides that the Companymay borrow at any time until August 15, 2005, when the com-mitment terminates and any outstanding loans mature. TheCompany pays a commitment fee ranging from 12.5 to 25 basispoints on the entire amount of the commitment (whether or notborrowed) and a usage fee on amounts borrowed (other than ona competitive bid or prime rate basis) ranging from 37.5 to 100basis points. These fees may fluctuate quarterly within theseranges based upon the Company’s leverage. During 2000, com-mitment fees ranged from 7.5 to 15 basis points and usage feesranged from 22.5 to 45 basis points. Commitment and usage feespaid during 2000 averaged 12.5 basis points.
NOTES TO FINANCIAL STATEMENTS (CONT INUED)

GOODYEAR | 47
The $750 million 364-day credit facility agreement is with 27 domestic and international banks and provides that theCompany may borrow until August 15, 2001, on which date thefacility commitment terminates, except as it may be extended ona bank by bank basis. If a bank does not extend its commitmentif requested to do so, the Company may obtain from such bank atwo year term loan up to the amount of such bank’s commitment.The Company pays a commitment fee ranging from 10 to 20basis points on the entire amount of the commitment (whetheror not borrowed) and a usage fee on amounts borrowed (otherthan on a competitive bid or prime rate basis) ranging from 40to 105 basis points. These fees may fluctuate quarterly withinthese ranges based upon the Company’s leverage. Under bothagreements, a utilization fee of 25 basis points per annum ischarged each day on which the sum of the outstanding loansexceeds 50% of the total facility.
Under both the five-year and the 364-day facilities, theCompany may obtain loans bearing interest at reserve adjustedLIBOR or a defined certificate of deposit rate, plus in each casethe applicable usage fee. In addition, the Company may obtainloans based on the prime rate or at a rate determined on a com-petitive bid basis. The facility agreements each contain certaincovenants which, among other things, require the Company tomaintain at the end of each fiscal quarter a minimum consoli-dated net worth and a defined minimum interest coverage ratio.In addition, the facility agreements establish a limit on theaggregate amount of consolidated debt the Company and itssubsidiaries may incur. There were no borrowings outstandingunder these agreements at December 31, 2000.
The annual aggregate maturities of long term debt and capitalleases for the five years subsequent to 2000 are presented below.Maturities of debt supported by the availability of the revolvingcredit agreements have been reported on the basis that thecommitments to lend under these agreements will be terminatedeffective at the end of their current terms.
(In millions) 2001 2002 2003 2004 2005
Debt incurred under or supported by revolving credit agreements $ – $ – $ – $ – $500.0
Other 216.1 132.1 311.6 13.0 385.6$216.1 $132.1 $311.6 $13.0 $885.6
Refer to Note 5 for additional information on financing arrange-ments. Refer to Note 10 for additional information on capitallease obligations.
Derivative Financial InstrumentsThe Company adopted Statement of Financial AccountingStandards No. 133, as amended and interpreted, on January 1,2001. Results of operations and financial position in this Annual Report do not reflect the adoption of this standard.
Interest Rate Exchange ContractsThe Company actively manages its fixed and floating rate debtmix, within defined limitations, using refinancings and unlever-aged interest rate swaps. The Company will enter into fixed andfloating interest rate swaps to hedge against the effects ofadverse changes in interest rates on consolidated results ofoperations and future cash outflows for interest. Fixed rate swapsare used to reduce the Company’s risk of increased interest costsduring periods of rising interest rates. Floating rate swaps areused to convert the fixed rates of long term borrowings intoshort term variable rates. Interest rate swap contracts are thusused by the Company to separate interest rate risk managementfrom the debt funding decision. At December 31, 2000, theinterest rate on 48% of the Company’s debt was fixed by eitherthe nature of the obligation or through the interest rate con-tracts, compared to 28% at December 31, 1999.
Contract information and weighted average interest rates fol-low. Current market pricing models were used to estimate the fairvalues of interest rate exchange contracts.
(Dollars in millions) 12/31/99 Matured 12/31/00
Fixed rate contracts:Notional principal amount $ 75.0 $ 25.0 $ 50.0Pay fixed rate 6.24% 6.21% 6.25%Receive variable LIBOR 6.10 6.71 6.67Average years to maturity 1.54 .9Fair value: favorable $ .5 $ —Carrying amount: (liability) — (.2)
NOTES TO FINANCIAL STATEMENTS (CONT INUED)

GOODYEAR | 48
Weighted average information during the years 2000, 1999and 1998 follows:
(Dollars in millions) 2000 1999 1998
Fixed rate contracts:Notional principal $ 71 $ 96 $ 111Receive variable LIBOR 6.56% 5.26% 5.70%Pay fixed rate 6.24 6.18 6.40
Interest Rate Lock ContractsThe Company will use, when appropriate, interest rate lock contracts to hedge the risk-free rate component of anticipatedlong term debt issuances. No contracts were outstanding atDecember 31, 2000.
(Dollars in millions) 12/31/99 Matured 12/31/00
U.S. dollar contracts:Notional $ 180 $ 180 $ —Average contract rate 6.07% 6.07% —Fair value $ 5.5 —Carrying amount — —
Euro contracts:Notional $ 101 $ 101 $ —Average contract rate 4.61% 4.61% —Fair value $ 1.4 —Carrying amount — —
Foreign Currency Exchange ContractsIn order to reduce the impact of changes in foreign exchangerates on consolidated results of operations and future foreigncurrency denominated cash flows, the Company was a party tovarious forward exchange contracts at December 31, 2000 and1999. These contracts reduce exposure to currency movementsaffecting existing foreign currency-denominated assets,liabilities and firm commitments resulting primarily from tradereceivables and payables, equipment acquisitions, intercompanyloans and the Company’s foreign currency-denominated borrow-ings in the U.S. (including the annual coupon payments).
A summary of forward exchange contracts in place atDecember 31 follows. Current market pricing models were used to estimate the fair values of foreign currency forward contracts.The contract maturities match the maturities of the currencypositions. The fair value of these contracts and the relatedcurrency positions are subject to offsetting market risk resultingfrom foreign currency exchange rate volatility.
2000 1999Fair Contract Fair Contract
(In millions) Value Amount Value Amount
Buy currency:Swiss franc $106.1 $ 95.6 $212.5 $160.6U.S. dollar 81.0 80.2 64.4 58.6Euro 310.1 296.7 29.7 30.0All other 7.0 7.5 23.1 23.1
$504.2 $480.0 $329.7 $272.3
Contract maturity:Swiss franc swap 3/06 10/00–3/06Euro swap 6/05 –All other 1/01–3/04 1/00–3/04
Sell currency:Euro $ 15.8 $ 15.6 $ 48.3 $ 49.6Swedish krona 23.0 22.9 22.2 22.3U.S. dollar 35.4 35.5 6.0 5.9All other 6.3 6.3 4.7 4.7
$ 80.5 $ 80.3 $ 81.2 $ 82.5
Contract maturity 1/01–3/01 1/00–3/00Carrying amount—
asset (liability):Swiss franc swap —
current $ — $34.7Swiss franc swap —
long term 19.0 21.4Euro swap —
long term 3.2 —Other – current .8 1.9
The counterparties to the Company’s interest rate swap and foreign exchange contracts were substantial and creditworthymultinational commercial banks or other financial institutionswhich are recognized market makers. Neither the risks ofcounterparty nonperformance nor the economic consequences of counterparty nonperformance associated with these contractswere considered by the Company to be material.
NOTES TO FINANCIAL STATEMENTS (CONT INUED)
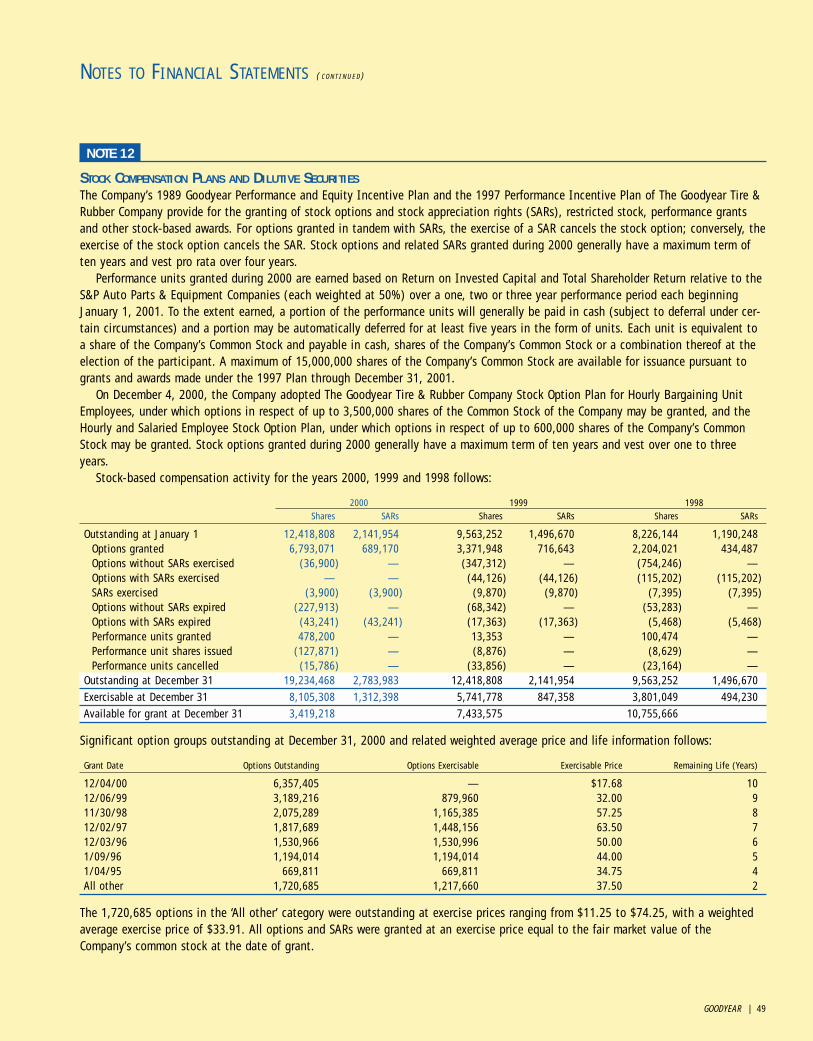
GOODYEAR | 49
NOTE 12
STOCK COMPENSATION PLANS AND DILUTIVE SECURITIESThe Company’s 1989 Goodyear Performance and Equity Incentive Plan and the 1997 Performance Incentive Plan of The Goodyear Tire &Rubber Company provide for the granting of stock options and stock appreciation rights (SARs), restricted stock, performance grantsand other stock-based awards. For options granted in tandem with SARs, the exercise of a SAR cancels the stock option; conversely, theexercise of the stock option cancels the SAR. Stock options and related SARs granted during 2000 generally have a maximum term often years and vest pro rata over four years.
Performance units granted during 2000 are earned based on Return on Invested Capital and Total Shareholder Return relative to theS&P Auto Parts & Equipment Companies (each weighted at 50%) over a one, two or three year performance period each beginningJanuary 1, 2001. To the extent earned, a portion of the performance units will generally be paid in cash (subject to deferral under cer-tain circumstances) and a portion may be automatically deferred for at least five years in the form of units. Each unit is equivalent toa share of the Company’s Common Stock and payable in cash, shares of the Company’s Common Stock or a combination thereof at theelection of the participant. A maximum of 15,000,000 shares of the Company’s Common Stock are available for issuance pursuant togrants and awards made under the 1997 Plan through December 31, 2001.
On December 4, 2000, the Company adopted The Goodyear Tire & Rubber Company Stock Option Plan for Hourly Bargaining UnitEmployees, under which options in respect of up to 3,500,000 shares of the Common Stock of the Company may be granted, and theHourly and Salaried Employee Stock Option Plan, under which options in respect of up to 600,000 shares of the Company’s CommonStock may be granted. Stock options granted during 2000 generally have a maximum term of ten years and vest over one to threeyears.
Stock-based compensation activity for the years 2000, 1999 and 1998 follows:
2000 1999 1998Shares SARs Shares SARs Shares SARs
Outstanding at January 1 12,418,808 2,141,954 9,563,252 1,496,670 8,226,144 1,190,248Options granted 6,793,071 689,170 3,371,948 716,643 2,204,021 434,487Options without SARs exercised (36,900) — (347,312) — (754,246) —Options with SARs exercised — — (44,126) (44,126) (115,202) (115,202)SARs exercised (3,900) (3,900) (9,870) (9,870) (7,395) (7,395)Options without SARs expired (227,913) — (68,342) — (53,283) —Options with SARs expired (43,241) (43,241) (17,363) (17,363) (5,468) (5,468)Performance units granted 478,200 — 13,353 — 100,474 —Performance unit shares issued (127,871) — (8,876) — (8,629) —Performance units cancelled (15,786) — (33,856) — (23,164) —
Outstanding at December 31 19,234,468 2,783,983 12,418,808 2,141,954 9,563,252 1,496,670
Exercisable at December 31 8,105,308 1,312,398 5,741,778 847,358 3,801,049 494,230
Available for grant at December 31 3,419,218 7,433,575 10,755,666
Significant option groups outstanding at December 31, 2000 and related weighted average price and life information follows:
Grant Date Options Outstanding Options Exercisable Exercisable Price Remaining Life (Years)
12/04/00 6,357,405 — $17.68 1012/06/99 3,189,216 879,960 32.00 911/30/98 2,075,289 1,165,385 57.25 812/02/97 1,817,689 1,448,156 63.50 712/03/96 1,530,966 1,530,996 50.00 61/09/96 1,194,014 1,194,014 44.00 51/04/95 669,811 669,811 34.75 4All other 1,720,685 1,217,660 37.50 2
The 1,720,685 options in the ‘All other’ category were outstanding at exercise prices ranging from $11.25 to $74.25, with a weightedaverage exercise price of $33.91. All options and SARs were granted at an exercise price equal to the fair market value of theCompany’s common stock at the date of grant.
NOTES TO FINANCIAL STATEMENTS (CONT INUED)

GOODYEAR | 50
Basic earnings per share have been computed based on theaverage number of common shares outstanding. The followingtable presents the number of incremental weighted averageshares used in computing diluted per share amounts:
2000 1999 1998
Average shares outstanding—basic 156,840,646 156,182,004 156,570,476
Stock options 213,443 758,437 1,484,463Performance units — 98,230 252,2731.2% Convertible
Note Payable 1,710,837 1,900,928 —Average shares
outstanding—diluted 158,764,926 158,939,599 158,307,212
NOTE 13
SAVINGS PLANSSubstantially all domestic associates are eligible to participate in one of the Company’s six savings plans. Under these plansassociates elect to contribute a percentage of their pay. In 2000,most plans provided for the Company’s matching of these contri-butions (up to a maximum of 6% of the associate’s annual payor, if less, $10,500) at the rate of 50%. Company contributionswere $41.4 million, $43.0 million and $42.8 million for 2000,1999 and 1998, respectively. A defined contributed pension planfor certain foreign associates was established July 1, 1999.Company contributions were $.1 million in 2000 and $2.4 millionin 1999.
NOTE 14
POSTRETIREMENT HEALTH CARE AND LIFE INSURANCE BENEFITSThe Company and its subsidiaries provide substantially alldomestic associates and associates at certain internationalsubsidiaries with health care and life insurance benefits uponretirement. Insurance companies provide life insurance andcertain health care benefits through premiums based onexpected benefits to be paid during the year. Substantialportions of the health care benefits for domestic retirees are not insured and are paid by the Company. Benefit payments are funded from operations.
Net periodic benefit cost follows:
(In millions) 2000 1999 1998
Service cost—benefits earned during the period $ 19.5 $ 21.5 $ 20.5
Interest cost 164.2 145.6 152.2Amortization of unrecognized:
—net losses 14.7 9.0 8.9—prior service cost (2.2) (2.3) (3.9)
$196.2 $173.8 $177.7
NOTES TO FINANCIAL STATEMENTS (CONT INUED)
Weighted average option exercise price information follows:
2000 1999 1998
Outstanding at January 1 $45.63 $50.27 $46.86Granted during the year 17.68 32.00 57.25Exercised during the year 16.59 23.71 37.77Outstanding at December 31 35.54 45.63 50.27Exercisable at December 31 47.48 47.55 43.56
Forfeitures and cancellations were insignificant.Weighted average fair values at date of grant for grants in
2000, 1999 and 1998 follow:
2000 1999 1998
Options $ 6.58 $12.85 $18.76Performance units 19.00 51.62 57.25
The above fair value of options at date of grant was estimatedusing the Black-Scholes model with the following weightedaverage assumptions:
2000 1999 1998
Expected life (years) 5 5 5Interest rate 5.44% 5.97% 4.51%Volatility 30.5 33.4 26.9Dividend yield 2.81 2.12 1.92
The fair value of performance units at date of grant was equal tothe market value of the Company’s common stock at that date.
Stock-based compensation costs reduced (increased) income as follows:
(In millions, except per share) 2000 1999 1998
Pretax income $ .2 $(12.4) $ 5.0Net income .1 (7.7) 3.1Net income per share — (.05) .02
The following table presents the pro forma reduction in incomethat would have been recorded had the fair values of optionsgranted in each year been recognized as compensation expenseon a straight-line basis over the four-year vesting period of eachgrant.
(In millions, except per share) 2000 1999 1998
Pretax income $33.9 $30.3 $26.7Net income 25.3 23.2 22.5Net income per share .16 .15 .14
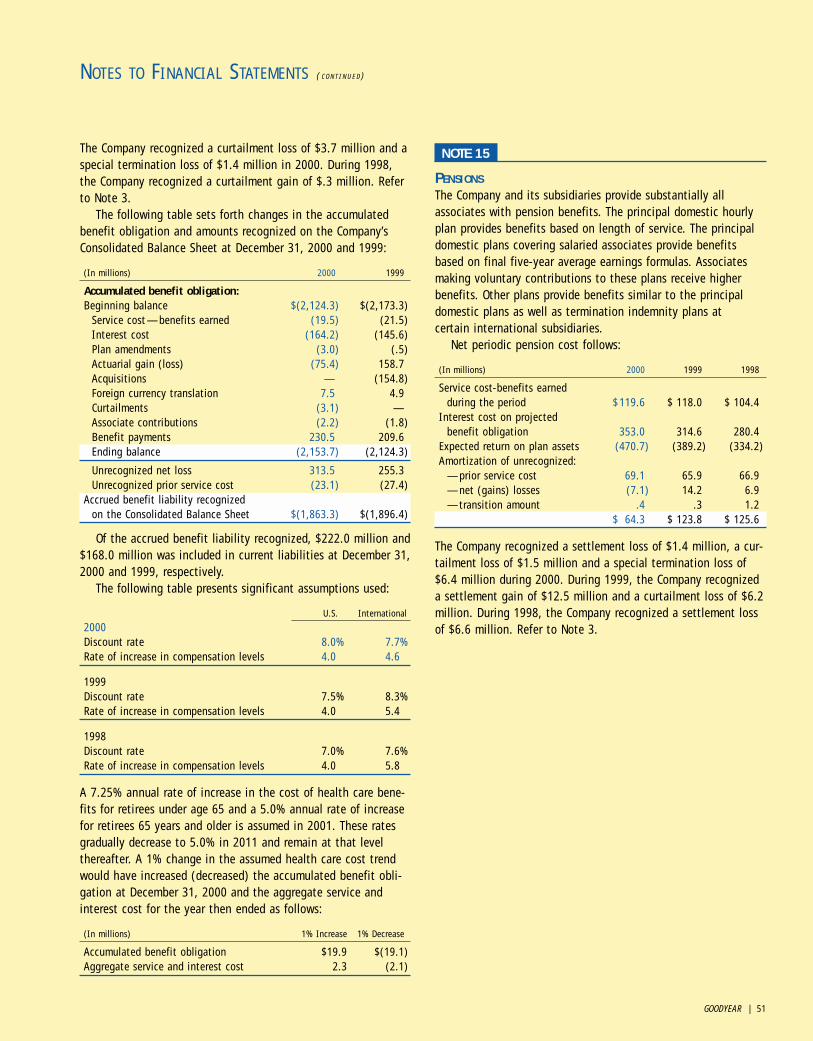
GOODYEAR | 51
The Company recognized a curtailment loss of $3.7 million and aspecial termination loss of $1.4 million in 2000. During 1998,the Company recognized a curtailment gain of $.3 million. Referto Note 3.
The following table sets forth changes in the accumulated benefit obligation and amounts recognized on the Company’sConsolidated Balance Sheet at December 31, 2000 and 1999:
(In millions) 2000 1999
Accumulated benefit obligation:Beginning balance $(2,124.3) $(2,173.3)
Service cost—benefits earned (19.5) (21.5)Interest cost (164.2) (145.6)Plan amendments (3.0) (.5)Actuarial gain (loss) (75.4) 158.7Acquisitions — (154.8)Foreign currency translation 7.5 4.9Curtailments (3.1) —Associate contributions (2.2) (1.8)Benefit payments 230.5 209.6Ending balance (2,153.7) (2,124.3)
Unrecognized net loss 313.5 255.3 Unrecognized prior service cost (23.1) (27.4)
Accrued benefit liability recognized on the Consolidated Balance Sheet $(1,863.3) $(1,896.4)
Of the accrued benefit liability recognized, $222.0 million and$168.0 million was included in current liabilities at December 31,2000 and 1999, respectively.
The following table presents significant assumptions used:
U.S. International
2000Discount rate 8.0% 7.7%Rate of increase in compensation levels 4.0 4.6
1999Discount rate 7.5% 8.3%Rate of increase in compensation levels 4.0 5.4
1998Discount rate 7.0% 7.6%Rate of increase in compensation levels 4.0 5.8
A 7.25% annual rate of increase in the cost of health care bene-fits for retirees under age 65 and a 5.0% annual rate of increasefor retirees 65 years and older is assumed in 2001. These ratesgradually decrease to 5.0% in 2011 and remain at that levelthereafter. A 1% change in the assumed health care cost trendwould have increased (decreased) the accumulated benefit obli-gation at December 31, 2000 and the aggregate service andinterest cost for the year then ended as follows:
(In millions) 1% Increase 1% Decrease
Accumulated benefit obligation $19.9 $(19.1)Aggregate service and interest cost 2.3 (2.1)
NOTE 15
PENSIONSThe Company and its subsidiaries provide substantially allassociates with pension benefits. The principal domestic hourlyplan provides benefits based on length of service. The principaldomestic plans covering salaried associates provide benefitsbased on final five-year average earnings formulas. Associatesmaking voluntary contributions to these plans receive higherbenefits. Other plans provide benefits similar to the principaldomestic plans as well as termination indemnity plans at certain international subsidiaries.
Net periodic pension cost follows:
(In millions) 2000 1999 1998
Service cost-benefits earned during the period $119.6 $ 118.0 $ 104.4
Interest cost on projected benefit obligation 353.0 314.6 280.4
Expected return on plan assets (470.7) (389.2) (334.2)Amortization of unrecognized:
—prior service cost 69.1 65.9 66.9—net (gains) losses (7.1) 14.2 6.9—transition amount .4 .3 1.2
$ 64.3 $ 123.8 $ 125.6
The Company recognized a settlement loss of $1.4 million, a cur-tailment loss of $1.5 million and a special termination loss of$6.4 million during 2000. During 1999, the Company recognizeda settlement gain of $12.5 million and a curtailment loss of $6.2million. During 1998, the Company recognized a settlement lossof $6.6 million. Refer to Note 3.
NOTES TO FINANCIAL STATEMENTS (CONT INUED)

GOODYEAR | 52
The following table sets forth the funded status and amountsrecognized on the Company’s Consolidated Balance Sheet atDecember 31, 2000 and 1999. At the end of 2000 and 1999,assets exceeded accumulated benefits in certain plans and accu-mulated benefits exceeded assets in others. Plan assets areinvested primarily in common stocks and fixed income securities.
(In millions) 2000 1999
Projected benefit obligation:Beginning balance $(4,878.1) $(4,154.8)
Service cost—benefits earned (119.6) (118.0)Interest cost (353.0) (314.6)Plan amendments (248.6) (.6)Actuarial loss 153.8 (5.8)Associate contributions (23.6) (23.4)Acquisitions — (626.1)Curtailments/settlements 6.7 6.3Foreign currency translation 78.7 76.9Benefit payments 332.3 282.0
Ending balance (5,051.4) (4,878.1)
Plan assets 4,749.6 5,178.9
Projected benefit obligation in excess of plan assets (301.8) 300.8
Unrecognized prior service cost 645.7 475.1Unrecognized net gain (10.2) (440.6) Unrecognized net obligation at transition 6.7 8.0 Net benefit cost recognized on the
Consolidated Balance Sheet $ 340.4 $ 343.3
The following table presents significant assumptions used:
U.S. International
2000Discount rate 8.0% 6.7%Rate of increase in compensation levels 4.0 3.6Expected long term rate of return on plan assets 9.5 8.6
1999Discount rate 7.5% 6.8%Rate of increase in compensation levels 4.3 3.9Expected long term rate of return on plan assets 9.5 8.8
1998Discount rate 7.0% 6.6%Rate of increase in compensation levels 4.0 3.8Expected long term rate of return on plan assets 9.5 8.7
The following table presents amounts recognized on theConsolidated Balance Sheet:
(In millions) 2000 1999
Prepaid benefit cost—current $ 92.0 $ 18.0—long term 549.5 598.6
Accrued benefit cost—current (72.7) (63.1)—long term (521.5) (242.6)
Intangible asset 259.4 8.9Deferred income taxes 11.8 8.3Accumulated other comprehensive income 21.9 15.2Net benefit cost recognized on the
Consolidated Balance Sheet $340.4 $ 343.3
The following table presents changes in plan assets:
(In millions) 2000 1999
Beginning balance $5,178.9 $3,931.2Actual return on plan assets (117.2) 831.4Company contributions 81.0 120.0Associate contributions 23.6 23.4Acquisitions — 601.1Settlements (7.8) (12.5)Foreign currency translation (76.6) (33.7)Benefit payments (332.3) (282.0)
Ending balance $4,749.6 $5,178.9
For plans that are not fully funded:
(In millions) 2000 1999
Accumulated benefit obligation $2,487.1 $364.3Plan assets 2,239.9 65.3
Certain international subsidiaries maintain unfunded plans con-sistent with local practices and requirements. At December 31,2000, these plans accounted for $167.7 million of the Company’saccumulated benefit obligation, $177.4 million of its projectedbenefit obligation and $16.7 million of its minimum pensionliability adjustment ($170.6 million, $173.3 million and $13.4million, respectively, at December 31, 1999).
NOTES TO FINANCIAL STATEMENTS (CONT INUED)
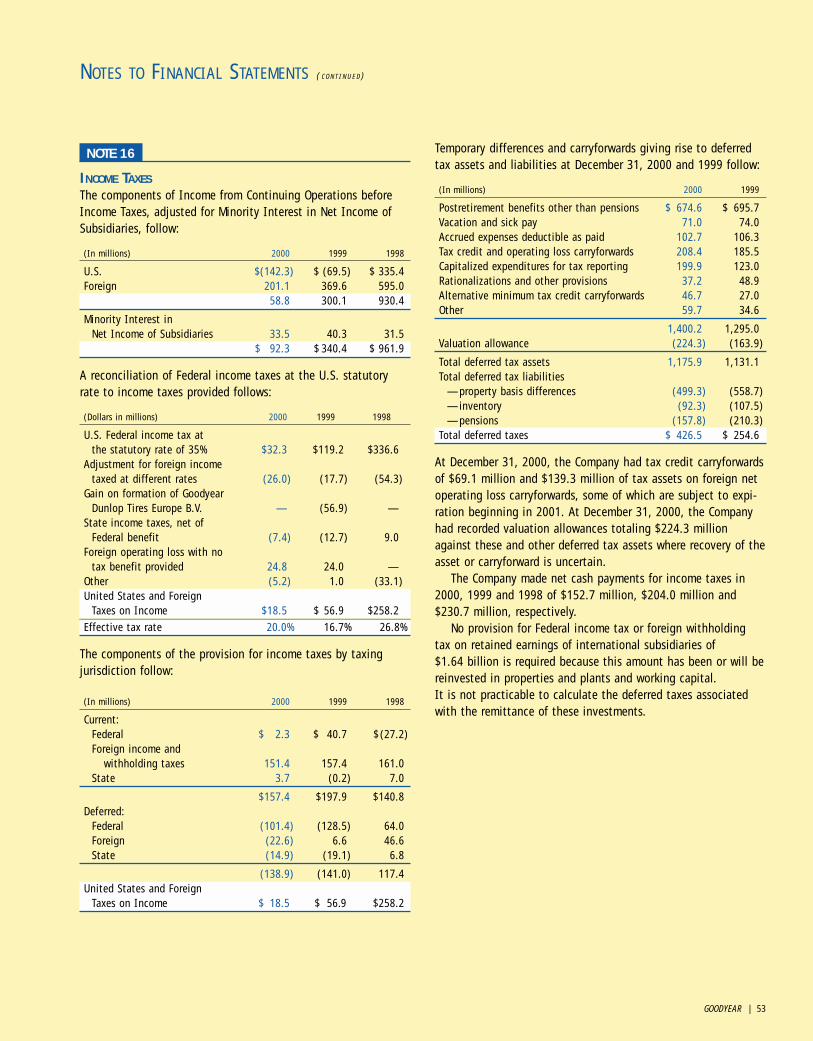
GOODYEAR | 53
NOTE 16
INCOME TAXESThe components of Income from Continuing Operations beforeIncome Taxes, adjusted for Minority Interest in Net Income ofSubsidiaries, follow:
(In millions) 2000 1999 1998
U.S. $(142.3) $ (69.5) $ 335.4Foreign 201.1 369.6 595.0
58.8 300.1 930.4
Minority Interest in Net Income of Subsidiaries 33.5 40.3 31.5
$ 92.3 $ 340.4 $ 961.9
A reconciliation of Federal income taxes at the U.S. statutoryrate to income taxes provided follows:
(Dollars in millions) 2000 1999 1998
U.S. Federal income tax atthe statutory rate of 35% $32.3 $119.2 $336.6
Adjustment for foreign income taxed at different rates (26.0) (17.7) (54.3)
Gain on formation of Goodyear Dunlop Tires Europe B.V. — (56.9) —
State income taxes, net of Federal benefit (7.4) (12.7) 9.0
Foreign operating loss with no tax benefit provided 24.8 24.0 —
Other (5.2) 1.0 (33.1)United States and Foreign
Taxes on Income $18.5 $ 56.9 $258.2
Effective tax rate 20.0% 16.7% 26.8%
The components of the provision for income taxes by taxingjurisdiction follow:
(In millions) 2000 1999 1998
Current:Federal $ 2.3 $ 40.7 $(27.2)Foreign income and
withholding taxes 151.4 157.4 161.0State 3.7 (0.2) 7.0
$157.4 $197.9 $140.8Deferred:
Federal (101.4) (128.5) 64.0Foreign (22.6) 6.6 46.6State (14.9) (19.1) 6.8
(138.9) (141.0) 117.4United States and Foreign
Taxes on Income $ 18.5 $ 56.9 $258.2
Temporary differences and carryforwards giving rise to deferredtax assets and liabilities at December 31, 2000 and 1999 follow:
(In millions) 2000 1999
Postretirement benefits other than pensions $ 674.6 $ 695.7Vacation and sick pay 71.0 74.0Accrued expenses deductible as paid 102.7 106.3Tax credit and operating loss carryforwards 208.4 185.5Capitalized expenditures for tax reporting 199.9 123.0Rationalizations and other provisions 37.2 48.9Alternative minimum tax credit carryforwards 46.7 27.0Other 59.7 34.6
1,400.2 1,295.0Valuation allowance (224.3) (163.9)
Total deferred tax assets 1,175.9 1,131.1 Total deferred tax liabilities
—property basis differences (499.3) (558.7)—inventory (92.3) (107.5)—pensions (157.8) (210.3)
Total deferred taxes $ 426.5 $ 254.6
At December 31, 2000, the Company had tax credit carryforwardsof $69.1 million and $139.3 million of tax assets on foreign netoperating loss carryforwards, some of which are subject to expi-ration beginning in 2001. At December 31, 2000, the Companyhad recorded valuation allowances totaling $224.3 millionagainst these and other deferred tax assets where recovery of theasset or carryforward is uncertain.
The Company made net cash payments for income taxes in2000, 1999 and 1998 of $152.7 million, $204.0 million and $230.7 million, respectively.
No provision for Federal income tax or foreign withholding tax on retained earnings of international subsidiaries of $1.64 billion is required because this amount has been or will bereinvested in properties and plants and working capital. It is not practicable to calculate the deferred taxes associatedwith the remittance of these investments.
NOTES TO FINANCIAL STATEMENTS (CONT INUED)

GOODYEAR | 54
NOTE 17
INTEREST EXPENSEInterest expense includes interest and amortization of debtdiscount and expense, less amounts capitalized as follows:
(In millions) 2000 1999 1998
Interest expense before capitalization $294.6 $191.2 $154.4
Capitalized interest (12.0) (11.8) (6.6)$282.6 $179.4 $147.8
The Company made cash payments for interest in 2000, 1999 and1998 of $261.0 million, $192.8 million and $143.8 million,respectively.
NOTE 18
RESEARCH AND DEVELOPMENTResearch and development costs for 2000, 1999 and 1998 were$423.1 million, $438.0 million and $420.7 million, respectively.
NOTE 19
ADVERTISING COSTSAdvertising costs for 2000, 1999 and 1998 were $239.9 million,$238.2 million and $233.4 million, respectively.
NOTE 20
BUSINESS SEGMENTSSegment information reflects the strategic business units of the Company (SBUs), which are organized to meet customerrequirements and global competition.
The Tire business is comprised of five regional SBUs. TheEngineered and Chemical businesses are each managed on aglobal basis. Segment information is reported on the basis used for reporting to the Company’s Chairman of the Board and Chief Executive Officer.
Each of the five regional tire business segments is involved in the development, manufacture, distribution and sale of tires.Certain of the tire business segments also provide related prod-ucts and services, which include tubes, retreads, automotiverepair services and merchandise purchased for resale.
North American Tire provides original equipment and replace-ment tires for autos, trucks, farm, aircraft and constructionapplications in the United States, Canada and export markets.North American Tire also provides related products and servicesincluding tread rubber, tubes, retreaded tires, automotive repairservices and merchandise purchased for resale.
European Union Tire provides original equipment and replace-ment tires for autos, trucks, farm and construction applicationsin the European Union, Norway, Switzerland and export markets.European Union Tire also retreads truck and aircraft tires.
Eastern Europe, Africa and Middle East Tire provides replace-ment tires for autos, trucks and farm applications in EasternEurope, Africa, the Middle East and export markets. The segmentalso provides original equipment tires to manufacturers in Poland, South Africa, Turkey, Morocco and the Czech Republic.
Latin American Tire provides original equipment and replace-ment tires for autos, trucks, tractors, aircraft and constructionapplications in Central and South America, Mexico and exportmarkets. Latin American Tire also manufactures materials for tire retreading.
Asia Tire provides original equipment and replacement tires for autos, trucks, farm, aircraft and construction applications in Asia and the Western Pacific. Asia Tire also retreads truck,construction equipment and aircraft tires and provides auto-motive repair services.
Engineered Products develops, manufactures and sells belts,hoses, molded products, airsprings, tank tracks and otherproducts for original equipment and replacement transportationapplications and industrial markets worldwide.
Chemical Products develops, manufactures and sells organicchemicals used in rubber and plastic processing, synthetic rubberand rubber latices, and other products for internal and externalcustomers worldwide. Chemical Products also engages in planta-tion and natural rubber purchasing operations.
The Company’s oil transportation business was sold during 1998 and is accounted for as a discontinued operation. Refer toNote 22.
NOTES TO FINANCIAL STATEMENTS (CONT INUED)

GOODYEAR | 55
(In millions) 2000 1999 1998
Sales North American Tire $ 7,111.3 $ 6,648.6 $ 6,507.9European Union Tire 3,198.1 2,642.7 2,139.8Eastern Europe, Africa and Middle East Tire 793.0 812.9 867.4Latin American Tire 1,047.9 948.1 1,269.8Asia Tire 524.6 593.2 519.3
Total Tires 12,674.9 11,645.5 11,304.2
Engineered Products 1,174.2 1,234.8 1,301.8Chemical Products 1,129.7 949.8 993.0
Total Segment Sales 14,978.8 13,830.1 13,599.0
Inter-SBU sales (567.1) (482.8) (524.3)Other 5.4 8.1 6.9
Net Sales $14,417.1 $13,355.4 $13,081.6
IncomeNorth American Tire $ 260.7 $ 26.3 $ 314.2 European Union Tire 88.7 188.0 199.7Eastern Europe, Africa and Middle East Tire 54.6 49.8 102.4Latin American Tire 69.8 67.7 186.1Asia Tire 17.9 26.0 7.5
Total Tires 491.7 357.8 809.9
Engineered Products 43.1 70.4 111.7Chemical Products 64.2 116.4 132.7
Total Segment Income (EBIT) 599.0 544.6 1,054.3
Rationalizations, asset sales and other provisions (119.1) (4.9) 137.6Interest expense (282.6) (179.4) (147.8)Foreign currency exchange 6.7 27.6 2.6Minority interest in net income of subsidiaries (33.5) (40.3) (31.5)Inter-SBU income (28.8) (49.6) (61.1)Other (82.9) 2.1 (23.7)
Income from Continuing Operations before Income Taxes $ 58.8 $ 300.1 $ 930.4
AssetsNorth American Tire $ 5,268.5 $ 5,046.6 $ 4,136.7European Union Tire 3,088.1 3,336.1 1,690.0Eastern Europe, Africa and Middle East Tire 903.6 897.1 898.1Latin American Tire 796.5 820.7 993.8Asia Tire 668.5 725.5 744.0
Total Tires 10,725.2 10,826.0 8,462.6
Engineered Products 736.8 712.4 717.5Chemical Products 742.9 689.6 625.1
Total Segment Assets 12,204.9 12,228.0 9,805.2
Corporate 1,363.1 1,050.1 957.5Assets $13,568.0 $13,278.1 $10,762.7
Results of operations in the Tire and Engineered Products segments were measured based on net sales to unaffiliated customers andEBIT. Results of operations of the Chemical Products segment included transfers to other SBUs. EBIT is computed as follows: net salesless cost of goods sold, selling, administrative and general expense (including allocated central administrative expenses) and equity inearnings of affiliated companies. Inter-SBU sales by Chemical Products were at the lower of a formulated price or market. Purchasesfrom Chemical Products were included in the purchasing SBU’s EBIT at Chemical Products cost. Segment assets include those assetsunder the management of the SBU.
NOTES TO FINANCIAL STATEMENTS (CONT INUED)
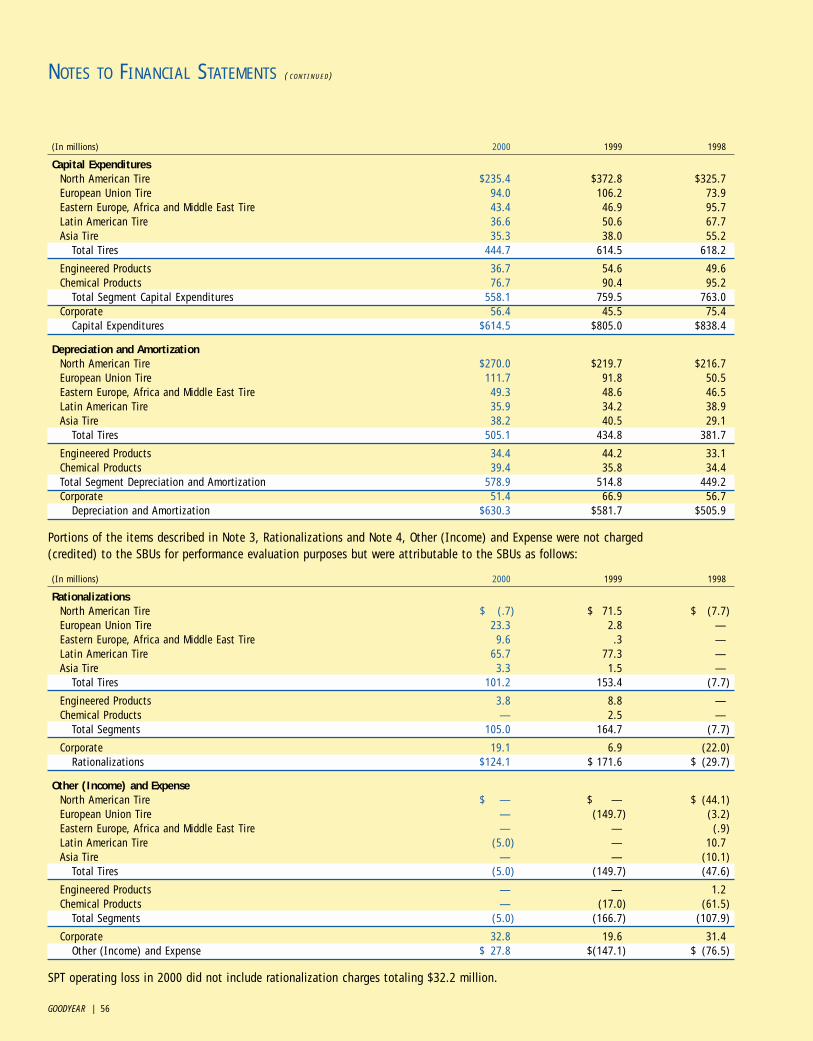
GOODYEAR | 56
(In millions) 2000 1999 1998
Capital Expenditures North American Tire $235.4 $372.8 $325.7European Union Tire 94.0 106.2 73.9 Eastern Europe, Africa and Middle East Tire 43.4 46.9 95.7Latin American Tire 36.6 50.6 67.7Asia Tire 35.3 38.0 55.2
Total Tires 444.7 614.5 618.2
Engineered Products 36.7 54.6 49.6Chemical Products 76.7 90.4 95.2
Total Segment Capital Expenditures 558.1 759.5 763.0Corporate 56.4 45.5 75.4
Capital Expenditures $614.5 $805.0 $838.4
Depreciation and AmortizationNorth American Tire $270.0 $219.7 $216.7European Union Tire 111.7 91.8 50.5Eastern Europe, Africa and Middle East Tire 49.3 48.6 46.5Latin American Tire 35.9 34.2 38.9Asia Tire 38.2 40.5 29.1
Total Tires 505.1 434.8 381.7
Engineered Products 34.4 44.2 33.1Chemical Products 39.4 35.8 34.4Total Segment Depreciation and Amortization 578.9 514.8 449.2Corporate 51.4 66.9 56.7
Depreciation and Amortization $630.3 $581.7 $505.9
Portions of the items described in Note 3, Rationalizations and Note 4, Other (Income) and Expense were not charged (credited) to the SBUs for performance evaluation purposes but were attributable to the SBUs as follows:
(In millions) 2000 1999 1998
Rationalizations North American Tire $ (.7) $ 71.5 $ (7.7)European Union Tire 23.3 2.8 —Eastern Europe, Africa and Middle East Tire 9.6 .3 —Latin American Tire 65.7 77.3 —Asia Tire 3.3 1.5 —
Total Tires 101.2 153.4 (7.7)
Engineered Products 3.8 8.8 —Chemical Products — 2.5 —
Total Segments 105.0 164.7 (7.7)
Corporate 19.1 6.9 (22.0)Rationalizations $124.1 $ 171.6 $ (29.7)
Other (Income) and ExpenseNorth American Tire $ — $ — $ (44.1)European Union Tire — (149.7) (3.2)Eastern Europe, Africa and Middle East Tire — — (.9)Latin American Tire (5.0) — 10.7Asia Tire — — (10.1)
Total Tires (5.0) (149.7) (47.6)
Engineered Products — — 1.2Chemical Products — (17.0) (61.5)
Total Segments (5.0) (166.7) (107.9)
Corporate 32.8 19.6 31.4Other (Income) and Expense $ 27.8 $(147.1) $ (76.5)
SPT operating loss in 2000 did not include rationalization charges totaling $32.2 million.
NOTES TO FINANCIAL STATEMENTS (CONT INUED)

GOODYEAR | 57
NOTES TO FINANCIAL STATEMENTS (CONT INUED)
Sales and operating income of the Asia Tire segment reflect the results of the Company’s majority-owned tire business in theregion. In addition, the Company owns a 50% interest in SouthPacific Tyres Ltd. (SPT), a tire manufacturer in Australia and NewZealand. Results of operations of SPT are not reported in segmentresults, and are reflected in the Company’s ConsolidatedStatement of Income using the equity method.
The following table presents the sales and operating incomeof the Company’s Asia Tire segment together with 100% of thesales and operating income of SPT:
(In millions) 2000 1999 1998
Net SalesAsia Tire Segment $ 524.6 $ 593.2 $ 519.3SPT 563.6 674.5 654.0
$1,088.2 $1,267.7 $1,173.3
Operating Income (Loss)Asia Tire Segment $ 17.9 $ 26.0 $ 7.5SPT (11.1) 31.2 47.2
$ 6.8 $ 57.2 $ 54.7
The following table presents geographic information. Net sales by country were determined based on the location of theselling subsidiary. Long-lived assets consisted primarily ofproperties and plants, deferred charges and other miscellaneousassets. Management did not consider the net sales or long-livedassets of individual countries outside the United States to besignificant to the consolidated financial statements.
(In millions) 2000 1999 1998
Net SalesUnited States $ 7,611.1 $ 7,136.6 $ 7,093.5International 6,806.0 6,218.8 5,988.1
$14,417.1 $13,355.4 $13,081.6
Long-Lived AssetsUnited States $ 4,188.5 $ 4,080.1 $ 2,750.6International 3,166.3 3,290.2 2,649.5
$ 7,354.8 $ 7,370.3 $ 5,400.1
NOTE 21
ACCUMULATED OTHER COMPREHENSIVE INCOMEThe components of Accumulated Other Comprehensive Income follow:
(In millions) 2000 1999
Foreign currency translation adjustment $(1,273.9) $(1,072.2)Minimum pension liability adjustment (21.9) (15.2) Unrealized investment loss (10.0) (12.8)
$(1,305.8) $(1,100.2)
NOTE 22
DISCONTINUED OPERATIONSOn July 30, 1998, the Company sold substantially all of theassets and liabilities of its oil transportation business to PlainsAll American Inc., a subsidiary of Plains Resources Inc. Proceedsfrom the sale were $422.3 million, which included distributionsto the Company prior to closing of $25.1 million. The principalasset of the oil transportation business was the All AmericanPipeline System, consisting of a 1,225 mile heated crude oilpipeline system extending from Las Flores and Gaviota,California, to McCamey, Texas, a crude oil gathering systemlocated in California’s San Joaquin Valley and related terminaland storage facilities.
The transaction has been accounted for as a sale of discon-tinued operations. Operating results and the loss on sale ofdiscontinued operations follow:
(In millions, except per share) Year Ended December 31, 1998
Net Sales $ 22.4
Income before Income Taxes $ 12.9United States Taxes on Income 4.7Income from Discontinued Operations 8.2
Loss on Sale of Discontinued Operations, including income from operations during the disposal period (3/21/98–7/30/98) of $10.0 (net of tax of $24.1) (42.9)Discontinued Operations $(34.7)
Income (Loss) Per Share—Basic:Income from Discontinued Operations $ .05Loss on Sale of Discontinued Operations (.27)
Discontinued Operations $ (.22)
Income (Loss) Per Share—Diluted:Income from Discontinued Operations $ .05Loss on Sale of Discontinued Operations (.27)
Discontinued Operations $ (.22)

GOODYEAR | 58
NOTE 23
COMMITMENTS AND CONTINGENT LIABILITIESAt December 31, 2000, the Company had binding commitmentsfor investments in land, buildings and equipment of $177.1 million and off-balance-sheet financial guarantees written and other commitments totaling $138.8 million.
At December 31, 2000, the Company had recorded liabilitiesaggregating $78.3 million for anticipated costs related to variousenvironmental matters, primarily the remediation of numerouswaste disposal sites and certain properties sold by the Company.These costs include legal and consulting fees, site studies, thedesign and implementation of remediation plans, post-remediation monitoring and related activities and will be paidover several years. The amount of the Company’s ultimateliability in respect of these matters may be affected by severaluncertainties, primarily the ultimate cost of required remediationand the extent to which other responsible parties contribute.Refer to Environmental Cleanup Matters at Note 1.
At December 31, 2000, the Company had recorded liabilitiesaggregating $96.1 million for potential product liability andother tort claims, including related legal fees expected to beincurred, presently asserted against the Company. The amountrecorded was determined on the basis of an assessment ofpotential liability using an analysis of pending claims, historicalexperience and current trends. The Company has concluded thatin respect of any of the above described liabilities, it is notreasonably possible that it would incur a loss exceeding theamount already recognized with respect thereto which would bematerial relative to the consolidated financial position, results of operations or liquidity of the Company.
Various other legal actions, claims and governmental investi-gations and proceedings covering a wide range of matters arepending against the Company and its subsidiaries. Management,after reviewing available information relating to such mattersand consulting with the Company’s General Counsel, has deter-mined with respect to each such matter either that it is notreasonably possible that the Company has incurred liability inrespect thereof or that any liability ultimately incurred will notexceed the amount, if any, recorded at December 31, 2000 inrespect thereof which would be material relative to the consoli-dated financial position, results of operations or liquidity of theCompany. However, in the event of an unanticipated adversefinal determination in respect of certain matters, the Company’sconsolidated net income for the period in which such determi-nation occurs could be materially affected.
NOTE 24
PREFERRED STOCK PURCHASE RIGHTS PLANIn June 1996, the Company authorized 7,000,000 shares ofSeries B Preferred Stock (“Series B Preferred”) issuable only uponthe exercise of rights (“Rights”) issued under the Preferred StockPurchase Rights Plan adopted on, and set forth in the RightsAgreement dated, June 4, 1996. Each share of Series B Preferredissued would be non-redeemable, non-voting and entitled to (i) cumulative quarterly dividends equal to the greater of $25.00or, subject to adjustment, 100 times the per year amount ofdividends declared on Goodyear Common Stock (“the CommonStock”) during the preceding quarter and (ii) a liquidationpreference.
Under the Rights Plan, each shareholder of record on July 29,1996 received a dividend of one Right per share of the CommonStock. Each Right, when exercisable, will entitle the registeredholder thereof to purchase from the Company one one-hundredthof a share of Series B Preferred Stock at a price of $250 (the“Purchase Price”), subject to adjustment. The Rights will expireon July 29, 2006, unless earlier redeemed at $.001 per Right.The Rights will be exercisable only in the event that an acquiringperson or group purchases, or makes—or announces its inten-tion to make—a tender offer for, 15% or more of the CommonStock. In the event that any acquiring person or group acquires15% or more of the Common Stock, each Right will entitle theholder to purchase that number of shares of Common Stock (or in certain circumstances, other securities, cash or property)which at the time of such transaction would have a market value of two times the Purchase Price.
If the Company is acquired or a sale or transfer of 50% ormore of the Company’s assets or earnings power is made afterthe Rights become exercisable, each Right (except those held byan acquiring person or group) will entitle the holder to purchasecommon stock of the acquiring entity having a market valuethen equal to two times the Purchase Price. In addition, whenexercisable the Rights under certain circumstances may beexchanged by the Company at the ratio of one share of CommonStock (or the equivalent thereof in other securities, property orcash) per Right, subject to adjustment.
NOTES TO FINANCIAL STATEMENTS (CONT INUED)

GOODYEAR | 59
QUARTERLY DATA AND MARKET PRICE INFORMATION
(In millions, except per share) Quarter
2000 First Second Third Fourth Year
Net Sales $3,664.1 $3,607.3 $3,619.3 $ 3,526.4 $14,417.1Gross Profit 730.1 756.7 650.5 642.5 2,779.8
Net Income (Loss) $ 48.2 $ 77.1 $ 17.0 $ (102.0) $ 40.3
Net Income (Loss) Per Share —Basic $ .31 $ .49 $ .11 $ (.65) $ .26 —Diluted .30 .49 .11 (.65) .25
Average Shares Outstanding —Basic 156.3 156.4 157.0 157.6 156.8—Diluted 158.7 158.7 158.2 157.6 158.8
Price Range of Common Stock:* High $ 291/8 $ 315/8 $ 263/4 $ 24.09 $ 315/8
Low 203/8 193/4 171/4 15.60 15.60Dividends Per Share $ .30 $ .30 $ .30 $ .30 $ 1.20
The second quarter included a net after-tax charge of $5.2 million or $.03 per share for rationalizations. The third quarter included an after-tax gain of $3.2 million or $.02 per share from asset sales and an after-tax charge of $1.2 million or $.01 per share forrationalizations. The fourth quarter included an after-tax charge of $93.7 million or $.59 per share for rationalizations.
(In millions, except per share) Quarter
1999 First Second Third Fourth Year
Net Sales $3,099.1 $3,162.8 $3,416.4 $ 3,677.1 $13,355.4Gross Profit 655.4 639.1 505.7 722.9 2,523.1
Net Income $ 23.9 $ 83.1 $ 99.2 $ 37.0 $ 243.2
Net Income Per Share —Basic $ .15 $ .54 $ .63 $ .23 $ 1.55—Diluted .15 .52 .63 .23 1.53
Average Shares Outstanding —Basic 156.0 156.1 156.3 156.3 156.2—Diluted 157.8 159.6 159.5 158.8 158.9
Price Range of Common Stock:* High $ 547/8 $ 663/4 $ 5913/16 $ 515/8 $ 663/4
Low 457/16 50 44 251/2 251/2
Dividends Per Share $ .30 $ .30 $ .30 $ .30 $ 1.20
The first quarter included an after-tax charge of $116.0 million or $.74 per share for rationalizations. The second quarter included anafter-tax credit of $6.0 million or $.04 per share from the reversal of rationalization reserves that were no longer needed. The thirdquarter included an after-tax charge of $42.4 million or $.27 per share for rationalizations and after-tax credits totaling $181.5 millionor $1.14 per share from asset sales and the reversal of rationalization reserves that were no longer needed. The fourth quarter includedan after-tax charge of $19.3 million or $.12 per share and an after-tax credit of $12.5 million or $.08 per share from the reversal ofrationalization reserves.
Per share amounts of unusual items are diluted.
During the fourth quarter of 2000, the Company 1) changed its inventory costing method from LIFO to FIFO and 2) began reportingexpenses for transportation of products to customers as Cost of Goods Sold. Prior periods have been restated. Refer to Notes 1 and 7.
*New York Stock Exchange—Composite Transactions
SUPPLEMENTARY DATA (UNAUDI TED)
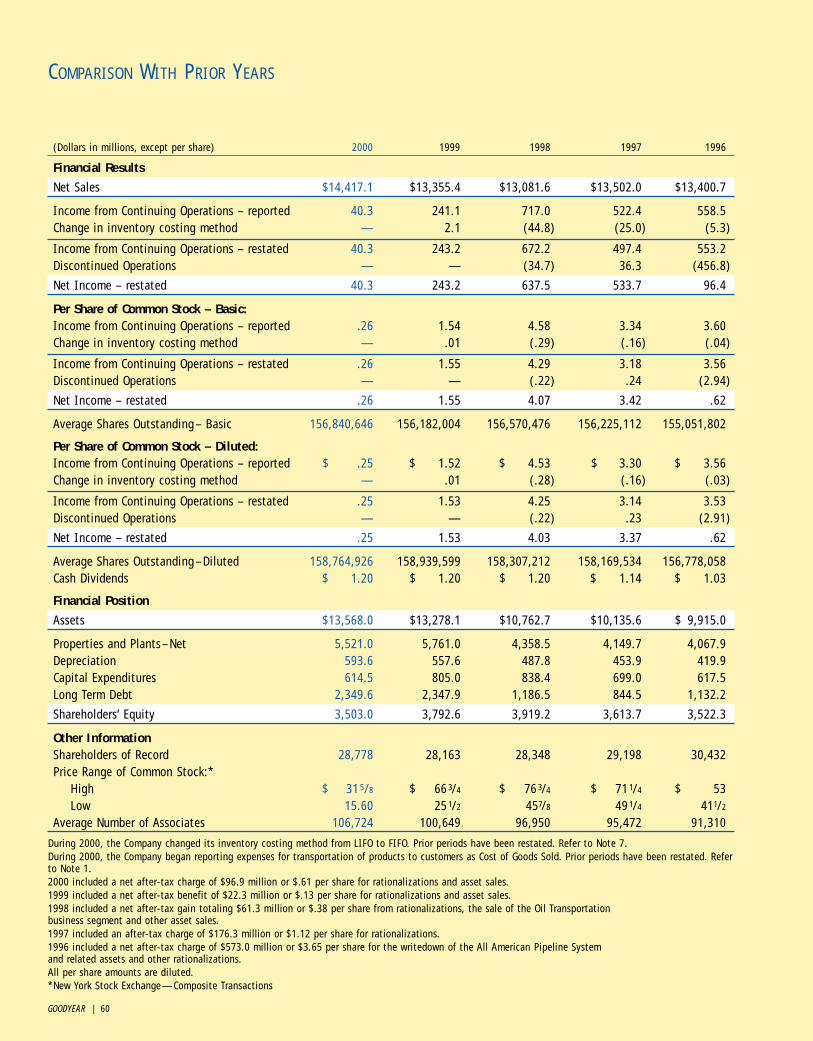
GOODYEAR | 60
(Dollars in millions, except per share) 2000 1999 1998 1997 1996
Financial Results
Net Sales $14,417.1 $13,355.4 $13,081.6 $13,502.0 $13,400.7
Income from Continuing Operations – reported 40.3 241.1 717.0 522.4 558.5Change in inventory costing method — 2.1 (44.8) (25.0) (5.3)
Income from Continuing Operations – restated 40.3 243.2 672.2 497.4 553.2Discontinued Operations — — (34.7) 36.3 (456.8)
Net Income – restated 40.3 243.2 637.5 533.7 96.4
Per Share of Common Stock – Basic:Income from Continuing Operations – reported .26 1.54 4.58 3.34 3.60Change in inventory costing method — .01 (.29) (.16) (.04)
Income from Continuing Operations – restated .26 1.55 4.29 3.18 3.56Discontinued Operations — — (.22) .24 (2.94)
Net Income – restated .26 1.55 4.07 3.42 .62
Average Shares Outstanding– Basic 156,840,646 156,182,004 156,570,476 156,225,112 155,051,802
Per Share of Common Stock – Diluted:Income from Continuing Operations – reported $ .25 $ 1.52 $ 4.53 $ 3.30 $ 3.56Change in inventory costing method — .01 (.28) (.16) (.03)
Income from Continuing Operations – restated .25 1.53 4.25 3.14 3.53Discontinued Operations — — (.22) .23 (2.91)
Net Income – restated .25 1.53 4.03 3.37 .62
Average Shares Outstanding–Diluted 158,764,926 158,939,599 158,307,212 158,169,534 156,778,058Cash Dividends $ 1.20 $ 1.20 $ 1.20 $ 1.14 $ 1.03
Financial Position
Assets $13,568.0 $13,278.1 $10,762.7 $10,135.6 $ 9,915.0
Properties and Plants–Net 5,521.0 5,761.0 4,358.5 4,149.7 4,067.9Depreciation 593.6 557.6 487.8 453.9 419.9Capital Expenditures 614.5 805.0 838.4 699.0 617.5Long Term Debt 2,349.6 2,347.9 1,186.5 844.5 1,132.2
Shareholders’ Equity 3,503.0 3,792.6 3,919.2 3,613.7 3,522.3
Other InformationShareholders of Record 28,778 28,163 28,348 29,198 30,432Price Range of Common Stock:*
High $ 315/8 $ 663/4 $ 763/4 $ 711/4 $ 53Low 15.60 251/2 457/8 491/4 411/2
Average Number of Associates 106,724 100,649 96,950 95,472 91,310
During 2000, the Company changed its inventory costing method from LIFO to FIFO. Prior periods have been restated. Refer to Note 7.During 2000, the Company began reporting expenses for transportation of products to customers as Cost of Goods Sold. Prior periods have been restated. Referto Note 1.2000 included a net after-tax charge of $96.9 million or $.61 per share for rationalizations and asset sales.1999 included a net after-tax benefit of $22.3 million or $.13 per share for rationalizations and asset sales.1998 included a net after-tax gain totaling $61.3 million or $.38 per share from rationalizations, the sale of the Oil Transportation business segment and other asset sales.1997 included an after-tax charge of $176.3 million or $1.12 per share for rationalizations.1996 included a net after-tax charge of $573.0 million or $3.65 per share for the writedown of the All American Pipeline System and related assets and other rationalizations.All per share amounts are diluted.*New York Stock Exchange—Composite Transactions
COMPARISON WITH PRIOR YEARS

GOODYEAR | 61
The financial statements of The Goodyear Tire & Rubber Companyand Subsidiaries were prepared in conformity with accountingprinciples generally accepted in the United States of America.Management is responsible for selection of appropriate accountingprinciples and the objectivity and integrity of the data, estimatesand judgments that are the basis for the financial statements.
Goodyear has established and maintains a system of internalcontrols designed to provide reasonable assurance that the books and records reflect the transactions of the Company andthat its established policies and procedures are carefully followed.This system is based upon the worldwide communication andimplementation of written procedures, policies and guidelines,organizational structures that provide an appropriate division ofresponsibility, a program of internal audit and the careful selection,training and development of operating and financial management.
PricewaterhouseCoopers LLP, independent accountants,examined the financial statements and their report is presentedon this page. Their opinion is based on an examination thatprovides an independent, objective review of the way Goodyearfulfills its responsibility to publish statements that present fairlythe financial position and operating results. They obtain andmaintain an understanding of the Company’s internal accountingand reporting controls, test transactions and perform relatedauditing procedures as they consider necessary to arrive at anopinion on the fairness of the financial statements. While theindependent accountants make extensive reviews of procedures,it is neither practicable nor necessary for them to test a largeportion of the daily transactions.
The Board of Directors pursues its oversight responsibility forthe financial statements through its Audit Committee, composedof Directors who are not associates of the Company. TheCommittee meets periodically with the independent accountants,representatives of management and internal auditors to assurethat all are carrying out their responsibilities. To assure inde-pendence, PricewaterhouseCoopers LLP and the internal auditorshave full and free access to the Audit Committee, withoutCompany representatives present, to discuss the results of theirexaminations and their opinions on the adequacy of internalcontrols and the quality of financial reporting.
Samir G. GibaraChairman and Chief Executive Officer
Robert W. TiekenExecutive Vice President and Chief Financial Officer
To the Board of Directors and Shareholders of The Goodyear Tire & Rubber CompanyIn our opinion, the accompanying consolidated balance sheet andthe related consolidated statements of income, shareholders’equity and cash flows present fairly, in all material respects, thefinancial position of The Goodyear Tire & Rubber Company andSubsidiaries at December 31, 2000 and 1999, and the results oftheir operations and their cash flows for each of the three yearsin the period ended December 31, 2000, in conformity withaccounting principles generally accepted in the United States ofAmerica. These financial statements are the responsibility of theCompany’s management; our responsibility is to express anopinion on these financial statements based on our audits. Weconducted our audits of these statements in accordance withauditing standards generally accepted in the United States ofAmerica, which require that we plan and perform the audit toobtain reasonable assurance about whether the financial state-ments are free of material misstatement. An audit includesexamining, on a test basis, evidence supporting the amounts anddisclosures in the financial statements, assessing the accountingprinciples used and significant estimates made by management,and evaluating the overall financial statement presentation. Webelieve that our audits provide a reasonable basis for our opinion.
As discussed in Note 7 to the consolidated financial state-ments, the Company changed its method of accounting fordomestic inventories in 2000.
Cleveland, OhioFebruary 5, 2001
REPORT OF MANAGEMENT REPORT OF INDEPENDENT ACCOUNTANTS
GOODYEAR | 62
BOARD OF DIRECTORS
John G. Breen, 66Retired Chairman of the Board, The Sherwin-Williams Company Elected 1992 1, 2
William E. Butler, 69 Retired Chairman of the Board & ChiefExecutive Officer, Eaton CorporationElected 1995 1, 3
Thomas H. Cruikshank, 69 Retired Chairman of the Board & ChiefExecutive Officer, Halliburton CompanyElected 1986 1, 3
Katherine G. Farley, 51Senior Managing Director, Tishman Speyer Properties Inc.Elected 1998 1, 2
Edward T. Fogarty, 64Retired Chairman of the Board, President &Chief Executive Officer, Tambrands Inc.Elected 2000 3, 4
Samir G. Gibara, 61Chairman of the Board & Chief ExecutiveOfficer, The Goodyear Tire & Rubber CompanyElected 1995 4
William J. Hudson Jr., 66Retired Vice Chairman of the Board, AMP IncorporatedElected 1995 1, 2, 4
Robert J. Keegan, 53President & Chief Operating Officer, The Goodyear Tire & Rubber CompanyElected 2000
Steven A. Minter, 62 Executive Director & President, The Cleveland FoundationElected 1985 2, 3, 4
Agnar Pytte, 68 Retired President, Case Western Reserve University Elected 1988 2, 3, 4
George H. Schofield, 71 Retired Chairman of the Board, Zurn Industries Inc.Elected 1991 1, 4
William C. Turner, 71 Chairman of the Board and Director, Argyle Atlantic Corporation Elected 1978 3, 4
Martin D. Walker, 68 Retired Chairman of the Board & Chief Executive Officer, M.A. Hanna CompanyElected 1997 2, 3, 4
CORPORATE OFFICERS
Samir G. Gibara, 61* Chairman of the Board & Chief Executive Officer34 years of service, officer since 1992
Robert J. Keegan, 53*President & Chief Operating OfficerSix months of service, officer since 2000
Robert W. Tieken, 61 Executive Vice President & Chief Financial OfficerSeven years of service, officer since 1994
SENIOR VICE PRESIDENTS
Vernon L. Dunckel, 62Global Product Supply39 years of service, officer since 1999
W. James Fish, 57Global Human ResourcesOne year of service, officer since 2000
Joseph M. Gingo, 56Technology & Global Products Planning34 years of service, officer since 1996
C. Thomas Harvie, 57General Counsel & SecretarySix years of service, officer since 1995
John P. Perduyn, 61 Global Communications 35 years of service, officer since 1989
Clark E. Sprang, 58 Business Development & Integration34 years of service, officer since 1996
VICE PRESIDENTS
Eric A. Berg, 38Information Technology & Chief Information OfficerOne year of service, officer since 2000
Stephanie W. Bergeron, 47TreasurerTwo years of service, officer since 1999
Donald D. Harper, 54Human Resources Planning, Development & Change32 years of service, officer since 1998
William M. Hopkins, 56Global Products Marketing & Technology Planning33 years of service, officer since 1998
Richard J. Kramer, 37Corporate FinanceOne year of service, officer since 2000
Gary A. Miller, 54Purchasing 33 years of service, officer since 1992
Bertram B. Bell, 49Assistant Secretary & Associate General Counsel18 years of service, officer since 2000
Patricia A. Kemph, 60Assistant Secretary36 years of service, officer since 1984
Anthony E. Miller, 49Assistant Secretary & Associate General Counsel14 years of service, officer since 2000
BUSINESS OFFICERS
Chris W. Clark, 49President, Latin America Region27 years of service, officer since 2000
Ottavio J. Mallamaci, 58President, Engineered Products31 years of service, officer since 2000
Hugh D. Pace, 48President, Asia Region25 years of service, officer since 1998
John C. Polhemus, 56President, North American Tire31 years of service, officer since 1996
Michael J. Roney, 46President, Eastern Europe, Africa & Middle East Region19 years of service, officer since 1999
Tim R. Toppen, 45President, Chemical Division22 years of service, officer since 2000
Sylvain G. Valensi, 58President, European Union Region35 years of service, officer since 1996
John W. Richardson, 55Vice President, Finance, North American Tire33 years of service, officer since 1996
BOARD OF DIRECTORS AND OFFICERS
1 Audit Committee 2 Compensation Committee 3 Committee on Corporate Responsibility 4 Nominating and Board Governance Committee
* Also a director

GOODYEAR | 63
Chile Santiago: Tires, batteries, conveyor belts,
hose products
ColombiaCali: Tires
Guatemala Guatemala City: Tires
PeruLima: Tires
Venezuela Tinaquillo: Hose products, power transmission
beltsValencia: Tires
ASIAChinaDalian: TiresQingdao: Hose products
IndiaAurangabad: TiresBallabgarh: Tires
IndonesiaAek Tarum Estate: Rubber plantation
operationsBogor: TiresDolok Merangir Estate: Rubber plantation
operations
JapanTatsuno: Tires
MalaysiaKuala Lumpur: Tires
New ZealandUpper Hutt: Tires*
PhilippinesLas Pinas: TiresMarikina: Tires
Singapore Singapore: Natural rubber purchasing,
testing and research laboratory
Taiwan Taipei: Tires
Thailand Bangkok: Tires
AUSTRALIAFootscray: Tires*Bayswater: Conveyor beltsSomerton: Tires*Thomastown: Tires*
*50–50 Joint Ventures
GOODYEAR WORLDWIDE
NORTH AMERICAUnited StatesAkron, Ohio: World Headquarters, technical
center, racing tires, chemicals, tire provinggrounds, global purchasing, airship opera-tions, research and development facilities
Asheboro, North Carolina: Steel tire cordBayport, Texas: ChemicalsBeaumont, Texas: Synthetic rubber,
hydrocarbon resins Cartersville, Georgia: TextilesDanville, Virginia: TiresDecatur, Alabama: TextilesFayetteville, North Carolina: TiresFreeport, Illinois: TiresGadsden, Alabama: TiresGreen, Ohio: Air springs, technical centerHannibal, Missouri: Hose productsHouston, Texas: Synthetic rubberHuntsville, Alabama: Tires, tire proving groundsLawton, Oklahoma: TiresLincoln, Nebraska: Power transmission belts,
hose products, technical centerMarysville, Ohio: Conveyor belts,
technical center Mount Pleasant, Iowa: Hose products Niagara Falls, New York: ChemicalsNorfolk, Nebraska: Hose productsRadford, Virginia: Tread rubberSt. Marys, Ohio: Molded rubber products,
military track, rubber track, technical centerSan Angelo, Texas: Tire proving groundsSocial Circle, Georgia: Tread rubberSpartanburg, South Carolina: Tread rubberSpring Hope, North Carolina: Conveyor beltsStatesville, North Carolina: Tire moldsStow, Ohio: Tire moldsSun Prairie, Wisconsin: Hose productsTonawanda, New York: TiresTopeka, Kansas: TiresTyler, Texas: TiresUnion City, Tennessee: TiresUtica, New York: TextilesWest Amherst, New York: Goodyear Dunlop
Tires North America headquarters
Canada Bowmanville, Ontario: Conveyor beltsCollingwood, Ontario: Hose productsGranby, Quebec: Hose productsMedicine Hat, Alberta: TiresNapanee, Ontario: TiresOwen Sound, Ontario: Power transmission belts Quebec City, Quebec: Molded rubber productsValleyfield, Quebec: Tires
Mexico Chihuahua: Power transmission beltsMexico City: TiresSan Luis Potosi: Air springs, hose products
EUROPE BelgiumBrussels: Goodyear Dunlop Tires
Europe headquarters
France Amiens: Tires (2 plants)Le Havre: Chemicals Mireval: Tire proving grounds Montlucon: Tires, air springsOrsay: Chemical applications development,
customer service lab
GermanyFulda: TiresFuerstenwalde: TiresHanau: TiresPhilippsburg: TiresRiesa: TiresWittlich: Tires, tire proving grounds
LuxembourgColmar-Berg: Tires, textiles, steel tire cord,
tire molds, technical center, tire provinggrounds
PolandDebica: Tires, tubes
SloveniaKranj: Tires, power transmission belts,
air springs
Turkey Adapazari: TiresIzmit: Tires
United Kingdom Birmingham: Racing tiresWashington: TiresWolverhampton: Tires
AFRICAMorocco Casablanca: Tires
South AfricaUitenhage: Tires, conveyor belts,
power transmission belts
SOUTH AMERICABrazil Americana: Tires, textile preparation, filmsMaua: Air springsOsasco: Hose productsSanta Barbara: Tread rubberSao Paulo: Tires, tire molds, conveyor belts,
power transmission belts, hose products

GOODYEAR | 64
SHAREHOLDER INFORMATION
Corporate OfficesThe Goodyear Tire & Rubber Company1144 East Market StreetAkron, Ohio 44316-0001(330) 796-2121www.goodyear.com
Goodyear Common StockThe principal market for Goodyear common stock is the NewYork Stock Exchange (symbol GT). The stock is also listed onthe Chicago Stock Exchange and The Pacific Exchange.
On February 15, 2001, there were 28,604 shareholders ofrecord of Goodyear common stock. The closing price ofGoodyear common stock on the NYSE composite transactionstape on February 15, 2001, was $25.24.
Annual Meeting10 a.m., Monday, April 2, 2001, at the Corporate Offices.
Shareholder InquiriesTransfer Agent and Registrar:
First Chicago Trust Company, a division of EquiServeP.O. Box 2500Jersey City, NJ 07303-2500(800) 317-4445www.equiserve.com
Inquiries concerning the issuance or transfer of stockcertificates, the status of dividend checks or share accountinformation should be directed to First Chicago TrustCompany. Provide Social Security number, account numberand Goodyear’s ID number, 5721.
Hearing impaired shareholders can communicate directly with First Chicago via a TDD by calling (201) 222-4955.Other shareholder inquiries should be directed to:
Investor RelationsThe Goodyear Tire & Rubber Company1144 East Market StreetAkron, Ohio 44316-0001(330) 796-8576E-mail: [email protected]
PublicationsThe Company’s Form 10-K Annual Report to the Securitiesand Exchange Commission for 2000 will be available inMarch. The Form 10-Q Quarterly Reports to the Securities and Exchange Commission during 2001 will be available inMay, August and November.
Copies of any of the above or the Company’s Proxy Statementmay be obtained without charge by writing:
Investor RelationsThe Goodyear Tire & Rubber Company1144 East Market StreetAkron, Ohio 44316-0001
or by calling our Financial Report Distribution Center at: (515) 263-6408
Cassette RecordingAn audio cassette recording of the 2000 Annual Report isavailable for visually impaired shareholders by contactingGoodyear Investor Relations at (330) 796-7142.
DirectSERVICE™ Investment ProgramFirst Chicago Trust Company sponsors and administers aDirectSERVICE Investment Program for current shareholdersand new investors in Goodyear common stock. The programoffers automatic dividend reinvestment and a variety of other services. A brochure explaining the program may beobtained by contacting:
The DirectSERVICE Investment Program—For Goodyear ShareholdersFirst Chicago Trust Company, a division of EquiServeP. O. Box 2598Jersey City, NJ 07303-2598(800) 317-4445
Independent AuditorsPricewaterhouseCoopers LLPBP Tower200 Public Square, 27th FloorCleveland, Ohio 44114-2301
Environmental ReportA report pertaining to Goodyear’s environmental policies and activities may be obtained by contacting GoodyearCorporate Environmental Engineering at (330) 796-7377.

About the CoverWhether their age is 55, 25, or even 5,drivers around the world feel secure inknowing that the “Goodyear” on the side-wall means they are riding on the mostdurable, best-performing tires availablefor their pickup, sport utility vehicle,minivan, sedan or sports car.
The children are Kimberly Buchanan and DerekMiller. Their parents’ tires are Goodyear EagleGA, Goodyear Wrangler HT and GoodyearAquatred 3.
About the ChildrenThe children appearing on the front coverand on pages 2, 4, 6, 9, 10 and 13 of thisannual report are all family members ofGoodyear associates. Like many youth,their lives are filled with varied activities,most of which require transportation.Whether the destination is a football game,soccer practice, a dance recital or homefrom school, they travel on Goodyear tires.
About GoodyearGoodyear is the world’s largest tire company. Together with its U.S. and international sub-sidiaries and joint ventures, Goodyear manufactures and markets tires for most applications.It also manufactures and sells several lines of power transmission belts, hose and otherrubber products for the transportation industry and various industrial and consumer mar-kets, as well as rubber-related chemicals for various applications. Goodyear is the world’slargest operator of commercial truck service and tire retreading centers. In addition, itoperates more than 2,000 tire and auto service center outlets. Goodyear manufactures itsproducts in 96 facilities in 28 countries. It has sales and marketing operations in almostevery country around the world.
Financial Highlights 1
To Our Shareholders 2
Goodyear Quality Commitment 7
Innovation for Consumers 11
Financial Contents 15
Management’s Discussion and Analysis 16
Consolidated Financial Statements 32
Notes to Financial Statements 36
Supplementary Data 59
Comparison with Prior Years 60
Report of Management 61
Report of Independent Accountants 61
Board of Directors and Officers 62
Goodyear Worldwide 63
Shareholder Information 64
Trademarks or service marks owned by or licensed toThe Goodyear Tire & Rubber Company or its subsidiariesmentioned in this report include: ,Goodyear, Dunlop, Kelly, Lee, Debica, Fulda, Pneumant,Sava, Wingfoot, Aquatred, Club by Goodyear, Eagle,Eagle NCT5, Eagle Ventura, Gemini, Hi-Q, NavigatorPlatinum TE, Next-Tred, Radial Rover, Regatta, Safari,SP 40 A/S, SP Sport 3000A, Sport 9000, TensionRite,Tiempo, Truckwise, Unisteel and Wrangler.
This report is printed on recycled paper.
Writ
ing
and
phot
ogra
phy:
Goo
dyea
r Gl
obal
Com
mun
icat
ions
Desi
gn:
Brad
ley
Brow
n De
sign
Gro
up,
Inc.
Prin
ting
: Ho
echs
tett
er P
rinting
The Goodyear Tire & Rubber Company1144 East Market StreetAkron, Ohio 44316-0001www.goodyear.com

700-862-928-67300
A K R O N , O H I O
W W W . G O O D Y E A R . C O M
PRESSURE ALIGNMENT ROTATION TREAD
Pressure — It is important to have the proper air pressure in your tires,as underinflation is the leading cause of tire failure. It results in tirestress and irregular wear.
The correct amount of air for your tires is specified by the vehiclemanufacturer and shown on the vehicle door edge, door post, glovebox door or fuel door. It is also listed in the owner’s manual.
Check your tires’ air pressure at least once a month. This should bedone when your tires have not been driven a distance and are still cold.
Alignment — Misalignment of wheels on the front or rear of your vehi-cle can be caused by hitting a curb or pothole. It can result in unevenand rapid treadwear.
Have your vehicle’s alignment checked periodically as specified inthe owner’s manual or whenever you have an indication of trouble suchas pulling or vibration.
Also, have your tire balance checked periodically. An unbalanced tireand wheel assembly may result in irregular wear.
Rotation — Sometimes irregular tire wear can be corrected by rotatingyour tires. Consult your vehicle’s owner’s manual, the tire manufactureror your tire retailer for the appropriate rotation pattern for your vehicle.
If your tires show uneven wear, ask your tire retailer to check for andcorrect any misalignment, imbalance or other mechanical probleminvolved before rotation.
Tires should be rotated at least every 6,000 miles.
Tread — Tires must be replaced when the tread is worn down to one-sixteenth of an inch in order to prevent skidding and hydroplaning.When built-in treadwear indicators – which look like narrow strips ofsmooth rubber across the tread – appear, the tread is worn out andshould be replaced.
More Information — For more information about tire safety, visit theRubber Manufacturers Association’s Web site at www.rma.org/tiresafetyor Goodyear’s at www.goodyear.com/us/tire_school.
2000 ANNUAL REPORT
THE GOODYEAR TIRE & RU
BBER COMPAN
Y2000 ANNUAL REPORT