good schools make good neighbors: human capital...
TRANSCRIPT

Good SchoolsMake GoodNeighbors:
Human CapitalSpillovers in Early
20th CenturyAgriculture
John Parman
Introduction
Human Capitaland Agriculture
Iowa’s Farms andSchools
Data
Results
Private Returns
Spillovers
Spillovers and SocialNetworks
Conclusions
Good Schools Make Good Neighbors:Human Capital Spillovers in Early 20th
Century Agriculture
John Parman
February 23, 2010
Good SchoolsMake GoodNeighbors:
Human CapitalSpillovers in Early
20th CenturyAgriculture
John Parman
Introduction
Human Capitaland Agriculture
Iowa’s Farms andSchools
Data
Results
Private Returns
Spillovers
Spillovers and SocialNetworks
Conclusions
Brief Overview
Public school expansion in the American Midwestoccurred at a time when human capital was becomingincreasingly important in agriculture.
The public school system in Iowa developed with afocus on improving agricultural productivity.
Estimates of the private returns to education for farmerssuggest that Iowa achieved this goal; an additional yearof high school increased a farmer’s earnings by 5%.
A farmer’s education also benefited his neighbors; anincrease in the mean education level of his neighbors byone year increased a farmer’s annual earnings by roughly3%.
The size of these spillovers depended on social groupmembership and a farmer’s own level of education.

Good SchoolsMake GoodNeighbors:
Human CapitalSpillovers in Early
20th CenturyAgriculture
John Parman
Introduction
Human Capitaland Agriculture
Iowa’s Farms andSchools
Data
Results
Private Returns
Spillovers
Spillovers and SocialNetworks
Conclusions
Outline of Presentation
Review of modern evidence of the role of education inagriculture
Brief history of Iowa agriculture and education
Construction of a dataset with education and incomefor farmers and their adjacent neighbors
Estimates of the private returns to education inagriculture
Estimates of human capital spillovers across farms
Estimates of human capital spillovers within and acrosssocial networks
Concluding remarks
Good SchoolsMake GoodNeighbors:
Human CapitalSpillovers in Early
20th CenturyAgriculture
John Parman
Introduction
Human Capitaland Agriculture
Iowa’s Farms andSchools
Data
Results
Private Returns
Spillovers
Spillovers and SocialNetworks
Conclusions
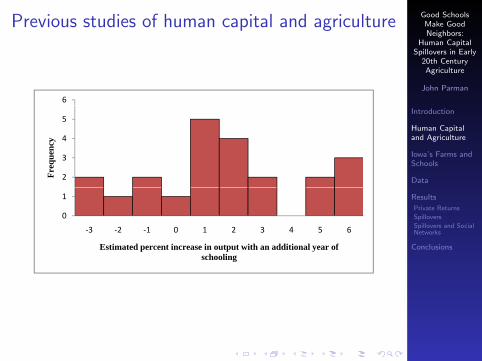
Previous studies of human capital and agriculture
6
2
3
4
5
Freq
uenc
y
0
1
‐3 ‐2 ‐1 0 1 2 3 4 5 6
Estimated percent increase in output with an additional year of schooling
Good SchoolsMake GoodNeighbors:
Human CapitalSpillovers in Early
20th CenturyAgriculture
John Parman
Introduction
Human Capitaland Agriculture
Iowa’s Farms andSchools
Data
Results
Private Returns
Spillovers
Spillovers and SocialNetworks
Conclusions
Previous studies of human capital and agriculture
The empirical evidence of the returns to education inagriculture is very mixed.
In very stable environments, the returns to formalschooling are small.
In these environments, experience appears moreeffective than schooling for improving productivity.
Schooling is more important in dynamic settings:educated farmers are more likely to seek outinformation, experiment with and adopt newtechnologies and adapt to changing market conditions.
Good SchoolsMake GoodNeighbors:
Human CapitalSpillovers in Early
20th CenturyAgriculture
John Parman
Introduction
Human Capitaland Agriculture
Iowa’s Farms andSchools
Data
Results
Private Returns
Spillovers
Spillovers and SocialNetworks
Conclusions
Previous studies of human capital and agriculture
There is a small body of evidence suggesting thatdiffusion of information through social networks isimportant:
Bandiera & Rasul (2006): adoption of new cropsdepends on decisions of family and friendsConley & Udrey (2001): farmers learn fromexperimentation of members of their social networkFoster & Rosenzweig (1995): farmers learn how tosuccessfully adopt new seed varieties from neighbors’experimentationRyan & Gross (1943): hybrid seed corn diffusion in Iowabased largely on neighbors talking to each other
As with the formal schooling, these social networks willbe more important when the agricultural sector is moredynamic.
Good SchoolsMake GoodNeighbors:
Human CapitalSpillovers in Early
20th CenturyAgriculture
John Parman
Introduction
Human Capitaland Agriculture
Iowa’s Farms andSchools
Data
Results
Private Returns
Spillovers
Spillovers and SocialNetworks
Conclusions
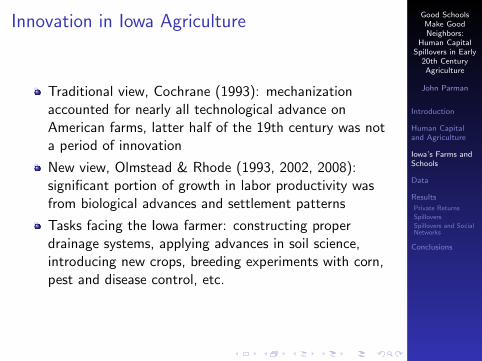
Innovation in Iowa Agriculture
Traditional view, Cochrane (1993): mechanizationaccounted for nearly all technological advance onAmerican farms, latter half of the 19th century was nota period of innovation
New view, Olmstead & Rhode (1993, 2002, 2008):significant portion of growth in labor productivity wasfrom biological advances and settlement patterns
Tasks facing the Iowa farmer: constructing properdrainage systems, applying advances in soil science,introducing new crops, breeding experiments with corn,pest and disease control, etc.
Good SchoolsMake GoodNeighbors:
Human CapitalSpillovers in Early
20th CenturyAgriculture
John Parman
Introduction
Human Capitaland Agriculture
Iowa’s Farms andSchools
Data
Results
Private Returns
Spillovers
Spillovers and SocialNetworks
Conclusions
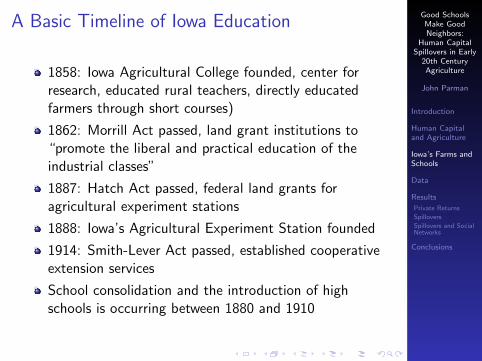
A Basic Timeline of Iowa Education
1858: Iowa Agricultural College founded, center forresearch, educated rural teachers, directly educatedfarmers through short courses)
1862: Morrill Act passed, land grant institutions to“promote the liberal and practical education of theindustrial classes”
1887: Hatch Act passed, federal land grants foragricultural experiment stations
1888: Iowa’s Agricultural Experiment Station founded
1914: Smith-Lever Act passed, established cooperativeextension services
School consolidation and the introduction of highschools is occurring between 1880 and 1910
Good SchoolsMake GoodNeighbors:
Human CapitalSpillovers in Early
20th CenturyAgriculture
John Parman
Introduction
Human Capitaland Agriculture
Iowa’s Farms andSchools
Data
Results
Private Returns
Spillovers
Spillovers and SocialNetworks
Conclusions
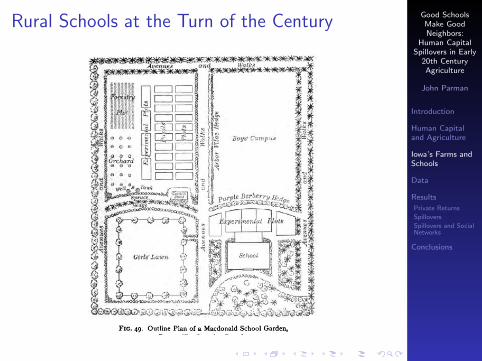
Rural Schools at the Turn of the Century

Good SchoolsMake GoodNeighbors:
Human CapitalSpillovers in Early
20th CenturyAgriculture
John Parman
Introduction
Human Capitaland Agriculture
Iowa’s Farms andSchools
Data
Results
Private Returns
Spillovers
Spillovers and SocialNetworks
Conclusions
Experimental Plots
Excerpt from a 1903 study guide for school garden work:
Experimental Work1. Plant potatoes at different depths, from justunder the surface to four inches. Which methodgives best results?2. Use seed pieces of varying sizes, from those withno eye up to the whole potato.3. Any difference in value of cutting from stem tostem end and bud end?4. Which is better, one large piece or several smallones?5. What is the order of sprouting of the eyes?6. How [to best] prevent potato scab?
Good SchoolsMake GoodNeighbors:
Human CapitalSpillovers in Early
20th CenturyAgriculture
John Parman
Introduction
Human Capitaland Agriculture
Iowa’s Farms andSchools
Data
Results
Private Returns
Spillovers
Spillovers and SocialNetworks
Conclusions
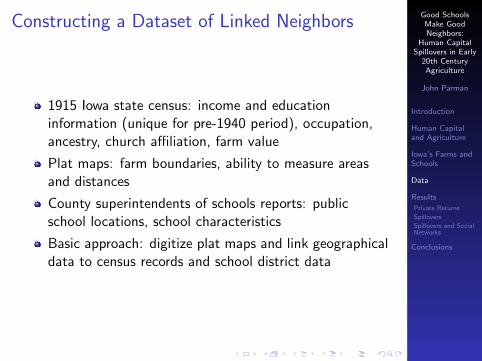
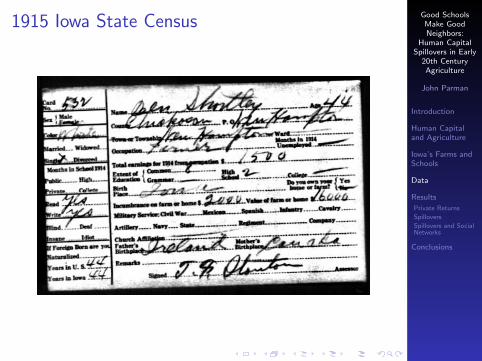
Constructing a Dataset of Linked Neighbors
1915 Iowa state census: income and educationinformation (unique for pre-1940 period), occupation,ancestry, church affiliation, farm value
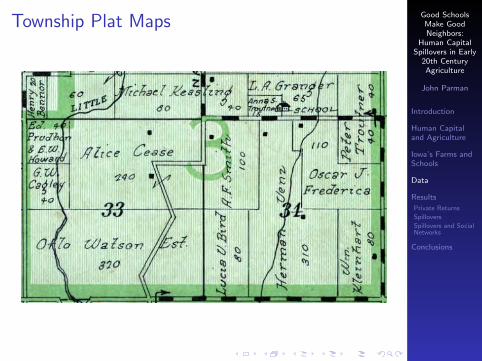
Plat maps: farm boundaries, ability to measure areasand distances
County superintendents of schools reports: publicschool locations, school characteristics
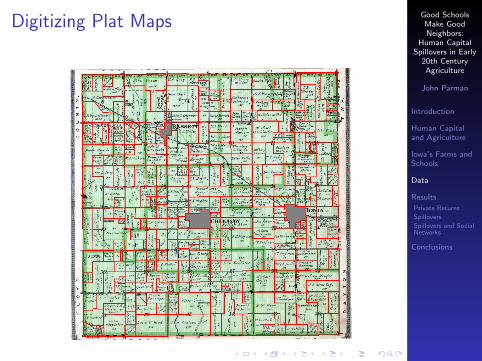
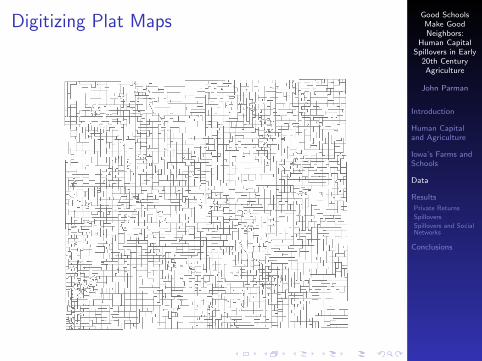
Basic approach: digitize plat maps and link geographicaldata to census records and school district data
Good SchoolsMake GoodNeighbors:
Human CapitalSpillovers in Early
20th CenturyAgriculture
John Parman
Introduction
Human Capitaland Agriculture
Iowa’s Farms andSchools
Data
Results
Private Returns
Spillovers
Spillovers and SocialNetworks
Conclusions
1915 Iowa State Census

Good SchoolsMake GoodNeighbors:
Human CapitalSpillovers in Early
20th CenturyAgriculture
John Parman
Introduction
Human Capitaland Agriculture
Iowa’s Farms andSchools
Data
Results
Private Returns
Spillovers
Spillovers and SocialNetworks
Conclusions
Township Plat Maps
Good SchoolsMake GoodNeighbors:
Human CapitalSpillovers in Early
20th CenturyAgriculture
John Parman
Introduction
Human Capitaland Agriculture
Iowa’s Farms andSchools
Data
Results
Private Returns
Spillovers
Spillovers and SocialNetworks
Conclusions
Township Plat Maps

Good SchoolsMake GoodNeighbors:
Human CapitalSpillovers in Early
20th CenturyAgriculture
John Parman
Introduction
Human Capitaland Agriculture
Iowa’s Farms andSchools
Data
Results
Private Returns
Spillovers
Spillovers and SocialNetworks
Conclusions
Digitizing Plat Maps
Good SchoolsMake GoodNeighbors:
Human CapitalSpillovers in Early
20th CenturyAgriculture
John Parman
Introduction
Human Capitaland Agriculture
Iowa’s Farms andSchools
Data
Results
Private Returns
Spillovers
Spillovers and SocialNetworks
Conclusions
Digitizing Plat Maps
Good SchoolsMake GoodNeighbors:
Human CapitalSpillovers in Early
20th CenturyAgriculture
John Parman
Introduction
Human Capitaland Agriculture
Iowa’s Farms andSchools
Data
Results
Private Returns
Spillovers
Spillovers and SocialNetworks
Conclusions
Digitizing Plat Maps
Good SchoolsMake GoodNeighbors:
Human CapitalSpillovers in Early
20th CenturyAgriculture
John Parman
Introduction
Human Capitaland Agriculture
Iowa’s Farms andSchools
Data
Results
Private Returns
Spillovers
Spillovers and SocialNetworks
Conclusions
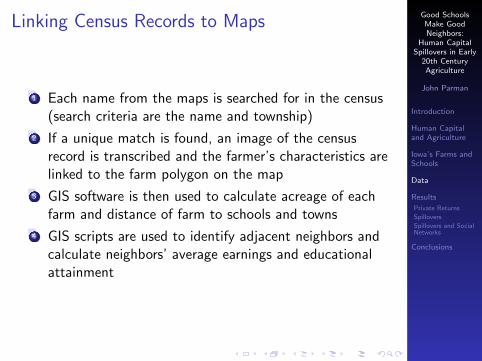
Linking Census Records to Maps
1 Each name from the maps is searched for in the census(search criteria are the name and township)
2 If a unique match is found, an image of the censusrecord is transcribed and the farmer’s characteristics arelinked to the farm polygon on the map
3 GIS software is then used to calculate acreage of eachfarm and distance of farm to schools and towns
4 GIS scripts are used to identify adjacent neighbors andcalculate neighbors’ average earnings and educationalattainment
Good SchoolsMake GoodNeighbors:
Human CapitalSpillovers in Early
20th CenturyAgriculture
John Parman
Introduction
Human Capitaland Agriculture
Iowa’s Farms andSchools
Data
Results
Private Returns
Spillovers
Spillovers and SocialNetworks
Conclusions
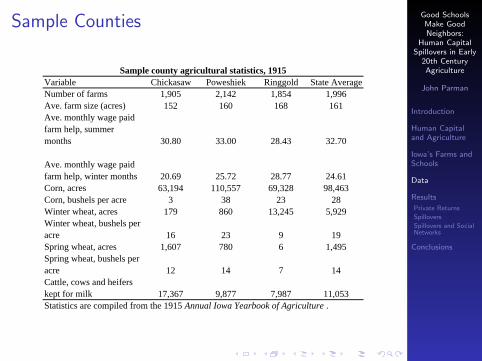
Sample Counties
Variable Chickasaw Poweshiek Ringgold State AverageNumber of farms 1,905 2,142 1,854 1,996Ave. farm size (acres) 152 160 168 161Ave. monthly wage paid farm help, summer months 30.80 33.00 28.43 32.70
Ave. monthly wage paid farm help, winter months 20.69 25.72 28.77 24.61Corn, acres 63,194 110,557 69,328 98,463Corn, bushels per acre 3 38 23 28Winter wheat, acres 179 860 13,245 5,929Winter wheat, bushels per acre 16 23 9 19Spring wheat, acres 1,607 780 6 1,495Spring wheat, bushels per acre 12 14 7 14Cattle, cows and heifers kept for milk 17,367 9,877 7,987 11,053Statistics are compiled from the 1915 Annual Iowa Yearbook of Agriculture .
Sample county agricultural statistics, 1915

Good SchoolsMake GoodNeighbors:
Human CapitalSpillovers in Early
20th CenturyAgriculture
John Parman
Introduction
Human Capitaland Agriculture
Iowa’s Farms andSchools
Data
Results
Private Returns
Spillovers
Spillovers and SocialNetworks
Conclusions
Farmer Characteristics
Variable MeanStandard Deviation
Age 46.70 11.68Annual earnings 1199.62 1175.47Farm value 17439.32 13079.76Incumbrance on farm 3357.70 5399.68Farm acreage 153.03 106.92Earnings per acre 9.80 10.77Farm value per acre 126.08 90.98Distance to nearest town (miles) 2.25 1.52Distance to nearest high school (miles) 6.51 3.28Foreign born (yes=1) 0.14 0.35Number of neighbors 7.84 3.26Number of observationsNotes: All dollar values are in 1915 dollars. Total schooling is defined as the sum of years of common school, grammar school, high school and college.
Farm owner characteristics, 1915
2410

Good SchoolsMake GoodNeighbors:
Human CapitalSpillovers in Early
20th CenturyAgriculture
John Parman
Introduction
Human Capitaland Agriculture
Iowa’s Farms andSchools
Data
Results
Private Returns
Spillovers
Spillovers and SocialNetworks
Conclusions
Farmers’ Educational Attainment
Variable MeanStandard Deviation
Total schooling 8.43 2.65Common school 7.91 2.65Grammar school 0.23 1.26High school 0.19 0.72College 0.10 0.54Total schooling in Iowa 5.77 4.46Total schooling in US 6.30 4.31Total schooling outside US 2.13 3.51Graded schooling 0.52 1.80Graded schooling in Iowa 0.41 1.53Graded schooling in US 0.44 1.63Graded schooling outside US 0.08 0.72Notes: Total schooling includes years of common school, grammar school, high school and college. Graded schooling includes years of grammar school, high school and college only.
Educational attainment of farm owners, 1915
Good SchoolsMake GoodNeighbors:
Human CapitalSpillovers in Early
20th CenturyAgriculture
John Parman
Introduction
Human Capitaland Agriculture
Iowa’s Farms andSchools
Data
Results
Private Returns
Spillovers
Spillovers and SocialNetworks
Conclusions
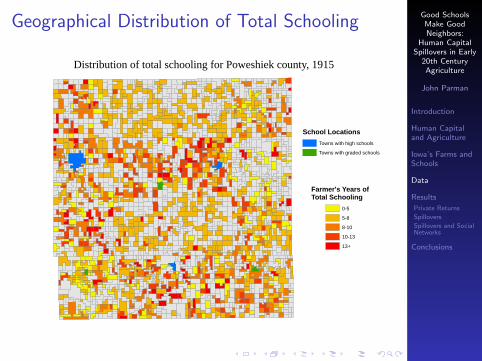
Geographical Distribution of Total Schooling
Distribution of total schooling for Poweshiek county, 1915
Farmer's Years ofTotal Schooling
0-5
5-8
8-10
10-13
13+
School LocationsTowns with high schools
Towns with graded schools
Good SchoolsMake GoodNeighbors:
Human CapitalSpillovers in Early
20th CenturyAgriculture
John Parman
Introduction
Human Capitaland Agriculture
Iowa’s Farms andSchools
Data
Results
Private Returns
Spillovers
Spillovers and SocialNetworks
Conclusions
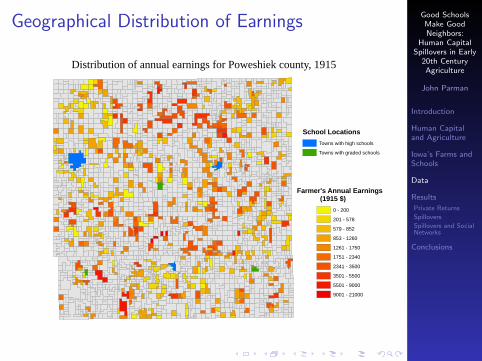
Geographical Distribution of Earnings
Distribution of annual earnings for Poweshiek county, 1915
Farmer's Annual Earnings (1915 $)
0 - 200
201 - 578
579 - 852
853 - 1260
1261 - 1750
1751 - 2340
2341 - 3500
3501 - 5500
5501 - 9000
9001 - 21000
School LocationsTowns with high schools
Towns with graded schools
Good SchoolsMake GoodNeighbors:
Human CapitalSpillovers in Early
20th CenturyAgriculture
John Parman
Introduction
Human Capitaland Agriculture
Iowa’s Farms andSchools
Data
Results
Private Returns
Spillovers
Spillovers and SocialNetworks
Conclusions
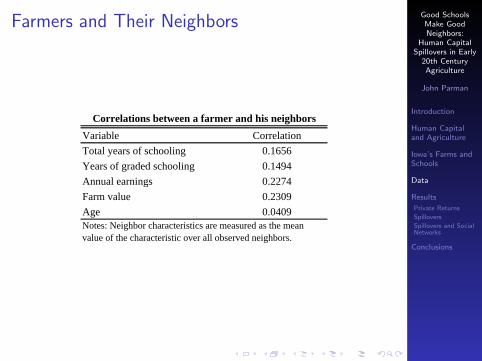
Farmers and Their Neighbors
Variable CorrelationTotal years of schooling 0.1656Years of graded schooling 0.1494Annual earnings 0.2274Farm value 0.2309Age 0.0409Notes: Neighbor characteristics are measured as the mean value of the characteristic over all observed neighbors.
Correlations between a farmer and his neighbors

Good SchoolsMake GoodNeighbors:
Human CapitalSpillovers in Early
20th CenturyAgriculture
John Parman
Introduction
Human Capitaland Agriculture
Iowa’s Farms andSchools
Data
Results
Private Returns
Spillovers
Spillovers and SocialNetworks
Conclusions
Estimating the Returns to Education
Standard Mincer regression to estimate private returnsto education
Education measures: total schooling, schooling by type,schooling by location received
Personal characteristics: nativity, years in the US, age,township dummies, religion dummies, land quality(proxied by land value per acre)
Spillovers are estimated by including a measure ofneighbors’ education
Several measures of neighbors’ education are used(mean years of schooling, mean years of high school,maximum years of schooling, etc.)
Distinguish between neighbors who are within andoutside of a farmer’s social network (defined by religion,ancestry and birth cohort)
Good SchoolsMake GoodNeighbors:
Human CapitalSpillovers in Early
20th CenturyAgriculture
John Parman
Introduction
Human Capitaland Agriculture
Iowa’s Farms andSchools
Data
Results
Private Returns
Spillovers
Spillovers and SocialNetworks
Conclusions
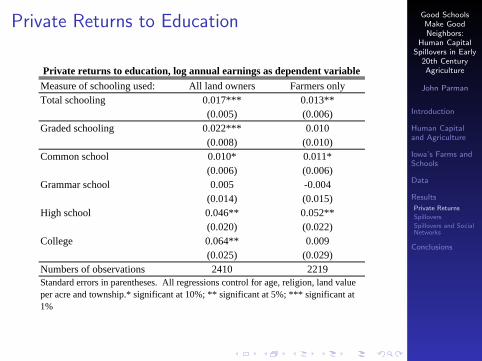
Private Returns to Education
Measure of schooling used: All land owners Farmers onlyTotal schooling 0.017*** 0.013**
(0.005) (0.006)Graded schooling 0.022*** 0.010
(0.008) (0.010)Common school 0.010* 0.011*
(0.006) (0.006)Grammar school 0.005 -0.004
(0.014) (0.015)High school 0.046** 0.052**
(0.020) (0.022)College 0.064** 0.009
(0.025) (0.029)Numbers of observations 2410 2219Standard errors in parentheses. All regressions control for age, religion, land value per acre and township.* significant at 10%; ** significant at 5%; *** significant at 1%
Private returns to education, log annual earnings as dependent variable
Good SchoolsMake GoodNeighbors:
Human CapitalSpillovers in Early
20th CenturyAgriculture
John Parman
Introduction
Human Capitaland Agriculture
Iowa’s Farms andSchools
Data
Results
Private Returns
Spillovers
Spillovers and SocialNetworks
Conclusions
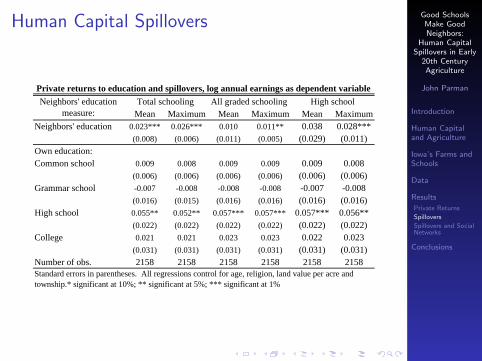
Human Capital Spillovers
Mean Maximum Mean Maximum Mean MaximumNeighbors' education 0.023*** 0.026*** 0.010 0.011** 0.038 0.028***
(0.008) (0.006) (0.011) (0.005) (0.029) (0.011)Own education:Common school 0.009 0.008 0.009 0.009 0.009 0.008
(0.006) (0.006) (0.006) (0.006) (0.006) (0.006)Grammar school -0.007 -0.008 -0.008 -0.008 -0.007 -0.008
(0.016) (0.015) (0.016) (0.016) (0.016) (0.016)High school 0.055** 0.052** 0.057*** 0.057*** 0.057*** 0.056**
(0.022) (0.022) (0.022) (0.022) (0.022) (0.022)College 0.021 0.021 0.023 0.023 0.022 0.023
(0.031) (0.031) (0.031) (0.031) (0.031) (0.031)Number of obs. 2158 2158 2158 2158 2158 2158Standard errors in parentheses. All regressions control for age, religion, land value per acre and township.* significant at 10%; ** significant at 5%; *** significant at 1%
Private returns to education and spillovers, log annual earnings as dependent variableNeighbors' education
measure:Total schooling All graded schooling High school
Good SchoolsMake GoodNeighbors:
Human CapitalSpillovers in Early
20th CenturyAgriculture
John Parman
Introduction
Human Capitaland Agriculture
Iowa’s Farms andSchools
Data
Results
Private Returns
Spillovers
Spillovers and SocialNetworks
Conclusions
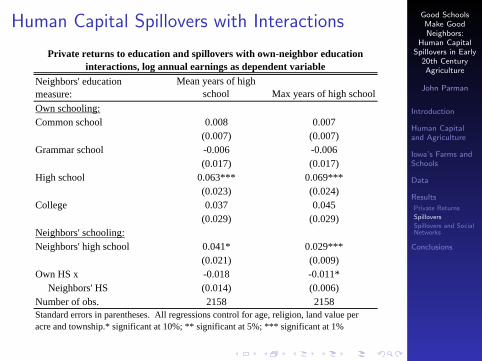
Human Capital Spillovers with Interactions
Neighbors' education measure:
Mean years of high school Max years of high school
Own schooling:Common school 0.008 0.007
(0.007) (0.007)Grammar school -0.006 -0.006
(0.017) (0.017)High school 0.063*** 0.069***
(0.023) (0.024)College 0.037 0.045
(0.029) (0.029)Neighbors' schooling:Neighbors' high school 0.041* 0.029***
(0.021) (0.009)Own HS x -0.018 -0.011* Neighbors' HS (0.014) (0.006)Number of obs. 2158 2158
Private returns to education and spillovers with own-neighbor education interactions, log annual earnings as dependent variable
Standard errors in parentheses. All regressions control for age, religion, land value per acre and township.* significant at 10%; ** significant at 5%; *** significant at 1%
Good SchoolsMake GoodNeighbors:
Human CapitalSpillovers in Early
20th CenturyAgriculture
John Parman
Introduction
Human Capitaland Agriculture
Iowa’s Farms andSchools
Data
Results
Private Returns
Spillovers
Spillovers and SocialNetworks
Conclusions
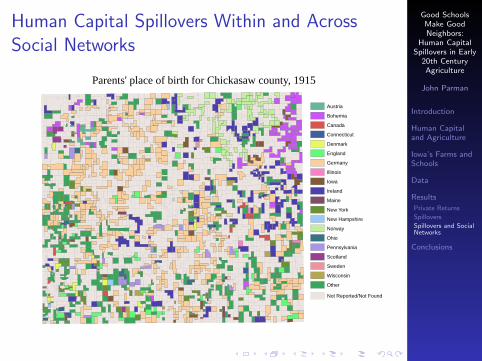
Human Capital Spillovers Within and AcrossSocial Networks
Parents' place of birth for Chickasaw county, 1915
Austria
Bohemia
Canada
Connecticut
Denmark
England
Germany
Illinois
Iowa
Ireland
Maine
New York
New Hampshire
Norway
Ohio
Pennsylvania
Scotland
Sweden
Wisconsin
Other
Not Reported/Not Found
Good SchoolsMake GoodNeighbors:
Human CapitalSpillovers in Early
20th CenturyAgriculture
John Parman
Introduction
Human Capitaland Agriculture
Iowa’s Farms andSchools
Data
Results
Private Returns
Spillovers
Spillovers and SocialNetworks
Conclusions
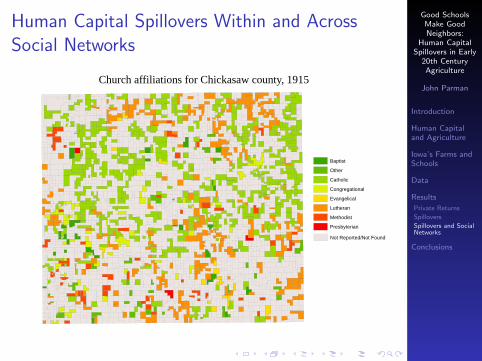
Human Capital Spillovers Within and AcrossSocial Networks
Church affiliations for Chickasaw county, 1915
Baptist
Other
Catholic
Congregational
Evangelical
Lutheran
Methodist
Presbyterian
Not Reported/Not Found

Good SchoolsMake GoodNeighbors:
Human CapitalSpillovers in Early
20th CenturyAgriculture
John Parman
Introduction
Human Capitaland Agriculture
Iowa’s Farms andSchools
Data
Results
Private Returns
Spillovers
Spillovers and SocialNetworks
Conclusions
Human Capital Spillovers Within and AcrossSocial Networks
Social group defined by: Church affiliation Parents' birthplaces Birth cohort
Percentage of neighbors that are in social group 38.80% 21.8% 17.4%
Correlation of own education with that of similar neighbors 0.258 0.299 0.131
Correlation of own education with that of dissimilar neighbors 0.125 0.155 0.057
Correlation of own years HS/college with that of similar neighbors 0.242 0.103 0.048
Correlation of own years HS/college with that of dissimilar neighbors 0.053 0.078 0.084
Correlation of own log earnings with that of similar neighbors 0.194 0.312 0.270
Correlation of own log earnings with that of dissimilar neighbors 0.254 0.248 0.207
Correlations between neighbors based on group membership

Good SchoolsMake GoodNeighbors:
Human CapitalSpillovers in Early
20th CenturyAgriculture
John Parman
Introduction
Human Capitaland Agriculture
Iowa’s Farms andSchools
Data
Results
Private Returns
Spillovers
Spillovers and SocialNetworks
Conclusions
Human Capital Spillovers Within and AcrossSocial Networks
Social group defined by:
Neighbors' education measure:Total
schoolingGraded
schoolingHigh school and college
Neighbors' education:Mean education within group 0.010** 0.027* 0.045
(0.004) (0.015) (0.035)Mean education outside group 0.012** 0.005 0.018
(0.006) (0.010) (0.018)Own education:Years of common school 0.008 0.009 0.008
(0.006) (0.006) (0.006)Years of grammar school -0.007 -0.008 -0.007
(0.014) (0.015) (0.015)Years of high school 0.053** 0.054** 0.053**
(0.026) (0.026) (0.026)Years of college 0.023 0.024 0.021
(0.033) (0.031) (0.032)Observations 2148 2148 2148Robust standard errors clustered by township in parentheses, all regressions control for age, nativity, years in the United States, religion, land value per acre and township. * significant at 10%; ** significant at 5%; *** significant at 1%
Private returns to education and spillovers by social group membership, log annual earnings as dependent variable
Parents' birthplaces

Good SchoolsMake GoodNeighbors:
Human CapitalSpillovers in Early
20th CenturyAgriculture
John Parman
Introduction
Human Capitaland Agriculture
Iowa’s Farms andSchools
Data
Results
Private Returns
Spillovers
Spillovers and SocialNetworks
Conclusions
Human Capital Spillovers Within and AcrossSocial Networks
Social group defined by:
Neighbors' education measure:Total
schoolingGraded
schoolingHigh school and college
Neighbors' education:Mean education within group 0.013*** 0.019** 0.037**
(0.003) (0.009) (0.017)Mean education outside group 0.017** 0.004 0.016
(0.007) (0.009) (0.018)Own education:Years of common school 0.008 0.008 0.008
(0.006) (0.006) (0.006)Years of grammar school -0.006 -0.009 -0.007
(0.014) (0.014) (0.014)Years of high school 0.051* 0.054** 0.052**
(0.027) (0.025) (0.026)Years of college 0.025 0.025 0.023
(0.033) (0.031) (0.032)Observations 2158 2158 2158
Private returns to education and spillovers by social group membership, log annual earnings as dependent variable
Birth cohort
Robust standard errors clustered by township in parentheses, all regressions control for age, nativity, years in the United States, religion, land value per acre and township. * significant at 10%; ** significant at 5%; *** significant at 1%
Good SchoolsMake GoodNeighbors:
Human CapitalSpillovers in Early
20th CenturyAgriculture
John Parman
Introduction
Human Capitaland Agriculture
Iowa’s Farms andSchools
Data
Results
Private Returns
Spillovers
Spillovers and SocialNetworks
Conclusions
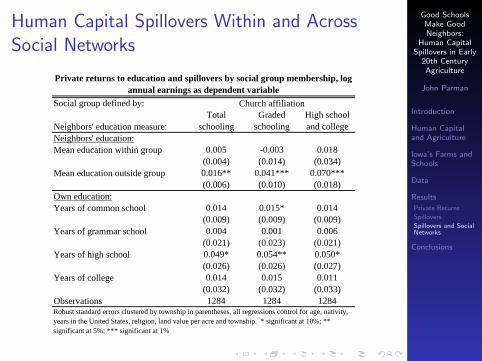
Human Capital Spillovers Within and AcrossSocial Networks
Social group defined by:
Neighbors' education measure:Total
schoolingGraded
schoolingHigh school and college
Neighbors' education:Mean education within group 0.005 -0.003 0.018
(0.004) (0.014) (0.034)Mean education outside group 0.016** 0.041*** 0.070***
(0.006) (0.010) (0.018)Own education:Years of common school 0.014 0.015* 0.014
(0.009) (0.009) (0.009)Years of grammar school 0.004 0.001 0.006
(0.021) (0.023) (0.021)Years of high school 0.049* 0.054** 0.050*
(0.026) (0.026) (0.027)Years of college 0.014 0.015 0.011
(0.032) (0.032) (0.033)Observations 1284 1284 1284
Church affiliation
Robust standard errors clustered by township in parentheses, all regressions control for age, nativity, years in the United States, religion, land value per acre and township. * significant at 10%; ** significant at 5%; *** significant at 1%
Private returns to education and spillovers by social group membership, log annual earnings as dependent variable
Good SchoolsMake GoodNeighbors:
Human CapitalSpillovers in Early
20th CenturyAgriculture
John Parman
Introduction
Human Capitaland Agriculture
Iowa’s Farms andSchools
Data
Results
Private Returns
Spillovers
Spillovers and SocialNetworks
Conclusions
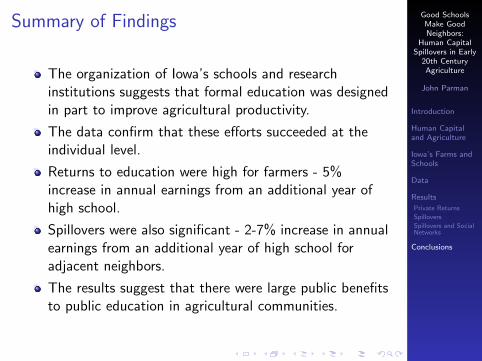
Summary of Findings
The organization of Iowa’s schools and researchinstitutions suggests that formal education was designedin part to improve agricultural productivity.
The data confirm that these efforts succeeded at theindividual level.
Returns to education were high for farmers - 5%increase in annual earnings from an additional year ofhigh school.
Spillovers were also significant - 2-7% increase in annualearnings from an additional year of high school foradjacent neighbors.
The results suggest that there were large public benefitsto public education in agricultural communities.