good practices for analyst presentation · good practices for analyst presentation ... a pyramid...
TRANSCRIPT

Good Practices for Analyst Presentation
Investor Relations Training: Intermediate Module
24 September 2013

CONTENTS
How to develop an effective presentation
Importance of analyst presentation
Four steps to best practice presentation
Tips & presentation samples
Managing analyst presentation
Analyst presentation timeline
Delivering presentation & dealing with questions
Value of feedback
1

CONTENTS
How to develop an effective presentation
Importance of analyst presentation
Four steps to best practice presentation
Tips & presentation samples
Managing analyst presentation
Analyst presentation timeline
Delivering presentation & dealing with questions
Value of feedback
2
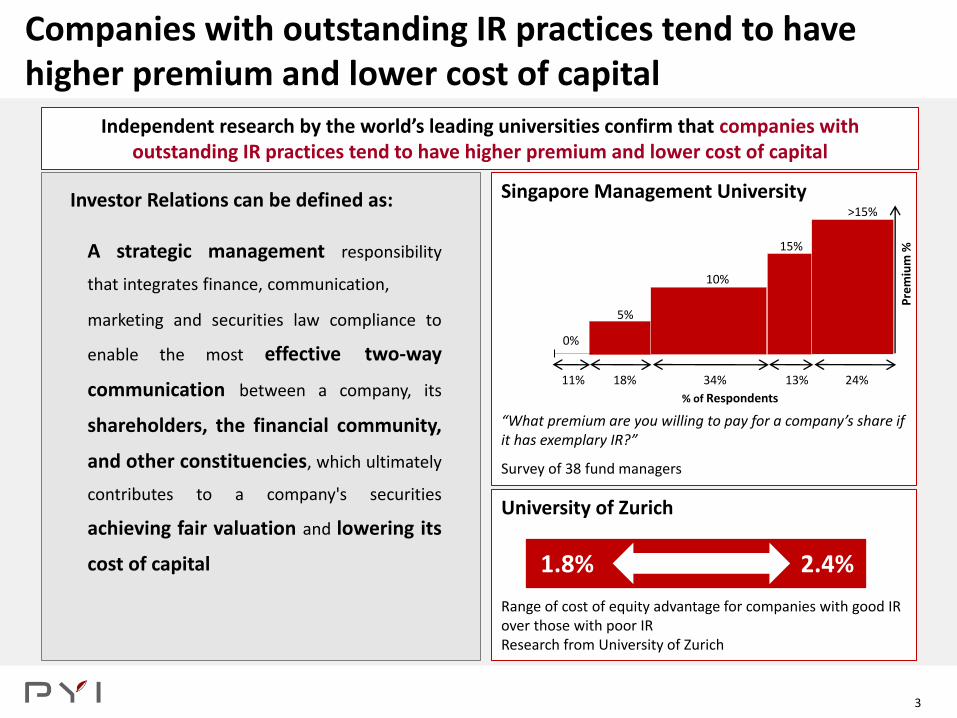
Companies with outstanding IR practices tend to have higher premium and lower cost of capital
3
Singapore Management University
“What premium are you willing to pay for a company’s share if it has exemplary IR?”
Survey of 38 fund managers
University of Zurich Range of cost of equity advantage for companies with good IR over those with poor IR Research from University of Zurich
1.8% 2.4%
11% 18% 34% 13% 24%
0%
15%
10%
>15%
5%
% of Respondents
Pre
miu
m %
Independent research by the world’s leading universities confirm that companies with outstanding IR practices tend to have higher premium and lower cost of capital
Investor Relations can be defined as:
A strategic management responsibility
that integrates finance, communication,
marketing and securities law compliance to
enable the most effective two-way
communication between a company, its
shareholders, the financial community,
and other constituencies, which ultimately
contributes to a company's securities
achieving fair valuation and lowering its
cost of capital

5
A crisp and clear investment thesis/story is important
COMPANY
Annual report
Company profile
Analyst presentation
News Release
Website
Buy-side analysts
Sell-side analysts
Equity sales
Investors
− Shareholders
− Bondholders
Creditors
The Investment Thesis
Your company’s angle; a way to differentiate between investment choices
Similar to good consumer brand management
– Clear Brand Message
– Effective Brand Methods
IR PRODUCTS INVESTMENT COMMUNITY
Product Packaging Customers

ANNUAL REPORT
The annual report is part of due diligence for most analysts before deciding to follow a stock
Most credible Most durable
Most cost effective Widest reach First point of contact Vehicle for other
communications
The IR website is the first place analysts go to get information on your company
WEBSITE
Interactive Instant feedback Best source of non-
financial information Chance to showcase
management’s experience and credibility
Management credibility ranks highest in factors considered important when making investment decisions
PRESENTATIONS
Source: Rivel Research 2008
6
Key IR communication materials

7
Presentations are crucial
Source: Ernst & Young LLP 2008 Source: Rivel Research 2010
Which sources of non-financial company information do you consider important?
(Survey of U.S. analysts and fund managers)
79%
76%
69%
68%
65%
65%
65%
65%
64%
61%
Management presentations
Public filings or reports
Sell-side analysis
Competitors
Business press
Investor relations department
Customers
Buy-side analysis
Trade press
Informal network
Analysts and fund managers rate investor presentations as their most used IR website resource
20%
20%
24%
33%
38%
72%
80%
100%
Excel spreadsheets
Charting tools
Mobile access
RSS fees
Calendar synchronization
Email news alerts
Webcasts
Presentations

Identity
Ingredients:
Industry overview
Company overview
Corporate strategies
Core products
Market-based operations
Customers
Competitive advantages /
strengths
Events:
Investment conference Non-deal roadshow Company visit
Events:
SET’s Opportunity Day Quarterly analyst meeting Full-year earning presentation
Performance Event
8
Types of presentation slides
Presentation slides
Ingredients:
Recap of major event (if any)
Operational performance
highlights
Financial performance
highlights
Analysis of the results
Outlook
Ingredients:
Executive summary
Rationale of the transaction
Transaction information
Impact
Timeline
What happened?
Impact
Solution / What’s next?
Events:
Event analyst meeting − New business − New strategic direction − Major investment − M&A or divestment − Capital increase
Deal roadshow Crisis

12
Source: Adapted from www.thebusinessofmining.com
Story & structure
Management Communication
Professional Organization
Lack of convincing storyline
Not structure and illogical
Lack of fact and/or rationale
Sections of document are not clearly linked together
No clear messages
In adequate support data
Just present fact, no “so-what??”
Not attractive & professional visual appeal
Inconsistency in terms & reference
Unclear graphs, misaligned text
Pitfalls of analyst presentation?

CONTENTS
How to develop an effective presentation
Importance of analyst presentation
Four steps to best practice presentation
Tips & presentation samples
Managing analyst presentation
Analyst presentation timeline
Delivering presentation & dealing with questions
Value of feedback
13

14
Four steps to a best practice presentation
Define your value
story/thesis
Structure
presentation
Gather
information
Develop
Presentation
Develop logical structure
Storyline & Storyboard
Company data
Industry data
Economic data
Slide types
Effectively designed visual aids
1 2 3 4
What sets your company apart?
Core skills and competitive advantages
Business strategy

15
Four steps to a best practice presentation
Define your value
story/thesis
Structure
presentation
Gather
information
Develop
Presentation
What sets your company apart?
Core skills and competitive advantages
Business strategy
Develop logical structure
Storyline & Storyboard
Company data
Industry data
Economic data
Slide types
Effectively designed visual aids
1 2 3 4

16
Sample of investment story/thesis?
Player in growth markets
Extending traditional strengths to new markets
New business opportunities
Management competence/credibility
Sustained financial performance
Innovation/Industry/Market leadership
Corporate partnership

17
Where do you get your investment thesis/story?
Formulate the investment thesis
Ascertain what management thinks – Attending board & management meetings
– Discussion with top management
Determine your business – Strategy map
– Business model
– Financial model
– Value drivers
Determine what the analysts and investors think
– Market signals analysis or feedback survey
– Analyst reports
– FAQ
Strategy – How your company plans to grow?
– How you do things differently from the competitors?
Strengths
– What are your qualities that you utilize to achieve target?
– What are your qualities that your competitors do not have?
Market Position
– Where are you positioned in relation to your competitors?
Determine your company value

“Me too!” mistake
“Trying to be all things to all people” mistake
“Not knowing your audience” mistake
“Death by numbers” mistake
“Wish list” mistake
Inadequate Differentiation
Common investment story/thesis mistakes
Dilution
Disconnection
Too much emphasis on earnings
Too much like a mission statement
18

19
Four steps to a best practice presentation
Define your value
story/thesis
Structure
presentation
Gather
information
Develop
Presentation
Develop logical structure
Storyline & Storyboard
Company data
Industry data
Economic data
Slide types
Effectively designed visual aids
1 2 3 4
What sets your company apart?
Core skills and competitive advantages
Business strategy

A storyboard lets you organize your ideas and visualize your final product and lets you lay out the logic of your presentation in the most effective sequence
20
Storyboard is the key starting point for structuring presentation

21
The power of ‘post-its’
Source: Presentation Zen, Garr Reynolds

22
A pyramid logic structure creating a well-organized and easy-to-follow presentation
Source: Recommended Approach to Presentation Writing, Jean-Florent Rérolle & The Pyramid Principle: Logic in Writing and Thinking, Barbara Minto
Pyramid Logic Structure
Horizontal Relationships
Objective/ Main Point Title
Sections
Sub-sections
Supporting facts
Presentation
Vertical Relationships

24
Using this outline, a storyboard should be created to begin “writing” the presentation
“Ve
rtic
al R
ela
tio
nsh
ips”
Section Introduction / Exec. Summary
“Horizontal Relationships”
Executive Summary Title
• • • •
•
•
•
•
•
•
•
•
•
•
•
•
Title
• • • •
Title
• • • •
or
Summary Story
Summary Story
Appendices
Highlights
• • •
Sections
Supporting facts
• • • •
Sub-sections
Analysis Detail Analysis Detail
Analysis Detail Market Research Detail
Source: Recommended Approach to Presentation Writing, Jean-Florent Rérolle & The Pyramid Principle: Logic in Writing and Thinking, Barbara Minto

29
Four steps to a best practice presentation
Define your value
story/thesis
Structure
presentation
Gather
information
Develop
Presentation
Develop logical structure
Storyline & Storyboard
Company data
Industry data
Economic data
Slide types
Effectively designed visual aids
1 2 3 4
What sets your company apart?
Core skills and competitive advantages
Business strategy

30
Gather information
Financial data Financial statements
Non-financial data
Department statistics
Context Management, department
heads
Company Data
Industry-specific publications
Industry studies
Competitors
Suppliers
Industry Data
Bank of Thailand Financial sector data, interest
rates, exchange rates
Ministry of Finance
Government income,
budget, public investment projects
National Statistical Office
Employment, population, etc.
National Economic & Social Development Board (NESDB)
Retail sales, direct investment, etc.
Economic Data

31
Four steps to a best practice presentation
Define your value
story/thesis
Structure
presentation
Gather
information
Develop
Presentation
Develop logical structure
Storyline & Storyboard
Company data
Industry data
Economic data
Slide types
Effectively designed visual aids
1 2 3 4
What sets your company apart?
Core skills and competitive advantages
Business strategy

32
Three basic types of content slides to help develop this “supporting story”
Presentation
Diagrams
Text Exhibits
__________________________________________________ • ______________________
______________________ • ______________________
______________________ __________________________________________________
Graphs: • Summarize numerical data • Draw attention to specific facts • Explain trends in underlying data
Diagrams: • Convey cause / effect, sequential
relationships between observations
• Organize information • Explain conceptual ideas
Text Exhibits: • Convey specific facts or ideas • Eliminate errors in interpretation
of the information presented • Summarize information on
previous or subsequent slides • Organize large amounts of
information
Source: Recommended Approach to Presentation Writing, Jean-Florent Rérolle & The Pyramid Principle: Logic in Writing and Thinking, Barbara Minto

33
Text exhibits are useful for organizing large amounts of information
Text Exhibits
__________________________________________________ • ______________________
______________________ • ______________________
______________________ __________________________________________________
Outline
__________________________________________________ • ______________________ • ______________________
• ________________ • ________________
__________________________________________________
Table Matrix Form
Source: Recommended Approach to Presentation Writing, Jean-Florent Rérolle & The Pyramid Principle: Logic in Writing and Thinking, Barbara Minto
--------------- ----------------------------------------------------------------------
--------------- ------------------------------------------------------------------------------------------------------
-------------------------
--------------------------------------------------------------
--------------- --------------------------------------------------
--------------- -----------------------------------------
Low
Med
High
Low Med High

34
Diagrams are used to demonstrate sequential, cause and-effect and dependency relationships
Diagrams
Gantt Conceptual Map Organizations Flow
Source: Recommended Approach to Presentation Writing, Jean-Florent Rérolle & The Pyramid Principle: Logic in Writing and Thinking, Barbara Minto

35
Graphs help draw attention to underlying trends or relationships in data series
Graphs
50
40
30
20
10
Line Pie Bar Dot
Sliding 100%
Surface/Area Curve
Single
Multiple Stacked Step Waterfall
Source: Recommended Approach to Presentation Writing, Jean-Florent Rérolle & The Pyramid Principle: Logic in Writing and Thinking, Barbara Minto

CONTENTS
How to develop an effective presentation
Importance of analyst presentation
Four steps to best practice presentation
Tips & presentation samples
Managing analyst presentation
Analyst presentation timeline
Delivering presentation & dealing with questions
Value of feedback
46

CONTENTS
How to develop an effective presentation
Importance of analyst presentation
Four steps to best practice presentation
Tips & presentation samples
Managing analyst presentation
Analyst presentation timeline
Delivering presentation & dealing with questions
Value of feedback
64

65
PRESENTATION DAY
WEEK 4 WEEK 3 WEEK 2 WEEK 1
WEEK 4
Start thinking about the audience: o Who will you target: analysts, fund managers, retail investors, business media? o How many will you invite; how many do you expect? o Do they cover your stock already or are they new to your company? o Have you been doing IR regularly or will this be the first time? o Do you have their contact info on file already or do you need to get them first?
Begin collecting info & data from finance team and other relevant departments (marketing, research, production…)
Book venue: o Company board room
o Hotel function room (recommended; should be near BTS/MRT)
The analyst presentation timeline

66
WEEK 3
Message development: o Start developing the overall core message and theme of the presentation o What is the key message you want analysts to take away? o Draft storyboard of the presentation: how will it flow, what will be the various sections? o Do you have all necessary info/data from the other departments or do you require further information? o Does the data/numbers support your core message? o Either adjust the message or find further data that support the message
Send invitation
o By fax and by email o Avoid mass emailing as many email systems will treat your email as spam o Send invitation to both the analyst and the head of equity research (his/her boss)
The analyst presentation timeline
PRESENTATION DAY
WEEK 4 WEEK 3 WEEK 2 WEEK 1

67
WEEK 2
CEO/CFO review 1 o Go through the presentation with top executives. Does the core message fit with the corporate strategy? o Are the numbers and calculations correct? o Are they comfortable with the level of disclosure?
CEO/CFO review 2 o Run through the presentation again with top executives to ensure their comments and amendments
have been included
Draft feedback survey, Q&A, and news releases o Prepare a questionnaire designed to get analyst’s opinion of the presentation (e.g. which section was
most useful, how can we improve our disclosure, how does the presentation compare with your competitors…)
o Prepare a list of likely questions and suggested answers for presenters o Prepare news releases for business media
The analyst presentation timeline
PRESENTATION DAY
WEEK 4 WEEK 3 WEEK 2 WEEK 1

68
WEEK 1
Send reminder invitation to analysts and fund managers o By fax and by email, similar to Week 4
Presentation final review and approval by CEO and CFO o Fix last errors, include last minute comment from CEO/CFO; CEO sign off o Ensure presenters are comfortable with Q&A
Prepare ‘Cheat Sheet’ and other supporting documents o Prepare spreadsheets for key operational and financial performance with breakdown numbers and
analysis (vertical & horizontal) o Prepare other supporting data (e.g. projections, investment progress, sources of funding, …)
Produce list of confirmed attendees Print out presentation, news release, and feedback survey
The analyst presentation timeline
PRESENTATION DAY
WEEK 4 WEEK 3 WEEK 2 WEEK 1

69
PRESENTATION DAY
Registration table: o IR and support staff welcome attendees o Collect business cards and contact info o Hand out hard copy of the presentation and feedback survey to all attendees
MC introduces speakers; translates if necessary; presenters deliver the presentation (suggested time: 45 min. to 1.5 hr.) o If translation necessary, be mindful of the time (x2!)
Q&A session concludes presentation; MC reminds attendees to fill out survey; IR staff collects survey
Site visit if appropriate (plant visit, project tour etc…)
The analyst presentation timeline
PRESENTATION DAY
WEEK 4 WEEK 3 WEEK 2 WEEK 1

70
FOLLOW UP
FOLLOW UP
Thank you note to all attendees no later than 48 hours after the event
Mail/email presentation to analysts who had confirmed but did not attend
Upload presentation/webcast with English translation script on IR section of your
corporate website
Send out news release to business media
Monitor coverage and market movements
Review analysts feedback
Present analysts feedback report to CEO/CFO and The Board (if necessary)
Follow up as necessary if feedback shows misunderstanding or is negative
The analyst presentation timeline
PRESENTATION DAY
WEEK 4 WEEK 3 WEEK 2 WEEK 1

CONTENTS
How to develop an effective presentation
Importance of analyst presentation
Four steps to best practice presentation
Tips & presentation samples
Managing analyst presentation
Analyst presentation timeline
Delivering presentation & dealing with questions
Value of feedback
71

74
Dealing with questions
Prepare a list of possible questions and supporting documents
o See Q&A in the presentation timeline, Week 2 o See ‘Cheat Sheet’ and supporting documents, Week 1
Focus on the ‘tough’ questions
o If you are ready for the tough questions, everything else will seem easy o You are a publicly-listed company, not a private one. All questions (almost) are fair game
“No comment” is not an answer!
o “No comment” = “There is a big problem and I don’t want to talk about it”

To what extent do you
think the new
management of Company
ABC has been able to
deal with these problems?
75
Do you think your expansion plan is too aggressive /
conservative?
Can you finance this huge CAPEX? How?
What is your growth story?
What makes your confident in making a footprint overseas?
What are your strengths or advantages in that market?
Your margin declining… why? How long will this continue?
Have you seen any slowdown in the market?
Is your financing policy too conservative?
Questions that sending signals
Samples of signal questions

CONTENTS
How to develop an effective presentation
Importance of analyst presentation
Four steps to best practice presentation
Tips & presentation samples
Managing analyst presentation
Analyst presentation timeline
Delivering presentation & dealing with questions
Value of feedback
76

77
Sample of feedback questionnaire
Value of feedback: feedback questionnaire

78
Value of feedback: feedback questionnaire
Suggested question
How would you rank the severity of the problems which
Company ABC faces today?
What do you think of Company ABC’s new strategy of
expanding in foreign markets like India and China?
What do you think Company ABC’s main challenges will be
going forward?
How would you rate the overall standard of Company’s results
presentation this quarter compared to the results
presentations its main competitors?
How could Company ABC improve its quarterly results
presentations going forward?

80
How IRO adds value to the presentation
IRO is a source of feedback from previous presentations
IRO can help the company communicating one single
message
IRO possesses knowledge about the company and needs
of analysts and investors
IRO is a unique position linking the company,
management, and the investment community
IRO is the most capable man in tailoring analyst
presentations

81
PYI Consulting Company Limited
26th Floor, Capital Tower
All Seasons Place
87/1 Wireless Road
Bangkok 10330 Thailand
Pathom Yongvanich, Director & Partner:
+6681-866-1449
Sarit Chokchainirand, Director & Partner
+66818552564
Office Tel. +662-685-3838
www.PYI.co.th
Contact Us