gonzales computational analysis
TRANSCRIPT

INDIAN HEAD
Computational Analysis of a Rocket Motor Thrust Control Unit
David R. GonzálezIndian Head Division, NSWC
Propulsion Branch, Code E313K
301.744.1513
Christopher HovlandIndian Head Division, NSWC
Propulsion Branch, Code E313O
301.744.6719
Distribution A: Approved for Public Release

Agenda
• System Overview• Analysis Objective• Analysis Approach
• Solid Model Development• Computational Fluid Dynamics Model
• Results• Thrust• Tab Surface Parameters• Flow Visualizations
• Closing Remarks
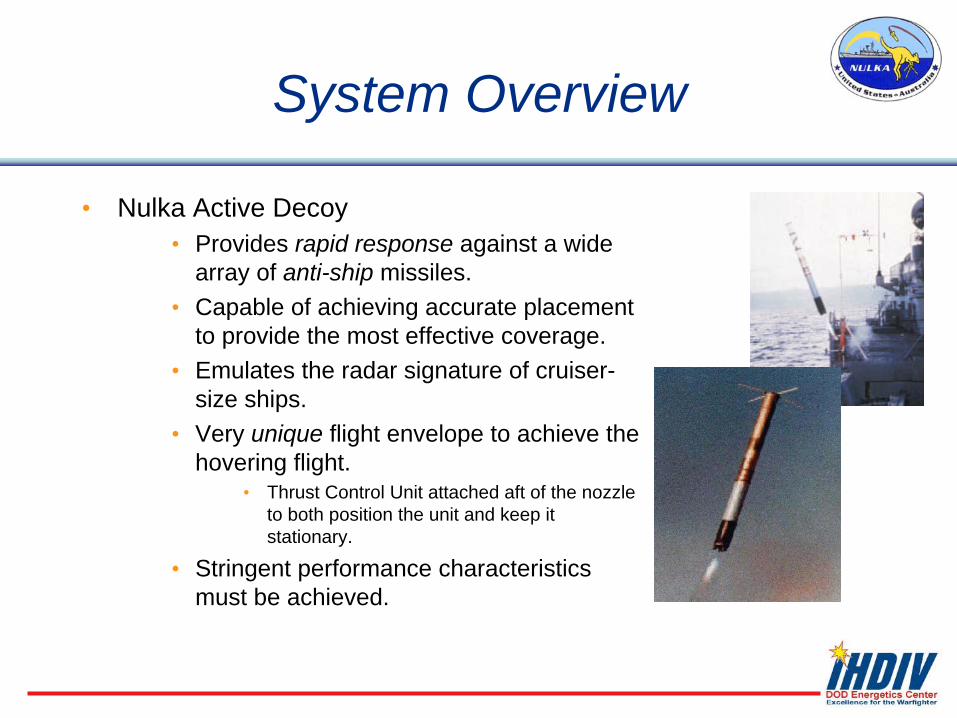
System Overview
• Nulka Active Decoy• Provides rapid response against a wide
array of anti-ship missiles.• Capable of achieving accurate placement
to provide the most effective coverage.• Emulates the radar signature of cruiser-
size ships.• Very unique flight envelope to achieve the
hovering flight.• Thrust Control Unit attached aft of the nozzle
to both position the unit and keep it stationary.
• Stringent performance characteristics must be achieved.

Analysis Objective
• Gain a better understanding of TCU behavior.• Several unexpected performance trends have been evident in static firings over the course
of the years:1. Slow Thrust Control Unit (TCU) tab response times;2. Reduced spoilage levels; &3. Thrust spoilage level reductions throughout a motor firing.
• Computational Fluid Dynamics (CFD) analyses will be conducted to investigate possible contributors.
Low Thrust Spoilage and Spoilage Reduction vs. Time.
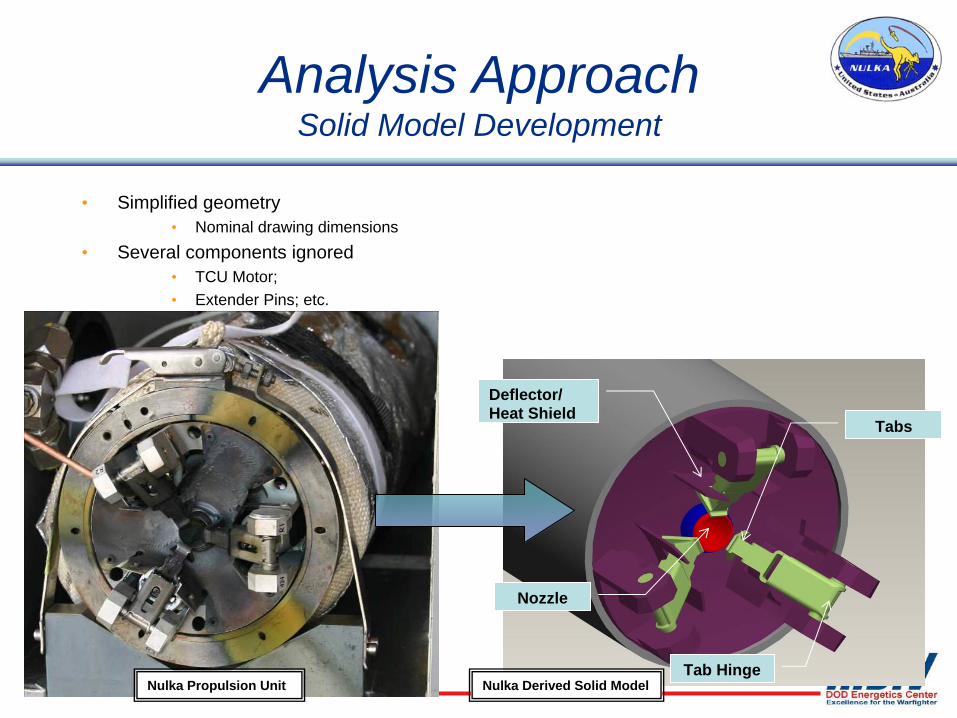
Analysis Approach Solid Model Development
• Simplified geometry• Nominal drawing dimensions
• Several components ignored• TCU Motor;• Extender Pins; etc.
Nozzle
Deflector/Heat Shield
Tabs
Tab HingeNulka Propulsion Unit Nulka Derived Solid Model

Analysis Approach Computational Fluid Dynamics Model
• Domain of interest must be broken into small, discrete elements (computational mesh).
• Domain includes:1. Solid model geometry (solid surfaces); &2. Fluid domain.
• Individual models must be built for each insertion configuration of interest.
• Two software have been used both for model verification and for the analysis of different TCU dynamics:
1. Full, 360° circumferential model (includes all 3 thrust tabs) using Fluent; &
2. 120° circumferential symmetry model (only 1 thrust tab) using AVUS.• These are discussed in the following slides.

Analysis Approach Computational Fluid Dynamics Model
• Fluent• Initial version (used for model verification)
1. Truncated thrust tabs;2. No chassis towers included.
• TCU Performance Study version1. Full, solid model geometry
CFD Model used for Verification
Full-geometry CFD Model

Analysis Approach Computational Fluid Dynamics Model
• AVUS• 120°-Symmetry model.• Includes a single thrust tab (full solid
model geometry).• Can only be used to account for
symmetric insertions
Symmetry Lines
120° Symmetry Model
Rocket motor case not pictured.

Analysis Approach Computational Fluid Dynamics Model
• Conventions• Positive Tab Moment = Tab Tendency to Extract (insert further into efflux; left
figure).• Tab Surface Pressures and Temperatures measured along face centerline from
bottom up (right figure).
Positive Tab Arm Moment

Analysis Approach Computational Fluid Dynamics Model
• Predicted Results1. Axial thrust / Thrust spoilage;2. Forces & Moments
• Tab Face / Tab Arm Contributions;• Pressure and Viscous Components;• Etc.
3. Surface Pressures & CP• Along tab face.• CP used as measure of Mach disk
location.
4. Surface Temperatures• Along tab face.• Temperature contours shown for
remainder of tab geometry.
Readily measured in static firings.
Very difficult (near impossible) to instrument a motor to collect these measurements.

Thrust-Time HistoryTest Firing Data
Time
Thru
st
Firing AFiring B
Results LAT Data Points Simulated
• Two sets of PU LAT firing data provided for model verification.• Firing A (cold-conditioned motor; low pressure);• Firing B (hot-conditioned motor; high pressure).
1
2
3
4
• Data points chosen for strategic value in demonstrating different aspects of TCU performance:– Firing A (low pressure)
1. Ballistic performance (thrust retracted);
2. Full tab insertion;3. Asymmetric tab insertion
– Firing B (high pressure)4. Full tab insertion.
• CFD conducted using Fluent, except 1.

Results Thrust
• Thrust Predictions– Key Findings:
• Ballistic thrust levels were predicted with great accuracy; • CFD predicted higher levels of thrust spoilage than observed in LAT;• CFD aptly captures the flow physics (verified by good agreement with thrust levels).
Thrust-Time HistoryFiring A Test Data
Time
Thru
st
Firing A Corrected ThrustFirinig AMax Spoilage LimitCFD
Thrust-Time HistoryFiring B Test Data
Time
Thru
st
Firing B Corrected ThrustFiring BCFD
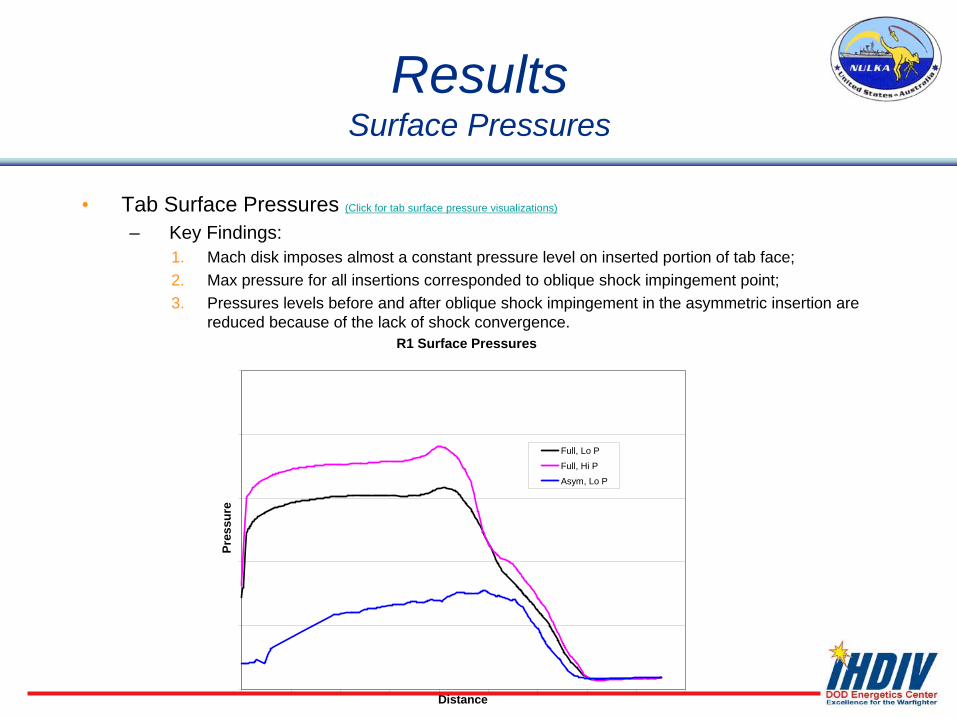
Results Surface Pressures
• Tab Surface Pressures (Click for tab surface pressure visualizations)
– Key Findings:1. Mach disk imposes almost a constant pressure level on inserted portion of tab face;2. Max pressure for all insertions corresponded to oblique shock impingement point;3. Pressures levels before and after oblique shock impingement in the asymmetric insertion are
reduced because of the lack of shock convergence.R1 Surface Pressures
Distance
Pres
sure
Full, Lo PFull, Hi PAsym, Lo P

Results Center-of-Pressure
• Centers-of-Pressure (Click for tabular results)
– Key Findings:1. Full symmetric insertions (low and high pressure) had almost identical CP placements (owing to the
near identical surface pressure profile);2. CP located below hinge line at the full symmetric insertions, generating the positive moments;3. Since oblique shock impingement is the biggest source of pressure on the asymmetric insertion, CP for
this case is located further up the tab, creating a negative moment.
NOTE:Color contours DO NOT reflect any data relevant to the CP data being presented. They are meant as a means to distinguish the tab face from the rest of the geometry.
Full, Lo P Full, Hi P Asym, Lo P

Tab Surface Temperatures
0
500
1000
1500
2000
2500
3000
3500
0 2 4 6 8 10 12 14 16
Distance (mm)
Tem
pera
ture
(K)
13.6 mm - Lo P13.6 mm - Hi P12.5 mm - R112.5 mm - R2
Results Surface Temperatures
• Tab Surface Temperatures (Click for visualizations of temperature around thrust tabs)
– Key Findings:1. Full chamber temperature recovered on all inserted tabs;2. Temperatures peaked in regions not exposed to high pressures in symmetric insertions. These were
found to be due to the accelerating flow between the tab and nozzle , generating reduced gas densities (Click to view profile).
3. Asymmetric tab experiences slightly higher temperatures at the bottom of the tab face;
4. Elevated temperatures found on retracted tabs due to thrust vectoring.

Results Mach Iso-Surfaces
• Exhaust Plume Visualizations
Mach Contours Along Centerline (Retracted Tabs).
Mach 1 & 2 Iso-Surfaces for Full Insertion @ Low Pressure.
Mach 1 & 2 Iso-Surfaces for Full Insertion @ High Pressure.
Mach 1 & 2 Iso-Surfaces for Asymmetric Insertion @ Low Pressure.

Results Mach Disk Location
• Predicted Mach Disk

Concluding Remarks
• Computational fluid dynamic (CFD) models have been shown to correctly predict the complicated flow physics of the Thrust Control Unit.
• Two versions were developed that made use of simplified geometry. 1. Full circumferential model
(incorporating all 3 tabs); &2. 120° symmetry model (single tab
incorporated).
• CFD models allow for the study of parameters not easily obtained in experimental setups, including:
1. Tab forces and moments;2. Tab surface pressures;3. Tab surface temperatures;4. Mach disk location;5. Etc.
• Thrust/Spoilage can also be predicted.
Concluding Remarks
• Axial thrust and thrust spoilage magnitudes were found to agree well with FSED- specified levels.
• Moment magnitudes were found to be comparable to those predicted by the current performance model.
• Tab arms were found to have significant contributions to total moment magnitudes;• Current performance model neglects the tab arm contribution.
• Tab face surface temperatures were found to be around the magnitude of the combustion chamber.
• Majority of tab arm was predicted to be at or around atmospheric temperature;• At full insertion, accelerated flow between tab face and nozzle was at higher
temperature than at the surface exposed to efflux due to the reduced density;• Lower insertions did not exhibit a similar behavior.

Concluding Remarks
• FY09 work will focus on continuing the systematic analysis of the TCU. This will include:
1. Further TCU performance characterization at high pressure extreme;2. Asymmetric insertions; &3. Spoilage sensitivities.
• Performance trends and TCU responses identified from these series of investigations can later be incorporated into available performance models.

Backup Slides

Results - Backup Model Verification Runs
• Thrust Tab Face Surface Pressures (Back to main presentation)
Full Insertion @ Low Pressure. Full Insertion @ High Pressure.
Asymm. Insertion @ Low Pressure.
Results - Backup Model Verification Runs
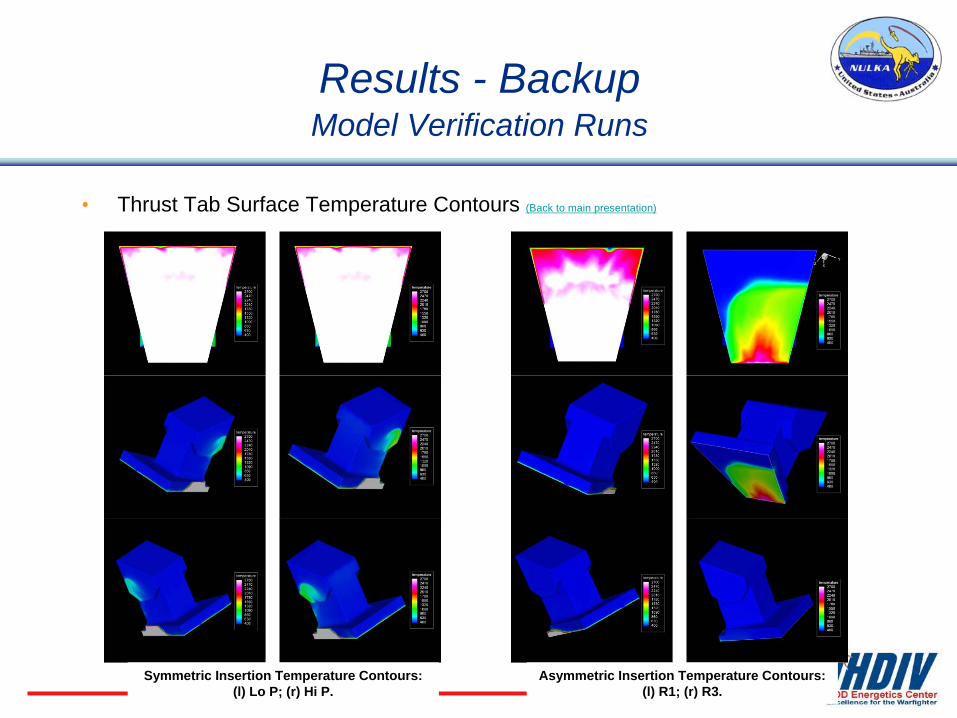
• Thrust Tab Surface Temperature Contours (Back to main presentation)
Symmetric Insertion Temperature Contours: (l) Lo P; (r) Hi P.
Asymmetric Insertion Temperature Contours: (l) R1; (r) R3.

Results - Backup Model Verification Runs
• Temperatures Between Nozzle & Tab for Max. Symmetric Insertion (Back to main presentation)
For a Perfect Gas:
RpTρ
=
p = atmospheric pressure;
R = the gas constant.
Gas Density on Tab Surface
Distance
Den
sity
Full - Lo P

Flow Entrainment Visuals