gong, pelton, duerig, rebelo, perry proceedings of smst ... · pdf filefinite element analysis...
TRANSCRIPT

25 March 2009 NDC Business System R2Letterhead (scale 80%) Option #1
47533 Westinghouse Drive Fremont, California 94539 t 510.683.2000 f 510.683.2001
We are Nitinol.™
www.nitinol.com
FiniteElementAnalysisandExperimentalEvaluationofSuperelasticNitinolStents
Gong,Pelton,Duerig,Rebelo,Perry
ProceedingsofSMST‐2003Monterey,CA
(eds.)T.W.Duerig,A.Pelton
2003

FINITE ELEMENT ANALYSIS AND EXPERIMENTAL EVALUATION
OF SUPERELASTIC NITINOL STENT
Xiao-Yan Gong*, Alan R. Pelton*, Tom W. Duerig*,Nuno Rebelo** and Ken Perry***
*Nitinol Devices & Components, 47533 Westinghouse Drive, Fremont, CA 94539 USA**ABAQUS West, 39221 Paseo Padre Parkway, #F, Fremont, CA, 94538 USA
***ECHOBIO, 579 Azalea Avenue NE, Bainbridge Island, WA 98110
ABSTRACT
The mechanical properties of Nitinol stents are normally evaluated experimentally due to complexitiesresulting from large deformations and material nonlinearity. Despite the difficulties associated with FiniteElement Analysis (FEA), the success of the computational analysis in combination with experimental studyleads to better understanding of stent performance. This paper presents comparisons betweenexperimentally evaluated radial resistive forces of a Nitinol stent to predictions based on nonlinear FEA.The FEA was performed using ABAQUS with two user material subroutines independently developedspecifically for Nitinol. Good agreements between the FEA and the experiments are shown for both usermaterial subroutines.
KEYWORDS
NiTi, finite element analysis, superelastic, crush, stent, radial force.
INTRODUCTION
Recently, FEA on Nitinol has been improved to cover the superelastic behavior and has been proven to be asuccessful prediction tool in device design [1-6]. Among the many successful applications, Nitinol self-expanding stents have drawn much attention. Compared to a balloon-expandable stent, a Nitinol self-expanding stent provides constant gentle outwards pressure yet maintains high resistance to inwardpressure and high crush resistance in addition to its ease of deployment [7-8]. Because of these uniqueproperties, demands of Nitinol self-expanding stents are increasing for certain applications.
The most important mechanical requirements for a stent are radial force and fatigue life. Although bothrequirements can be evaluated through physical tests, they require “build-test” iterations and involve longtime fatigue testing. Thus, they can be very costly and time consuming. A ten-year device fatigue lifeunder the heart rate of 75 beats per minute projects a 400 million cyclic pulsatile loading on the stent. Evenwith an accelerated fatigue test, a 400 million-cycle fatigue test can last months. FEA is an extremelyuseful complement and has proven to be more effective and capable of providing a better and a moredetailed understanding for fatigue and design [9-10].
This paper discusses the results using two different approaches to model the superelastic constitutivebehavior of Nitinol. Both approaches are then used in the analysis to determine the radial force and crushcharacteristics of a Nitinol self-expanding stent. Comparisons with the corresponding tests confirm thatFEA provides good predictions of the stent’s mechanical response. Good agreement between two different

constitutive approaches indicates FEA is a capable predictive tool in the early design phase of Nitinoldevices.
CONSTITUTIVE MODELS
It is well known that Nitinol is a thermo-mechanical coupled material. Pelton et al (2000) demonstratedthis thermo-mechanical coupled material response systematically [11]. In their work, uniaxial stress-strainbehavior of Nitinol wires was studied from –100oC to 150oC as shown in Figure 1. The series of stress-strain responses at different temperatures demonstrate the highly nonlinear, path and temperature dependentmaterial constitutive behavior.
Figure 1. Uniaxial stress-strain relation at different temperatures
Pelton et al (1994) were also the first to address the nonlinear material behavior of Nitinol by takingadvantages of the hyperelastic theory for rubbers [12]. This approach is very intuitive, as Nitinol is, tosome extent, a “rubber in the metal form.” Despite their success, hyperelastic theory is known to havestability issues that require more calibration tests (namely uniaxial tension, biaxial tension and shear) tostabilize the model. Furthermore, the hyperelastic material model does not address the path andtemperature dependent material behavior of Nitinol [13].

Over the last ten years, many theories that account for the nonlinear path dependent thermo-mechanicalconstitutive behaviors applicable to Nitinol have been independently developed [14-18]. They build up thefoundation for the state-of-art constitutive description of Nitinol. To date, advanced FEA of Nitinol hasadopted those theories. The constitutive models used in this paper are based on the approaches proposedby Auricchio et al, and Qidwai and Lagoudas [16-18]. For completeness, their approaches are brieflysummarized below.
Auricchio’s approach is based on the generalized plasticity theory [16-17]. It models the superelasticbehavior of Nitinol, where any strain increment is decomposed into a linear elastic part, and into a stressinduced transformation part. The transformation part follows standard plasticity rules, such that strainincrements can be derived from a plastic potential. The model includes transformation surfaces (analogousto yield surfaces) for both the austenite-to-martensite transformation and the reverse martensite-to-austenitetransformation. The ABAQUS implementation allows for different elastic properties for austenite and formartensite, as well as different transformation stresses in tension and in compression. The loading can beeither mechanical or thermal, and the transformation stresses (surfaces) are temperature dependent.
Qidwai and Lagoudas have developed constitutive models for shape memory and superelastic materialsbased on first principles [18]. In their approach, the second law of thermodynamics is written in terms ofthe Gibbs free energy. Strain, temperature and martensite volume fraction become state variables that mustsatisfy the second law of thermodynamics. An evolution equation for the martensite volume fraction isderived from a dissipation potential and the effective transformation surfaces are evaluated as functions ofthe state variables. This approach also allows for different temperature dependant elastic properties foraustenite and martensite and accommodates both mechanical and thermal loading.
Both constitutive models need calibration based on uniaxial tensile test. Figure 2 plots the comparison ofthe two independently developed constitutive models and the experimental result of Nitinol tubing that hasbeen processed to achieve an Af of 29oC and is tested at 37oC. Note that both models can be calibrated topredict the material’s response well up to close to 8% strain based on a limited numbers of parameters.Discrepancy arises at higher strains because neither material model covers the plasticity in the martensiticphase. ABAQUS/Standard version 6.2-1 along with Nitinol UMAT/3D 3.24 developed by ABAQUS Westand another User-defined material subroutine by EchoBio were used in the analyses.
Figure 2. Comparison of FEA predictions and the experimental data
0
20
40
60
80
100
120
140
160
180
0 0.01 0.02 0.03 0.04 0.05 0.06 0.07 0.08 0.09 0.1
Strain
Str
ess
(ksi
)
Abaqus West UMAT
EchoBio UMAT
Sample #2

RESULTS AND DISCUSSIONS
RRF AND COF
RRF (Radial Resistive Force) and COF (Chronic Outwards Force) are important mechanical responsesunique to Nitinol Superelastic stents. RRF is the force generated by a stent to resist the reduction in itsdiameter and COF is the force generated by a stent when it is self-expanded from a smaller diametertowards a larger diameter. Figure 3 illustrates schematically how these values are experimentallyevaluated. Generally, this experiment is performed on a MTS system with customized test fixtures. Thetest is performed in a hot water bath so that a constant testing temperature of 37C is maintained. In the firststep, the stent is crimped down to a small diameter in order to fit into the intended delivery system at a lowtemperature. Then, it is placed inside the Mylar loop with one end of the loop fixed to the test fixture andanother end connected to the MTS force actuator. The hot water is then added so that the crimped stent issubmerged and this causes the stent intended to expand back to its manufactured larger diameters. TheMylar loop is now a constraint against the self-expansion of the Nitinol stent. The Mylar loop experiencesa radial expansion force that is transferred to the load cell as a pulling force. By moving the MTS actuatordown, one can release the pulling force and record the force as function of the actuator displacement. Thestent diameter change can be calculated based on the actuator displacement. Thus, the force as a functionof the stent diameter is obtained in this way. Notice that this records the force as the stent is released fromits crimped diameter; therefore, the measured force corresponds to the COF. At a given stent diameter,when RRF is of interest, the MTS head is reversed to move up so that a pulling force on the Mylar istransferred to the stent as a radial compression. By crimping down the stent to a smaller diameter, one canobtain the RRF. After the RRF is obtained, one can reverse the MTS actuator again to complete the test orcan repeat the sequences to obtain the RRF at different stent diameters.
Figure 3. Schematic radial force test set up
For simplicity, a two-strut model shown in Figure 4 is used in our FEA. For comparison purposes, thesame model and mesh were used in the study. A 10mm SMART Control[TM] stent from Cordis self-expanding stent product line is selected for the RRF and COF study. In this model, symmetrical boundaryconditions are applied to the open surfaces to maintain symmetrical deformation. User-defined rigidsurfaces are used to compress and release the stent to the necessary stent diameters. Artificial stabilityoption in ABAQUS/Standard is also turned on so that the analysis can run smoothly. The total strainenergy and total artificial strain are traced during the whole simulation to ensure that the artificial energy isnegligible.

Figure 4. Side (left) and top (right) views of a two strut model
Figure 5 shows the comparison between the FEA predictions and the test result. In either materialconstitutive model, the re-load of the Nitinol is not simulated correctly. In addition, there are discrepanciesat smaller stent diameters. This corresponds to the lack of a plasticity model at high strain in themartensitic phase in both material models; however, the COF agrees well with the experimental result atlarger diameters. Luckily, larger diameters are of greater interests in stent applications. Furthermore, ifone keeps in mind that RRF originates from the material response on the loading path, one can find thecorrect predictions of the RRF from the FEA results during the compression of the stent. Thus, even forthese challenging results, the FEA solution agrees well with the experimental results.
Figure 5. Comparisons of FEA predictions and the tests results
Figure 6 shows the strain contours on the deformed struts. The high strain locations identify the fatiguecritical areas in stent manufacturing. Figure 7 plots the comparison of peak maximum principal strains forboth material models. There is a good agreement between both material models and actual materialbehavior.
0
2
4
6
8
10
12
14
2 4 6 8 10
Diameter (mm)
Fo
rce
(N)
Abaqus West UMATEchoBIO UMATExperiment

Figure 6. Maximum principal strain contours indicate the fatigue critical areas
Figure 7. Peak maximum principal strain as function of stent diameter
0
1
2
3
4
5
6
7
8
9
2 4 6 8 10
Diameter (mm)
Pea
k M
axim
um
Pri
nci
pal
Str
ain
(%
)
Abaqus West UMATEchoBio UMAT

CRUSH RESISTANCE
The same diameter stent was chosen for crush test. The crush test was performed on EnduraTec desktoptester ELF/3200 series capable of higher displacement and load resolution. The test setup isstraightforward, first the stent was deployed inside a 8mm ID 5% compliant tube (over 100mmHg pressuredifferential) to simulate the worst case oversizing per the product IFU. The stented tube is then crushedbetween two rigid plates and the force and displacement were monitored. Air heating is used in this test.Environment temperature is 37oC to simulate the body temperature.
Figure 8. Side (left) and top (right) views of the FEA model for crush simulation
Figure 8 shows the FEA model for this simulation. Due to the repetitive patterns of a stent, only two half-row struts are used in the analysis. Axial and rotational repetitive boundary conditions are applied to theopen ends of the model. The analysis involves rigid-to-flexible and flexible-to-flexible contacts over threesteps. In the first step, all the contacts are removed so that the compliant tube, simulated as shell elements,is pressurized to expand to a diameter slightly larger than the stent OD. In the second step, the contactbetween the compliant tube and the stent OD is activated and the pressure acting on the tube ID is releasedcompletely so that the tube and stent reach their equilibrium positions. In the last step, contact between arigid surface and the tube OD is activated so that the rigid surface can crush the stented tube. Thissimulation is difficult, not only due to the contacts and the material nonlinearity, but mainly because of thebuckling of the stent. As a matter of fact, the buckling is visually observed both from the test and the FEAas shown in the comparison of the deformed shapes from the experiment and the FEA in Figure 9.
Figure 9. Comparison of deformed stent shape from experiment (left) and FEA (right)
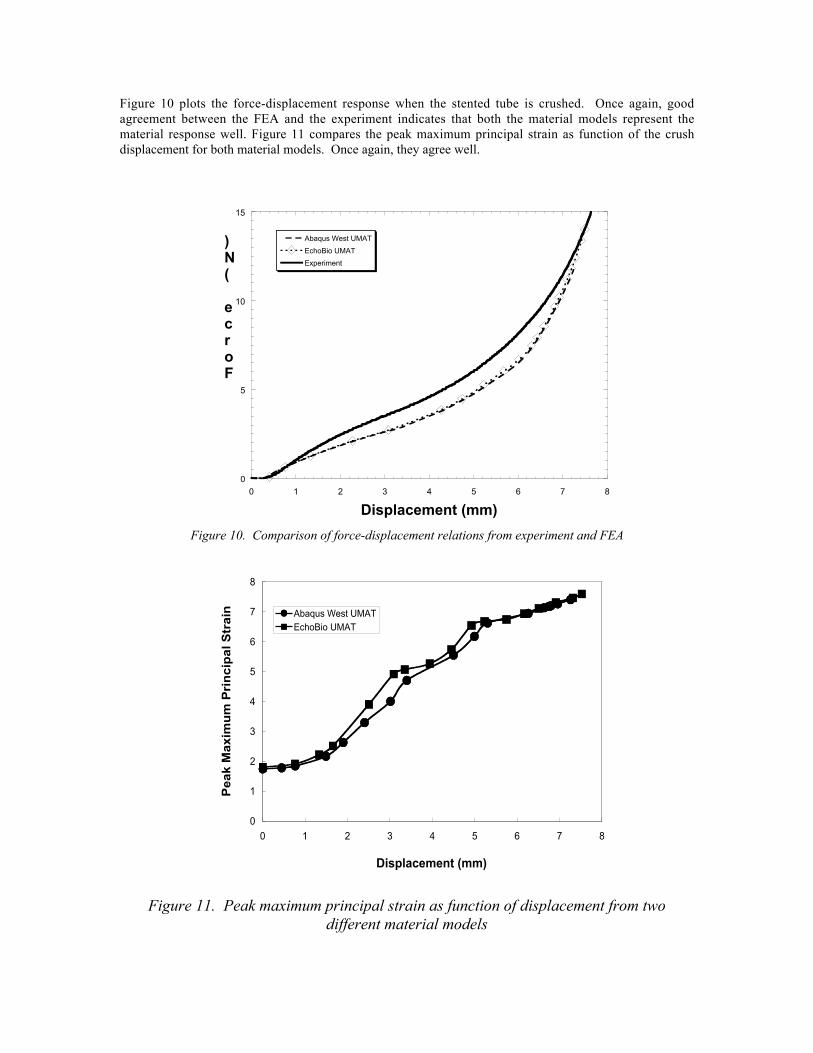
Figure 10 plots the force-displacement response when the stented tube is crushed. Once again, goodagreement between the FEA and the experiment indicates that both the material models represent thematerial response well. Figure 11 compares the peak maximum principal strain as function of the crushdisplacement for both material models. Once again, they agree well.
Figure 10. Comparison of force-displacement relations from experiment and FEA
Figure 11. Peak maximum principal strain as function of displacement from twodifferent material models
0
5
10
15
0 1 2 3 4 5 6 7 8
Abaqus West UMAT
EchoBio UMAT
Experiment
Force (N)
Displacement (mm)
0
1
2
3
4
5
6
7
8
0 1 2 3 4 5 6 7 8
Displacement (mm)
Pe
ak
Ma
xim
um
Pri
nc
ipa
l S
tra
in Abaqus West UMATEchoBio UMAT

CONCLUSIONSWe showed that FEA based on two different user-defined material subroutines predicts consistentlymechanical response for stents. Key results from FEA done with both material models agree well withexperimental results, indicating that FEA is a powerful predictive tool that can be used in productdevelopment and design. Improvement of the material constitutive models for Nitinol is necessary toaccurately describe the plasticity in the martensitic phase as well as under multiple loading and unloadingsequences.
REFERENCES
1. X. Gong and A. R. Pelton, ABAQUS Analysis on Nitinol Medical Applications, Proceedings ofABAQUS Users' Conference, New Port, Rhode Island, 2002, p. 1.
2. N. Rebelo and M. Perry, Finite Element Analysis for the Design of Nitinol Medical Devices, Min.Invas. Ther. & Allied. Technol., 9 (2) 2000, p. 75.
3. N. Rebelo, M. Hsu and Foadian, H., Simulation of Superelastic Alloys Behavior with ABAQUS, inSMST-2000: Proceedings of the International Conference on Shape Memory and SuperelasticTechnologies (S.M. Russell and A.R. Pelton eds.), Pacific Grove, California, USA, 2000, p. 495.
4. E. Patoor, Y. Gillett, E. Segard and M. Berveiller, Optimisation of Superelastic Elements, in SMST-97:Proceedings of the Second International Conference on Shape Memory and Superelastic Technologies,(A.R. Pelton, D. Hodgson, S. Russell and T.W. Duerig eds.), Pacific Grove, California, USA, 1997, p.35.
5. F. Trochu and P. Terriault, Finite Element Stress Analysis of A Shape Memory Medical Stent, inSMST-97: Proceedings of the Second International Conference on Shape Memory and SuperelasticTechnologies, (A.R. Pelton, D. Hodgson, S. Russell and T.W. Duerig eds.), Pacific Grove, California,USA, 1997, p. 595.
6. M. D. Perry and R.T. Chang, Finite Element Analysis of NiTi Alloy Stent Deployment, in SMST-97:Proceedings of the Second International Conference on Shape Memory and Superelastic Technologies,(A.R. Pelton, D. Hodgson, S. Russell and T.W. Duerig eds.), Pacific Grove, California, USA, 1997, p.601.
7. T. W. Duerig and M. Wholey, A Comparison of Balloon- and Self-Expanding Stents, Min. Invas.Ther. & Allied. Technol., 11 (4) 2002, p. 173.
8. T. Duerig, D. E. Tolomeo, and M. Wholey, An Overview of Superelastic Stent Design, Min. Invas.Ther. & Allied. Technol., 9 (3/4) 2000, p. 235.
9. D. Tolomeo, S. Davidson and M. Santinoranont, Cyclic Properties of Superelastic Nitinol: DesignImplications, in SMST-2000: Proceedings of the International Conference on Shape Memory andSuperelastic Technologies (S.M. Russell and A.R. Pelton eds.), Pacific Grove, California, USA, 2000,p. 471.
10. C. Kugler, D. Maston and K. Perry, None-Zero Mean Fatigue Test Protocol for NiTi, in SMST-2000:Proceedings of the International Conference on Shape Memory and Superelastic Technologies (S.M.Russell and A.R. Pelton eds.), Pacific Grove, California, USA, 2000, p. 409.
11. A. R. Pelton, J. Dicello and S. Miyazaki, Optimisation of Processing and Properties of Medical GradeNitinol Wire, Min. Invas. Ther. & Allied. Technol., 9 (2) 2000, p. 107.
12. A. R. Pelton, N. Rebelo, T.W. Duerig and A. Wick, Experimental and FEM Analysis of the BendingBehavior of Superelastic Tubing, in SMST-94: Proceedings of the First International Conference onShape Memory and Superelastic Technologies, (A.R. Pelton, D. Hodgson and T.W. Duerig eds.)Pacific Grove, California, USA, 1994, p. 353.
13. M. Pease and B. Walsh, Nitinol Constitutive Law Comparison for Finite-Element Analysis, in SMST-2000: Proceedings of the International Conference on Shape Memory and Superelastic Technologies(S.M. Russell and A.R. Pelton eds.), Pacific Grove, California, USA, 2000, p. 495.
14. R. Abeyaratne and J. Knowles, A Continuum Model for A Thermoelastic Solid Capable of UndergoingPhase Transitions, J. Mech. Phys. Solids, 41, 1993, p 541.
15. L. Anand and M. Kothari, A Computational Procedure for Rate-Independent Crystal Plasticity, J.Mech. Phys. Solids, 44, 1996, p525.

16. F. Auricchio and R. Taylor, Shape Memory Alloys: Modeling and Numerical Simulations of theFinite-Strain Superelastic Behavior, Comput. Methods. Appl. Mech. Engng. 143, 1996, p175.
17. F. Auricchio and R. Taylor, Shape Memory Alloys: Micromodeling and Numerical Simulations of theSuperelastic Behavior, Comput. Methods. Appl. Mech. Eng. 146, 1997, p281.
18. M. A. Qidwai and D .C. Lagoudas, Numerical Implementation of A Shape Memory AlloyThermomechanical Constitutive Model Using Return Mapping Algorithms, Int. J. Numer. Meth.Engng. 46, 2000, p1123.