globalization and income inequality revisited · globalization and income inequality revisited ......
TRANSCRIPT
ifo WORKING PAPERS
2472018
January 2018
Globalization and Income Inequality Revisited Florian Dorn, Clemens Fuest, Niklas Potrafke
Impressum:
ifo Working Papers Publisher and distributor: ifo Institute – Leibniz Institute for Economic Research at the University of Munich Poschingerstr. 5, 81679 Munich, Germany Telephone +49(0)89 9224 0, Telefax +49(0)89 985369, email [email protected] www.cesifo-group.de
An electronic version of the paper may be downloaded from the ifo website: www.cesifo-group.de
1
Globalization and Income Inequality Revisited
Abstract
This paper re-examines the link between globalization and income inequality. We use data for 140 countries over the period 1970–2014 and employ an IV approach to deal with the endogeneity of globalization measures. We find that the link between globalization and income inequality differs across different groups of countries. There is a robust positive relationship between globalization and inequality in the transition countries including China and most countries of Middle and Eastern Europe. In the sample of the most advanced economies, neither OLS nor 2SLS results show any significant positive relationship between globalization and inequality. We conclude that institutions providing income insurance and education, which characterize most advanced economies but are less developed in transition economies, may have moderated effects of globalization on income inequality.
JEL Classification: D31, D63, F02, F60, C26, H11, H20. Keywords: Globalization, income inequality, redistribution, instrumental variable estimation, panel econometrics, development levels, transition economies, China.
December 2017
Acknowledgements: We would like to thank Matteo Cervellati, Debora Di Gioacchino, Gabriel Felbermayr, Jasmin Gröschl, Bernd Hayo, Andreas Peichl, Jukka Pirttilä, Uwe Sunde and the participants of the European Commission DG ECFIN Annual Research Conference 2016, the participants of the 2017 meeting of the European Public Choice Society (EPCS), the participants of the seventh meeting of the Society for the Study of Economic Inequality (ECINEQ), and the participants of the International Institute of Public Finance (IIPF) Annual Conference 2017 and IIPF Doctoral School on “Dynamics on Inequality” for helpful comments. A previous version was prepared as discussion paper in the context of the European Commission DG ECFIN's fellowship initiative 2016/17. We would like to thank Antonia Kremheller, Garry Poluschkin, and Alexander van Roessel for research assistance. Florian Dorn is grateful for support from the Hanns-Seidel-Foundation.
Florian Dorn, ifo Institute Munich, University of Munich (LMU), [email protected]; Clemens Fuest, ifo Institute Munich, University of Munich (LMU), [email protected]; Niklas Potrafke, ifo Institute Munich, University of Munich (LMU), [email protected].
ifo Working Paper No. 247
2
INTRODUCTION 1The link between globalization and income inequality plays a key role in the international policy
debate. The view is widespread that inequality caused by globalization is an important driver of
growing support for populism. The Brexit referendum in the United Kingdom in 2016 or the victory of
Donald Trump in the United States in 2016 are widely seen as reflecting the growing anger of
globalization losers.
At a global scale, globalization rather seems to give rise to income convergence. International trade
has allowed many emerging countries, especially China, to catch up with the developed world. But a
large part of the debate focuses on income inequality within countries, in particular within advanced
economies. The United States, for example, is widely seen as the country that has experienced the
most pronounced increase in income inequality, partly because competition from emerging economies
has destroyed jobs for medium and low skilled labor. But other industrialized countries also report
growing divergence between rich and poor citizens.
How should economic policy respond to the development of inequality? Clearly, the answer to this
question should be based on a sound understanding of the key factors driving inequality trends.
Various factors are likely to play a role. These include globalization, skill biased technological change,
economic reforms such as deregulation in financial markets, rolling back the welfare state or reforms
of the tax system, the growing role of telecommunication and the mass media, growing regional
disparities within countries and many more.
In this paper we revisit the question of how globalization influences income inequality within
countries. We distinguish between the impact of globalization on i) market income inequality and ii)
net income inequality, that is income inequality after taxes and transfers. As measures of income
inequality we employ the pre tax/transfer and the post tax/transfer Gini indices taken from Solt’s
(2016) Standardized World Income Inequality Database (V 5.1).
Globalization is a multifaceted concept. Measuring globalization is therefore challenging, and any
measure will inevitably be controversial. We use the KOF index of globalization (Dreher 2006a, and
Dreher et al. 2008) to measure globalization. Since summary measures like the KOF index do not
allow to distinguish between different ways in which globalization affects inequality we also employ
indicators for trade openness, financial openness, political and social globalization.
The Stolper-Samuelson mechanism predicts that global integration increases income inequality within
developed countries and decreases inequality within developing countries. However, various theories
of international trade and investment have described other channels how globalization may influence
income inequality. Overall, economic theory does not lead to unambiguous predictions about how
globalization affects inequality. The link between globalization and income inequality has been
examined in many empirical studies during the 1990s (Wood 1995; Cragg and Eppelbaum 1996;
Borjas et al. 1997; Edwards 1997; Feenstra and Hanson 1996, 1997, 1999; Barham and Boucher 1998;
Leamer 1998), and has been revisited by several scholars in the last decade (Goldberg and Pavcnik
2007; Dreher and Gaston 2008; Roine et al. 2009; Bergh and Nilsson 2010; Figini and Görg 2011;
Jaumotte et al. 2013; Dabla-Norris et al. 2015; Gozgor and Ranjan 2017; Dorn and Schinke 2018). The
results differ depending on the measures of globalization and income inequality used and the sample of
countries examined. The majority of studies using Gini indices as inequality measure, however, report
3
a positive relationship between globalization and income inequality (see Bergh and Nilsson 2010;
Jaumotte et al. 2013; Dabla-Norris et al. 2015; Gozgor and Ranjan 2017).
Our sample includes up to 140 countries over the period 1970-2014. Ordinary Least Squares (OLS)
results confirm the findings of previous studies, indicating a positive relationship between
globalization and income inequality. The results are sensitive to the sample of countries though. The
relationship between overall globalization and income inequality is positive within the full sample of
countries, within the sample of emerging and developing countries, and in our benchmark sample. The
latter excludes low-income countries, where the available data is often poor. However, the relationship
within our benchmark sample of countries lacks statistical significance when we exclude transition
countries from Eastern Europe and China. The OLS results, moreover, do not show that globalization
and income inequality are positively correlated within the sample of the most advanced economies.
Examining the causal effect of globalization on income inequality is challenging. We control for many
variables, but other unobserved omitted variables may still cause biased estimates by influencing both,
globalization and income inequality. Moreover, reverse causality may occur because changes in
income inequality are likely to influence policies which, in turn, affect globalization. Previous studies
do little to deal with the endogeneity of globalization and therefore mostly provide descriptive
evidence on the link between globalization and inequality. This descriptive evidence is useful but it is
important to ask whether there is a causal effect running from globalization to inequality. We deal with
the endogeneity problem of globalization by using an instrumental variable (IV) approach. Our IV is
predicted openness based on a gravity equation using a time-varying interaction of geography and
natural disasters as proposed by Felbermayr and Gröschl (2013). Predicted openness has been used as
an IV for trade openness (Frankel and Romer 1999, Felbermayr and Gröschl 2013) and the KOF index
of globalization (Potrafke 2013, Eppinger and Potrafke 2016). Another new study dealing with the
endogeneity problem between globalization and inequality is Lang and Tavares (2018). The authors
use another instrument that exploits the geographically diffusive character of globalization to examine
the effect of the KOF subindex of economic globalization on income inequality.
Our Two Stage Least Squares (2SLS) results do not support the view that globalization influences
income inequality for the full country sample and the sample of emerging and developing countries.
Within our benchmark sample of countries, which includes transition countries, we do find a positive
effect of globalization on income inequality. The coefficient of the 2SLS estimator is indeed larger
than the OLS estimator indicating that OLS results underestimate the effect of globalization on income
inequality. However, the positive effect of globalization on income inequality is driven by China and
transition countries from Eastern Europe. These countries have experienced a particularly fast change
towards globalization accompanied by a simultaneous privatization and economic transition process.
There was a huge impact on the income distribution which was hardly cushioned by either labor
market institutions or welfare states which characterize most advanced economies in the rest of the
world. 2SLS results within the most advanced economies do not suggest that globalization increased
income inequality.
Examining sub-indicators of globalization shows that effects of trade, political and social globalization
on income inequality are driven by globalization and rising income inequality in China. The results
suggest foreign direct investments (FDI) are the main driver of inequality enhancing effects of
globalization.
4
THEORETICAL PREDICTIONS 2Globalization has been shown to give rise to many benefits. Globalization has, in fact, brought
hundreds of million people out of poverty.1 It is, however, not guaranteed that everyone within each
country is better off when globalization is proceeding rapidly. Many studies have examined the effect
of globalization on income distribution within countries.
The classical theoretical framework for analyzing the relationship between globalization and
distributional market outcomes is the Heckscher-Ohlin (HO) model (Ohlin 1933). It explains the
inequality effect of globalization as a result of productivity differences and the relative factor
endowment of countries, and the extent to which individuals depend on labor or capital income.
Countries specialize in production in their relatively abundant factor and export these goods when they
open up to trade. The Stolper-Samuelson theorem (Stolper and Samuelson 1941) shows that the
subsequent trade-induced relative changes in product prices increase the real return to the factors used
intensively in the production of the factor-abundant export goods and decrease the returns to the other
factors. As a consequence, the country’s abundant production factors gain from openness, while scarce
factors lose. Most theories distinguish between the production factors labor and capital, or between
unskilled and skilled labor. Because capital and skilled labor are relatively abundant in advanced
economies, income inequality and income concentration towards the top incomes is expected to
increase. In developing countries, unskilled labor, which is intensively used in local production, would
benefit from economic openness by increasing wages. In developed countries income inequality would
therefore expected to decrease. Based on the HO-model assumptions, how globalization influences
income inequality depends on a country’s development level.
Since the 1990s, many studies have pointed to limitations of the standard HO-model implications and
suggested different ways in which globalization may affect income inequality.2 For instance, the
Heckscher-Ohlin-model relies on between sector reallocations and neglects within-sector shifts in
production and vertical specializations across countries. While offshoring and outsourcing of less-
skilled production within a sector decreases wages and bargaining power of less skilled workers in
advanced economies, the offshored and outsourced activities along the value chain may be relatively
skill-intensive from the perspective of the developing countries (see Feenstra and Hanson 1996, 1999).
Along the same lines Feenstra and Hanson (1997), for example, describe that FDI increases the
relative demand for skilled labor and the skill premium due to capital-skill-complementarities in the
developing world. In addition, as a response to the rising exposure to import competition, occupations
in traded sectors of the developing world may become more skill-intensive so that relative wages of
low-skilled workers decline (Cragg and Eppelbaum 1996). Income inequality may also rise because of
heterogeneous firms within sectors and countries and resulting wage premia for workers in firms
participating in international trade. Exporting firms are more productive than non-exporting firms and
pay higher wages to hire higher-skilled labor (see Manasse and Turrini 2001; Yeaple 2005; Munch and
Skaksen 2008; Verhoogen 2008; Egger and Kreickemeier 2009; Frias et al. 2012; Egger et al. 2013;
Sampson 2014). Helpman et al. (2010, 2017) predict a non-monotonic relationship between trade
1 Since the pioneering work of Samuelson (1939) about the gains of trade, several studies confirm that trade is welfare improving compared to autarky because of productivity gains and a new variety of products. See Arkolakis et al. (2012) and Costinot and Rodríguez-Clare (2014)
for surveys on the welfare gains released from new trade models. For empirical evidence on globalization and poverty see Bergh and
Nilsson (2015). 2 Many empirical studies have shown poor performance of the factor bias assumption of the Heckscher-Ohlin model. Leamer (1998), for
example, has found evidence for the Stolper-Samuelson mechanism in the 1970s only, while there is a lack of evidence in other decades.
Goldberg and Pavcnik (2007) show also poor performance of the model predictions in a large literature review about the relationship of trade and earnings in developing countries.
5
openness and wage inequality, where trade liberalization at first raises and later reduces wage
inequality.
Skill biased technological change is discussed as one of the main alternative explanations of the rising
skill premium and income inequality within countries. A large number of studies discusses how
innovations and new labor-saving technologies have eliminated low-skilled jobs through automation or
by upgrading the required skill levels (see Berman et al. 1994, 1998; Machin and van Reenen 1998;
Acemoglu 1998, 2002; Krusell et al. 2000; Card and DiNardo 2002). While technological innovations
primarily occurs in advanced economies, globalization may facilitate technology transfer across
borders, so that skill biased technological change also takes place in less developed countries (see
Berman and Machin 2000; Burstein et al. 2013). Rising import competition may also induce
investments in new technologies and accelerate technological shifts which decrease employment of
relatively unskilled workers (Bloom et al. 2016).
Political and social globalization are likely to influence income inequality as well. Political
globalization may lead countries to set common minimum standards and therefore enhance equality
within countries (Dreher 2006b). International migration may have diverse effects on the income
distribution in both the sending and destination country. Standard models of immigration suggest, for
example, that factors for which immigration is a good substitute will lose relatively to factors that are
complementary. If immigration increases the labor supply of unskilled workers, the wage gap between
high-skilled and low-skilled labor and income inequality is expected to increase (see Borjas et al.
1997). Changing social norms, which results from more interaction and integration around the world,
may also change the social acceptance of income inequality and therefore affect the behavior of
people, for example the wage bargaining of unions (Atkinson 1997).
Governments are likely to influence market outcomes by setting agreements, regulations and tariffs;
and design taxation and social policies to redistribute income from the rich to the poor. There are two
competing views on the relationship between globalization, welfare state policies and the impact on
income inequality: the race to the bottom hypothesis and the compensation hypothesis.
The “race-to-the-bottom” theory (e.g., Sinn 2003) describes that globalization puts a downward
pressure on tax rates and regulations for mobile factors such as tax rates on capital. Large welfare
states, moreover, attract unskilled and poor immigrants who want to benefit from redistribution. This
together gives rise to lower public spending and less redistribution. Globalization is thus expected to
increase income inequality after taxes and transfers. Experts emphasizing the ‘dark side of
globalization’ such as Stiglitz (2002) believe that globalization is responsible for diminishing
redistribution activities and shrinking social security systems.
In contrast, the compensation hypothesis (Rodrik 1998) predicts an expansion of the welfare state,
providing insurance against growing risks associated with globalization. A variant of this argument is
that losers from globalization may demand compensation. This theory predicts that globalization will
increase the size and scope of government. In a similar vein, Gozgor and Ranjan (2017) suggest that
when globalization raises market income inequality, policymakers who are interested in maximizing
the sum of welfare of all agents would increase redistribution. Meltzer and Richard (1981) describe
that higher inequality tends to increase redistribution, because the median voter would favor more
redistribution. The available empirical evidence on the globalization-welfare state nexus is mixed (e.g.,
Schulze and Ursprung 1999, Milanovic 2000, Ursprung 2008, Meinhard and Potrafke 2012, Kauder
and Potrafke 2015, Potrafke 2015).
6
DATA AND DESCRIPTIVE STATISTICS 33.1. VARIABLES
Income Inequality: Income inequality is measured by the Gini index. Gini indices are often based on
different sources and welfare definitons, and are therefore calculated in manifold ways (see Dorn 2016
for a discussion of income inequality databases). Many scholars consider the Luxembourg Income
Study (LIS) to be the best datasource for comparable data across countries. The LIS data are based on
microdata from national household income surveys and use a harmonized set of assumptions and
definitions to maximize its comparability. LIS data, however, are not collected every year and are
available for a small number of country-year observations only. Secondary source datasets3, as an
alternative, combine several data sources and data quality to achieve a higher coverage. The Gini
observations, however, are rarely comparable across countries and over time within a single country.
Scholars who use secondary source datasets often apply constant adjustment procedures to standardize
different Gini measures. Differences of Gini measures are likely to vary across countries and within
countries over time depending on the extent of taxation and transfer policies, patterns of consumption
and savings, family structure, and other factors. Constant adjustment procedures are therefore likely to
produce systematic errors in the data and estimation results. On the one hand, secondary source
datasets have a high coverage at the expense of comparability; on the other hand, harmonized
microdata sets such as LIS are more comparable, but at the expense of coverage over time and
countries: this reflects the trade-off between greater comparability and broader coverage of income
inequality datasets.
We use the Gini household income inequality indices of Solt’s (2016) Standardized World Income
Inequality Database (SWIID, v5.1).4 SWIID provides standardized Gini income inequality measures
for market and net outcomes based on the same concept, and thus allows comparing income inequality
before and after redistribution by taxation and transfers over time. We use both, the market and net
income Gini indices. Both Gini indices are quite strongly correlated (see Appendix Table B).
The high coverage across countries and time and the adjustment procedure for achieving a possible
comparability is the major reason for preferring SWIID to other secondary source datasets: SWIID
uses the LIS series as baseline. To predict missing observations in the LIS series, data from other
secondary data sources and statistical offices is standardized to LIS by using systematic relationships
of different Gini types and model-based multiple imputation estimates.5 When estimating missing
observations Solt (2016) considers that adjustments cannot be constant across countries and time by
relying on available information from proximate years in the same country as best solution, and on
information on countries in the same region and with similar development level as second best
solution. There are, however, concerns to the reliability of SWIID’s imputed estimates in data-poor
regions (see Ferreira et al. 2015, Jenkins 2015). We address these concerns in our benchmark sample
selection (see section 3.2).
3 The World Income Inequality Database (WIID) of UNU-WIDER and Branko Milanovic’s All-the-Ginis (ATG) database are, for example, large collections of secondary data sources and are often used in empirical research. 4 SWIID has been used in several empircal studies before (see Bergh and Nilsson 2010; Acemoglu et al. 2015). 5 The ratios of different Gini types are estimated by systematic relationships on the basis of eleven different combinations of welfare definitions and income scales (see Solt 2016).
7
Globalization: We measure globalization by the KOF globalization index 2016 (Dreher 2006a and
Dreher et al. 2008). The KOF index aggregates 23 variables to an overall index on a scale of one to
hundred, where higher values describe greater globalization. The index encompasses economic, social,
and political dimensions of globalization and has been used in some hundreds of studies (see
Potrafke 2015 for a survey on the consequences of globalization as measured by the KOF index).
Examples of countries with very low levels of globalization include Afghanistan, Ethiopia, Tanzania
and many other African countries (values below 40 in our sample). Globalization is pronounced in EU
member states. The most globalized countries are small EU member states such as Belgium, Ireland or
the Netherlands. Outside Europe, especially the small country of Singapore belongs to the group of the
most globalized countries.
We also employ sub-indicators of globalization for trade, financial, social and political globalization to
investigate whether various channels of globalization are differently related to inequality outcomes.
Data on trade are provided by the World Development Indicators (World Bank 2017).6 Trade openness
is measured as the sum of exports and imports of goods and services as a share of the gross domestic
product (GDP), import openness as imports as percentage of GDP; and export openness as exports as
share of GDP. We use data for financial, social and political globalization based on the KOF index
2016.7 As proxy for financial globalization, we use the KOF index on the inward and outward stock of
FDI as a percentage of GDP based on data of UNCTAD. The KOF sub-index of social globalization
includes eleven variables encompassing data on migration and tourism, and the spread of ideas,
information and culture. The political KOF sub-index includes four individual variables to proxy the
degree of the diffusion of government policies.8
Covariates: We follow previous studies by including the following control variables: real GDP per
capita9 of the new released Penn-World-Table version 9.0 by Feenstra et al. (2015), to control for any
distributional effect due to different income levels. Studies show that economic growth and the GDP
per capita level are related to globalization (see Dreher 2006a; Dreher et al. 2008) and to the
development of the income distribution over time (see Barro 2000; Forbes 2000; Berg et al. 2012).
Demographic changes and shifts in the size of population are also likely to influence both
globalization and the income distribution (OECD 2008). We therefore add the age dependency ratio
by the World Development Indicators (World Bank 2017) and the logarithm of total population of the
Penn-World-Table (Feenstra et al. 2015). The dependency ratio measures the proportion of dependents
per 100 of the working age population, where citizens younger than 15 or older than 64 are defined as
the dependent (typically non-productive) part. A higher share of dependent citizens is usually
associated with higher income inequality and higher redistribution activities within countries. Shifts in
the size of the population affect the dependency ratio as well as a country’s labor and skill endowment.
Covariates for robustness checks: The skill biased technological change is discussed as alternative
factor for explaining the rising skill premium and income inequality within countries. New
technologies, such as information and communication technologies, have given rise to improvements
in productivity and a disproportionately increase in the demand for capital and skilled-labor by
eliminating unskilled jobs through automation or upgrading the required skill level of jobs (see
6 Trade data released from the World Development Indicators is used as variable in the overall KOF index of globalization. 7 The KOF globalization index includes a sub-index for economic globalization, encompassing variables on trade and financial openness.
Empirical literature has shown that trade openness and financial openness might have different impacts on income inequality (see Jaumotte et
al. 2013; Dabla-Norris et al. 2015). We consider potential differences in the impact of various economic sub-indicators by using indicators for trade openness and financial openness separately. 8 Summary statistics and correlations are reported in the Appendix. In the cross section, globalization indicators are positively related to each
other (see Appendix Table B). Political globalization and trade indicators, however, are negatively correlated in the cross section. 9 We use the expenditure-side real GDP at chained PPPs to compare relative living standards across countries and over time.
8
Berman et al. 1994, 1998; Machin and van Reenen 1998; Acemoglu 1998, 2002; Krusell et al. 2000;
Card and DiNardo 2002). The technological spread around the world is closely related to globalization
(Berman and Machin 2000; Burstein et al. 2013; Bloom et al. 2016). Neglecting the skill biased
technological change in empirical estimations, therefore, may give rise to an omitted variable bias.
Many empirical studies investigating the globalization-inequality-nexus do not take the technology
mechanism into account. Others use investments in Information and Communication Technologies
(ICT) as proxy for technology. Investments in new technologies, however, may be induced by
globalization shocks (see Bloom et al. 2016). We control for the skill biased technological progress by
using ICT capital stock estimates of Jorgenson and Vu (2017)10
as a proxy for the technological
change which is driven by information and communication technologies (section 5.5.3). The ICT
capital stock has already been used by Jaumotte et al. (2013) and Dabla-Norris et al. (2015) and is
widely accepted in the technology-growth empirical literature. We also include capital intensity, as
measured by the capital stock in relation to the labor employed within a country, to consider effects of
capital-skill complementarities on globalization and inequality (Krusell et al. 2000). The capital stock
of structures and equipment and the number of persons engaged are taken from the Penn-World-Table
9.0 (Feenstra et al. 2015). To deal with the effect of varying human capital endowments of the
population on globalization and skill premia, we include the human capital index of the Penn-World-
Table 9.0, based on an assumed rate of return to education and the average years of schooling. We
include the ICT capital stock and the human capital index in the robustness section as these covariates
are not available for the full sample of 140 countries.
We also include institutional variables, which might influence globalization and income inequality.
We use the real output-share of government consumption to deal with simultaneous effects of
government expenditures on globalization and the income distribution of a country (Feenstra et al.
2015). From the Economic Freedom Index by Gwartney et al. (2015) we use the overall index of
economic freedom, the subindex of overall regulation (including business, credit and labor market
regulation) and the sub-index on the regulation in the labor market itself (including indicators such as
minimum wages, collective bargaining centralization, or hiring, firing and hours regulations). More
market-oriented policies are, for example, expected to be correlated with globalization and inequality.
Higher regulated labor markets might promote equality at the expense of globalization and growth.
The data on economic freedom and labor market institutions is not available for the full set of 140
countries.
3.2. DATA AND SUBSAMPLES
We use an unbalanced panel for up to 140 countries over the period 1970-2014. The data is averaged
over five years in nine periods between 1970 and 2014. We use five year averages to reduce the
possibility that outliers, measurement errors, missing observations in individual years and short term
movements in the business cycle influence the inferences.
Next to our FULL SAMPLE of 140 countries, we use a sample for high and middle income countries
as our BENCHMARK SAMPLE. High and middle income countries are classified by the criterion of
the World Bank as of 2015, including 82 countries having a GNI per capita of USD 4,126 or more.
The 58 countries in our dataset below the GNI per capita of USD 4,126 threshold are classified as
lower income countries. Lower income countries are more likely to have few period-observations per
10 We thank Dale Jorgenson and Khuong Vu for providing their ICT capital stock estimates.
9
country due to a lack of data availability than high and middle income countries (see Appendix, Figure
A). Data in lower income countries are, moreover, more likely to be subject of measurement errors.
There are serious concerns about the quality of the income inequality data from less developed
countries.11
Jenkins (2015), for example, shows that source data on inequality with high quality, in
which the income concept and the survey can be verified, is rare in less developed and in particular in
Subsaharan African countries. The lack of data quality is also reflected in the imputed Gini estimates
in SWIID as the imputation variability of imputed country-period observations is large in some
countries, especially in lower income countries (see Ferreira et al. 2015, Jenkins 2015). To address
potential biases in the estimates because of measurement error, our benchmark sample excludes the 58
lower income countries compared to the full sample. 30 of the 58 excluded countries are Subsaharan
African countries.
Development levels: Some theories predict different outcomes on the globalization income inequality
nexus depending on the development level of countries. Next to our full and benchmark sample of our
baseline regressions, we therefore use additional subsamples for the most ADVANCED
ECONOMIES, as well as EMERGING MARKETS & DEVELOPING ECONOMIES (EMD).12
To
distinguish between advanced economies and emerging markets and developing economies we apply
the classification of the International Monetary Fund (IMF 2016). The IMF-classification is based on
per capita income level, export diversification and the degree of integration into the global financial
system.13
The 34 countries fulfilling the criterion of the advanced economies sample are also included
in our benchmark sample (high and middle income countries). The subsample of emerging markets
and developing economies includes 106 countries released from both income groups, high and middle
income countries and lower income countries.
Transition economies: Transition economies have experienced a large shift in globalization since the
Fall of the Iron Curtain. During the simultaneous period of transition toward market economies,
however, transition countries have also experienced many structural and institutional changes in
political institutions and their economy, such as privatizations of state owned enterprises,
deindustrialization, shrinking and reforming of the public sector, or institutional liberalizations. The
systemic change and restructuring of the economy and governance may also have influenced the speed
of globalization and the rise of income inequality (see Milanovic 1999; Milanovic and Ersado 2011;
Aristei and Perugini 2014). We therefore use a sample of the (new) European Union member states
from Central and Eastern Europe (EAST EU) and other transition countries such as China.
Unbalanced panel: The overall panel of 140 countries is unbalanced: the number of country-period
observations varies across countries and 5-year-periods (see Appendix, Figure A shows the
distribution of country-period observations). Some countries have observations for many periods;
some have observations for just two periods. There are, for example, fewer observations in periods
before the 1990s and the period 2010-2014. The lack of observations in these periods is, however,
primarily based on the lack of data availability within the sample of lower income countries and
11
There are several reasons for poor inequality and poverty measures in low-income countries. On the one hand, official statistical data of
good quality on income distribution is often rare in developing countries as they have high shares of informal working participants and self-
employed in business and agriculture. On the other hand, reliable survey data on income or consumption is also rare. Surveys in developing
countries might have a sample bias when some parts of the population are systematically not surveyed, for example unskilled people because of literacy problems or people who live in rural regions. Responders, moreover, might not report the truth as they might fear that information
is provided to government authorities, for example tax institutions. The lack of political will, unskilled staff, and high turnover in statistical
offices are also reasons why data are not collected consistently and continually (see, for example, Deaton 2005). 12 See Appendix for the classification of countries by development levels. 13 Oil exporters that have high per capita GDP, for example, would not make the advanced classification because around 70% of its exports
are oil.
10
countries such as members of the former Republic of Yugoslavia, for example Croatia and Slovenia, or
successor states of the former Soviet Union such as the Russian Federation or the Baltic countries. We
investigate the robustness of the relationship between globalization and income inequality using
different samples. In our robustness checks (section 5.5.2), we focus on three subsamples requiring a
minimum of period observations by each country. By doing so we make sure that the estimates
measuring how globalization influences income inequality are based on several within variations by
each country. We use a LARGE sample of 117 countries having at least four period observations for
each country, an INTERMEDIATE sample of 70 countries having at least six period observations, and
a SMALL sample of 56 countries having at least seven period observations. The intermediate and
small samples primarily include high and middle income countries (of our benchmark sample) as
lower income countries are more likely to have a lack of data availability.
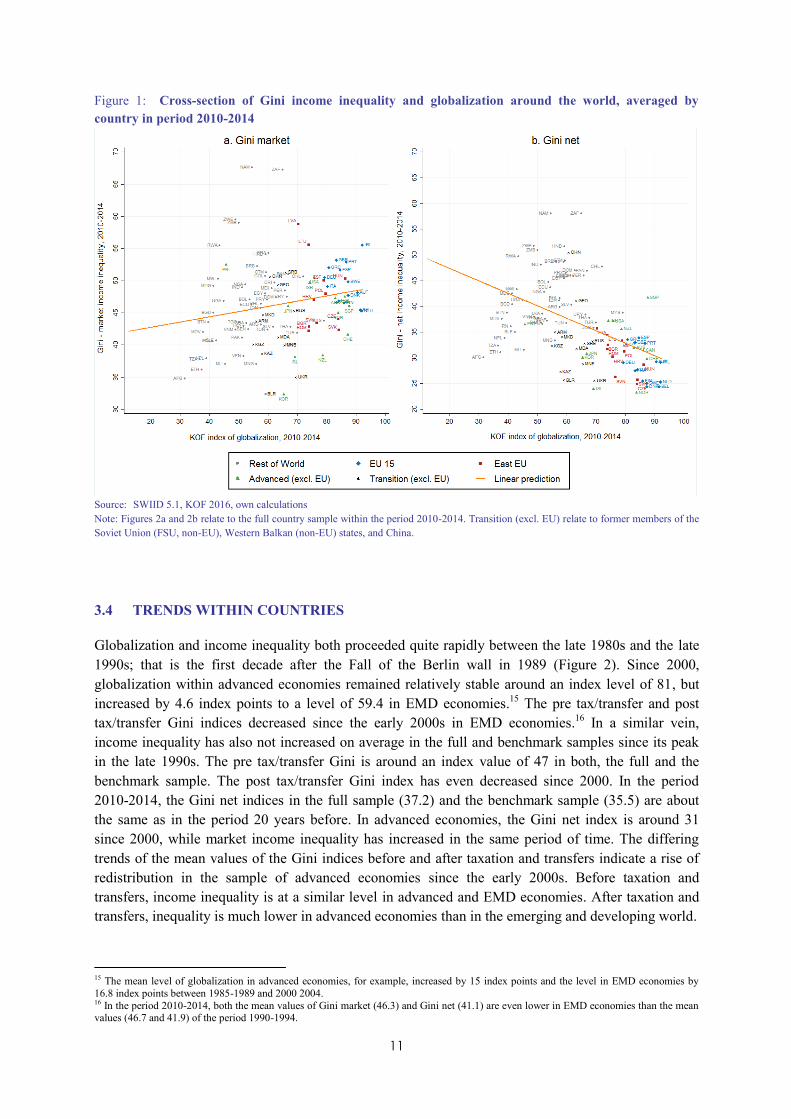
3.3. GLOBALIZATION AND INCOME INEQUALITY ACROSS COUNTRIES
We examine the correlation between globalization and income inequality across countries: income
inequality before taxes and transfers is hardly correlated with globalization (see Figure 1a for the five
year period 2010-2014). More globalized countries tend to have somewhat larger market inequality
outcomes in the last period of observation 2010-2014. The coefficient of correlation is 0.08.
Net income inequality in highly globalized countries is lower than in less globalized countries. The
correlation coefficient between the KOF globalization index and the Gini market index is -0.24,
indicating that more developed countries have larger welfare states. EU member states and other
advanced economies belong to the most globalized countries and have the lowest levels of income
inequality after redistribution around the world. This suggests why there is a negative relationship
between globalization and after taxation and transfer income inequality across countries (see Figure 1b
for the five year period 2010-2014).14
14 For cross country correlations of all periods, see Appendix Table B.
11
Figure 1: Cross-section of Gini income inequality and globalization around the world, averaged by
country in period 2010-2014
Source: SWIID 5.1, KOF 2016, own calculations
Note: Figures 2a and 2b relate to the full country sample within the period 2010-2014. Transition (excl. EU) relate to former members of the
Soviet Union (FSU, non-EU), Western Balkan (non-EU) states, and China.
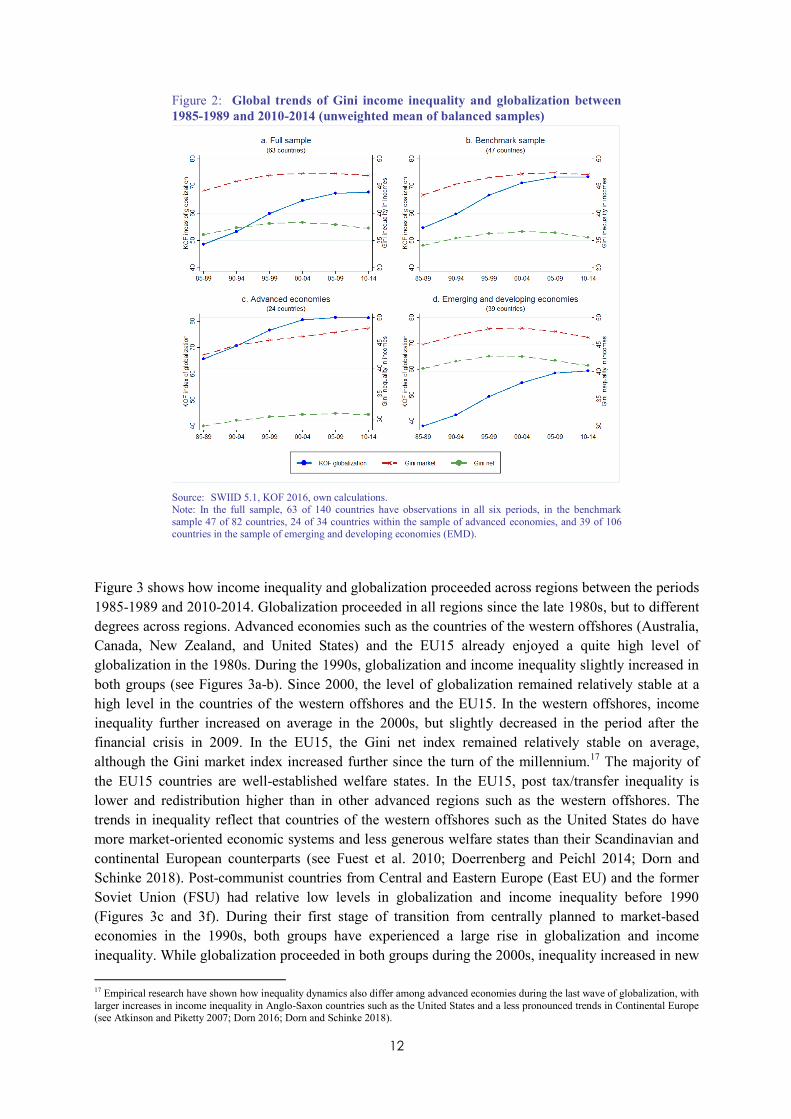
3.4 TRENDS WITHIN COUNTRIES
Globalization and income inequality both proceeded quite rapidly between the late 1980s and the late
1990s; that is the first decade after the Fall of the Berlin wall in 1989 (Figure 2). Since 2000,
globalization within advanced economies remained relatively stable around an index level of 81, but
increased by 4.6 index points to a level of 59.4 in EMD economies.15
The pre tax/transfer and post
tax/transfer Gini indices decreased since the early 2000s in EMD economies.16
In a similar vein,
income inequality has also not increased on average in the full and benchmark samples since its peak
in the late 1990s. The pre tax/transfer Gini is around an index value of 47 in both, the full and the
benchmark sample. The post tax/transfer Gini index has even decreased since 2000. In the period
2010-2014, the Gini net indices in the full sample (37.2) and the benchmark sample (35.5) are about
the same as in the period 20 years before. In advanced economies, the Gini net index is around 31
since 2000, while market income inequality has increased in the same period of time. The differing
trends of the mean values of the Gini indices before and after taxation and transfers indicate a rise of
redistribution in the sample of advanced economies since the early 2000s. Before taxation and
transfers, income inequality is at a similar level in advanced and EMD economies. After taxation and
transfers, inequality is much lower in advanced economies than in the emerging and developing world.
15 The mean level of globalization in advanced economies, for example, increased by 15 index points and the level in EMD economies by
16.8 index points between 1985-1989 and 2000 2004. 16 In the period 2010-2014, both the mean values of Gini market (46.3) and Gini net (41.1) are even lower in EMD economies than the mean values (46.7 and 41.9) of the period 1990-1994.
12
Figure 2: Global trends of Gini income inequality and globalization between
1985-1989 and 2010-2014 (unweighted mean of balanced samples)
Source: SWIID 5.1, KOF 2016, own calculations. Note: In the full sample, 63 of 140 countries have observations in all six periods, in the benchmark
sample 47 of 82 countries, 24 of 34 countries within the sample of advanced economies, and 39 of 106 countries in the sample of emerging and developing economies (EMD).
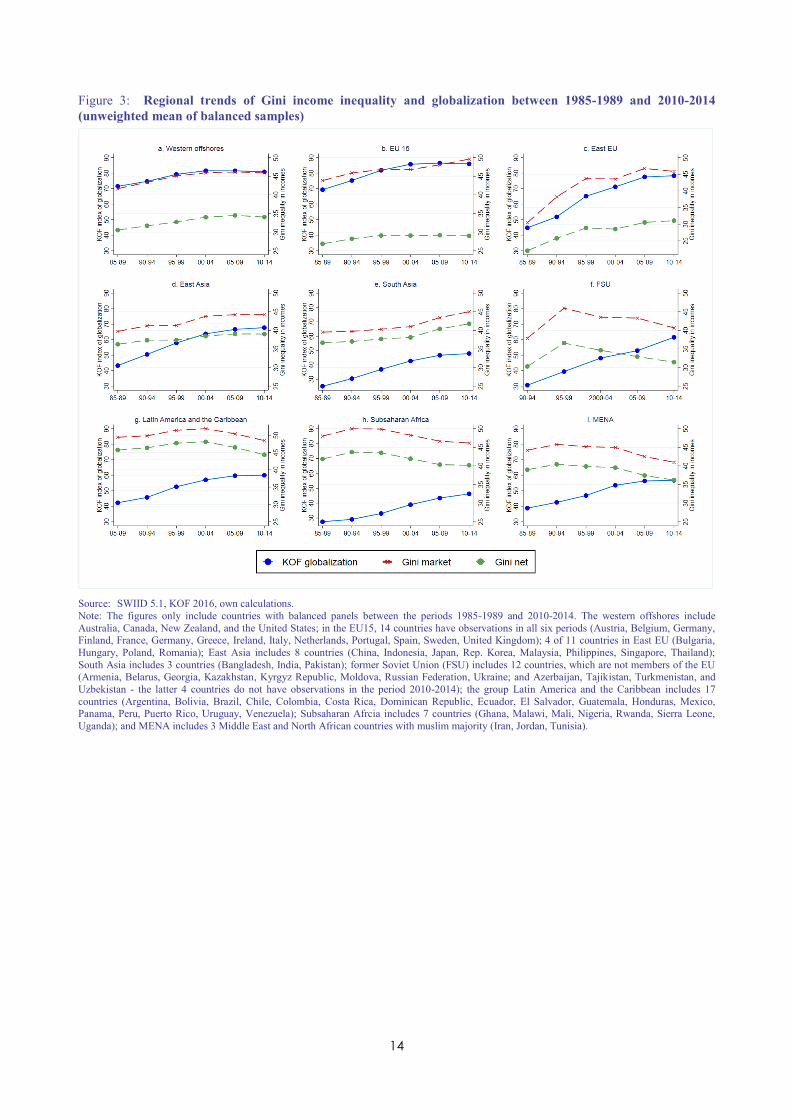
Figure 3 shows how income inequality and globalization proceeded across regions between the periods
1985-1989 and 2010-2014. Globalization proceeded in all regions since the late 1980s, but to different
degrees across regions. Advanced economies such as the countries of the western offshores (Australia,
Canada, New Zealand, and United States) and the EU15 already enjoyed a quite high level of
globalization in the 1980s. During the 1990s, globalization and income inequality slightly increased in
both groups (see Figures 3a-b). Since 2000, the level of globalization remained relatively stable at a
high level in the countries of the western offshores and the EU15. In the western offshores, income
inequality further increased on average in the 2000s, but slightly decreased in the period after the
financial crisis in 2009. In the EU15, the Gini net index remained relatively stable on average,
although the Gini market index increased further since the turn of the millennium.17
The majority of
the EU15 countries are well-established welfare states. In the EU15, post tax/transfer inequality is
lower and redistribution higher than in other advanced regions such as the western offshores. The
trends in inequality reflect that countries of the western offshores such as the United States do have
more market-oriented economic systems and less generous welfare states than their Scandinavian and
continental European counterparts (see Fuest et al. 2010; Doerrenberg and Peichl 2014; Dorn and
Schinke 2018). Post-communist countries from Central and Eastern Europe (East EU) and the former
Soviet Union (FSU) had relative low levels in globalization and income inequality before 1990
(Figures 3c and 3f). During their first stage of transition from centrally planned to market-based
economies in the 1990s, both groups have experienced a large rise in globalization and income
inequality. While globalization proceeded in both groups during the 2000s, inequality increased in new
17 Empirical research have shown how inequality dynamics also differ among advanced economies during the last wave of globalization, with
larger increases in income inequality in Anglo-Saxon countries such as the United States and a less pronounced trends in Continental Europe (see Atkinson and Piketty 2007; Dorn 2016; Dorn and Schinke 2018).
13
EU member countries from Central and Eastern Europe18
, but decreased in the other countries of the
former Soviet Union such as the Russian Federation (see Gorodnichenko et al. 2010; Aristei and
Perugini 2014). Countries from East and South Asia have, on average, experienced a relative constant
rise in globalization and income inequality between the periods 1985-1989 and 2010-2014 (Figures 3d
and 3e). The rise in Gini inequality, however, is more pronounced in South Asian countries such as
India since the 2000s. The Asian subsamples do have higher mean Gini indices than advanced
economies from Europe or the western offshores. Country samples from Latin America and the
Caribbean, Subsaharan Africa, and the Middle East and North Africa (MENA) also belong to regions
with high Gini inequality indices. Globalization and income inequality are negatively related in Latin
America and the Caribbean, Subsaharan Africa, and the MENA countries since the mid-1990s -
income inequality was decreasing, while globalization was still on the rise (Figures 3g-i).
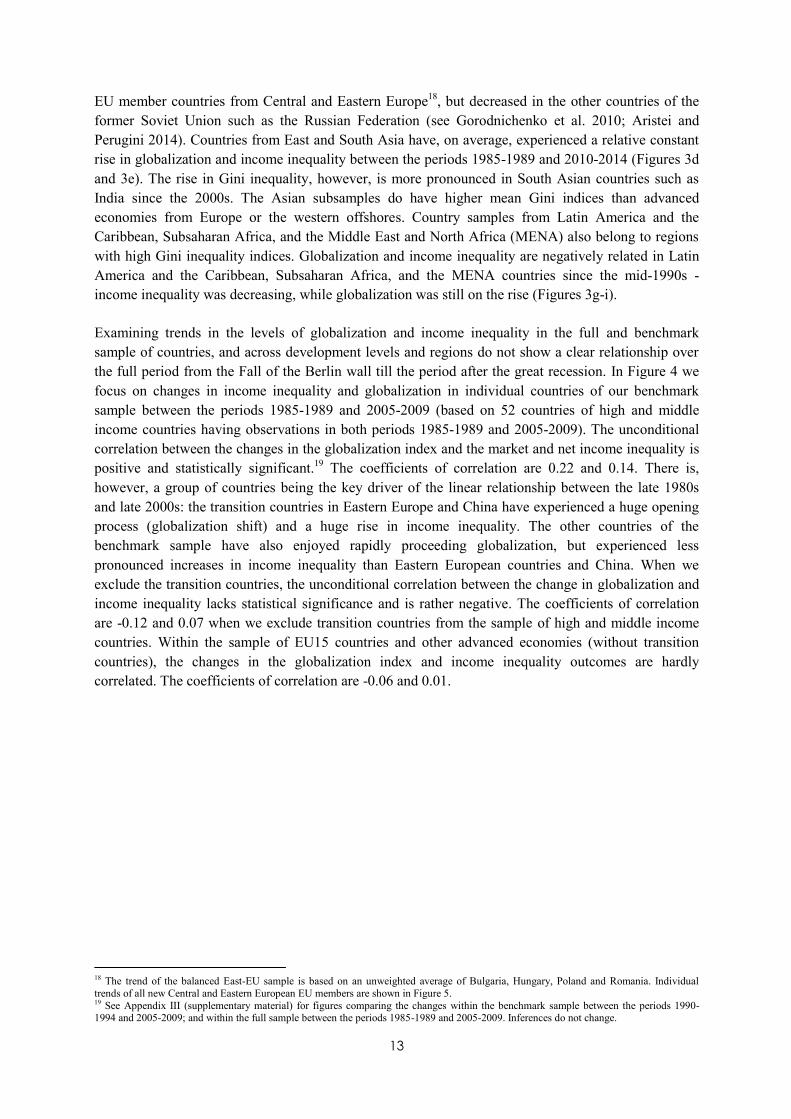
Examining trends in the levels of globalization and income inequality in the full and benchmark
sample of countries, and across development levels and regions do not show a clear relationship over
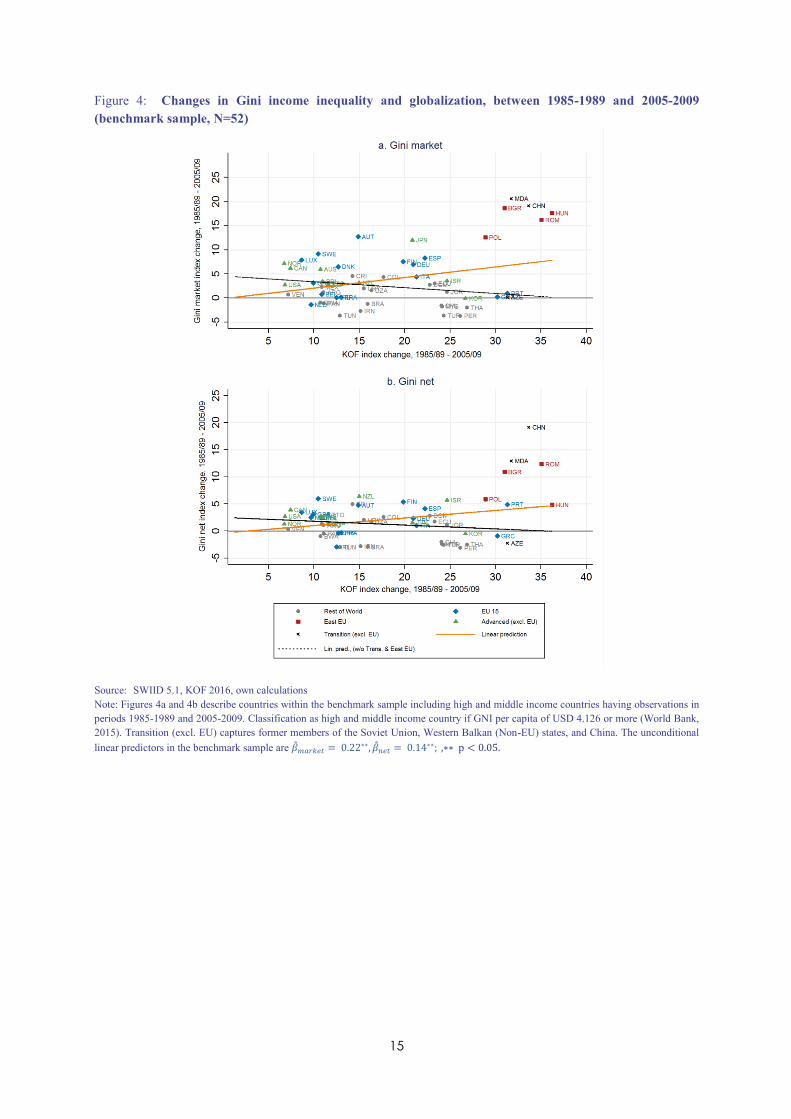
the full period from the Fall of the Berlin wall till the period after the great recession. In Figure 4 we
focus on changes in income inequality and globalization in individual countries of our benchmark
sample between the periods 1985-1989 and 2005-2009 (based on 52 countries of high and middle
income countries having observations in both periods 1985-1989 and 2005-2009). The unconditional
correlation between the changes in the globalization index and the market and net income inequality is
positive and statistically significant.19
The coefficients of correlation are 0.22 and 0.14. There is,
however, a group of countries being the key driver of the linear relationship between the late 1980s
and late 2000s: the transition countries in Eastern Europe and China have experienced a huge opening
process (globalization shift) and a huge rise in income inequality. The other countries of the
benchmark sample have also enjoyed rapidly proceeding globalization, but experienced less
pronounced increases in income inequality than Eastern European countries and China. When we
exclude the transition countries, the unconditional correlation between the change in globalization and
income inequality lacks statistical significance and is rather negative. The coefficients of correlation
are -0.12 and 0.07 when we exclude transition countries from the sample of high and middle income
countries. Within the sample of EU15 countries and other advanced economies (without transition
countries), the changes in the globalization index and income inequality outcomes are hardly
correlated. The coefficients of correlation are -0.06 and 0.01.
18 The trend of the balanced East-EU sample is based on an unweighted average of Bulgaria, Hungary, Poland and Romania. Individual
trends of all new Central and Eastern European EU members are shown in Figure 5. 19 See Appendix III (supplementary material) for figures comparing the changes within the benchmark sample between the periods 1990-1994 and 2005-2009; and within the full sample between the periods 1985-1989 and 2005-2009. Inferences do not change.
14
Figure 3: Regional trends of Gini income inequality and globalization between 1985-1989 and 2010-2014
(unweighted mean of balanced samples)
Source: SWIID 5.1, KOF 2016, own calculations.
Note: The figures only include countries with balanced panels between the periods 1985-1989 and 2010-2014. The western offshores include
Australia, Canada, New Zealand, and the United States; in the EU15, 14 countries have observations in all six periods (Austria, Belgium, Germany, Finland, France, Germany, Greece, Ireland, Italy, Netherlands, Portugal, Spain, Sweden, United Kingdom); 4 of 11 countries in East EU (Bulgaria,
Hungary, Poland, Romania); East Asia includes 8 countries (China, Indonesia, Japan, Rep. Korea, Malaysia, Philippines, Singapore, Thailand);
South Asia includes 3 countries (Bangladesh, India, Pakistan); former Soviet Union (FSU) includes 12 countries, which are not members of the EU (Armenia, Belarus, Georgia, Kazakhstan, Kyrgyz Republic, Moldova, Russian Federation, Ukraine; and Azerbaijan, Tajikistan, Turkmenistan, and
Uzbekistan - the latter 4 countries do not have observations in the period 2010-2014); the group Latin America and the Caribbean includes 17
countries (Argentina, Bolivia, Brazil, Chile, Colombia, Costa Rica, Dominican Republic, Ecuador, El Salvador, Guatemala, Honduras, Mexico, Panama, Peru, Puerto Rico, Uruguay, Venezuela); Subsaharan Afrcia includes 7 countries (Ghana, Malawi, Mali, Nigeria, Rwanda, Sierra Leone,
Uganda); and MENA includes 3 Middle East and North African countries with muslim majority (Iran, Jordan, Tunisia).
15
Figure 4: Changes in Gini income inequality and globalization, between 1985-1989 and 2005-2009
(benchmark sample, N=52)
Source: SWIID 5.1, KOF 2016, own calculations
Note: Figures 4a and 4b describe countries within the benchmark sample including high and middle income countries having observations in
periods 1985-1989 and 2005-2009. Classification as high and middle income country if GNI per capita of USD 4.126 or more (World Bank,
2015). Transition (excl. EU) captures former members of the Soviet Union, Western Balkan (Non-EU) states, and China. The unconditional
linear predictors in the benchmark sample are 𝑚𝑎𝑟𝑘𝑒𝑡 = 0.22∗∗, 𝑛𝑒𝑡 = 0.14∗∗; ,∗∗ p < 0.05.
16
4 EMPIRICAL ANALYSIS
4.1. OLS PANEL FIXED EFFECTS MODEL
We estimate the baseline panel model by OLS, where countries are described by i and 5-year-periods
by 𝜏:
𝑦𝑖,𝜏 = 𝛽1 × 𝐺𝐿𝑂𝐵𝑖,𝜏 + 𝚯′ × 𝝌𝒊,𝝉 + 𝜐𝑖 + 𝜐𝜏 + 휀𝑖,𝜏 . (1)
𝑦𝑖,𝜏 describes the Gini index value of country i in period 𝜏 . The explanatory variable 𝐺𝐿𝑂𝐵𝑖,𝜏
describes the KOF index of globalization of country i in period 𝜏. For robustness tests, the overall
KOF index is replaced by sub-indicators of globalization in equation (1). The vector 𝝌𝒊,𝝉 includes
control variables as described in section 3.1, 𝜐𝑖 describes the country fixed effects, 𝜐𝜏 describes the
fixed period effects, and 휀𝑖,𝜏 is the error term. All variables are included as averages in each of the
nine periods (t = 1,...,9).
By estimating OLS in a fixed effects (FE) model we exploit the within-country variation over time,
eliminating any observable and unobservable country-specific time-invariant effects. We also include
fixed time effects to control for other confounding factors (e.g. period specific shocks) that influence
multiple countries simultaneously. We use standard errors robust to heteroscedasticity.
4.2. 2SLS PANEL IV MODEL
4.2.1 Endogeneity problem and IV approach
There are two reasons for potential endogeneity of the globalization variable in our model: omitted
variable bias and reverse causality.
We have included many control variables, but other unobserved omitted variables may give rise to
biased estimates. The omitted variable bias indicates that there is still a third (or more) variable(s)
which both influence(s) globalization and income inequality. For example, increasing mobility may
induce countries to reduce (capital) taxes and cut welfare benefits, which in turn, will influence
disposable income and probably also employment. If competition from countries with cheap labor
induces companies in high income countries to specialize in the production of high tech goods and
services, which requires highly skilled labor, this will have an impact on the skill premium. It is
difficult to disentangle these effects from the ‘direct’ influence of globalization on income inequality,
that is the influence of globalization, given other factors.
Secondly, reverse causality may occur because changes in income inequality are likely to influence
policies which affect globalization. The debate on the Transatlantic Trade and Investment Partnership
(TTIP), for instance, is also influenced by the perception that gains from trade may be distributed
17
rather unevenly. Shifts in the income distribution within a country may also have direct effects on the
globalization level of the country, for example if more or less people are able to travel, to buy more
expensive import-goods or to make international investments and savings.
To deal with the endogeneity problem of globalization, we use predicted openness based on a gravity
equation as an IV. Frankel and Romer (1999) apply predicted openness in a cross-sectional approach.
We would like to exploit exogenous time variation in predicted openness using the IV in a panel model
and controlling for unobserved country effects (see Feyrer 2009; Felbermayr and Gröschl 2013). We
employ the exogenous component of variations in openness predicted by geography and time-varying
natural disasters in foreign countries, as proposed by Felbermayr and Gröschl (2013) for a panel data
model, as an IV for globalization. Based on a modified gravity framework, Felbermayr and
Gröschl (2013) show that the incidence of natural disasters such as earthquakes, hurricanes or volcanic
eruptions in one country influences openness of its trading partners, depending on the two countries’
geographic proximity.20
An earthquake hitting Mexico, for example, will increase international trade
and financial flows of other countries with Mexico and immigration from Mexico. The rise in a
country’s globalization level will be larger, the closer a country is located to Mexico. Gravity model
based predicted openness variables have been shown to be a relevant IV for the KOF globalization
index (Potrafke 2013; Eppinger and Potrafke 2016) and trade openness (see Frankel and Romer 1999;
Felbermayr and Gröschl 2013).
4.2.2 IV
The predicted openness by Felbermayr and Gröschl is constructed in two steps:
First, bilateral openness is predicted by a reduced21
gravity model using Poisson Pseudo Maximum
Likelihood (PPML) estimation and standard errors clustered by country pairs. Bilateral openness is
regressed on variables exogenous to income inequality such as large scale natural disasters in foreign
countries j, interactions of the incidence of natural disasters in foreign countries j and bilateral
geographic variables, or population. Felbermayr and Gröschl (2013) estimate
𝑡𝑖𝑗 = exp [𝛿1 × 𝐷𝑡
𝑗 + 𝜸′ × 𝚭𝒕𝒊𝒋 + 𝝀′ × (𝚽𝒕
𝒊𝒋 × 𝐷𝑡𝑗) + 𝜐𝑖 + 𝜐𝑗 + 𝜐𝑡 ] + 휀𝑡
𝑖𝑗 , (2)
where 𝚭𝒕𝒊𝒋
= [ln 𝑃𝑂𝑃𝑡𝑖 ; ln 𝑃𝑂𝑃𝑡
𝑗 ; ln 𝐷𝐼𝑆𝑇𝑖𝑗; 𝐵𝑂𝑅𝑖𝑗] includes exogenous controls such as population
(POP) in countries i and j in year t, and the bilateral geographic variables distance DIST, and a
common border dummy BOR, based on Frankel and Romer (1999). 𝐷𝑡𝑗 denotes exogenous large scale
natural disasters in country j, while 𝚽𝒕𝒊𝒋
= [ln 𝐹𝐼𝑁𝐷𝐼𝑆𝑇𝑡𝑗; ln 𝐴𝑅𝐸𝐴𝑗; ln 𝑃𝑂𝑃𝑡
𝑗; 𝐵𝑂𝑅𝑖𝑗] describes the
exogenous variables interacted with 𝐷𝑡𝑗, such as the international financial remoteness FINDIST, the
surface area AREA, or population POP of country j.22
Country and time fixed effects23
are captured by
𝜐𝑖, 𝜐𝑗, 𝜐𝑡, while 휀𝑡𝑖𝑗
accounts for the idiosyncratic error.
20 For example, the effect of an earthquake in Mexico will be stronger for international transactions of Honduras or the United States than for India. 21 The reduced form of the gravity model differs from standard (trade) gravity models by excluding variables that would be correlated to
income inequality such as GDP per capita. 22 As large scale natural disasters may hit both bordering countries, an interaction of disasters and the common border dummy is included.
Interactions of the disaster variable with surface area and population in country j consider the fact that economic and population density
matters for the aggregate damage caused by large scale natural disasters. The interaction of disasters with financial remoteness is motivated by related literature (see Felbermayr and Gröschl 2013).
18
We follow the preferred approach by Felbermayr and Gröschl (2013) and use truly exogenous “large”
scale natural disasters (as 𝐷𝑡𝑗) to make sure that a disaster is of a sufficiently large dimension and not
caused by local determinants or the development level of the country, but rather by exogenous global
phenomena. This classification of natural disasters includes “large” earthquakes, droughts, storms,
storm floods, and volcanic erruptions that (i) caused 1,000 or more deaths; or (ii) injured 1,000 or more
people; or (iii) affected 100,000 or more people. In our robustness checks, we use alternative
definitions of disasters to construct the instrument, such as a broader specification of disasters that
includes all kinds of natural disasters24
or counting all sizes of disasters (see section 5.5.3).
We use an exogenous proxy for multilateral openness Ωi,t by aggregating the obtained predicted
openness values 𝑡𝑖𝑗
of country i over all bilateral country-pairs and years t:
Ωi,t = ∑ 𝑡𝑖𝑗
𝑖≠𝑗 . (3)
25
Based on our underlying data26
we obtain values from 1966 to 2008. Averaging over nine periods 𝜏
and using one period lags of predicted openness Ωi,τ−1, we obtain our instrument for 𝐺𝐿𝑂𝐵𝑖, 𝜏 in
equation (1).
Relevance of the instrument: The relevance of the IV predicted openness Ωi,τ−1 depends on its
conditional correlation with the KOF globalization index values 𝐺𝐿𝑂𝐵𝑖 , 𝜏. The first stage regression
has the following form:
𝐺𝐿𝑂𝐵𝑖 , 𝜏 = 𝛼1 × Ωi,τ−1 + 𝝋′ × 𝝌𝒊,𝝉 + 𝜐𝑖 + 𝜐𝜏 + 휀𝑖,𝜏 . (4)
The model is estimated by applying the FE estimator, controlling for any time-invariant country
characteristics, and using robust standard errors. The first stage also includes period dummies to
control for common period effects.
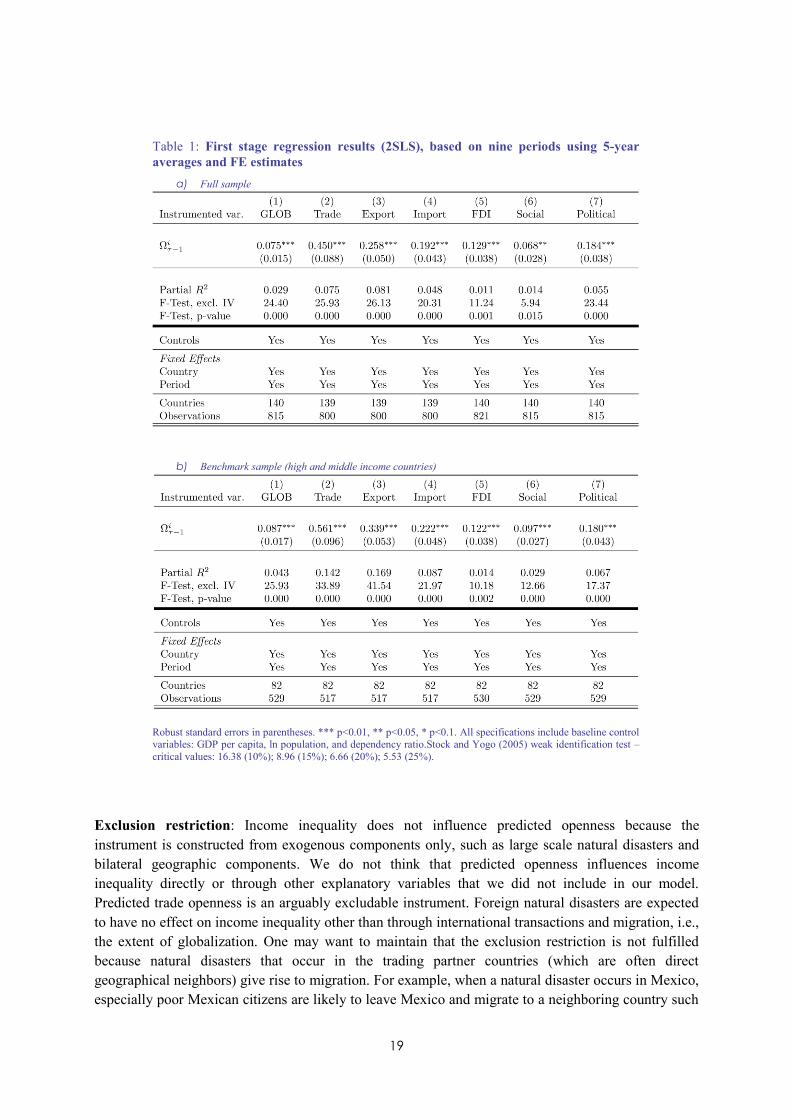
The first stage regression results in Table 1 show that the IV is relevant. Our predicted openness
variable is qualitatively good and correlates positively and significantly with the overall KOF
globalization index (GLOB) and the sub-indicators of globalization (Trade, Exports, Imports, FDI,
social and political openness). The F-statistics on the excluded instrument are well above Staiger and
Stock’s (1997) rule of thumb (F≥10) and the 10 % critical value (F≥16.38) of the weak instrument test
by Stock and Yogo (2005) for the overall KOF index and four out of six other specifications of sub-
indicators (trade openness, export openness, import openness, and political globalization). In the
specifications for FDI and the social globalization index, the F-statistic is above the 15% (F≥8.96) and
25% (F≥5.53) critical values. The partial R2 of lagged predicted openness ranges between 1.1% in the
specification for FDI and 16.9% in the specification for export openness.
23 Time fixed effects also account for improved reporting of natural disasters and its consequences (see Felbermayr and Gröschl 2013). 24 Natural disasters caused by extreme temperature, floods, (mud)slides, or wildfires are also included in this extended definition of natural disasters. Epidemics are not included in any of our classifications. 25 The instrument in equation 3 is constructed based on all available trade partners in the raw data following Felbermayr and Gröschl (2013).
The sample includes more countries than our full sample of 140 countries. 26 The trade data originally comes from the IMF’s Direction of Trade Statistics (DoTS), nominal GDPs and populations are taken from Word
Development Indicators (WDI) and Barbieri (2002), and the geographic variables are from the CEPII’s Geographic and Bilateral Distance
Database. Data on natural disasters is taken from the Emergency Events database (EM-DAT), and data on financial centers is based on Rose and Spiegel (2009).
19
Table 1: First stage regression results (2SLS), based on nine periods using 5-year
averages and FE estimates
a) Full sample
b) Benchmark sample (high and middle income countries)
Robust standard errors in parentheses. *** p<0.01, ** p<0.05, * p<0.1. All specifications include baseline control variables: GDP per capita, ln population, and dependency ratio.Stock and Yogo (2005) weak identification test –
critical values: 16.38 (10%); 8.96 (15%); 6.66 (20%); 5.53 (25%).
Exclusion restriction: Income inequality does not influence predicted openness because the
instrument is constructed from exogenous components only, such as large scale natural disasters and
bilateral geographic components. We do not think that predicted openness influences income
inequality directly or through other explanatory variables that we did not include in our model.
Predicted trade openness is an arguably excludable instrument. Foreign natural disasters are expected
to have no effect on income inequality other than through international transactions and migration, i.e.,
the extent of globalization. One may want to maintain that the exclusion restriction is not fulfilled
because natural disasters that occur in the trading partner countries (which are often direct
geographical neighbors) give rise to migration. For example, when a natural disaster occurs in Mexico,
especially poor Mexican citizens are likely to leave Mexico and migrate to a neighboring country such
20
as Honduras.27
If this is true, the natural disaster that hit Mexico (and gave rise to the exogenous
variation in our instrumental variable trade openness) influenced globalization and income inequality
in Honduras. Migration is, however, included in the KOF globalization index.28
Large scale natural disasters may give rise to changes in the income distribution. Felbermayr and
Gröschl (2013, 2014), for example, have shown that natural disasters influence overall per capita
income. Some natural disasters are registered across borders. Registered natural disasters in the home
country might have a direct impact on the home country’s income distribution. To mitigate a potential
omitted variable bias because of cross-border natural disasters we directly control for the effect of
large scale natural disasters of the home country as a robustness test in section 5.5.1.29
RESULTS 55.1. BASELINE MODEL
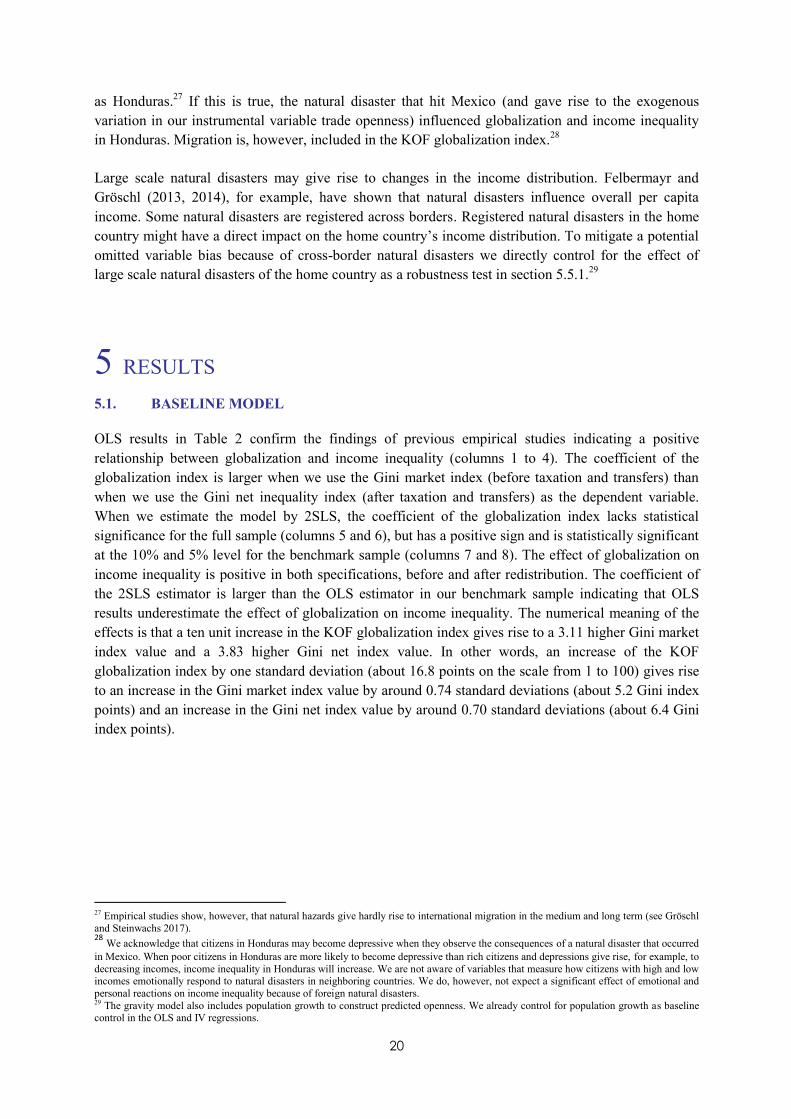
OLS results in Table 2 confirm the findings of previous empirical studies indicating a positive
relationship between globalization and income inequality (columns 1 to 4). The coefficient of the
globalization index is larger when we use the Gini market index (before taxation and transfers) than
when we use the Gini net inequality index (after taxation and transfers) as the dependent variable.
When we estimate the model by 2SLS, the coefficient of the globalization index lacks statistical
significance for the full sample (columns 5 and 6), but has a positive sign and is statistically significant
at the 10% and 5% level for the benchmark sample (columns 7 and 8). The effect of globalization on
income inequality is positive in both specifications, before and after redistribution. The coefficient of
the 2SLS estimator is larger than the OLS estimator in our benchmark sample indicating that OLS
results underestimate the effect of globalization on income inequality. The numerical meaning of the
effects is that a ten unit increase in the KOF globalization index gives rise to a 3.11 higher Gini market
index value and a 3.83 higher Gini net index value. In other words, an increase of the KOF
globalization index by one standard deviation (about 16.8 points on the scale from 1 to 100) gives rise
to an increase in the Gini market index value by around 0.74 standard deviations (about 5.2 Gini index
points) and an increase in the Gini net index value by around 0.70 standard deviations (about 6.4 Gini
index points).
27 Empirical studies show, however, that natural hazards give hardly rise to international migration in the medium and long term (see Gröschl
and Steinwachs 2017). 28
We acknowledge that citizens in Honduras may become depressive when they observe the consequences of a natural disaster that occurred
in Mexico. When poor citizens in Honduras are more likely to become depressive than rich citizens and depressions give rise, for example, to
decreasing incomes, income inequality in Honduras will increase. We are not aware of variables that measure how citizens with high and low incomes emotionally respond to natural disasters in neighboring countries. We do, however, not expect a significant effect of emotional and
personal reactions on income inequality because of foreign natural disasters. 29 The gravity model also includes population growth to construct predicted openness. We already control for population growth as baseline control in the OLS and IV regressions.
21
Table 2: Baseline: OLS and 2SLS panel fixed effects estimates, based on nine periods using
5-year averages between 1970 and 2014
Robust standard errors in parentheses. *** p<0.01, ** p<0.05, * p<0.1.
5.2. GLOBALIZATION SUB-INDICATORS
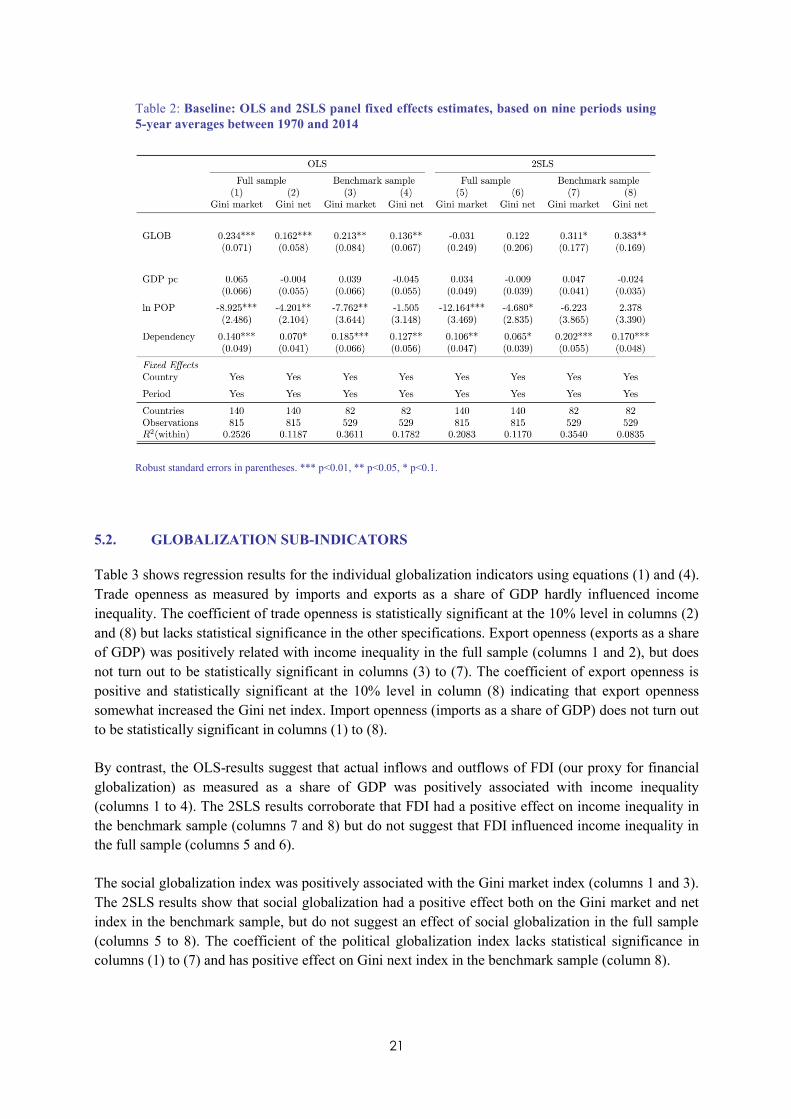
Table 3 shows regression results for the individual globalization indicators using equations (1) and (4).
Trade openness as measured by imports and exports as a share of GDP hardly influenced income
inequality. The coefficient of trade openness is statistically significant at the 10% level in columns (2)
and (8) but lacks statistical significance in the other specifications. Export openness (exports as a share
of GDP) was positively related with income inequality in the full sample (columns 1 and 2), but does
not turn out to be statistically significant in columns (3) to (7). The coefficient of export openness is
positive and statistically significant at the 10% level in column (8) indicating that export openness
somewhat increased the Gini net index. Import openness (imports as a share of GDP) does not turn out
to be statistically significant in columns (1) to (8).
By contrast, the OLS-results suggest that actual inflows and outflows of FDI (our proxy for financial
globalization) as measured as a share of GDP was positively associated with income inequality
(columns 1 to 4). The 2SLS results corroborate that FDI had a positive effect on income inequality in
the benchmark sample (columns 7 and 8) but do not suggest that FDI influenced income inequality in
the full sample (columns 5 and 6).
The social globalization index was positively associated with the Gini market index (columns 1 and 3).
The 2SLS results show that social globalization had a positive effect both on the Gini market and net
index in the benchmark sample, but do not suggest an effect of social globalization in the full sample
(columns 5 to 8). The coefficient of the political globalization index lacks statistical significance in
columns (1) to (7) and has positive effect on Gini next index in the benchmark sample (column 8).
22
Table 3: Sub-indicators of globalization: OLS and 2SLS – panel fixed effects estimates, based on
nine periods using 5-year averages between 1970 and 2014
a) Sub-indicators: Trade opennes, export openness, and import openness
b) Sub-indicators: Foreign direct investments, social, and political globalization
Robust standard errors in parentheses. First-stage results and F-statistics on the excluded instrument are reported in Table 1.
All specifications include baseline control variables: GDP per capita, ln population, and dependency ratio.
*** p<0.01, ** p<0.05, * p<0.1.
23
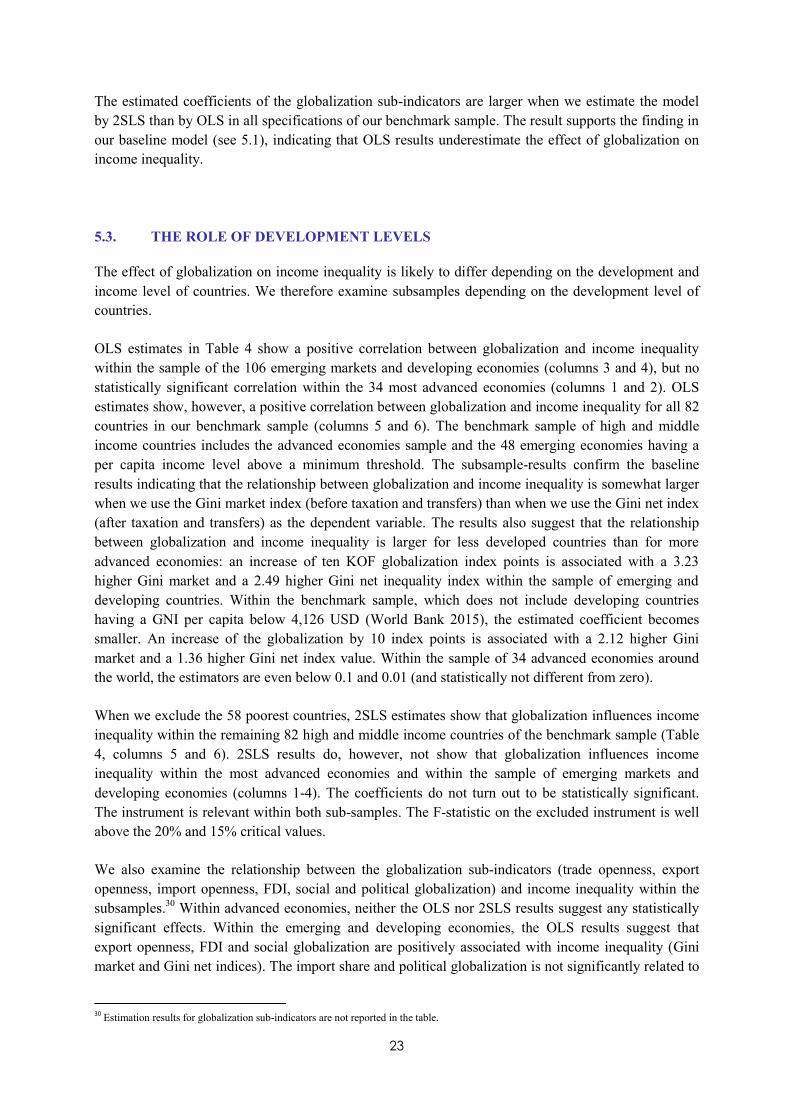
The estimated coefficients of the globalization sub-indicators are larger when we estimate the model
by 2SLS than by OLS in all specifications of our benchmark sample. The result supports the finding in
our baseline model (see 5.1), indicating that OLS results underestimate the effect of globalization on
income inequality.
5.3. THE ROLE OF DEVELOPMENT LEVELS
The effect of globalization on income inequality is likely to differ depending on the development and
income level of countries. We therefore examine subsamples depending on the development level of
countries.
OLS estimates in Table 4 show a positive correlation between globalization and income inequality
within the sample of the 106 emerging markets and developing economies (columns 3 and 4), but no
statistically significant correlation within the 34 most advanced economies (columns 1 and 2). OLS
estimates show, however, a positive correlation between globalization and income inequality for all 82
countries in our benchmark sample (columns 5 and 6). The benchmark sample of high and middle
income countries includes the advanced economies sample and the 48 emerging economies having a
per capita income level above a minimum threshold. The subsample-results confirm the baseline
results indicating that the relationship between globalization and income inequality is somewhat larger
when we use the Gini market index (before taxation and transfers) than when we use the Gini net index
(after taxation and transfers) as the dependent variable. The results also suggest that the relationship
between globalization and income inequality is larger for less developed countries than for more
advanced economies: an increase of ten KOF globalization index points is associated with a 3.23
higher Gini market and a 2.49 higher Gini net inequality index within the sample of emerging and
developing countries. Within the benchmark sample, which does not include developing countries
having a GNI per capita below 4,126 USD (World Bank 2015), the estimated coefficient becomes
smaller. An increase of the globalization by 10 index points is associated with a 2.12 higher Gini
market and a 1.36 higher Gini net index value. Within the sample of 34 advanced economies around
the world, the estimators are even below 0.1 and 0.01 (and statistically not different from zero).
When we exclude the 58 poorest countries, 2SLS estimates show that globalization influences income
inequality within the remaining 82 high and middle income countries of the benchmark sample (Table
4, columns 5 and 6). 2SLS results do, however, not show that globalization influences income
inequality within the most advanced economies and within the sample of emerging markets and
developing economies (columns 1-4). The coefficients do not turn out to be statistically significant.
The instrument is relevant within both sub-samples. The F-statistic on the excluded instrument is well
above the 20% and 15% critical values.
We also examine the relationship between the globalization sub-indicators (trade openness, export
openness, import openness, FDI, social and political globalization) and income inequality within the
subsamples.30
Within advanced economies, neither the OLS nor 2SLS results suggest any statistically
significant effects. Within the emerging and developing economies, the OLS results suggest that
export openness, FDI and social globalization are positively associated with income inequality (Gini
market and Gini net indices). The import share and political globalization is not significantly related to
30 Estimation results for globalization sub-indicators are not reported in the table.
24
inequality. 2SLS results do, however, not show that any sub-indicator influences income inequality
within this sub-sample of countries. The results based on the development level sub-samples do not
suggest that overall globalization or any sub-indicator influences income inequality within countries.
While we cannot confirm any significant relationship within advanced economies, our findings suggest
that globalization influences income inequality within our benchmark sample of high and middle
income economies. As 41.5 percent of countries in the benchmark sample are advanced economies,
other countries within the benchmark sample might be the drivers of the effects of globalization on
income inequality.
Table 4: Development levels: OLS and 2SLS panel fixed effects estimates, based
on nine periods using 5-year averages between 1970 and 2014
Robust standard errors in parentheses; *** p<0.01, ** p<0.05, * p<0.1. All specifications include baseline
control variables: GDP per capita, ln population, and dependency ratio. Stock and Yogo (2005) weak
identification test – critical values:16.38 (10%); 8.96 (15%); 6.66 (20%); 5.53 (25%).
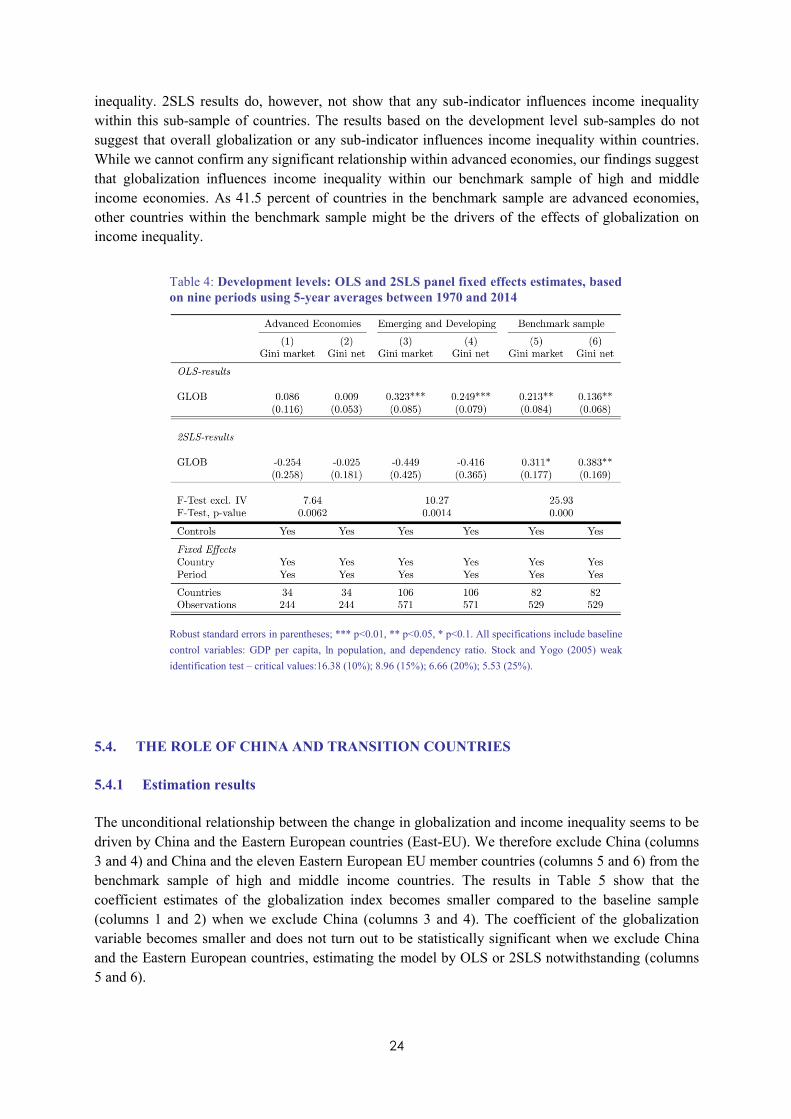
5.4. THE ROLE OF CHINA AND TRANSITION COUNTRIES
5.4.1 Estimation results
The unconditional relationship between the change in globalization and income inequality seems to be
driven by China and the Eastern European countries (East-EU). We therefore exclude China (columns
3 and 4) and China and the eleven Eastern European EU member countries (columns 5 and 6) from the
benchmark sample of high and middle income countries. The results in Table 5 show that the
coefficient estimates of the globalization index becomes smaller compared to the baseline sample
(columns 1 and 2) when we exclude China (columns 3 and 4). The coefficient of the globalization
variable becomes smaller and does not turn out to be statistically significant when we exclude China
and the Eastern European countries, estimating the model by OLS or 2SLS notwithstanding (columns
5 and 6).
25
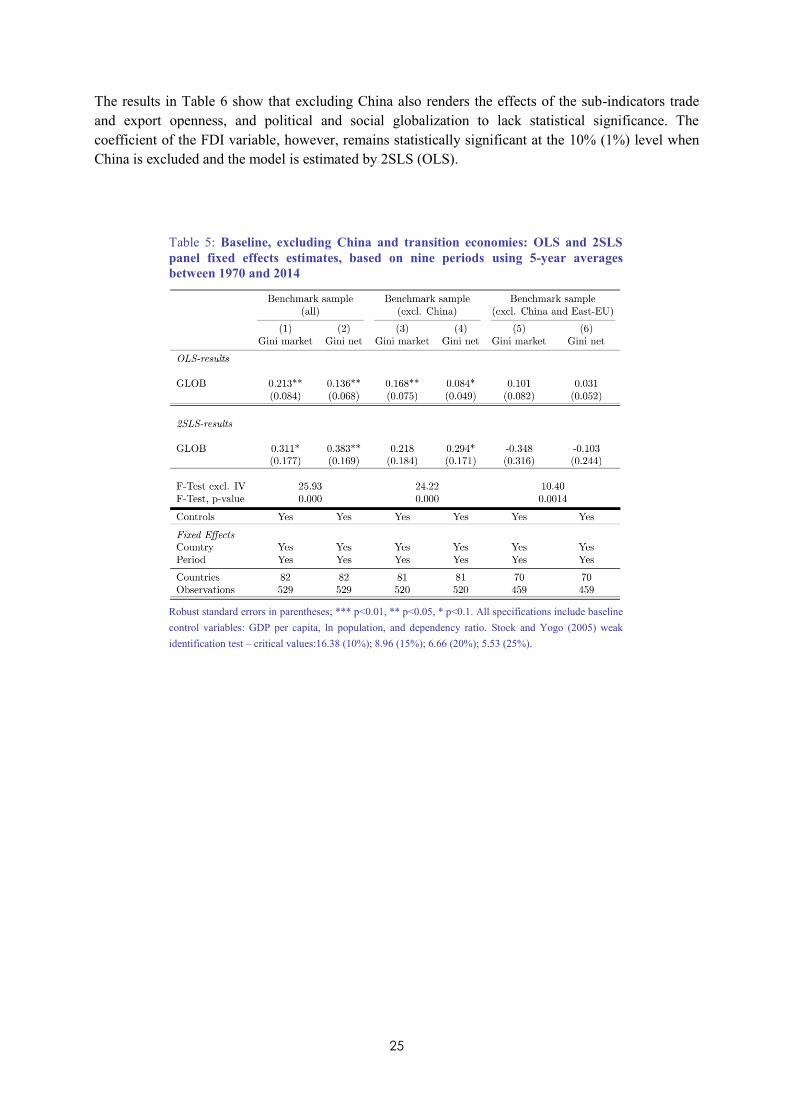
The results in Table 6 show that excluding China also renders the effects of the sub-indicators trade
and export openness, and political and social globalization to lack statistical significance. The
coefficient of the FDI variable, however, remains statistically significant at the 10% (1%) level when
China is excluded and the model is estimated by 2SLS (OLS).
Table 5: Baseline, excluding China and transition economies: OLS and 2SLS
panel fixed effects estimates, based on nine periods using 5-year averages
between 1970 and 2014
Robust standard errors in parentheses; *** p<0.01, ** p<0.05, * p<0.1. All specifications include baseline
control variables: GDP per capita, ln population, and dependency ratio. Stock and Yogo (2005) weak
identification test – critical values:16.38 (10%); 8.96 (15%); 6.66 (20%); 5.53 (25%).
26
Table 6: Sub-indicators of globalization, benchmark sample excluding China: OLS and
2SLS panel fixed effects estimates, based on nine periods using 5-year averages between
1970 and 2014
a) Sub-indicators: Trade openness, export openness, and import openness
b) Sub-indicators: Foreign direct investments, social and political globalization
Robust standard errors in parentheses; *** p<0.01, ** p<0.05, * p<0.1. All specifications include baseline control
variables: GDP per capita, ln population, and dependency ratio. Stock and Yogo (2005) weak identification test – critical
values: 16.38 (10%); 8.96 (15%); 6.66 (20%); 5.53 (25%).
27
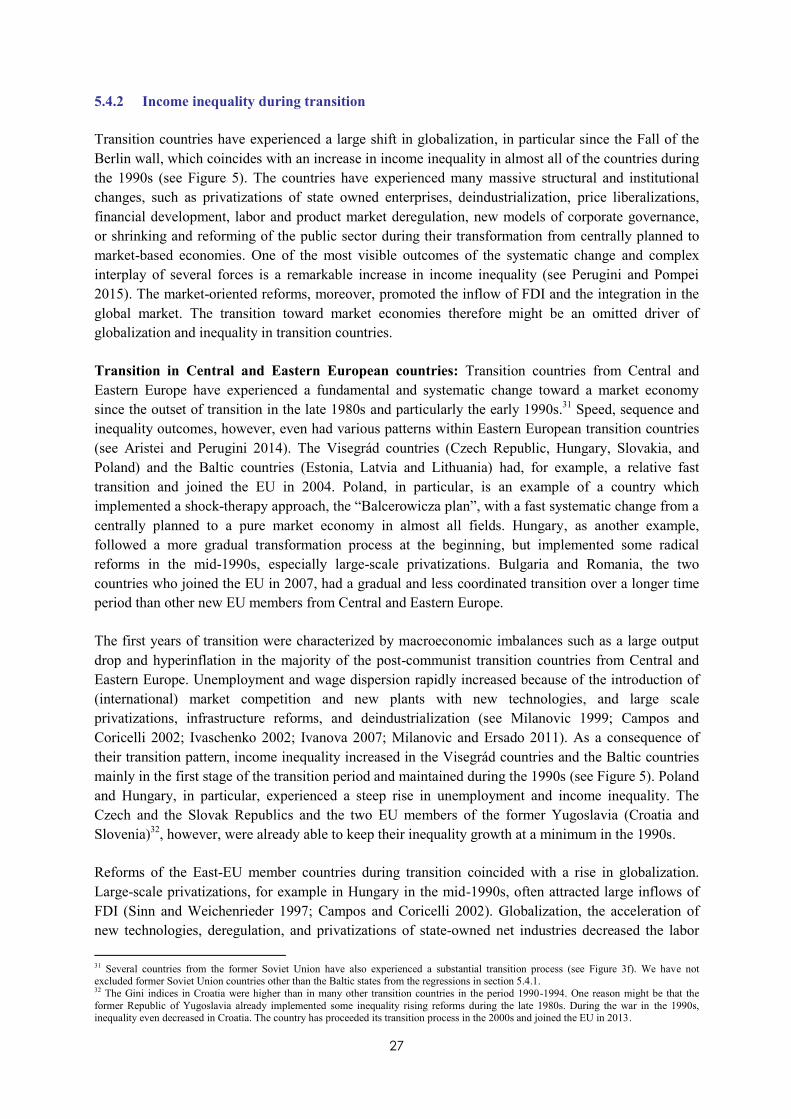
5.4.2 Income inequality during transition
Transition countries have experienced a large shift in globalization, in particular since the Fall of the
Berlin wall, which coincides with an increase in income inequality in almost all of the countries during
the 1990s (see Figure 5). The countries have experienced many massive structural and institutional
changes, such as privatizations of state owned enterprises, deindustrialization, price liberalizations,
financial development, labor and product market deregulation, new models of corporate governance,
or shrinking and reforming of the public sector during their transformation from centrally planned to
market-based economies. One of the most visible outcomes of the systematic change and complex
interplay of several forces is a remarkable increase in income inequality (see Perugini and Pompei
2015). The market-oriented reforms, moreover, promoted the inflow of FDI and the integration in the
global market. The transition toward market economies therefore might be an omitted driver of
globalization and inequality in transition countries.
Transition in Central and Eastern European countries: Transition countries from Central and
Eastern Europe have experienced a fundamental and systematic change toward a market economy
since the outset of transition in the late 1980s and particularly the early 1990s.31
Speed, sequence and
inequality outcomes, however, even had various patterns within Eastern European transition countries
(see Aristei and Perugini 2014). The Visegrád countries (Czech Republic, Hungary, Slovakia, and
Poland) and the Baltic countries (Estonia, Latvia and Lithuania) had, for example, a relative fast
transition and joined the EU in 2004. Poland, in particular, is an example of a country which
implemented a shock-therapy approach, the “Balcerowicza plan”, with a fast systematic change from a
centrally planned to a pure market economy in almost all fields. Hungary, as another example,
followed a more gradual transformation process at the beginning, but implemented some radical
reforms in the mid-1990s, especially large-scale privatizations. Bulgaria and Romania, the two
countries who joined the EU in 2007, had a gradual and less coordinated transition over a longer time
period than other new EU members from Central and Eastern Europe.
The first years of transition were characterized by macroeconomic imbalances such as a large output
drop and hyperinflation in the majority of the post-communist transition countries from Central and
Eastern Europe. Unemployment and wage dispersion rapidly increased because of the introduction of
(international) market competition and new plants with new technologies, and large scale
privatizations, infrastructure reforms, and deindustrialization (see Milanovic 1999; Campos and
Coricelli 2002; Ivaschenko 2002; Ivanova 2007; Milanovic and Ersado 2011). As a consequence of
their transition pattern, income inequality increased in the Visegrád countries and the Baltic countries
mainly in the first stage of the transition period and maintained during the 1990s (see Figure 5). Poland
and Hungary, in particular, experienced a steep rise in unemployment and income inequality. The
Czech and the Slovak Republics and the two EU members of the former Yugoslavia (Croatia and
Slovenia)32
, however, were already able to keep their inequality growth at a minimum in the 1990s.
Reforms of the East-EU member countries during transition coincided with a rise in globalization.
Large-scale privatizations, for example in Hungary in the mid-1990s, often attracted large inflows of
FDI (Sinn and Weichenrieder 1997; Campos and Coricelli 2002). Globalization, the acceleration of
new technologies, deregulation, and privatizations of state-owned net industries decreased the labor
31 Several countries from the former Soviet Union have also experienced a substantial transition process (see Figure 3f). We have not excluded former Soviet Union countries other than the Baltic states from the regressions in section 5.4.1. 32 The Gini indices in Croatia were higher than in many other transition countries in the period 1990-1994. One reason might be that the
former Republic of Yugoslavia already implemented some inequality rising reforms during the late 1980s. During the war in the 1990s, inequality even decreased in Croatia. The country has proceeded its transition process in the 2000s and joined the EU in 2013.
28
share in advanced market economies during the same time (see Azmat et al. 2012; Karababounis and
Neiman 2014). Changes in established market economies were, however, smaller and moderated by
stable political institutions, established transfer systems, and manifold opportunities for education,
which have moderated adverse effects on income inequality. Figure 3b shows, for example, that
income inequality after taxation and transfers hardly increased in the generous welfare states of the
EU15, while globalization proceeded. High redistribution and inequality outcomes at a relative low
level remained pronounced in the Scandinavian countries and the Western continental Europe (see
Fuest et al. 2010 for the redistributive effects of tax-benefit systems in Europe; and Doerrenberg and
Peichl 2014 for trends in inequality by welfare state types). In Central and Eastern European countries
social transfers played a minor countervailing role during transition. Policies like the removal of price
subsidies, the reduction of social in-kind benefits, and the privatization of public sector housing rather
increased inequality in the first transition stage (see Milanovic 1999; Flemming and
Micklewright 2000; Ivanova 2007). The transition countries, moreover, had limited capabilities in the
education system and higher labor market frictions at the beginning of their transition. The transition to
an open and competitive market economy, FDI induced new technologies and equipment, and the
overall skill-biased technological shift in the 1990s suddenly required other and higher skill-
requirements than the working age population and the education systems were prepared for (see
Aghion and Commander 1999).
While globalization proceeded in the transition countries from Central and Eastern Europe since the
end of its transformation into market economies, income inequality did not increase (or even
decreased) in many countries in the 2000s (see Figure 5).33
Exceptions are, for example, the Baltic
countries Latvia and Lithuania. In Bulgaria and Romania, income inequality was incrementally on the
rise during the 1990s and 2000s, in a similar vein as their gradual transition process. At the beginning
of their transition toward a market economy, the new EU member countries from Central and Eastern
Europe had a lower globalization and Gini inequality level on average than other advanced economies
in the world. After transition, they are at about the same level in both, globalization and income
inequality (see Figures 2 and 3 for the trends in the level averages of advanced economies and the
EU15 countries).
Transition in China: In China, the transition to a marked-based economic system was more gradual
than in Central and Eastern Europe and proceeded in several sequences over a long time period (see
Roland 2000). In the 1970s, globalization and income inequality were less pronounced, but poverty
rates were high (Figure 5).34
After the death of Mao and decades of communist economics, China
decided to partially implement market elements in its economy from 1978 onwards. The government
started, for example, with agrarian reforms and to introduce free prices with a dual price quota system,
which allowed selling parts of the output at free market prices. Decentralization occurred by shifting
power to regional authorities. The first joint-venture-law was passed in 1979 and the first special
economic zones were created in the early 1980s. FDI, at first, were only allowed in special economic
zones. The inflow of FDI and established market elements in the economy contributed to a large
economic, employment and globalization growth in the special economic zones. During the 1980s,
China implemented several more special economic zones, free trade zones, and technological
development zones. Moreover, contract responsibility reforms in state-owned and collective
33 Egger and Stehrer (2003) rather suggest that FDI and outsourcing of intermediate goods production to Eastern Europe resulted in a
reduction of wage inequality in the affected transition countries. 34 Communist programs such as “The Great Leap Forward”, the “Cultural Revolution” and collective farming (with weak incentives for work) had left a pervasive poverty in China by the mid-1970s.
29
enterprises and the effective development of new private companies and joint-ventures occurred. Since
the mid-1990s, privatizations of small-medium sized enterprises are proceeding.
Globalization and economic growth in China has been increasing since the beginning of the Chinese
gradual reform programs in the late 1970s. China has made a large progress against absolute poverty
ever since (see Ravaillon and Chen 2007). Participation in the Chinese income growth, however, was
unequally distributed between and within regions (see Ravaillon and Chen 2007). Income growth has
been remarkably larger at the top of the Chinese income distribution (Lakner and Milanovic 2015).
While Central and Eastern European transition countries mainly had a fast transition period or even a
big-bang approach of transition and its income inequality only increased to a large amount within that
period of time, China has implemented a gradualism approach of reforms which all have increased
inequality sequentially. Political and economic reforms were concentrated on growth that has not been
moderated by large taxation and transfer programs.35
China has started some redistribution programs to
promote a “harmonious society” during the 2000s, but nation-wide direct income taxation and transfers
are still on a low level (see Knight 2014). As a consequence, both income inequality pre and post
taxation and transfers are increasing in China since the early 1980s.
The gradual economic reforms in China have simultaneously produced a large increase of its
globalization and income inequality levels (see Figure 5). As shown in section 5.4.1, China is a main
driver of the positive relationship between globalization and income inequality. The global
interpersonal inequality, however, has declined as the Chinese population has increased its income
across all deciles in the course of its globalization and transition process (Lakner and Milanovic 2015).
The Chinese example of economic growth suggests that large income increases of the rich may be a
precondition for the poor to also experience increases in income when a country is emerging rapidly.36
The Chinese rise in income inequality is, moreover, consistent with predictions of the inverted-U
hypothesis of the Kuznets curve relating inequality to the development level (see Kuznets 1955).
Following the predictions of Kuznets, China might be able to reduce its inequality level if its income
level proceeds to increase in the future.
35 Ravaillon and Chen (2007) have shown that public spending between 1980 and 2001 has reduced poverty, but not income inequality. 36 While inequality might be a precondition to create incentives and economic growth in an equalized society, high inequality might be
problematic for sustainable growth (see Dorn 2016 for a discussion of the relationship between income inequality and economic growth).
Ravaillon and Chen (2007) have, for example, shown that Chinese provinces starting with higher income inequality experienced slower growth than less unequal provinces.
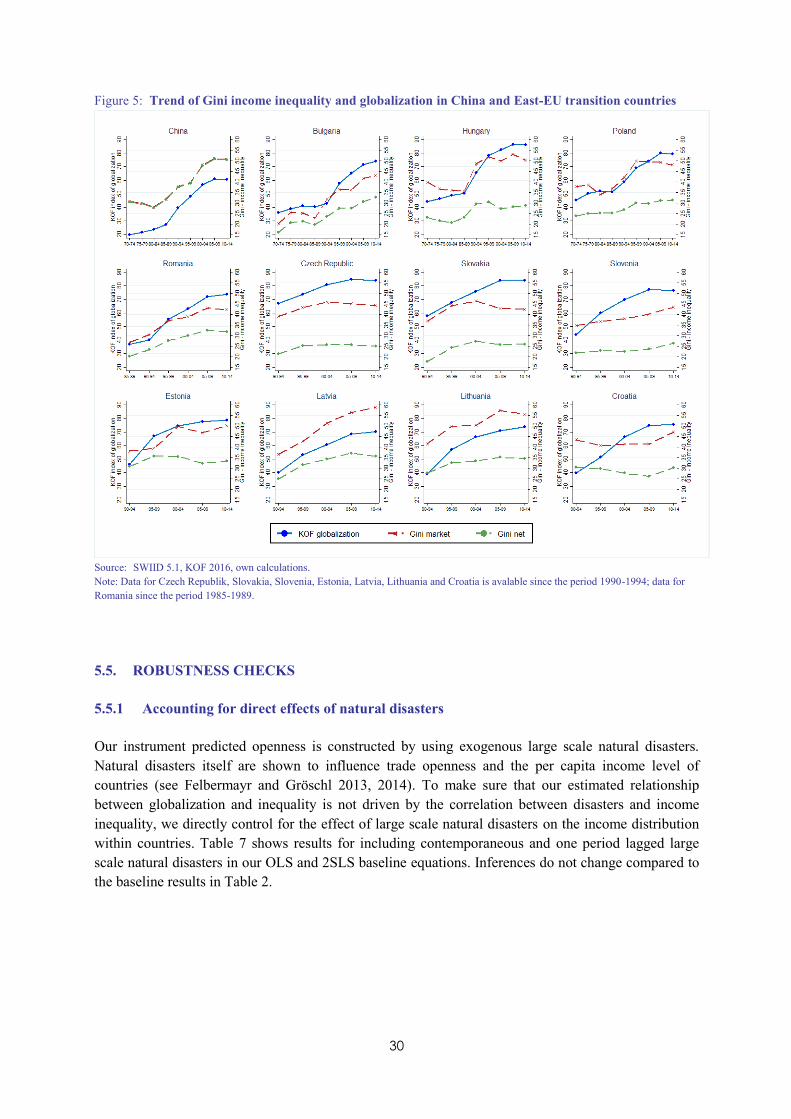
30
Figure 5: Trend of Gini income inequality and globalization in China and East-EU transition countries
Source: SWIID 5.1, KOF 2016, own calculations.
Note: Data for Czech Republik, Slovakia, Slovenia, Estonia, Latvia, Lithuania and Croatia is avalable since the period 1990-1994; data for
Romania since the period 1985-1989.
5.5. ROBUSTNESS CHECKS
5.5.1 Accounting for direct effects of natural disasters
Our instrument predicted openness is constructed by using exogenous large scale natural disasters.
Natural disasters itself are shown to influence trade openness and the per capita income level of
countries (see Felbermayr and Gröschl 2013, 2014). To make sure that our estimated relationship
between globalization and inequality is not driven by the correlation between disasters and income
inequality, we directly control for the effect of large scale natural disasters on the income distribution
within countries. Table 7 shows results for including contemporaneous and one period lagged large
scale natural disasters in our OLS and 2SLS baseline equations. Inferences do not change compared to
the baseline results in Table 2.
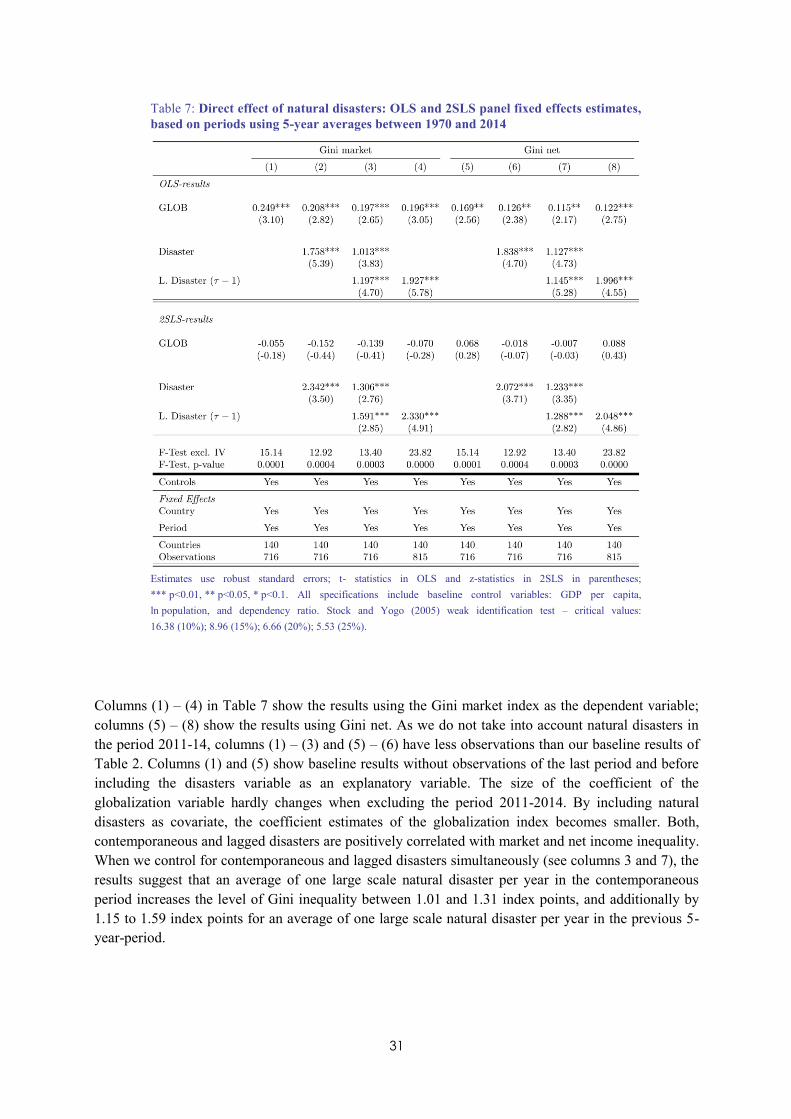
31
Table 7: Direct effect of natural disasters: OLS and 2SLS panel fixed effects estimates,
based on periods using 5-year averages between 1970 and 2014
Estimates use robust standard errors; t- statistics in OLS and z-statistics in 2SLS in parentheses;
*** p<0.01, ** p<0.05, * p<0.1. All specifications include baseline control variables: GDP per capita,
ln population, and dependency ratio. Stock and Yogo (2005) weak identification test – critical values:
16.38 (10%); 8.96 (15%); 6.66 (20%); 5.53 (25%).
Columns (1) – (4) in Table 7 show the results using the Gini market index as the dependent variable;
columns (5) – (8) show the results using Gini net. As we do not take into account natural disasters in
the period 2011-14, columns (1) – (3) and (5) – (6) have less observations than our baseline results of
Table 2. Columns (1) and (5) show baseline results without observations of the last period and before
including the disasters variable as an explanatory variable. The size of the coefficient of the
globalization variable hardly changes when excluding the period 2011-2014. By including natural
disasters as covariate, the coefficient estimates of the globalization index becomes smaller. Both,
contemporaneous and lagged disasters are positively correlated with market and net income inequality.
When we control for contemporaneous and lagged disasters simultaneously (see columns 3 and 7), the
results suggest that an average of one large scale natural disaster per year in the contemporaneous
period increases the level of Gini inequality between 1.01 and 1.31 index points, and additionally by
1.15 to 1.59 index points for an average of one large scale natural disaster per year in the previous 5-
year-period.
32
5.5.2 Variations in country-period observations
Our data on country-period observations varies across countries and time. We test the robustness of the
baseline results by controlling for effects of the unequal distribution of observations. We use
subsamples of countries, which have a minimum number of period-observations. Results are shown in
Table 8. Inferences do not change.
OLS results among all specifications in Table 8 confirm the positive relationship between
globalization and income inequality for the full and benchmark country samples in Table 2. The size of
the coefficient of the globalization index decreases when increasing the minimum number of period-
observations per country, and even lacks statistical significance in the most stringent sample of 56
countries having at least seven period observations. The small sample contains mainly advanced
economies and other high and middle income countries.
The 2SLS results of the large sample of 117 countries (columns 1a,b in Table 8), which have at least
four period-observations per country, do not suggest that globalization influences income inequality.
The large sample result confirms the findings of the full sample in Table 2. The coefficient of the
globalization index is, however, positive and statistically significant in the smaller samples when we
use the Gini index as dependent variable (columns 2b, and 3a,b). The smaller samples mainly include
high and middle income countries of our benchmark sample. The results are therefore driven by the
income level of different subsamples. The F-statistic on the excluded instrument is well above the 10%
critical value of the weak IV-test of Stock and Yogo (2005) in all three subsamples. Predicted
openness remains a strong and relevant instrument for globalization.
The results among the subsamples are not driven by the individual country-period observations but
rather by the development levels within the subsamples of countries, as developed and high and middle
income countries are more likely to have more period-observations per country (see Figure 1). Results
depending on the development levels are shown in section 5.3.
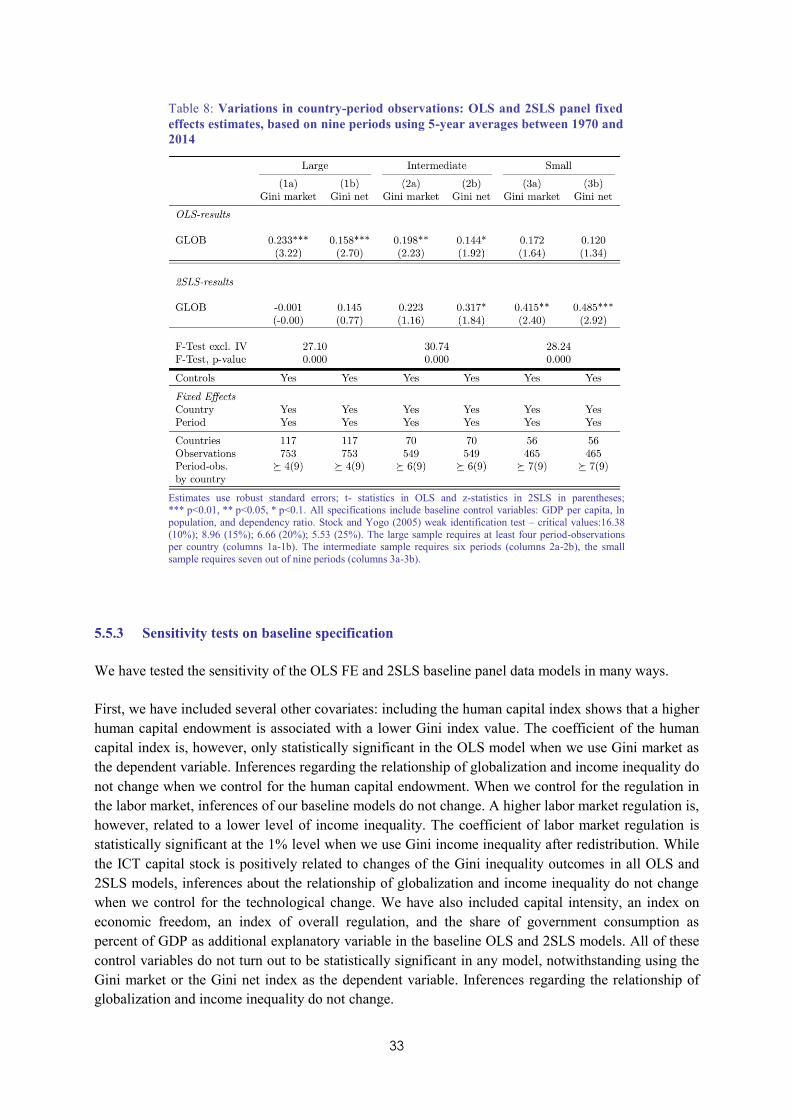
33
Table 8: Variations in country-period observations: OLS and 2SLS panel fixed
effects estimates, based on nine periods using 5-year averages between 1970 and
2014
Estimates use robust standard errors; t- statistics in OLS and z-statistics in 2SLS in parentheses; *** p<0.01, ** p<0.05, * p<0.1. All specifications include baseline control variables: GDP per capita, ln
population, and dependency ratio. Stock and Yogo (2005) weak identification test – critical values:16.38
(10%); 8.96 (15%); 6.66 (20%); 5.53 (25%). The large sample requires at least four period-observations per country (columns 1a-1b). The intermediate sample requires six periods (columns 2a-2b), the small
sample requires seven out of nine periods (columns 3a-3b).
5.5.3 Sensitivity tests on baseline specification
We have tested the sensitivity of the OLS FE and 2SLS baseline panel data models in many ways.
First, we have included several other covariates: including the human capital index shows that a higher
human capital endowment is associated with a lower Gini index value. The coefficient of the human
capital index is, however, only statistically significant in the OLS model when we use Gini market as
the dependent variable. Inferences regarding the relationship of globalization and income inequality do
not change when we control for the human capital endowment. When we control for the regulation in
the labor market, inferences of our baseline models do not change. A higher labor market regulation is,
however, related to a lower level of income inequality. The coefficient of labor market regulation is
statistically significant at the 1% level when we use Gini income inequality after redistribution. While
the ICT capital stock is positively related to changes of the Gini inequality outcomes in all OLS and
2SLS models, inferences about the relationship of globalization and income inequality do not change
when we control for the technological change. We have also included capital intensity, an index on
economic freedom, an index of overall regulation, and the share of government consumption as
percent of GDP as additional explanatory variable in the baseline OLS and 2SLS models. All of these
control variables do not turn out to be statistically significant in any model, notwithstanding using the
Gini market or the Gini net index as the dependent variable. Inferences regarding the relationship of
globalization and income inequality do not change.
34
Second, we have used robust standard errors clustered by country and classical standard errors.
Inferences do not change.
Third, we have used alternative definitions of natural disasters by constructing the instrument predicted
openness in the panel model, such as broader specifications that includes all kinds of natural disasters
or counting all sizes of disasters (small and large), as suggested by Felbermayr and Gröschl (2013).
Using the alternative instruments, inferences do not change.
CONCLUSION 6We have re-examined the nexus between globalization and income inequality. OLS results confirm
previous findings that income inequality and globalization are positively correlated. We have used
several sub-samples: the relationship is positive within our benchmark sample of high and middle
income countries, the full sample of countries and the sample of emerging markets and developing
economies. For the most advanced economies, however, the results do not suggest that globalization
and income inequality are positively correlated.
We use predicted openness as an IV for globalization. Within our benchmark sample of high and
middle income countries the 2SLS results confirm that globalization indeed influences income
inequality. But again this effect is driven by the transition countries. In particular, in the subsample of
advanced countries, our results do not show a systematic effect of globalization on income inequality,
neither positive nor negative. The same is true for the group of emerging and developing countries.
How can we explain the finding that there seems to be a robust and positive relationship between
globalization and inequality in the transition countries including China and the countries of Eastern
Europe but not in the group of advanced economies or developing countries?
The transition countries from Eastern Europe and China have experienced a rapid process of
globalization while the welfare states and labor market institutions in these countries were less
developed than in advanced countries in the rest of the world – in particular in Western Europe.
Chinese reform programs were, for example, concentrated on economic growth that has not been
moderated by redistribution programs. Participation in the Chinese rise to a global economic power,
therefore, is unequally distributed within the country. Transition countries from Central and Eastern
Europe have also experienced systematic structural and institutional changes towards market
economies which might be the omitted drivers of rising globalization levels and inequality outcomes in
our results.
Advanced economies do predominantly have higher levels of globalization, while less developed
economies do have lower levels of globalization on average in our dataset. The relationship between
globalization and income inequality might thus be non-monotonic, where inequality first rises and later
declines in the course of globalization, as predicted by Helpman et al. (2010, 2017). This would follow
Kuznet’s (1955) hypothesis predicting a non-linear relationship where income inequality first increases
and later decreases when the overall income level of a country is increasing.
35
In advanced economies established transfer systems, stable political and democratic institutions, and
manifold opportunities for education may have moderated adverse effects of globalization on income
inequality. The role of institutions and the coordination of the economy and welfare system, however,
even seem to be relevant for different inequality rising effects of globalization among advanced
economies. Dorn and Schinke (2018), for example, have shown that globalization gave rise to the
income shares of the rich in the more market-oriented systems of Anglo-Saxon countries, but not in
other advanced economies. This would suggest that the establishment and the design of institutions
matter for the development of income inequality in times of growing globalization.
There are many issues that should be addressed in future research such as non-linear relationships
between globalization and income inequality and using other measures for income inequality. The
shortcoming of Gini indices is that they do not consider, for example, whether income inequality
changes because of the rich becoming richer, the poor becoming poorer (or both). In particular, income
inequality increases, when both the poor and rich become richer, but the income-increases are just
larger for the rich. Moreover, income increases of the rich may well be a precondition for the poor to
also experience increases in income.
36
REFERENCES
Acemoglu, D. (1998). “Why do New Technologies Complement Skills? Directed Technical Change and Wage
Inequality.” Quarterly Journal of Economics, 113(4), pp. 1055-1090.
Acemoglu, D. (2002). “Technical Change, Inequality, and the Labor Market.” Journal of Economic Literature,
40(1), pp. 7-72.
Acemoglu, D., S. Naidu, P. Restrepo, and J. Robinson (2015). “Democracy, Redistribution and Inequality.” In A.
Atkinson, and F. Bourguignon, eds., Handbook of Income Distribution, Vol. 2B, Amsterdam: Elsevier,
pp. 1885–1966.
Aghion, P., and S. Commander (1999). “On the Dynamics of Inequality in the Transition.” Economics of
Transition, 7(2), pp. 275-298.
Aristei, D., and C. Perugini (2014). “Speed and Sequencing of Transition Reforms and Income Inequality: A
Panel Data Analysis.” Review of Income and Wealth, 60(3), pp. 542-570.
Arkolakis, C., A. Costinot, and A. Rodríguez-Clare (2012). ‘‘New Trade Models, Same Old Gains?’’, American
Economic Review, 102(1), pp. 94–130.
Atkinson, A. (1997). Bringing Income Distribution in from the Cold. Economic Journal, 107, pp. 297-321.
Atkinson, A., and T. Piketty (2007). Top Incomes over the 20th Century. A Contrast between Continental
European and English-Speaking Countries. Oxford: Oxford University Press.
Azmat, G., A. Manning, and J. van Reenen (2012). “Privatization and the Decline of Labour’s Share:
International Evidence from Network Industries.” Economica, 79(315), pp. 470-492.
Barbieri, K. (2002). The Liberal Illusion: Does Trade Promote Peace? University of Michigan Press.
Barham, B., and S. Boucher (1998). "Migration, Remittances, and Inequality: Estimating the Net Effects of
Migration on Income Distribution." Journal of Development Economics, 55(2), pp. 307-331.
Barro, R. (2000). “Inequality and Growth in a Panel of Countries.” Journal of Economic Growth, 5(1), pp. 5-32.
Berg, A., J. Ostry, and J. Zettelmeyer (2012). “What Makes Growth Sustained.” Journal of Development
Economics, 98(2), pp. 149-166.
Bergh, A., and T. Nilsson (2010). “Do Liberalization and Globalization Increase Income Inequality?” European
Journal of Political Economy, 26, pp. 488-505.
Bergh, A., and T. Nilsson (2014). “Is Globalization reducing Absolute Poverty?” World Development, 62, pp.
42-61.
Berman, E., J. Bound, and Z. Griliches (1994). “Changes in the Demand for Skilled Labor within U.S.
Manufacturing: Evidence from the Annual Survey of Manufactures.” Quarterly Journal of Economics,
109(2), pp. 367–97.
Berman, E., J. Bound, and S. Machin (1998). “Implications of Skill-Biased Technological Change: International
Evidence.” Quarterly Journal of Economics, 113(4), pp. 1245–79.
Berman, E., and S. Machin (2000). “Skill-Biased Technology Transfer around the World.” Oxford Review of
Economic Policy, 16(3), pp. 12-22.
Bloom, N., M. Draca, and J. Van Reenen (2016). "Trade Induced Technical Change? The Impact of Chinese
Imports on Innovation, IT and Productivity." Review of Economic Studies, 83(1), pp. 87-117.
Borjas, G., R. Freeman, and L. Katz (1997). “How Much Do Immigration and Trade Affect Labor Market
Outcomes?” Brookings Papers on Economic Activity, 1, pp. 1-90.
Burstein, A., J. Cravino, and J. Vogel (2013). ‘‘Importing Skill-Biased Technology.’’ American Economic
Journal: Macroeconomics, 5, pp. 32–71.
Campos, N., and F. Coricelli (2002). “Growth in Transition: What We Know, What We Don’t, and What We
Should.” Journal of Economic Literature, XL(3), pp. 793-836.
Card, D., and J. DiNardo (2002). “Skill Biased Technological Change and Rising Wage Inequality: Some
Problems and Puzzles.” Journal of Labor Economics, 20(4), pp. 733-783.
Costinot, A., and A. Rodríguez-Clare (2014). ‘‘Trade Theory with Numbers: Quantifying the Consequences of
Globalization.’’ In E. Gita Gopinath and K. Rogoff, eds., Handbook of International Economics, Vol. 4,
Amsterdam: Elsevier, pp. 197-261
Cragg, M., and M. Epelbaum (1996). “Why Has Wage Dispersion Grown in Mexico? Is it the Incidence of
Reforms of the Growing Demand for Skills?” Journal of Development Economics, 51(1), pp. 99–116.
37
Dabla-Norris, E., K. Kochhar, N. Suphaphiphat, F. Ricka, and E. Tsounta (2015). “Causes and Consequences of
Income Inequality: A Global Perspective.” IMF Staff Discussion Note, No. 15/13.
Deaton, A. (2005). “Measuring Poverty in a Growing World (or Measuring Growth in a
Poor World).” Review of Economics and Statistics, 87, pp. 1–19.
Doerrenberg, P., and A. Peichl (2014). “The Impact of Redistributive Policies on Inequality in OECD
Countries.” Applied Economics, 46(17), pp. 2006-2086.
Dorn, F. (2016). “On Data and Trends in Income Inequality around the World.” CESifo DICE Report - Journal
of Institutional Comparisons, 14(4), pp. 54-64.
Dorn, F., and C. Schinke (2018). “Top Income Shares in OECD Countries: The Role of Government Ideology
and Globalization.” World Economy, forthcoming.
Dreher, A. (2006a). “Does Globalization Affect Growth? Empirical Evidence from a new index.” Applied
Economics, 38, pp. 1091-1110.
Dreher, A. (2006b). “The Influence of Globalization on Taxes and Social Policy - an Empirical Analysis for
OECD Countries.” European Journal of Political Economy, 22, pp. 179-201.
Dreher, A., and N. Gaston (2008). “Has Globalisation Increased Inequality?” Review of International Economics,
16, pp. 516-536.
Dreher, A., N. Gaston, and P. Martens (2008). Measuring globalization - Gauging its consequences. Berlin:
Springer.
Edwards, S. (1997). “Trade Policy, Growth, and Income Distribution.” American Economic Review, 87, pp. 205-
210.
Egger, H., and U. Kreickemeier (2009). “Firm Heterogeneity and the Labor Market Effects of Trade
Liberalization.” International Economic Review, 50(1), pp. 187–216.
Egger, H., P. Egger, and U. Kreickemeier (2013). “Trade, Wages, and Profits.” European
Economic Review, 64, pp. 332 – 350.
Egger, P., and R. Stehrer (2003). “International Outsourcing and the Skill Specific Wage Bill in Eastern Europe.”
World Economy, 26(1), pp. 61-72.
Eppinger, P., and N. Potrafke (2016). “Did Globalization Influence Credit Market Deregulation?” World
Economy, 39(3), pp. 444-473.
Feenstra, R., and G. Hanson (1996). “Globalization, Outsourcing, and Wage Inequality.” American Economic
Review, 86 (2), pp. 240–45.
Feenstra, R., and G. Hanson (1997). “Foreign direct Investment and Relative Wages, Evidence from Mexico’s
Maquiladoras.” Journal of International Economics, 42, pp. 371-393.
Feenstra, R., and G. Hanson (1999). “The Impact of Outsourcing and High-Technology Capital on Wages:
Estimates for the United States, 1979–1990.” Quarterly Journal of Economics, 114(3), pp. 907–40.
Feenstra, R., R. Inklaar, and M. Timmer (2015). “The Next Generation of the Penn World Table.” American
Economic Review, 105(10), pp. 3150-82.
Felbermayr, G., and J. Gröschl (2013). “Natural Disasters and the Effect of Trade on Income: A New Panel IV
Approach.” European Economic Review, 58, pp. 18-30.
Felbermayr, G., and J. Gröschl (2014). “Naturally Negative: The Growth Effects of Natural Disasters.” Journal
of Development Economics 111, pp. 92–106.
Ferreira, F. H., N. Lustig, and D. Teles (2015), “Appraising Cross-National Income Inequality Databases: An
Introduction.” Journal of Economic Inequality, 13, pp. 497-526.
Feyrer, J. (2009). “Trade and Income - Exploiting Time Series in Geography.” NBER Working Paper, No.
14910.
Figini, P., and H. Görg (2011). “Does Foreign Direct Investment Affect Wage Inequality? An Empirical
Investigation.” World Economy, 34 (9), pp. 1455–75.
Flemming, J., and J. Micklewright (2000). “Income Distribution, Economic Systems and Transition.” In: A.
Atkinson, and F. Bourguignon, eds., Handbook of Income Distribution, Amsterdam: Elsevier, pp. 843-
918.
Forbes, K. (2000). “A Reassessment of the Relationship between Inequality and Growth.” American Economic
Review, 90(4), pp. 869-887.
Frankel, J., and D. Romer (1999). “Does Trade cause Growth?” American Economic Review, 89(3), pp. 379-399.
38
Frias, J., D. Kaplan, and E. Verhoogen (2012). ‘‘Exports and Within-Plant Wage Distributions: Evidence from
Mexico,” American Economic Review, 102, pp. 435–440.
Fuest, C., J. Niehues, and A. Peichl (2010). “The Redistributive Effects of Tax Benefit Systems in the Enlarged
EU.” Public Finance Review, 38(4), pp. 473–500.
Goldberg, P., and N. Pavcnik (2007). ‘‘Distributional Effects of Globalization in Developing Countries.” Journal
of Economic Literature, 45, pp. 39–82.
Gorodnichenko, Y., K. Sabirianova Peter, and D. Stolyarov (2010). “Inequality and Volatility Moderation in
Russia: Evidence from Micro-Level Panel Data on Consumption and Income.” Review of Economic
Dynamics, 13(1), pp. 209-237.
Gozgor, G., and P. Ranjan (2017). “Globalization, Inequality, and Redistribution: Theory and Evidence.” World
Economy, 40(12), pp. 2704-2751.
Gröschl, J., and T. Steinwachs (2017). “Do Natural Hazards Cause International Migration?” CESifo Economic
Studies, 63, forthcoming.
Gwartney, J., R. Lawson, R., and J. Hall (2015). 2015 Economic Freedom Dataset. Economic Freedom of the
World: 2015 Annual Report. Fraser Institute.
Helpman, E., O. Itskhoki, and S. Redding (2010). “Inequality and Unemployment in a Global Economy,”
Econometrica, 78(4), pp. 1239–1283.
Helpman, E., O. Itskhoki, M.-A. Muendler, and S. Redding (2017). ‘‘Trade and Inequality: From Theory to
Estimation,” Review of Economic Studies, 84(1), pp. 357-405.
IMF (2016). World Economic Outlook. October 2016. Washington, DC : International Monetary Fund.
Ivanova, M. (2007). “Inequality and Government Policies in Central and Eastern Europe.” East European
Quarterly, 41(2), pp. 167-204.
Jaumotte, F., S. Lall, and C. Papageorgiou (2013). Rising Income Inequality: Technology, or Trade and Financial
Globalization? IMF Economic Review, 61(2), pp. 271-309.
Jenkins, S. (2015). “World Income Inequality Databases: an Assessment of WIID and SWIID.” Journal of
Economic Inequality, 13, pp. 629-671.
Jorgenson, D., and K. Vu (2017). “The Outlook for Advanced Economies.” Journal of Policy Modelling 39 (3),
pp. 660-672.
Karabarbounis, L., and B. Neiman (2014). “The Global Decline of the Labor Share.” Quarterly Journal of
Economics, 61, pp. 61-103.
Kauder, B., and N. Potrafke (2015). “Globalization and Social Justice in OECD Countries.” Review of World
Economics /Weltwirtschaftliches Archiv , 151(2), 353-376.
Knight, J. (2014). “Inequality in China: An Overview.” World Bank Research Observer, 29(1), pp. 1–19.
Krusell, P., L. Ohanian, L. Giovanni, J.-V. Rios-Rull, and G. Violante (2000). “Capital-skill complementarity
and inequality, a macroeconomic analysis.” Econometrica, 68, pp. 1029–1053.
Kuznets, S. (1955). “Economic Growth and Income Inequality.” American Economic Review, 45, pp. 1-28.
Lakner, C., and B. Milanovic (2016). “Global Income Distribution: From the Fall of the Berlin Wall to the Great
Recession.” World Bank Economic Review, 30(2), pp. 203-232.
Lang, V., and M. Tavares (2018). “The Distribution of Gains from Globalization.” IMF Working Paper,
forthcoming.
Leamer, E. (1998). “In Search of Stolper–Samuelson Linkages between International Trade and Lower Wages.”
In S. Collins, ed., Imports, Exports and the American Worker, Washington, D.C.: Brookings, pp. 141–
202.
Machin, S., and J. van Reenen (1998). “Technology and Changes in Skill Structure: Evidence from Seven OECD
Countries.” Quarterly Journal of Economics, 113(4), pp. 1215-1244.
Manasse, P., and A. Turrini (2001). “Trade, Wages, and ‘Superstars’.” Journal of International Economics,
54(1), pp. 97-117.
Meinhard, S., and N. Potrafke (2012). “The Globalization-Welfare State Nexus reconsidered.” Review of
International Economics 20(2), pp. 271-87.
Meltzer, A., and S. Richard (1981). “A rational Theory of the Size of Government.” Journal of Political
Economy, 89(5), pp. 914-927.
Milanovic, B. (1999). “Explaining the Increase in Inequality During Transition.” Economics of Transition, 7(2),
pp.299-341.
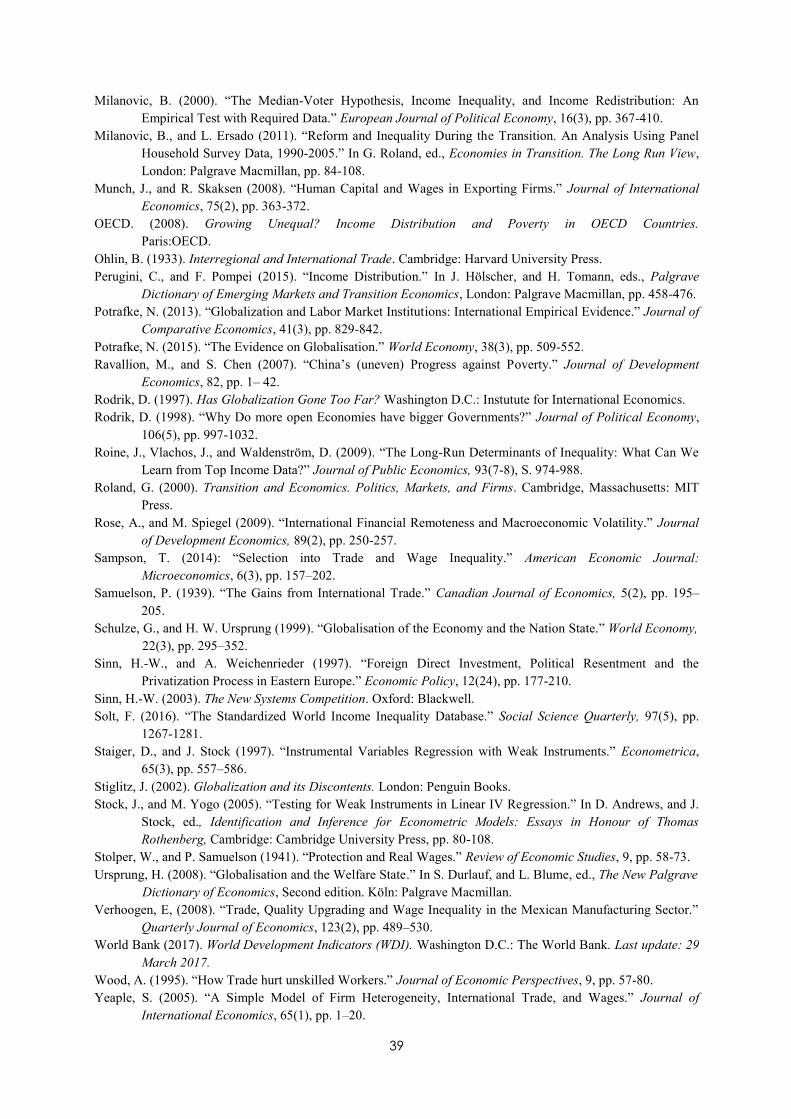
39
Milanovic, B. (2000). “The Median-Voter Hypothesis, Income Inequality, and Income Redistribution: An
Empirical Test with Required Data.” European Journal of Political Economy, 16(3), pp. 367-410.
Milanovic, B., and L. Ersado (2011). “Reform and Inequality During the Transition. An Analysis Using Panel
Household Survey Data, 1990-2005.” In G. Roland, ed., Economies in Transition. The Long Run View,
London: Palgrave Macmillan, pp. 84-108.
Munch, J., and R. Skaksen (2008). “Human Capital and Wages in Exporting Firms.” Journal of International
Economics, 75(2), pp. 363-372.
OECD. (2008). Growing Unequal? Income Distribution and Poverty in OECD Countries.
Paris:OECD.
Ohlin, B. (1933). Interregional and International Trade. Cambridge: Harvard University Press.
Perugini, C., and F. Pompei (2015). “Income Distribution.” In J. Hölscher, and H. Tomann, eds., Palgrave
Dictionary of Emerging Markets and Transition Economics, London: Palgrave Macmillan, pp. 458-476.
Potrafke, N. (2013). “Globalization and Labor Market Institutions: International Empirical Evidence.” Journal of
Comparative Economics, 41(3), pp. 829-842.
Potrafke, N. (2015). “The Evidence on Globalisation.” World Economy, 38(3), pp. 509-552.
Ravallion, M., and S. Chen (2007). “China’s (uneven) Progress against Poverty.” Journal of Development
Economics, 82, pp. 1– 42.
Rodrik, D. (1997). Has Globalization Gone Too Far? Washington D.C.: Instutute for International Economics.
Rodrik, D. (1998). “Why Do more open Economies have bigger Governments?” Journal of Political Economy,
106(5), pp. 997-1032.
Roine, J., Vlachos, J., and Waldenström, D. (2009). “The Long-Run Determinants of Inequality: What Can We
Learn from Top Income Data?” Journal of Public Economics, 93(7-8), S. 974-988.
Roland, G. (2000). Transition and Economics. Politics, Markets, and Firms. Cambridge, Massachusetts: MIT
Press.
Rose, A., and M. Spiegel (2009). “International Financial Remoteness and Macroeconomic Volatility.” Journal
of Development Economics, 89(2), pp. 250-257.
Sampson, T. (2014): “Selection into Trade and Wage Inequality.” American Economic Journal:
Microeconomics, 6(3), pp. 157–202.
Samuelson, P. (1939). “The Gains from International Trade.” Canadian Journal of Economics, 5(2), pp. 195–
205.
Schulze, G., and H. W. Ursprung (1999). “Globalisation of the Economy and the Nation State.” World Economy,
22(3), pp. 295–352.
Sinn, H.-W., and A. Weichenrieder (1997). “Foreign Direct Investment, Political Resentment and the
Privatization Process in Eastern Europe.” Economic Policy, 12(24), pp. 177-210.
Sinn, H.-W. (2003). The New Systems Competition. Oxford: Blackwell.
Solt, F. (2016). “The Standardized World Income Inequality Database.” Social Science Quarterly, 97(5), pp.
1267-1281.
Staiger, D., and J. Stock (1997). “Instrumental Variables Regression with Weak Instruments.” Econometrica,
65(3), pp. 557–586.
Stiglitz, J. (2002). Globalization and its Discontents. London: Penguin Books.
Stock, J., and M. Yogo (2005). “Testing for Weak Instruments in Linear IV Regression.” In D. Andrews, and J.
Stock, ed., Identification and Inference for Econometric Models: Essays in Honour of Thomas
Rothenberg, Cambridge: Cambridge University Press, pp. 80-108.
Stolper, W., and P. Samuelson (1941). “Protection and Real Wages.” Review of Economic Studies, 9, pp. 58-73.
Ursprung, H. (2008). “Globalisation and the Welfare State.” In S. Durlauf, and L. Blume, ed., The New Palgrave
Dictionary of Economics, Second edition. Köln: Palgrave Macmillan.
Verhoogen, E, (2008). “Trade, Quality Upgrading and Wage Inequality in the Mexican Manufacturing Sector.”
Quarterly Journal of Economics, 123(2), pp. 489–530.
World Bank (2017). World Development Indicators (WDI). Washington D.C.: The World Bank. Last update: 29
March 2017.
Wood, A. (1995). “How Trade hurt unskilled Workers.” Journal of Economic Perspectives, 9, pp. 57-80.
Yeaple, S. (2005). “A Simple Model of Firm Heterogeneity, International Trade, and Wages.” Journal of
International Economics, 65(1), pp. 1–20.
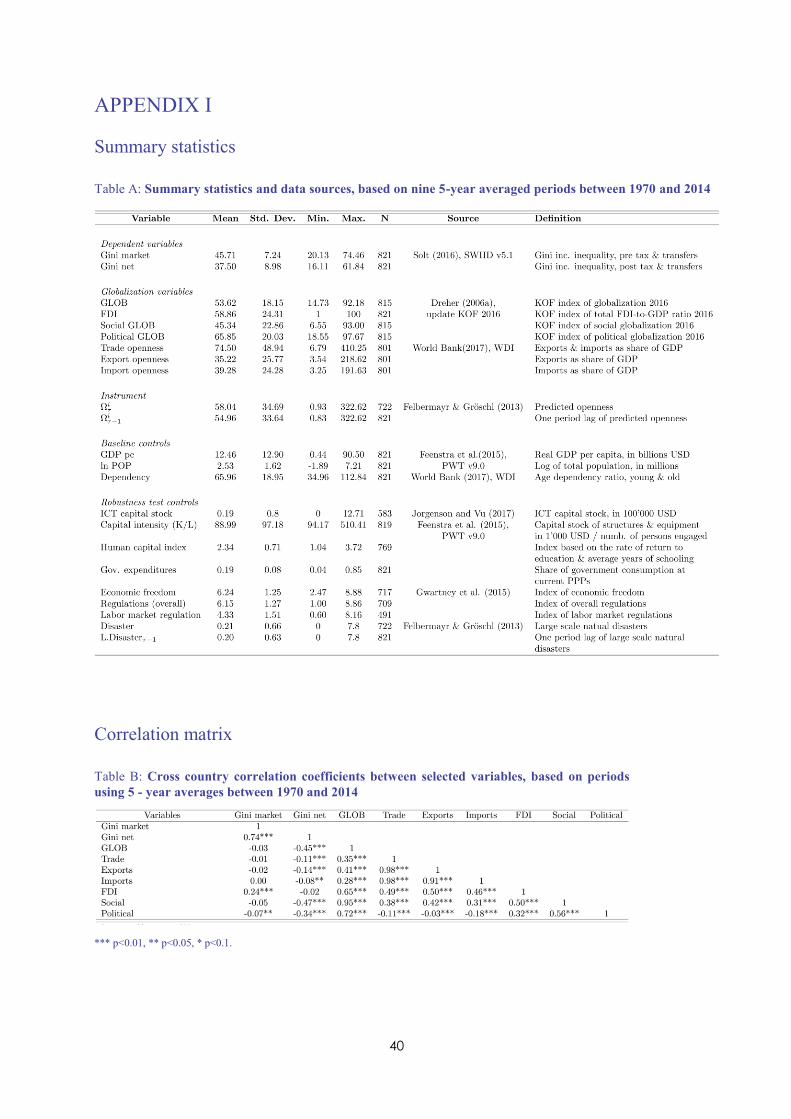
40
APPENDIX I
Summary statistics
Table A: Summary statistics and data sources, based on nine 5-year averaged periods between 1970 and 2014
Correlation matrix
Table B: Cross country correlation coefficients between selected variables, based on periods
using 5 - year averages between 1970 and 2014
*** p<0.01, ** p<0.05, * p<0.1.
41
Distribution of country-period observations
Figure A: Distribution of country-period observations
Source: SWIID 5.1, KOF 2016, own calculations
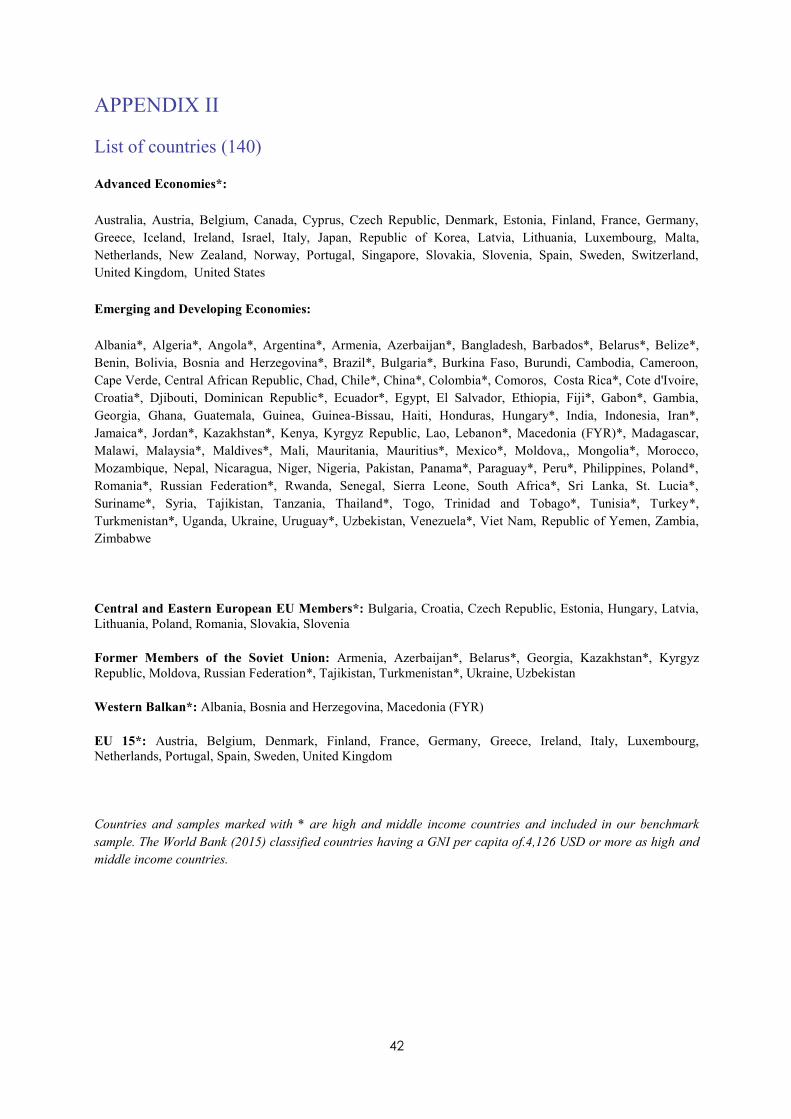
42
APPENDIX II
List of countries (140)
Advanced Economies*:
Australia, Austria, Belgium, Canada, Cyprus, Czech Republic, Denmark, Estonia, Finland, France, Germany,
Greece, Iceland, Ireland, Israel, Italy, Japan, Republic of Korea, Latvia, Lithuania, Luxembourg, Malta,
Netherlands, New Zealand, Norway, Portugal, Singapore, Slovakia, Slovenia, Spain, Sweden, Switzerland,
United Kingdom, United States
Emerging and Developing Economies:
Albania*, Algeria*, Angola*, Argentina*, Armenia, Azerbaijan*, Bangladesh, Barbados*, Belarus*, Belize*,
Benin, Bolivia, Bosnia and Herzegovina*, Brazil*, Bulgaria*, Burkina Faso, Burundi, Cambodia, Cameroon,
Cape Verde, Central African Republic, Chad, Chile*, China*, Colombia*, Comoros, Costa Rica*, Cote d'Ivoire,
Croatia*, Djibouti, Dominican Republic*, Ecuador*, Egypt, El Salvador, Ethiopia, Fiji*, Gabon*, Gambia,
Georgia, Ghana, Guatemala, Guinea, Guinea-Bissau, Haiti, Honduras, Hungary*, India, Indonesia, Iran*,
Jamaica*, Jordan*, Kazakhstan*, Kenya, Kyrgyz Republic, Lao, Lebanon*, Macedonia (FYR)*, Madagascar,
Malawi, Malaysia*, Maldives*, Mali, Mauritania, Mauritius*, Mexico*, Moldova,, Mongolia*, Morocco,
Mozambique, Nepal, Nicaragua, Niger, Nigeria, Pakistan, Panama*, Paraguay*, Peru*, Philippines, Poland*,
Romania*, Russian Federation*, Rwanda, Senegal, Sierra Leone, South Africa*, Sri Lanka, St. Lucia*,
Suriname*, Syria, Tajikistan, Tanzania, Thailand*, Togo, Trinidad and Tobago*, Tunisia*, Turkey*,
Turkmenistan*, Uganda, Ukraine, Uruguay*, Uzbekistan, Venezuela*, Viet Nam, Republic of Yemen, Zambia,
Zimbabwe
Central and Eastern European EU Members*: Bulgaria, Croatia, Czech Republic, Estonia, Hungary, Latvia,
Lithuania, Poland, Romania, Slovakia, Slovenia
Former Members of the Soviet Union: Armenia, Azerbaijan*, Belarus*, Georgia, Kazakhstan*, Kyrgyz
Republic, Moldova, Russian Federation*, Tajikistan, Turkmenistan*, Ukraine, Uzbekistan
Western Balkan*: Albania, Bosnia and Herzegovina, Macedonia (FYR)
EU 15*: Austria, Belgium, Denmark, Finland, France, Germany, Greece, Ireland, Italy, Luxembourg,
Netherlands, Portugal, Spain, Sweden, United Kingdom
Countries and samples marked with * are high and middle income countries and included in our benchmark
sample. The World Bank (2015) classified countries having a GNI per capita of.4,126 USD or more as high and
middle income countries.
43
APPENDIX III
SUPLEMENTARY MATERIAL
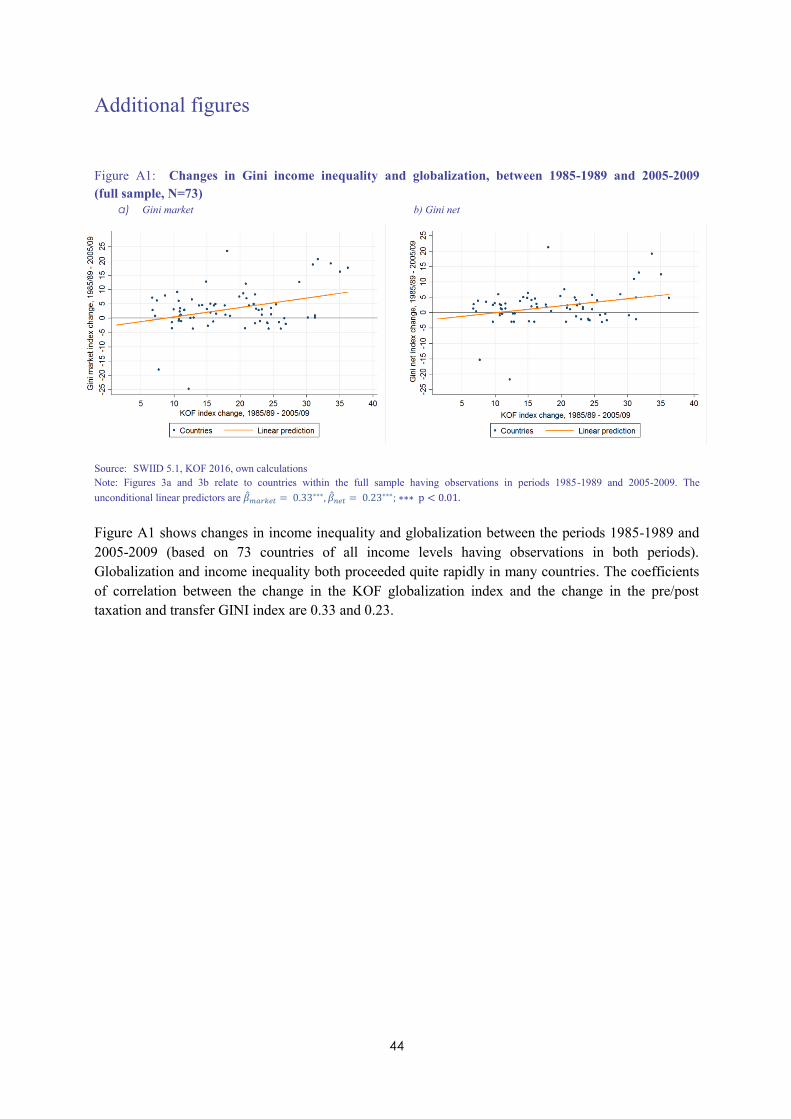
44
Additional figures
Figure A1: Changes in Gini income inequality and globalization, between 1985-1989 and 2005-2009
(full sample, N=73)
a) Gini market b) Gini net
Source: SWIID 5.1, KOF 2016, own calculations
Note: Figures 3a and 3b relate to countries within the full sample having observations in periods 1985-1989 and 2005-2009. The
unconditional linear predictors are 𝑚𝑎𝑟𝑘𝑒𝑡 = 0.33∗∗∗, 𝑛𝑒𝑡 = 0.23∗∗∗; ∗∗∗ p < 0.01.
Figure A1 shows changes in income inequality and globalization between the periods 1985-1989 and
2005-2009 (based on 73 countries of all income levels having observations in both periods).
Globalization and income inequality both proceeded quite rapidly in many countries. The coefficients
of correlation between the change in the KOF globalization index and the change in the pre/post
taxation and transfer GINI index are 0.33 and 0.23.
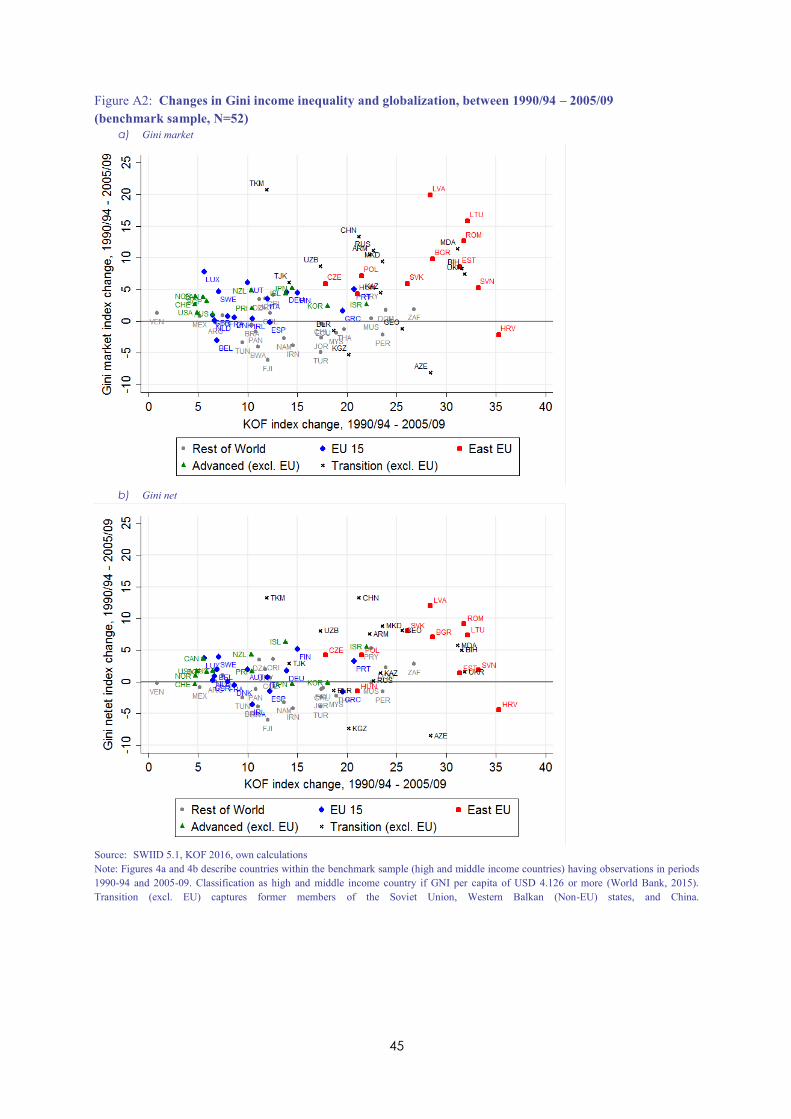
45
Figure A2: Changes in Gini income inequality and globalization, between 1990/94 – 2005/09
(benchmark sample, N=52)
a) Gini market
b) Gini net
Source: SWIID 5.1, KOF 2016, own calculations
Note: Figures 4a and 4b describe countries within the benchmark sample (high and middle income countries) having observations in periods
1990-94 and 2005-09. Classification as high and middle income country if GNI per capita of USD 4.126 or more (World Bank, 2015).
Transition (excl. EU) captures former members of the Soviet Union, Western Balkan (Non-EU) states, and China.
ifo Working Papers No. 246 Dorn, F. and C. Schinke, Top Income Shares in OECD Countries: The Role of Govern-
ment Ideology and Globalization, January 2018.
No. 245 Burmann, M., M. Drometer and R. Méango, The Political Economy of European Asylum Policies, December 2017.
No. 244 Edo, A., Y. Giesing, J. Öztunc and P. Poutvaara, Immigration and Electoral Support for
the Far Left and the Far Right, December 2017. No. 243 Enzi, B., The Effect of Pre-Service Cognitive and Pedagogical Teacher Skills on
Student Achievement Gains: Evidence from German Entry Screening Exams,
December 2017. No. 242 Doerrenberg, P. and A. Peichl, Tax morale and the role of social norms and reciprocity.
Evidence from a randomized survey experiment, November 2017.
No. 241 Fuest, C., A. Peichl and S. Siegloch, Do Higher Corporate Taxes Reduce Wages? Micro
Evidence from Germany, September 2017.
No. 240 Ochsner, C., Dismantled once, diverged forever? A quasi-natural experiment of Red Army misdeeds in post-WWII Europe, August 2017.
No. 239 Drometer, M. and R. Méango, Electoral Cycles, Effects and U.S. Naturalization Policies,
August 2017. No. 238 Sen, S. and M.-T. von Schickfus, Will Assets be Stranded or Bailed Out? Expectations of
Investors in the Face of Climate Policy, August 2017.
No. 237 Giesing, Y. and A. Music, Household behaviour in times of political change: Evidence
from Egypt, July 2017.
No. 236 Hayo, B. and F. Neumeier, Explaining Central Bank Trust in an Inflation Targeting Country: The Case of the Reserve Bank of New Zealand, June 2017.
No. 235 Buettner, T. und M. Krause, Föderalismus im Wunderland: Zur Steuerautonomie bei
der Grunderwerbsteuer, März 2017.
No. 234 Blesse, S. und F. Rösel, Gebietsreformen: Hoffnungen, Risiken und Alternativen, Januar 2017.
No. 233 Hayo, B. and F. Neumeier, The (In)Validity of the Ricardian Equivalence Theorem –
Findings from a Representative German Population Survey, December 2016. No. 232 Fritzsche, C. and L. Vandrei, The German Real Estate Transfer Tax: Evidence for Single-
Family Home Transactions, November 2016.
No. 231 Nagl, W. and M. Weber, Stuck in a trap? Long-term unemployment under two-tier
unemployment compensation schemes, November 2016.
No. 230 Neumeier, F., Do Businessmen Make Good Governors?, November 2016. No. 229 Gutmann, J., M. Neuenkirch and F. Neumeier, Precision-Guided or Blunt? The Effects
of US Economic Sanctions on Human Rights, November 2016.
No. 228 Felbermayr, G., R. Aichele, I. Heiland, A. Melchior and M. Steininger, TTIP – Potential
Effects on Norway, (November 2016) revised version December 2016. No. 227 Schueler, R., Educational inputs and economic development in end-of-nineteenth-
century Prussia, October 2016.
No. 226 Riem, M., Does political uncertainty influence firm owners‘ business perceptions?, October 2016.
No. 225 Enzi, B. and B. Siegler, The Impact of the Bologna Reform on Student Outcomes –
Evidence from Exogenous Variation in Regional Supply of Bachelor Programs in Germany, October 2016.
No. 224 Roesel, F., Do mergers of large local governments reduce expenditures? – Evidence