welfare growth accounting revisited · welfare growth accounting revisited ... problems that arose...
TRANSCRIPT
Welfare Growth Accounting Revisited
Tarek M. Harchaoui Department of Global Economics Management
and Groningen Growth and Development Centre
University of Groningen
Paul Willemsen Department of Global Economics Management
University of Groningen
June 2017
Abstract: Welfare gains—defined to include trading gains and multifactor productivity gains—have taken an increased importance in determining nations’ prosperity. An important line of research has contended that improvements in trading gains in one period tend to be offset by losses from subsequent deteriorations, leaving productivity gains as virtually the sole major long-term source of increased prosperity. We revisit this consensus view by using a unifying dual framework that offers a symmetric treatment of welfare and multifactor gains all the while adjusting the estimates for two measurement problems that arose with globalization—double counting of exports and offshoring bias. The results, based on a representative set of ten economies over the 1996-2009 period, emphasize the importance of trading gains which now contribute for about 8.1% of welfare gains compared to a dampening effect of -6.8% under the unlikely scenario where these measurement problems do not occur—a hefty 15 percentage point turnaround. This aggregate 8.1% upgrade in the relative importance of trading gains masks a great deal of variation ranging from 4.1% for NAFTA to 35.0% for Europe, compared to 10.4% for emerging nations. To some important extent, our results contribute to nuance the well-established narrative that limits trading gains to a quantitatively small and transitory effect. JEL Classification Codes: C67, D24, E01, F41 and F62.
Corresponding author: [email protected]

1
I. Introduction An important question at the crossroads of macroeconomics and international trade is to
inquire into the sources of advances in domestic welfare. An established line of
thinking, which can be traced back at least to Diewert and Morrison (1986), stresses the
“symmetric” interpretation between improvements in the terms of trade and technical
change—both of which translate into an increase of net output for a similar set of
endowments. Specifically, with productivity gains, an economy raises its domestic
income which is regarded as a proxy of domestic welfare. Similarly, favourable terms of
trade movements allow a larger quantity of imports to be purchased for a given quantity
of exports thus raising the purchasing power of domestic income.
Although, conceptually, productivity gains and favourable terms of trade are at
the core of improvements in domestic welfare, much of the literature and policy-making
assumed that productivity is “almost everything”, leaving virtually no room for terms of
trade. For example, Diewert and Lawrence (2006, 49), in their comprehensive study on
Australia’s welfare gains, conclude “(...) that, taken over long time periods of several
decades, changes in the terms of trade have relatively little impact on Australian
welfare. Welfare benefits from improvements in the terms of trade in one period tend to
be offset by losses from subsequent deteriorations in the terms of trade.” Kohli
(2014,Table 1, 13) reaches a similar conclusion for a larger sample of economies at a
different stage of development.
In this paper, we argue that the unprecedented recent alteration to the pace,
shape, and engagement of nations in the global trade flows warrants a fresh look at the
relative importance of terms of trade and productivity in welfare gains. The starting point
of our argument is that, while these flows have made the world economy much more
integrated, they prompted new measurement problems regarded as being important by
a recent strand of literature. First, intermediate inputs are the primary vehicle of this
global integration. They cross borders several times during the manufacturing process,
making conventionally measured exports subject to a double-counting problem.
Although this problem has long been recognized by both the economics profession
(e.g., Hummels et al. 2001), Koopman et al. (2014) provided the first serious treatment
of this pitfall. Their concept of value added of exports developed as part of a unified
framework highlights a 43% world average double counting in 2004, ranging from
10.9% for Russia to 63.7% for Singapore. Johnson and Noguera (2012) found that this
2
double counting problem emerged since the 1970s, and worsened after 1990 which
marks the development of the second wave of globalization.
Second, doubts also emerged on the reliability of import prices as they do not
adequately track the cost-savings that arise from the shift in sourcing to low-cost foreign
suppliers—offshoring bias. Ever since the June 2007 Business Week cover story with
the somewhat inflammatory title, “The Real Cost of Offshoring” (Mandel 2007), failure to
measure price declines associated with offshoring has been the focus of an active line
of research which assessed their implications on a variety of flagship economic
indicators. Offshoring bias has been found as being important in U.S. manufacturing
where the imported share of intermediate inputs from low-wage countries rose from
about 17% to 25% over the 1997-2007 period (see Houseman et al. 2011). Compared
with prices of intermediate inputs produced in the U.S., quality-adjusted prices are
25.2% and 13.8% lower in developing and intermediate countries, respectively
(Houseman et al. 2010). Final consumer spending, an important area of the domestic
economy, has not been insulated from those trends either. Reinsdorf and Yuskavage
(2016) found evidence of an important upward bias in the import indexes for some types
of durable goods, especially computers, and a more modest upward bias in the import
indexes for apparel. Both of these studies emphasized that this upward bias led to an
overestimation of the productive performance of manufacturing and the entire business
sector of the U.S. economy during the decade ending in 2007.
To revisit how much trading gains and multifactor productivity contribute to
welfare gains, we extend the framework developed by Diewert and Morrison (1986) and
Kohli (2004) in two important dimensions: First, we build a dual framework of the notion
of production possibility frontier, an approach that symmetrically treats trading gains and
productivity gains as a price-effect. Thus, our approach differs from the one employed
by Diewert and Morrison (1986) and Kohli (2004) which offers the disadvantage of
blending a price-effect (terms of trade gains) with a real effect (productivity gains)—a
combination that does not always lend itself to a straightforward interpretation. Second,
we then turn to the question of the accuracy of trading gains and productivity gains,
assessing how much they might be impacted by the compelling evidence on double
counting of the exports and offshoring bias. While these measurement problems
entertain a complex interplay which may lead to small quantitative net changes, we
believe that the exercise performed in this paper remains worthwhile for the sake of
good measurement.

3
To take our framework to the data, we turn to the World Input Output Tables
(WIOT) and the Socio-Economic Accounts (SEA) with an emphasis on a representative
set of ten economies (Canada, China, France, Germany, India, Italy, Mexico,
Netherlands, UK, and the U.S.) accounting, on average, for 52.2% of global GDP in
current international prices. We first estimate the trading gains/losses (terms of trade
and real exchange effect) that these featured economies record out of their trade
relations with some of the main trading zones (NAFTA, EU-Core, EU-Periphery, China
and India as representatives of emerging nations and the rest of the world) over the
1996-2009 period. We then estimate the multifactor productivity trends of these ten
economies to arrive at the welfare growth accounting recorded over the same period.
We provide baseline estimates of welfare gains and their allocations in terms of trading
gains and multifactor productivity advance which are then contrasted with estimates that
are adjusted for double counting and offshoring bias.
With the explicit account of double counting of exports and offshoring bias, our
results feature the following findings: First, for the whole set of ten economies over the
1996-2009 period, welfare gains advanced annually at 1.05% compared to 1.13% of the
unlikely event where double counting and offshoring bias do not occur (our baseline
scenario). This 0.09 percentage point downgrade ranges from a -0.17 percentage point
for Europe (roughly the same order of magnitude for emerging nations) to a moderate
0.03 percentage point upgrade for NAFTA. Second, over the same period and for the
whole sample of economies, trading gains reported a remarkable turnaround to 0.09%
from -0.08% (under the baseline scenario) while multifactor productivity experienced a
reversal from 1.21% to 0.96%. This 0.17 percentage point turnaround in the trading
gains may appear negligible but, when cumulated over the 1996-2009 period, will add a
fairly significant 3.2% to the welfare gains advance. Consequently, trading gains have
now contributed to lift welfare gains by 8.1%, a striking difference from the baseline
scenario where they dampened them by -6.8%. This 8.1% ranges from 4.1% for NAFTA
to 35.0% for Europe while emerging nations reported a 10.4% increase. Third, while
productivity performance still remains the main contributor to welfare gains, our work
has the dual merit of emphasizing the importance of additional measurement issues
than those highlighted by the literature and to offer, along the way, a more nuanced
perspective on the quantitative relative importance of trading gains.
While our work draws upon the venerable literature discussed above, it is
intimately related to recent efforts of reassessing economic performance indicators in

4
light of the recent change in the structures of international trade prompted by
globalization. The closest antecedent to our work is represented by Feenstra et al.
(2013) who found a considerable understatement in the decline of import prices that
arise from longstanding measurement problems in official statistics—the use of a fixed-
base Laspeyres formula combined with the lack of accounting for the variety and the
decline in tariffs. The unattended effect of this practice features unmeasured terms of
trade gains which translated into an overstatement of the post-1995 productivity surge
of the U.S. economy. Our work is also related to Nakamura and Steinsson (2012) who
brought to light the presence of a product replacement bias in the U.S. international
trade prices. This other form of measurement problem tends to delay price adjustments
until the time of introduction of a new model and is found to be responsible for
smoothing out import and export price indexes. We extend this literature by placing the
emphasis on double counting and offshoring bias while ruling out the possible presence
of other longstanding measurement problems which may or may not exacerbate the
measurement errors that we uncover in our work.
Our work is also related to more recent developments in the literature of the
measurement of welfare. Feenstra et al. (2015) has incorporated trading gains in the
measurement of the real GDP level suitable for comparisons across time and countries.
While our framework places the emphasis on growth-accounting, we expect that our
results could be extended to incorporate level-accounting comparisons, but such an
extension is beyond the scope of the present paper. Basu et al. (2016) have shown
how, under a broad set of considerations, multifactor productivity and capital stock can
be fruitfully used to construct summary statistics on welfare. Their paper represents a
welcome generalization to a dynamic setting of some of our results obtained in a static
framework, but measurement problems are assumed away (p. 18) while they are at the
core of our investigation.
The remainder of the paper is structured as follows. Section II introduces the
framework along with its implications. The quantitative analysis, which features the
source data, the adjustment undertaken and the analysis of the results, is provided in
Section III. Concluding remarks are drawn in Section IV.

5
II. Framework
1. Basic Setup Diewert and Morrison (1986) formulated a production theory setting that provided index
number estimates of the contribution of terms of trade gains and multifactor productivity
gains to welfare gains. Their framework rests on the notion of a production possibility
frontier that allows for joint production of the categories of the final demand GDP
(consumption, investment, and net exports) from capital and labor services. Kohli (2004)
extended this framework to account for the real exchange rate gains, another price-
effect which, in combination with the terms of trade gains, forms the notion of trading
gains. Though the approach developed by this set of contributions made a significant
advance in the way of tracking economic performance in an open macroeconomic
setting, the proposed framework offers the disadvantage of blending a price-effect
(terms of trade gains) with a real effect (productivity gains)—a combination that does
not always lend itself to a straightforward interpretation. We take the counterpoint of this
approach by considering a dual approach that has the merit to harmonize the treatment
of these two gains as a price-effect.
Consider the technology of a given economy characterized by the following GDP
function:
𝐺(𝑃𝐶 , 𝑃𝐼 , 𝑃𝐺 , 𝑃𝑋 , 𝑃𝑀 , 𝐾, 𝐿, 𝑡) =
max{𝐶𝑡,𝐼𝑡,𝐺𝑡,𝑋𝑡,𝑀𝑡}{𝑃𝐶𝐶 + 𝑃𝐼𝐼 + 𝑃𝐺𝐺 + 𝑃𝑋𝑋 − 𝑃𝑀𝑀: (𝐶, 𝐼, 𝐺, 𝑋,𝑀, 𝐾, 𝐿, 𝑡) ∈ 𝑇𝑡}. (1)
This technology is subject to the assumption of constant returns to scale, implying that:
𝑃𝐶𝐶 + 𝑃𝐼𝐼 + 𝑃𝐺𝐺 + 𝑃𝑋𝑋 − 𝑃𝑀𝑀 ≡ 𝑃𝐾𝐾 + 𝑃𝐿𝐿. (2)
Differentiating (2), with respect to time and dividing by 𝐺(∙) and rearranging terms
yields, the following identity between the primal and dual multifactor productivity formula
(�̂�
𝐴) :
�̂�
𝐴= (𝑠𝑐
�̂�
𝐶+ 𝑠𝐼
𝐼
𝐼+ 𝑠𝐺
�̂�
𝐺+ 𝑠𝑋
�̂�
𝑋− 𝑠𝑀
�̂�
𝑀) − (𝑠𝐾
�̂�
𝐾+ 𝑠𝐿
�̂�
𝐿)
≡ −(𝑠𝑐�̂�𝐶
𝑃𝐶+ 𝑠𝐼
�̂�𝐼
𝑃𝐼+ 𝑠𝐺
�̂�𝐺
𝑃𝐺) − (𝑠𝑋
�̂�𝑋
𝑃𝑋− 𝑠𝑀
�̂�𝑀
𝑃𝑀) + (𝑠𝐾
�̂�𝐾
𝑃𝐾+ 𝑠𝐿
�̂�𝐿
𝑃𝐿) (3)
with 𝑠𝑖(𝑖 = 𝐶, 𝐼, 𝐺, 𝑋,𝑀,𝐾, 𝐿) representing the share of 𝑖 in nominal GDP. Under the well-
known conditions of constant returns to scale, competitive markets, and instantaneous
adjustment of factor inputs, the term (�̂�
𝐴) is interpreted as an indicator of technical

6
change (see Hulten 2001). The term (𝑠𝑋�̂�𝑋
𝑃𝑋− 𝑠𝑀
�̂�𝑀
𝑃𝑀) which represents the trading gains
effect along with (�̂�
𝐴) both have the same property— an increase of net-output for a
given set of inputs. Diewert and Morisson (1986) dubbed the combination of these two
terms as welfare gain. Hence, it makes sense to group these two terms as:
�̂�
𝐴+ (𝑠𝑋
�̂�𝑋
𝑃𝑋− 𝑠𝑀
�̂�𝑀
𝑃𝑀) ≡ −(𝑠𝑐
�̂�𝐶
𝑃𝐶+ 𝑠𝐼
�̂�𝐼
𝑃𝐼+ 𝑠𝐺
�̂�𝐺
𝑃𝐺) + (𝑠𝐾
�̂�𝐾
𝑃𝐾+ 𝑠𝐿
�̂�𝐿
𝑃𝐿)
= −�̂�𝐷
𝑃𝐷+�̂�𝑍
𝑃𝑍. (4)
with −�̂�𝐷
𝑃𝐷≡ −(𝑠𝑐
�̂�𝐶
𝑃𝐶+ 𝑠𝐼
�̂�𝐼
𝑃𝐼+ 𝑠𝐺
�̂�𝐺
𝑃𝐺) and
�̂�𝑍
𝑃𝑍≡ (𝑠𝐾
�̂�𝐾
𝑃𝐾+ 𝑠𝐿
�̂�𝐿
𝑃𝐿). So, welfare gains represent
the decline in the price of gross domestic income not attributable to the combined price
change of the inputs. The trading gain term can be re-written as:
𝑠𝑋�̂�𝑋𝑃𝑋− 𝑠𝑀
�̂�𝑀𝑃𝑀
≡ (𝑠𝑐�̂�𝐶𝑃𝐶+ 𝑠𝐼
�̂�𝐼𝑃𝐼+ 𝑠𝐺
�̂�𝐺𝑃𝐺+ 𝑠𝑋
�̂�𝑋𝑃𝑋− 𝑠𝑀
�̂�𝑀𝑃𝑀) − (𝑠𝑐
�̂�𝐶𝑃𝐶+ 𝑠𝐼
�̂�𝐼𝑃𝐼+ 𝑠𝐺
�̂�𝐺𝑃𝐺)
≡�̂�𝑌𝑃𝑌−�̂�𝐷𝑃𝐷
(5)
with �̂�𝑌
𝑃𝑌 and
�̂�𝐷
𝑃𝐷 representing, respectively, the change in the GDP implicit price index
(first term between parentheses on the right-hand side of (5)) and the change in the
implicit price index of domestic demand (second term between parentheses on the
right-hand side of (5)) defined as:
�̂�𝐷
𝑃𝐷= 𝜔𝑐
�̂�𝐶
𝑃𝐶+𝜔𝐼
�̂�𝐼
𝑃𝐼+ 𝜔𝐺
�̂�𝐺
𝑃𝐺 (6.1)
and
�̂�𝑌
𝑃𝑌= 𝑠𝐷
�̂�𝐷
𝑃𝐷+ 𝑠𝑋
�̂�𝑋
𝑃𝑋− 𝑠𝑀
�̂�𝑀
𝑃𝑀 (6.2)
with 𝜔𝑖(𝑖 = 𝐶, 𝐼, 𝐺) representing the share of the categories of domestic demand 𝑖 in the
domestic demand 𝑃𝐷𝐷 ≡ 𝑃𝐶𝐶 + 𝑃𝐼𝐼 + 𝑃𝐺𝐺. Thus, our framework leads to a straight
version of the dual measure of the ratio of real GDI to real GDP discussed in Kohli
(2014).
Using (6) and the fact that 𝑠𝐷 + 𝑠𝑋 − 𝑠𝑀 = 1, (5) can be rewritten as:
𝑠𝑋�̂�𝑋
𝑃𝑋− 𝑠𝑀
�̂�𝑀
𝑃𝑀= (1 − 𝑠𝑋 + 𝑠𝑀)
�̂�𝐷
𝑃𝐷+ 𝑠𝑋
�̂�𝑋
𝑃𝑋− 𝑠𝑀
�̂�𝑀
𝑃𝑀−�̂�𝐷
𝑃𝐷= −𝑠𝑋
�̂�𝐷
𝑃𝐷+ 𝑠𝑀
�̂�𝐷
𝑃𝐷+ 𝑠𝑋
�̂�𝑋
𝑃𝑋− 𝑠𝑀
�̂�𝑀
𝑃𝑀
(7)
7
Note that :
𝑠𝑋�̂�𝑋
𝑃𝑋≡1
2𝑠𝑋
�̂�𝑋
𝑃𝑋+1
2𝑠𝑋
�̂�𝑋
𝑃𝑋 (8.1)
and
−𝑠𝑀�̂�𝑀
𝑃𝑀≡ −
1
2𝑠𝑀
�̂�𝑀
𝑃𝑀−1
2𝑠𝑋
�̂�𝑀
𝑃𝑀 (8.2)
Using (8.1) and (8.2), (7) then becomes:
𝑠𝑋�̂�𝑋
𝑃𝑋+ 𝑠𝑀
�̂�𝑀
𝑃𝑀= −𝑠𝑋
�̂�𝐷
𝑃𝐷+ 𝑠𝑀
�̂�𝐷
𝑃𝐷+1
2𝑠𝑋
�̂�𝑋
𝑃𝑋+1
2𝑠𝑋
�̂�𝑋
𝑃𝑋−1
2𝑠𝑀
�̂�𝑀
𝑃𝑀−1
2𝑠𝑋
�̂�𝑀
𝑃𝑀 (9)
Adding −1
2𝑠𝑋
�̂�𝑀
𝑃𝑀+1
2𝑠𝑋
�̂�𝑀
𝑃𝑀−1
2𝑠𝑀
�̂�𝑋
𝑃𝑋+1
2𝑠𝑀
�̂�𝑋
𝑃𝑋 on the right-hand side of (9) leads to the
following formula of trading gains:
𝑠𝑋�̂�𝑋𝑃𝑋+ 𝑠𝑀
�̂�𝑀𝑃𝑀
=1
2(𝑠𝑋 + 𝑠𝑀) (
�̂�𝑋𝑃𝑋−�̂�𝑀𝑃𝑀) + (𝑠𝑋 − 𝑠𝑀) (
1
2
�̂�𝑋𝑃𝑋+1
2
�̂�𝑀𝑃𝑀−�̂�𝐷𝑃𝐷)
=1
2(𝑠𝑋 + 𝑠𝑀) (
�̂�𝑋𝑃𝑋−�̂�𝑀𝑃𝑀) +
1
2(𝑠𝑋 − 𝑠𝑀) (
�̂�𝑋𝑃𝑋+�̂�𝑀𝑃𝑀− 2
�̂�𝐷𝑃𝐷)
=1
2(𝑠𝑋 + 𝑠𝑀) (
�̂�𝑋
𝑃𝑋−�̂�𝑀
𝑃𝑀)
⏟
Terms of Trade Effect (�̂�
𝑇)
+1
2(𝑠𝑋 − 𝑠𝑀) [(
�̂�𝑋
𝑃𝑋−�̂�𝐷
𝑃𝐷) + (
�̂�𝑀
𝑃𝑀−�̂�𝐷
𝑃𝐷)]
⏟
Real Exchange Effect (�̂�
𝐸)
(10)
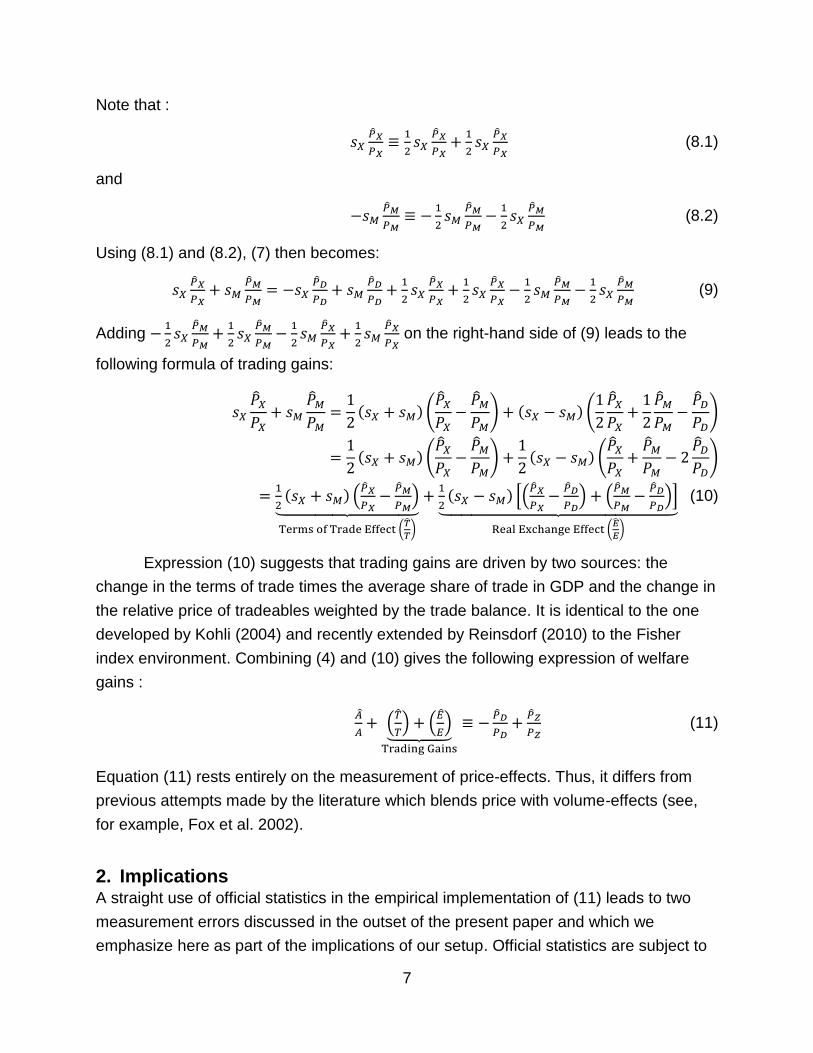
Expression (10) suggests that trading gains are driven by two sources: the
change in the terms of trade times the average share of trade in GDP and the change in
the relative price of tradeables weighted by the trade balance. It is identical to the one
developed by Kohli (2004) and recently extended by Reinsdorf (2010) to the Fisher
index environment. Combining (4) and (10) gives the following expression of welfare
gains :
�̂�
𝐴+ (
�̂�
𝑇) + (
�̂�
𝐸)⏟
Trading Gains
≡ −�̂�𝐷
𝑃𝐷+�̂�𝑍
𝑃𝑍 (11)
Equation (11) rests entirely on the measurement of price-effects. Thus, it differs from
previous attempts made by the literature which blends price with volume-effects (see,
for example, Fox et al. 2002).
2. Implications A straight use of official statistics in the empirical implementation of (11) leads to two
measurement errors discussed in the outset of the present paper and which we
emphasize here as part of the implications of our setup. Official statistics are subject to

8
a dual pitfall. First, export statistics record the gross value of goods at each border
crossing rather than the value added content between border crossings. Second, there
is compelling evidence of an upward bias in the imports-price index indicating their
failure to capture price declines associated with shifts to lower cost foreign suppliers of
intermediate inputs. We now move to assess the way (11) needs to be altered to
adequately account for these two measurement problems.
Accounting for these two problems leads to a complex set of changes in (11) in
which the ultimate effects are difficult to predict on a priori grounds. The changes may
work in opposite directions thus leaving the ultimate effects to the empirical results.1
These two problems directly affect the trading gains components and indirectly affect
the other components of (11). Moving away from the conventional measure of exports
to value added of exports reduces the value of nominal GDP which leads to the
following direct effects: i) a change in the relative importance of exports in nominal GDP
and an upgrade in the share of components of domestic absorption (𝐶, 𝐼 and 𝐺) and
imports (𝑀); and ii) a change in the aggregate price index of exports whose direction
cannot be predicted. The related indirect effect manifests itself through the right-hand
side of (11), i.e., a corresponding decline in the value of labour and capital
compensation following the decline in nominal GDP for which the relative shares in
GDP remain unchained. The respective prices of these two primary factor inputs (�̂�𝑍
𝑃𝑍)
are adjusted accordingly to reflect the decline in their value of compensation. The other
effect occurs through (�̂�𝐷
𝑃𝐷). Similarly, accounting for offshoring bias leads to a direct
effect represented by a decline in the trend of the imports price index (�̂�𝑀
𝑃𝑀), hence, on
trading gains. Given that multifactor productivity growth is measured as a residual, then
the net effect of these changes alters the term (�̂�
𝐴).
In light of these changes, equation (11) is amended in the following way:
(�̂�
𝐴)
𝑎
+ (�̂�
𝑇)
𝑎
+ (�̂�
𝐸)
𝑎
⏟ Adjusted Trading Gains
= −(�̂�𝐷𝑃𝐷)
𝑎
+ (�̂�𝑍𝑃𝑍)
𝑎
(12)
with
1 See Houseman et al. (2011, 129) for a similar point of view: “That said, the measurement of GDP is
subject to a wide range of problems that can bias the statistics up or down, and many other factors may work in opposite directions, thus leaving open the degree—or even the direction—of the overall bias in the official statistics.ˮ

9
1
2(𝑠𝑉𝐴𝑋 + 𝑠𝑀
𝑎 ) [�̂�𝑉𝐴𝑋𝑃𝑉𝐴𝑋
− (�̂�𝑀𝑃𝑀)
𝑎
]⏟
Adjusted Terms of Trade Effect (�̂�𝑇)𝑎
+1
2(𝑠𝑉𝐴𝑋 − 𝑠𝑀) [(
�̂�𝑉𝐴𝑋𝑃𝑉𝐴𝑋
− (�̂�𝐷𝑃𝐷)
𝑎
) + [(�̂�𝑀𝑃𝑀)
𝑎
− (�̂�𝐷𝑃𝐷)
𝑎
]]
⏟
Adjusted Real Exchange Effect (�̂�𝐸)𝑎
(13)
where 𝑎 stands for an adjustment of the initial variables and 𝑠𝑉𝐴𝑋 represents the value
added of exports as a share of GDP. Similarly, �̂�𝑉𝐴𝑋
𝑃𝑉𝐴𝑋 indicates the adjusted export price
index now based on value added of exports (𝑉𝐴𝑋) values.
III. Quantitative Analysis
1. The Source Data The primary source data used in this paper is based by on the World Input Output
Database (WIOD) developed and maintained by the Groningen Growth and
Development Center (GGDC).2 This source data comprises four building blocks
represented by the World Input-Output Tables (WIOT), the Socio Economic Accounts
(SEA), the National Input Output Tables (NIOT), and the Environmental Accounts (EA)
(see Timmer et al. 2015). An attractive feature of the WIOD is that it represents a rich
dataset with a high degree of integration and consistency with a potential to support a
broad-based empirical research effort.
Of its four components, the WIOT and the SEA are directly relevant to the
empirical implementation of the framework devised in this paper. The WIOT is
considered an extension of the input-output tables from a national to a worldwide
setting, featuring the commodity and industry inter-country flows of inputs, income
generating output, and final demand categories for the 1995-2011 period in both current
U.S. prices and constant (previous year) prices for 40 countries at different stages of
development and the rest of the world (ROW) (see Dietzenbacher et al. 2013 for a
description). The WIOT, in previous year prices, covers only the 1996-2009 period, a
restriction that shapes the time-span retained in this paper. The SEA contains industry
data on value added, gross output in both current and constant (national) prices,
compensation of capital and labor, and employment series for all of the 40 national
economies included in the WIOD. Given the absence of capital stock series from the
2 Available at http://www.wiod.org/new_site/home.htm

10
SEA, we resorted to the 8.1 edition of the Penn World Tables (PWT 8.1) which offer
these data for the same level of aggregation and the same coverage of countries.3
The WIOT is suitable for supporting the implementation of the framework outlined
in Section II which employs a dual aggregate production possibility frontier to examine
how much of the decline in the prices of the total economy outputs in terms of
consumption, investment, and net exports is attributable to changes in the primary input
prices and technical change captured by multifactor productivity under the assumption
of constant returns to scale, perfect competition, and instantaneous adjustments in
factor inputs. Our notion of output covers the whole economy, a measure that is broader
than the one recommended by international guidelines on productivity measurement
(OECD 2001) which place the emphasis on the market economy. The estimates are first
derived at the national level and then aggregated to major trading blocs using nominal
GDP in international prices.
Corresponding data for the primary input prices are constructed from the SEA
and the PWT 8.1. While these source data offer the great advantage of assembling a
consistent set of production accounts for the ten economies considered in this paper,
they offer the disadvantage of using the concepts of employment and capital stock
which do not account for the compositional shifts from low- to high-marginal productivity
forms of inputs. Under these circumstances, these shifts are embedded as part of our
measure of multifactor productivity trends. Thus, our coverage of the whole economy
combined with concepts of inputs constructed not in accordance with the notion of
service flows make our results difficult to reconcile with others produced for some
economies covered in our paper.
2. Adjustments to the Source Data
2.1. Country Groupings
In order to facilitate the analysis of our results, the set of 40 economies that are covered
as part of the WIOD countries are grouped into six ‘meta’ groupings: EU-Core (Austria,
Belgium, Denmark, Spain, Finland, France, Germany, the United Kingdom, Ireland,
Italy, Luxembourg, the Netherlands, Portugal, and Sweden), the EU-Periphery
(Bulgaria, Cyprus, the Czech Republic, Estonia, Greece, Hungary, Lithuania, Latvia,
Malta, Poland, Romania, Slovakia, and Slovenia), NAFTA (Canada, Mexico, and the
United States); China and India representing the major emerging economies and others
which not only include WIOD’s rest of the world (ROW) but also the remainder of the 40
3 Available at http://www.rug.nl/research/ggdc/data/pwt/pwt-8.1

11
countries for which WIOD offers separate data, i.e., Australia, Brazil, Indonesia, Japan,
South Korea, Russia, Turkey, and Taiwan. While the majority of these groupings
correspond to the existing main trading blocs, the one made of the remaining WIOD 40
countries is less than ideal as it lumps together a large variety of countries at different
stages of development offering a wide-range of economic structures. However, we
believe that it offers a convenient way to display the results.
We place the emphasis on ten economies deemed to be representative of the
global economy and provide a higher level of resolution in their trading gains and
multifactor productivity gains by tracking their trade flows with the six ‘meta’ groupings
identified above. These ten economies are: Canada, China, France, Germany, Italy,
India, Mexico, Netherlands, UK, and the U.S.
2.2. Substantive Adjustments
Double counting
Koopman et al. (2014) were amongst the first to identify the problem of double counting
of exports that arose as part of the development of the global value chain and offered a
solution that decomposes gross exports into value added exports and double-counted
components. Recently, Los et al. (2016) exploited the so-called ‘hypothetical extraction’
technique to offer an elegant simplification to this decomposition which we use in the
present paper. The novelty of this technique warrants a brief outline of its conceptual
underpinnings.
This technique structures the world economy along the input-output framework
and computes the value added of exports of a given economy, 𝑠 ,as the difference
between its actual GDP and its hypothetical GDP where the trade linkages are
‘extracted’. Formally, if we assume that the world input-output tables track the
transactions between a given economy, 𝑠, and the rest of the world, 𝑟, then the global
final demand 𝐘 is defined as:
𝐘 = [𝐲𝒔𝒔 𝐲𝒔𝒓𝐲𝒓𝒔 𝐲𝒓𝒓
]
where the vectors 𝐲𝒔𝒔 and 𝐲𝒔𝒓 represent the deliveries from industries in country 𝑠 to
final demand categories in 𝑠 and in 𝑟. Similarly, the global matrix 𝐀 of input coefficients
𝑎𝑖𝑗, which track the intensity with which intermediate inputs delivered by industry 𝑖 are
used by industry 𝑗 is defined as:
𝐀 = [𝐀𝒔𝒔 𝐀𝒔𝒓𝐀𝒓𝒔 𝐀𝒓𝒓
]

12
where 𝐀𝒔𝒔 and 𝐀𝒔𝒓 represent the deliveries of intermediate inputs from industries of
country 𝑠 to local industries and their counterpart in country 𝑟, respectively. The
hypothetical versions of the matrices 𝐘 and 𝐀, noted as 𝐘∗ and 𝐀∗, are defined as:
𝐘∗ = [𝐲𝒔𝒔 𝟎𝐲𝒓𝒔 𝐲𝒓𝒓
] and 𝐀∗ = [𝐀𝒔𝒔 𝟎𝐀𝒓𝒔 𝐀𝒓𝒓
]
where the trade flows between country 𝑠 and the rest of the world 𝑟 have been
cancelled out.
In accordance with the well-established practice that goes all the way back to
Leontief (1949), the corresponding estimates of GDP under both actual and hypothetical
configurations are, respectively:
𝐺𝐷𝑃𝑠 = 𝐯𝑠(𝐈 − 𝐀)−𝟏𝐘𝒊
and
𝐺𝐷𝑃𝑠 = 𝐯𝑠(𝐈 − 𝐀∗)−𝟏𝐘∗𝒊
The value added of exports is then calculated as:
𝑉𝐴𝑋𝑠 = 𝐺𝐷𝑃𝑠 − 𝐺𝐷𝑃𝑠∗ (14)
Offshoring bias
The practice of matched model indexes used to track price changes is well-established
across the whole spectrum of official statistics’ price programs including the imports-
exports price index. The rapid turnover of commodities makes it difficult to track the
price of the same commodity over the previous and the current period. The matched
model method meant to address this problem links incoming items into the index
calculation using the so-called link-to-show no change, a procedure that makes an
implicit quality adjustment procedure. For many decades, while the matched model
method was thought adequate to track pure price changes (quality is held constant), it
became increasingly clear that considerable quality changes were missed as true
changes in quality-adjusted prices that occur at the time that item replacements are
dismissed from the estimate of the rate of price change.
Recent research (see Houseman et al. (2011) and the references therein) finds
that deployment of production from the U.S. to low-wage economies substantially
reduced prices paid by U.S. manufacturers for intermediate inputs, a result that points to
potentially serious mismeasurement problems on key economic indicators such as
economic growth and productivity performance. At the same time, this line of research

13
has emphasized the need to depart from the matched model import price index which
fails to account for the entry of lower-priced items from new producers in low cost
offshore locations—offshoring bias. In the absence of an alternate import price index
which eliminates this bias, Diewert and Nakamura (2009) devised the following
correction for the upward bias 𝐵 in the official import price index:
𝐵 = (1 + 𝑖) ∙ 𝜇 ∙ 𝑑, (15)
where (1 + 𝑖) represents the price movement of the official intermediate input price
index which corresponds to the variable �̂�𝑀
𝑃𝑀 used throughout our accounting framework;
𝜇 represents the import share captured by low-cost suppliers as a share of total imports,
and 𝑑 gives the so-called percentage cost advantage of purchasing the input from a
low-cost supplier over a high-cost supplier. With the estimate of 𝐵, the import price
index is adjusted as follows:
(�̂�𝑀𝑃𝑀)
𝑎
=�̂�𝑀𝑃𝑀− 𝐵.
(16)
Quantitative Impact
We begin the analysis of the substantive adjustments to the data with the extent of
double counting for our selected set of ten economies for the 1996-2009 period. We
have considered this whole period without any split in sub-periods as it represents the
full business cycle prior to the Great Recession. The results reported in Figure 1, based
on (14), suggest that the order of magnitude of double-counting is large with a median
for the ten economies that increased from 23.9% in 1996 to of 28.7% in 2009. This
suggests that the global supply chain and its related multiple border crossings of
intermediates at different stages of processing have gained traction over this period.
The range around this median is large, averaging 28.0 percentage points over the 1996-
2009 period. The U.S. defines the lower bound which averages 11.9% while the upper
bound is represented by the Netherlands with an average close to 40.0%, an indication
that the severity of double counting varies with the size of the economy which, in turn,
shapes trade intensity. These results are broadly consistent with those reported by
Johnson (2014, Table 1, Columns 1 and 2) based on the WIOD for 2008 though with a
slightly different time period. Interestingly, double accounting steadily increased after
2002, a timing that coincided with the admission of China to the World Trade
Organization in late 2001.
[Insert Figure 1 Here]

14
On a cross-country basis, the variation in the order-of-magnitude of double
counting and its evolution over time is nothing short of remarkable (Figure 2). Though
countries like the Netherlands, Mexico, Canada, France, and the UK report a sizable
order-of-magnitude in double counting as early as 1996, this pattern has evolved
differently by 2009. Canada and, to a lesser extent, the UK were the only countries that
experienced a decline in the order-of-magnitude of double counting owing possibly to
the shift of these two economies away from manufacturing towards natural resources
and financial services, respectively. Nonetheless, their size of double counting remains,
in 2009, close to the median of our sample. In contrast, all other countries have seen
their double counting worsening off, albeit with considerable variation regardless of the
stage of the development of the economy. With 13.2 percentage points, India reported
the largest increase followed far behind by Germany (+7.4 percentage points) while
China remains a distant third (+5.2 percentage points) close to Italy and France (+4.8
and +4.1 percentage points, respectively).
[Insert Figure 2 Here]
The main take-away point out of this exercise is that double counting in exports
matter in a meaningful way with an order of magnitude that is generally large and
increasing over time. The same holds true for offshoring bias, though the impact of each
of these measurement issues on each of the economies of our sample varies
considerably. Our investigation of offshoring bias begins with the analysis of the relative
importance of the geographical origin of the imports of the selected set of ten
economies. This information is important given that the offshoring bias arises from the
assumption that advanced countries shift towards low-cost suppliers for the sourcing of
intermediate inputs.
Table 1, which reports the shift in sourcing in the manufacturing sector for our set
of economies over the 1996-2009 period, highlights three main results. First, the relative
decline of the main trading bloc in the geographical origin of the imports of
intermediates by developed nations. For example, back in 1996, 2/3 of Canadian
imports originated from NAFTA compared to roughly 50% in 2009. The same holds true
for our sample of EU members for which the EU-Core still accounts for nearly half of
their imports in 2009, though down from 60% in 1996. Second, the falling behind of
NAFTA and the EU as the two main global trading zones in the source of imports for
NAFTA between 1996 and 2009 primarily benefited China. For the EU, much of the
decline in the EU-Core as a source of imports benefited China and the EU-Periphery

15
almost equally. There is, however, considerable variations across countries. For
example, the relative importance of imports from China has considerably advanced for
the U.S. and Mexico with a little higher than 11 percentage points for both and less so
for Canada which reported a more modest +7.5 percentage points. The advance of
China in the imports of the EU-Core has been more modest with a high of 5.7
percentage points for Germany and a low of 3.7 percentage points for Italy. Third, in
addition to developed nations, developing nations have not been immune from the shift
towards China’s supply of their imports. For example, the increase of India’s imports
from China is 13.3 percentage points slightly higher than that of Mexico. In contrast, this
shift in the sourcing of imports has been has been a one-way street for China whose
relative importance of imports from India advanced rapidly though with a level that
remains extremely low in 2009.
[Insert Table 1 Here]
Now that we have established the presence of compelling evidence in favor of a
shift in the sourcing of imports from suppliers in developed economies to their
competitors located in low-wage economies, we need to discuss the way in which we
arrive at the offshoring bias defined in (15). The absence of customized estimates
requires a multi-pronged approach that combines adjustments to the data along with
some simplifying assumptions commonly used in the literature. Since offshoring bias
arises primarily from the manufacturing sector and involves low-wage economies, the
variable 𝜇 in (15) needs to be altered in a way that captures the size of manufacturing
goods imported from the low-wage country 𝑖 in the total imports of economy 𝑗 (𝑗 =
1, … , 10), i.e. 𝜇𝑖𝑗𝑀,𝑇
. This is accomplished using the following equation 𝜇𝑖𝑗𝑀,𝑇 = 𝜇𝑖𝑗
𝑀 ∙ 𝜇𝑖𝑗𝑇 with
𝜇𝑖𝑗𝑀 representing the size of manufacturing goods imported by country 𝑗 from 𝑖 in the
overall imports of 𝑗 from 𝑖 while 𝜇𝑖𝑗𝑇 refers to the imports from country 𝑖 as a share of
total imports of country 𝑗. The imports of manufactured goods from the low-wage
country 𝑖 contain both intermediates and final goods. The latter component is included
following Kohli (2004, 88) who considers that even final demand imports are often
subject to further adjustments or transportation before they can be truly considered final
demand. A part of these imports accrue to the manufacturing sector (𝜇𝑖𝑗𝑀) while the
remainder ends up in the rest of the economy (𝜇𝑖𝑗−𝑀) in accordance with the identity
𝜇𝑖𝑗𝑀 + 𝜇𝑖𝑗
−𝑀 = 1.

16
The final piece of the jigsaw required to calculate the order-of-magnitude of
offshoring bias is represented by the cost-advantage 𝑑 offered by foreign input
producers relative to the domestic ones which we borrow from the estimates
constructed by Houseman et al. (2010) for the U.S. Their estimate of the cost-
advantage is constructed from a set of microdata prices based on a set of 344 narrowly-
defined manufactured commodities classified into developing, intermediate, and
advanced economies over the 1997-2007 period. The approach proceeds with the
estimate of the price change when a given firm switches providers to a new source
country after an account of the item specification. These estimates are then further
refined to account for quality change so the term 𝑑 tracks a pure change in the cost-
advantage. Their result suggests that, on average, the quality-adjusted adjusted cost
advantage accompanying a shift from a high-cost supplier to an intermediate-cost
supplier was 13.8%. Similarly, the cost–advantage resulting from a shift from high-cost
to a low-cost supplier is estimated to be 25.2%.4
While these estimates have been carefully constructed and constitute a serious
advance in our understanding of the extent of mismeasurement that arises from
offshoring, their emphasis is on the U.S. economy which make them possibly less ideal
to other major developed economies considered in our representative set of economies.
For this reason, we place some bounds around these estimates to ascertain the extent
to which they may impact trading gains and productivity performance. Using this set of
estimates, we constructed the extent of offshoring bias experienced by the sample of
economies covered by our sample. The results reported in Figure 3 suggest a 1/5
percentage point upward bias at the aggregate level ranging from almost half of
percentage point for Germany, the country that possesses the largest relative
importance of manufacturing, and virtually a neutral effect for the UK, possibly a result
of the swift deindustrialization in this last country (see Nickell et al. 2008).
[Insert Figure 3 Here]
3. Trading Gains and Productivity under Alternate Configurations We have now reached the stage where we can assess the impacts of double counting
in the value of exports and offshoring bias on welfare gains that originate from trading
4 All South American countries and the EU-periphery are allocated to the intermediate country group
whereas the developing country group consists of China, Indonesia, India, Taiwan and the Rest of the World.

17
gains and multifactor productivity performance. The first stage in the analysis is to
obtain the estimates of the two components without any adjustment in the data. The
results, which we refer to as baseline estimates, are entertained here as a benchmark.
3.1. Baseline Estimates
Tables 2a, 2b, and 2c offer a double-entry structure where rows report the ten sets of
economies and their groupings as well as a set of trading blocs in columns (i.e., NAFTA,
EU split between the core and the periphery and China and India as the two
representative emerging economies, and the rest of the world (ROW)). These tables
provide baseline and adjusted estimates displayed in Panels A-C for terms of trade, real
exchange rate, and their sum as trading gains, respectively. The figures reported in the
table represent average annual growth rates in percentages over the 1996-2009 period.
The display side-by-side of the baseline and the adjusted estimates are meant to
facilitate comparisons.
We begin with the baseline estimates. Consider the results reported in Table 2a
which focus on NAFTA and its three constituent countries. The analysis of the results is
best illustrated through the consideration of a specific example. For instance, Canada
reported a -0.35% deterioration in its terms of trade over the 1996-2009 period, of which
more than half stems from its trading relations with NAFTA (-0.19 percentage point).
This stands in a sharp contrast with Mexico which reports a 0.26 percentage point of its
0.51% advance in its terms of trade from within NAFTA alone. The results for the real
exchange rate, however, are of a considerably smaller order-of-magnitude with a similar
pattern as those for the terms of trade. The 0.05% decline reported by Canada is
primarily driven from trade within NAFTA (-0.09 percentage point) mitigated by trade
with other regions around the world (+0.04 percentage point). With a modest -0.10%
overall change in the trading gains, compared to those of its trading partner, the results
for the U.S. are consistent with the notion that international trade matters less for a large
economy like the U.S. which also happens to shape those of NAFTA.
[Insert Table 2a Here]
Europe as whole also reports a moderate terms of trade loss and in the same
order of magnitude as that of the U.S. (see Table 2b). Within Europe, however, there is
considerable variation with the UK and, to a lesser extent, Italy reporting positive growth
in the terms of trade while the Netherlands, Germany, and France report one-third of a

18
percentage point deterioration. The story remains virtually intact with the consideration
of trading gains, an indication that the real exchange rate remains negligible. Another
regularity that emerges from these figures is that trading gains (losses) are primarily
driven from trade relations within these nations' own trading zone. The median reported
by developed countries is slightly more than 50% which contrasts markedly with the
U.S. where NAFTA generates a modest 28% of the trading losses leaving a hefty 47%
to the ROW.
[Insert Table 2b Here]
The patterns of emerging nations’ trading gains are strikingly different from those
of their developed counterparts (see Table 2c). While trends in terms of trade are large
and generally systematically negative for developed nations and driving much of the
movement of trading gains, the story is opposite for emerging nations which all offer
positive terms of trade trends though with a lower order of magnitude than real
exchange rates which present a negative trend. What sets China and India apart from
Mexico, though, is that their real exchange rate is considerably larger, dwarfing the
terms of trade effect along the way.
[Insert Table 2c Here]
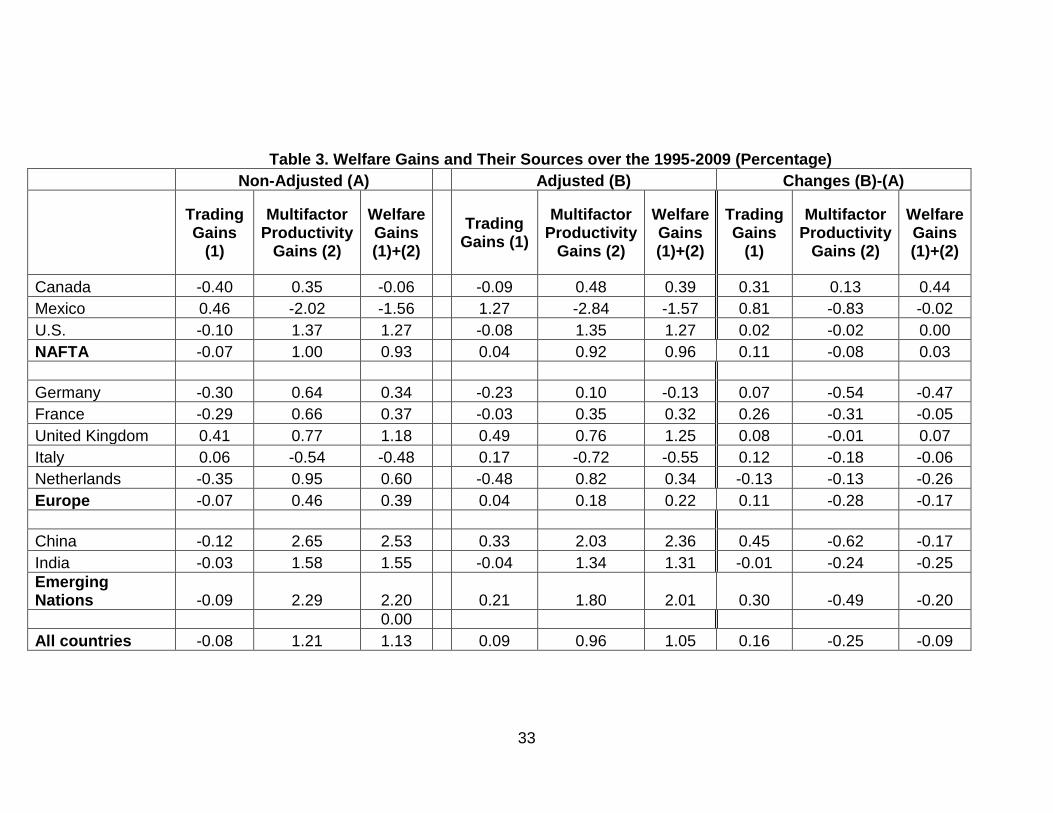
We now complement these estimates of trading gains with multifactor
productivity trends for this sample of economies over the same period. The results
reported in Table 3, Panel A, reiterate some well-established facts such as the 1.21%
aggregate multifactor productivity advance which dwarfs the 0.08% decline in the
trading gains thus entirely lifting the 1.13% welfare gains. Productivity trends report a
great deal of variation across our sample set of economies with the results broadly
consistent with the economic growth experienced in the 20th century which features
success, failure, and catch-up (see Craft and O’Rourke 2013). First, the U.S. reports a
1.37% advance, the most rapid pace amongst developed nations, though lagging
considerably behind China and, to a lesser extent, India which report a performance in
line with the convergence theory. Second, Europe lags considerably behind the U.S.
after a long and steady period of convergence that halted in 1995 (Gordon 2004) with
some economies, like Italy, reporting a substantial productivity deterioration with the
Netherlands outperforming the remainder of the continent. Both Canada and Mexico
report an unenviable productivity performance during a period where the full benefit of
being part of a free trade zone should have come into play. Canada’s lackluster

19
performance still remains a real puzzle while Mexico’s dwindling multifactor productivity
is attributed, according to Hanson (2011), to the fact that economic reforms did not go
far enough, and this economy has been competing unsuccessfully with China for the
same markets.
For the majority of the economies, their trading losses dampened productivity
performance trends which, nonetheless, remains large enough to shape welfare gains.
The exception to this general pattern is Canada where welfare losses result from trading
losses that dwarf productivity performance. At the other end of the spectrum, the UK
reports the second most rapid welfare gains after the U.S. amongst Western economies
due to significant trading gains yet smaller than productivity gains.
[Insert Table 3 Here]
3.2. Adjusted Estimates of Welfare Gains and their Underlying Components
We now present how much double counting of exports and offshoring bias impact the
estimates of welfare gains and their underlying components. While our primary interest
is to assess the quantitative impact of these measurement issues on the relative
contributions of trading gains and multifactor productivity in welfare gains, we begin with
a simple exercise that asks which of these two measurement issues matter the most for
trading gains and productivity. An important aspect of this question is to shed light on
the primary source of the bias and whether there are any identifiable regularities on a
cross-country basis. The results reported in Table 4 suggest that, at the aggregate level,
offshoring bias is found to be primarily responsible for the alteration of the results of
trading gains and multifactor productivity gains, accounting for 3/4 and 4/5, respectively.
While, for the majority of countries, offshoring bias is the primary source in the change
of trading gains estimates, there is no clearly discernible pattern in the revision of the
productivity estimates. For example, in the latter case, for some countries like the U.S.,
the Netherlands and, to a lesser extent, the UK, offshoring bias is the primary source of
the changes in the estimates. For others like Germany and France, both offshoring bias
and double counting of exports are virtually equally responsible. In contrast, Canada
stands out as an outlier with double counting generating almost 3/4 in the revisions of
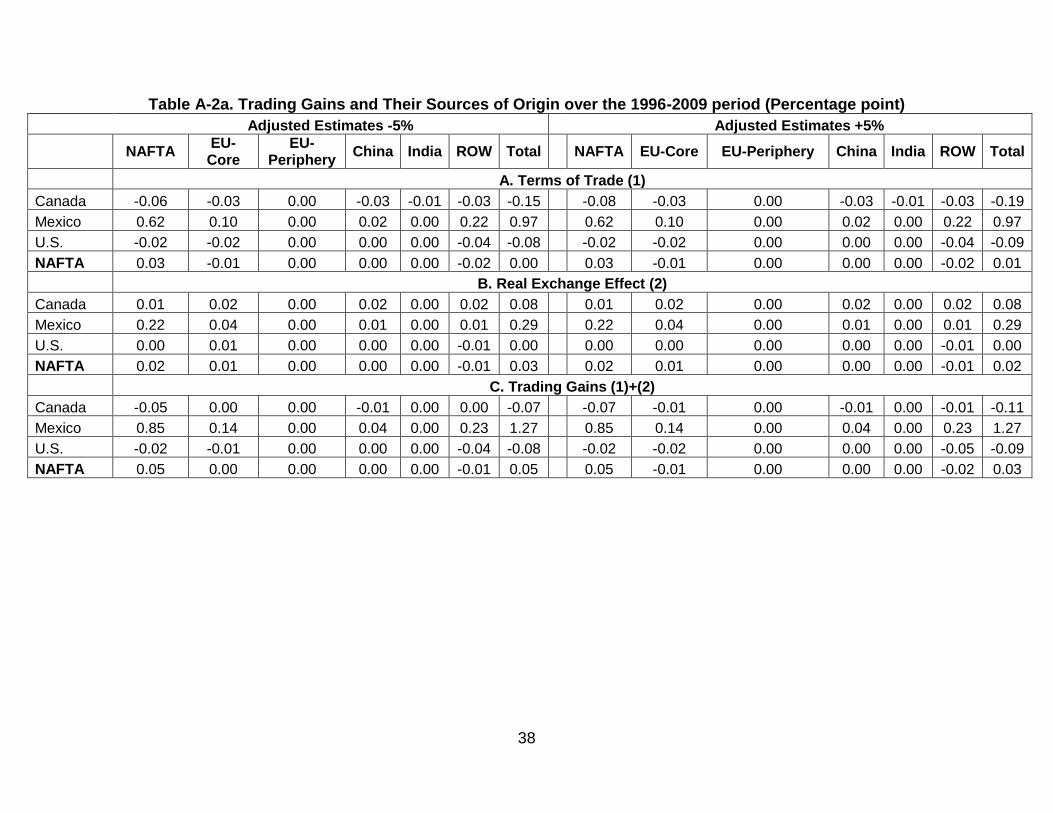
both trading gains and productivity advances. This relative importance of offshoring bias
in the changes of the order magnitude size of the revision of trading gains and
productivity performance also remains robust under alternate estimates of offshoring
bias (see Appendix 1).

20
[Insert Table 4 Here]
We now move to the core aspect of our quantitative analysis which consists of
comparing the estimates on welfare gains and their sources with and without
adjustments for the joint effect of double counting and offshoring bias. The combined
effect of this adjustment, reported in Table 3, Panel C, leads to a 0.16 percentage point
upgrade in the aggregate trading gains (+0.09 compared to a -0.08 percentage point for
the baseline estimates) while multifactor productivity reports a -0.25 percentage point
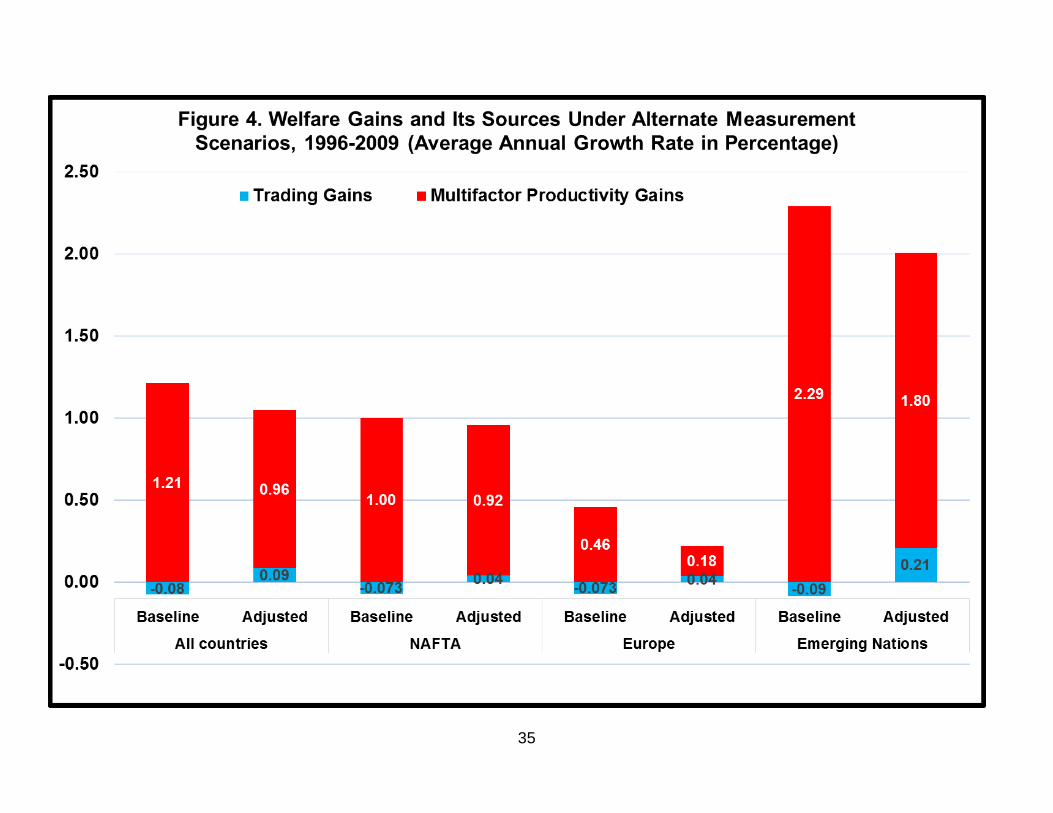
downgrade (+0.96% compared to 1.21% prior to the adjustment). As revealed by Figure
4, this pattern is systematic across the three blocs of economies that are considered: a
downgrade of multifactor productivity performance accompanied with an upgrade of
trading gains. The net effects of these revisions is a -0.09 percentage point decline in
the welfare gains for the set of ten economies with emerging nations reporting the
largest decline (-0.20 percentage point) followed closely by Europe (-0.17 percentage
point) while NAFTA reports a marginal upgrade (+0.03 percentage point).
[Insert Figure 4 Here]
On a cross-country basis, except for the Netherlands and India, trading gains
have improved systematically with the largest increase occurring in Mexico (+0.81
percentage point), China (+0.45 percentage point), Canada (+0.31 p.p.), and France
(0.26 p.p.) (see Table 3). While terms of trade remain the primary components in the
trading gains, the real exchange effect gained a significant turnaround, particularly in
Mexico and, to a lesser extent, in Canada and France (see Tables 2). In contrast, the
majority of economies experienced a deterioration in the productivity performance with
the largest deterioration happening in Mexico (-0.83 p.p.), Germany (-0.73 p.p.), and
China (-0.62 p.p.) while the U.S. reported much a more moderate downgrade. Canada
remains the exception with an increase in productivity possibly due to the small impact
of offshoring bias compared to other countries (see Table 4). The net effect is a
systematic downgrade in welfare for all countries with the exception of Canada which
reported almost half a percentage point upgrade (+0.44), much larger than that of the
UK (+0.07 p.p.), though the sources behind this upgrade are different between the two
economies. For Canada, it is the combined effect in the turnarounds of both trading
gains and productivity while the estimates remained moderately unaffected for the UK.
The results reported for the U.S. are broadly consistent with the one reached by
Feenstra et al. (2013) who identified mismeasurement in import prices as being
21
responsible for the gaining importance of trading gains at the expense of the
productivity surge in the post-1995 period. Our results suggest a 0.02 percentage point
upgrade in the trading gains outweighed by the order-of-magnitude decline in multifactor
productivity, leaving welfare gains unchanged. We can view our work as extending their
results in three important directions. First, we consider a set of different measurement
issues from the ones they have considered. Second, we assess the impact on welfare
gains and on a wide range of other countries. Third, we consider the contribution of
trading gains and multifactor productivity gains on welfare.
All things considered, the adjusted estimates trading gains for all countries
account for 8.1% of welfare gains leaving the remaining 91.9% to multifactor
productivity gains (Figure 5). This represents a sharp contrast to the baseline estimates
where trading gains dampened welfare gains by -6.8%. This aggregate 8.1% ranges
from 4.1% for NAFTA to 16.2% for Europe while emerging nations report a 10.4%, a
hefty turnaround compared to the base line scenario—+ 11.9 percentage points for
NAFTA, 35 percentage points for Europe, and 14.4 percentage points for emerging
nations. While multifactor productivity gains remain the main story behind welfare gains,
the adjusted estimates nuance the traditional narrative by highlighting that trading gains
are not negligible, and they lifted welfare gains.
[Insert Figure 5 Here]
IV. Concluding Remarks A well-established line of research in international trade and macroeconomics contends
that welfare gains are primarily driven by multifactor productivity gains, leaving virtually
no room for trading gains over the long-run. We revisit this literature along two
dimensions. First, we propose a dual approach that makes it possible to unify the
interpretation of trading gains and productivity gains. While the existing literature mixes
the price effect with a volume effect, our framework offers the advantage of treating both
of them as a price effect. Second, while we take this framework to the data, we address
the issue of double counting of exports and offshoring bias, both of which have been the
focus of recent strands of literature that emphasizes the impact of globalization on the
reliability of flagship economic indicators.
We apply this framework to a representative set of ten economies accounting for
51% of global nominal GDP in PPPs over the 1996-2009 period. This new framework
was taken to the data under two different scenarios. First, the baseline scenario which
22
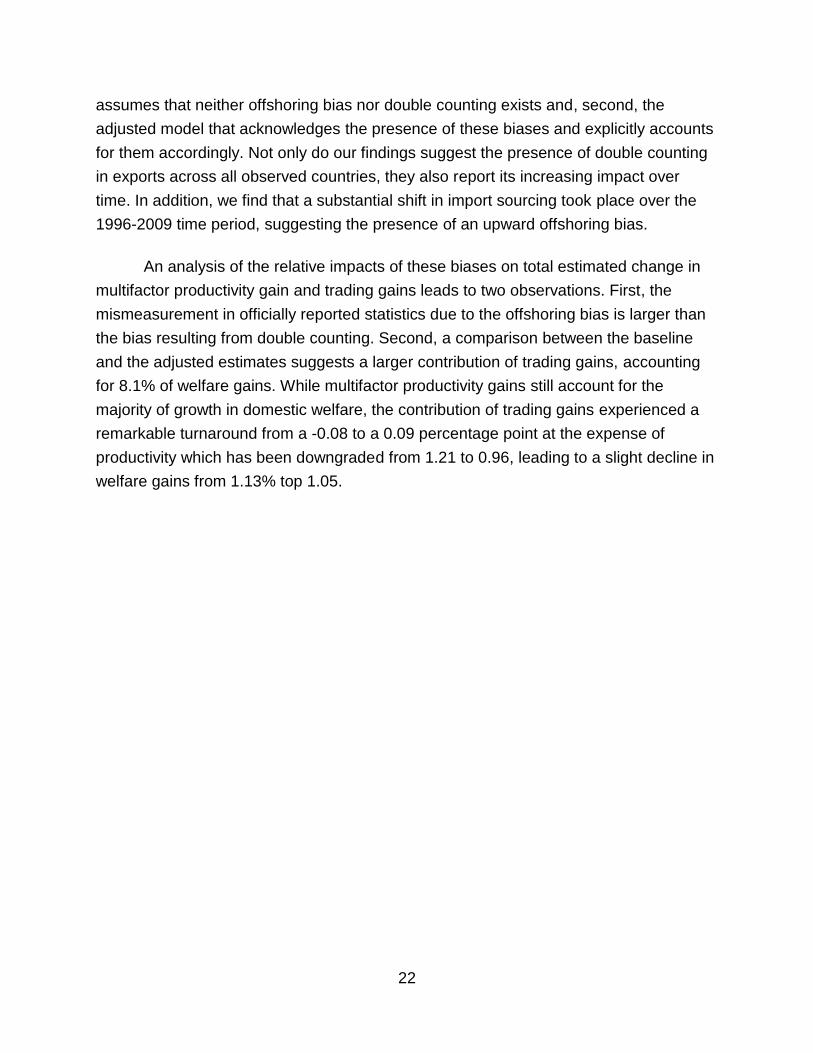
assumes that neither offshoring bias nor double counting exists and, second, the
adjusted model that acknowledges the presence of these biases and explicitly accounts
for them accordingly. Not only do our findings suggest the presence of double counting
in exports across all observed countries, they also report its increasing impact over
time. In addition, we find that a substantial shift in import sourcing took place over the
1996-2009 time period, suggesting the presence of an upward offshoring bias.
An analysis of the relative impacts of these biases on total estimated change in
multifactor productivity gain and trading gains leads to two observations. First, the
mismeasurement in officially reported statistics due to the offshoring bias is larger than
the bias resulting from double counting. Second, a comparison between the baseline
and the adjusted estimates suggests a larger contribution of trading gains, accounting
for 8.1% of welfare gains. While multifactor productivity gains still account for the
majority of growth in domestic welfare, the contribution of trading gains experienced a
remarkable turnaround from a -0.08 to a 0.09 percentage point at the expense of
productivity which has been downgraded from 1.21 to 0.96, leading to a slight decline in
welfare gains from 1.13% top 1.05.

23
References Basu, S., Pascali, L., Schiantarelli F. and Serven, L. 2016. Productivity and the Welfare
of Nations. Revision of NBER Working Paper 17971 (2014). http://fmwww.bc.edu/EC-P/wp793.pdf
Crafts, N. and O'Rourke, K.H. 2013. Twentieth Century Growth, Oxford University
Economic and Social History Series 117, Economics Group, Nuffield College, University of Oxford. http://www.economics.ox.ac.uk/materials/papers/12884/Crafts%20O%27Rourke%20117.pdf
Dietzenbacher, E., Los, B., Stehrer, R., Timmer, M.P. and de Vries, G.J. 2013. The
Construction of World Input-Output Tables in the WIOD Project. Economics Systems Research, 25(1): pp. 71-98.
Diewert, W. E., and C.J. Morrison. 1986. Adjusting Outputs and Productivity Indexes for
Changes in the Terms of Trade. Economic Journal 96 (383): 659–79. Diewert, W. Erwin, and Alice O. Nakamura. 2009. Bias in the Import Price Index Due to
Outsourcing: Can It Be Measured? Paper presented at the conference “Measurement Issues Arising From the Growth of Globalization,” Washington, DC, November 6–7.
Diewert, W.E. and Lawrence, D. 2006. Measuring the Contributions of Productivity and
Terms of Trade to Australia’s Economic Welfare, Report by Meyrick and Associates to the Productivity Commission, Canberra.
Feenstra, R.C., Inklaar R. and Timmer M.P. 2015. The Next Generation of the Penn
World Table. American Economic Review, 105(10): 3150-82. Feenstra, R.C., Mandel, B.R., Reinsdorf, M.B. and Slaughter, M.J. 2013. Effects of
Terms of Trade Gains and Tariff Changes on the Measurement of US Productivity Growth. American Economic Journal: Economic Policy, 5(1): 59-93.
Fox, K. J., Kohli, U. and Warren Jr., R. S. 2002. Accounting for Growth and Output
Gaps: Evidence from New Zealand. Economic Record, 78: 312–326. Gordon, R.G. 2004. Why was Europe Left at the Station When America’s Productivity
Locomotive Departed? In Gregory M., Salverda, W., and Schettkat, R. eds.: Services and Employment: Explaining the U.S.-European Gap. Princeton and Oxford: Princeton University Press, 2007, pp. 176-97.
Hanson, G.H. 2010. Why Isn't Mexico Rich? Journal of Economic Literature, 48(4): 987-
1004.

24
Houseman, S., Kurz, C.J., Lengermann, P. and Mandel, B.R. 2010. Offshoring Bias in U.S. Manufacturing: Implication for Productivity and Value Added. Board of Governors of the Federal Reserve System, International Finance Discussion Papers, number 1007. https://www.federalreserve.gov/pubs/ifdp/2010/1007/ifdp1007.pdf
Houseman, S., Kurz C., Lengermann P., and Mandel B. 2011. Offshoring Bias in U.S.
Manufacturing. Journal of Economic Perspectives 25 (2): 111–32. Hulten, C. R. 2001. Total Factor Productivity: A Short Biography, In Hulten C.R., Dean
E.R. and Harper M.J. (editors): New Developments in Productivity Analysis, 1-54: University of Chicago Press. Chicago.in ‘New Developments in Productivity Analysis’, University of Chicago Press.
Hummels, D., Ishii, J. and Yi, K.-M. 2001. The Nature and Growth of Vertical
Specialization in World Trade. Journal of International Economics, Vol.54, pp. 75-96.
Johnson, R.C. 2014. Five Facts about Value-Added Exports and Implications for
Macroeconomics and Trade Research. Journal of Economic Perspectives, 28(2): pp. 119-42.
Johnson, R.C. and Noguera, G. 2012. Accounting for Intermediates: Production Sharing
and Trade in Value Added. Journal of International Economics, 86(2), pp. 224-236.
Kohli, U. 2014. Who Gains Most from Trade? Paper presented at the EMG Workshop at
the University of New South Wales, Sydney, Australia, December 5. https://www.business.unsw.edu.au/research-site/centreforappliedeconomicresearch-site/Documents/EMG14_UKohli_Who_Gains_Most_from_Trade.pdf
Kohli, U. 2004. Real GDP, Real Domestic Income, and Terms-of-Trade Changes.
Journal of International Economics, 62(1), 83-106. Koopman, R., Wang, Z. and Wei, S.J. 2014. Tracing Value-Added and Double Counting
in Gross Exports. American Economic Review, 104(2): pp. 459-494. Leontief, W. 1949. Structural Matrices of National Economies. Econometrica, 17,
pp.273–82. Los, B., Timmer, M.P. and de Vries, G.J. 2016. Tracing Value-Added and Double
Counting in Gross Exports: Comment. American Economic Review,106(4): pp. 432-454.

25
Mandel, M. 2007. The Real Costs of Offshoring. Business Week, June 18. http://www.bloomberg.com/news/articles/2007-06-17/the-real-cost-of-offshoring
Nakamura, E., and Steinsson, J.. 2012. Lost in Transit: Product Replacement Bias and
Pricing to Market. American Economic Review 102 (7): 3277–3316. Nickell, S., Redding, S. and Swaffield, J. 2008. The Uneven Pace of Deindustrialisation
in the OECD. World Economy, 31: 1154–1184. OECD, Measuring Productivity, OECD, Paris, 2001. Reinsdorf, M.B. 2010. Terms of Trade Effects: Theory and Measurement. Review of
Income and Wealth, 56: S177–S205. Reinsdorf, M. and Yuskavage, R. 2016. Offshoring, Sourcing Substitution Bias, and the
Measurement of Growth in U.S. Gross Domestic Product and Productivity. Review of Income and Wealth. http://onlinelibrary.wiley.com/doi/10.1111/roiw.12263/epdf
Timmer, M. P., Dietzenbacher, E., Los, B., Stehrer, R. and de Vries, G. J. 2015.
An Illustrated User Guide to the World Input–Output Database: The Case of Global Automotive Production. Review of International Economics, 23: pp. 575–605.


27

Table 1. Shift in Imports Sourcing (Percentage)
Year NAFTA
EU-Core
EU-Periphery
China India Rest of
the World Total
Canada 1996 63.0 16.3 0.5 2.9 0.5 16.9 100.0
2009 49.9 17.0 1.1 10.4 2.1 19.6 100.0
Mexico 1996 71.9 12.8 0.2 0.7 0.2 14.1 100.0
2009 51.0 14.2 0.7 12.2 0.5 21.4 100.0
U.S. 1996 24.9 25.7 0.7 4.8 1.1 42.9 100.0
2009 21.4 20.5 0.8 16.3 3.6 37.3 100.0
Nafta 1996 31.6 23.9 0.6 4.3 1.0 38.6 100.0
2009 26.3 19.7 0.8 15.5 3.2 34.5 100.0
France 1996 11.2 65.7 1.9 1.4 0.4 19.4 100.0
2009 8.1 55.3 5.3 6.0 0.8 24.4 100.0
Germany 1996 8.8 57.1 6.7 1.9 0.8 24.6 100.0
2009 7.4 46.2 12.5 7.6 1.5 24.8 100.0
Italy 1996 8.4 60.3 3.7 1.4 1.2 25.1 100.0
2009 4.9 48.0 7.4 5.1 0.9 33.8 100.0
Netherlands 1996 10.3 57.9 2.0 2.6 1.0 26.2 100.0
2009 10.1 50.3 4.1 6.6 2.2 26.8 100.0
UK 1996 12.9 58.5 1.6 2.2 0.9 24.0 100.0
2009 13.7 48.9 5.3 6.5 2.1 23.5 100.0
Europe 1996 10.2 59.9 3.7 1.8 0.8 23.6 100.0
2009 8.6 49.4 7.7 6.4 1.4 26.3 100.0
China 1996 11.6 19.4 0.3 0.0 0.6 68.2 100.0
2009 12.0 17.9 0.8 0.0 1.0 68.2 100.0
India 1996 9.5 33.9 0.9 3.8 0.0 51.9 100.0
2009 10.7 13.2 0.6 17.1 0.0 58.4 100.0
Asia Emerging Nations 1996 10.8 25.0 0.5 1.5 0.4 61.9 100.0
2009 11.6 16.5 0.8 5.2 0.7 65.3 100.0


Table 2a. Trading Gains and Their Sources of Origin over the 1996-2009 period (Percentage point)
Baseline Estimates Adjusted Estimates
NAFTA
EU-Core
EU-Periphery
China India ROW Total
NAFTA EU-Core EU-Periphery China India ROW Total
A. Terms of Trade (1)
Canada -0.19 -0.05 0.00 -0.03 -0.01 -0.06 -0.35 -0.07 -0.03 0.00 -0.03 -0.01 -0.03 -0.17
Mexico 0.26 0.07 0.00 0.01 0.00 0.16 0.51 0.62 0.10 0.00 0.02 0.00 0.22 0.97
U.S. -0.02 -0.02 0.00 0.00 0.00 -0.04 -0.09 -0.02 -0.02 0.00 0.00 0.00 -0.04 -0.08
NAFTA -0.01 -0.01 0.00 0.00 0.00 -0.02 -0.05 0.03 -0.01 0.00 0.00 0.00 -0.02 0.01
B. Real Exchange Effect (2)
Canada -0.09 0.01 0.00 0.01 0.00 0.01 -0.05 0.01 0.02 0.00 0.02 0.00 0.02 0.08
Mexico -0.09 0.03 0.00 0.02 0.00 -0.01 -0.05 0.22 0.04 0.00 0.01 0.00 0.01 0.29
U.S. 0.00 0.00 0.00 0.00 0.00 -0.01 -0.01 0.00 0.01 0.00 0.00 0.00 -0.01 0.00
NAFTA -0.02 0.01 0.00 0.00 0.00 -0.01 -0.02 0.02 0.02 0.00 0.00 0.00 -0.01 0.03
C. Trading Gains (1)+(2)
Canada -0.28 -0.04 0.00 -0.02 0.00 -0.05 -0.40 -0.06 -0.01 0.00 -0.01 -0.01 -0.01 -0.09
Mexico 0.17 0.10 0.00 0.03 0.00 0.15 0.46 0.85 0.14 0.00 0.04 0.00 0.23 1.27
U.S. -0.02 -0.02 0.00 0.00 0.00 -0.05 -0.10 -0.02 -0.01 0.00 0.00 0.00 -0.05 -0.08
NAFTA -0.03 -0.01 0.00 0.00 0.00 -0.03 -0.07 0.05 0.01 0.00 0.00 0.00 -0.02 0.04

31
Table 2b. Trading Gains and Their Sources of Origin over the 1996-2009 period (Percentage point)
Baseline Estimates Adjusted Estimates
NAFTA
EU-Core
EU-Periphery
China India ROW Total
NAFTA EU-Core EU-Periphery China India ROW Total
A. Terms of Trade (1)
Germany -0.03 -0.14 -0.03 -0.01 0.00 -0.08 -0.30 -0.02 -0.11 -0.02 -0.01 0.00 -0.06 -0.22
France -0.03 -0.15 -0.01 -0.01 0.00 -0.07 -0.27 -0.02 -0.09 -0.01 0.00 0.00 -0.04 -0.16
United Kingdom 0.08 0.22 0.01 0.01 0.00 0.10 0.43 0.09 0.25 0.01 0.01 0.00 0.10 0.46
Italy 0.01 0.04 0.01 0.00 0.00 0.03 0.09 0.01 0.07 0.01 0.01 0.00 0.05 0.15
Netherlands -0.03 -0.22 -0.02 -0.02 0.00 -0.08 -0.36 -0.04 -0.30 -0.02 -0.02 -0.01 -0.12 -0.52
Europe 0.00 -0.08 -0.01 -0.01 0.00 -0.03 -0.13 0.00 -0.06 -0.01 0.00 0.00 -0.03 -0.11
B. Real Exchange Effect (2)
Germany 0.00 0.00 0.00 0.00 0.00 0.00 0.00 0.00 0.00 0.00 0.00 0.00 -0.01 -0.01
France -0.01 0.02 0.00 0.00 0.00 -0.02 -0.01 0.00 0.10 0.00 0.01 0.00 0.02 0.14
United Kingdom -0.02 0.02 0.00 0.00 0.00 -0.02 -0.02 -0.01 0.04 0.00 0.00 0.00 0.00 0.03
Italy -0.01 0.00 -0.01 0.00 0.00 -0.02 -0.03 -0.01 0.03 0.00 0.00 0.00 0.00 0.01
Netherlands 0.00 0.02 0.00 0.00 0.00 -0.01 0.01 0.01 0.01 0.00 0.00 0.00 0.01 0.03
Europe -0.01 0.02 0.00 0.00 0.00 -0.01 -0.01 0.00 0.04 0.00 0.00 0.00 0.01 0.05
C. Trading Gains (1)+(2)
Germany -0.03 -0.14 -0.03 -0.01 0.00 -0.08 -0.30 -0.02 -0.11 -0.02 -0.01 0.00 -0.07 -0.23
France -0.04 -0.13 -0.02 0.00 0.00 -0.09 -0.29 -0.01 0.01 -0.01 0.01 0.00 -0.02 -0.03
United Kingdom 0.06 0.25 0.01 0.01 0.00 0.08 0.41 0.08 0.29 0.01 0.01 0.00 0.10 0.49
Italy 0.00 0.05 0.00 0.00 0.00 0.01 0.06 0.01 0.10 0.01 0.01 0.00 0.04 0.17
Netherlands -0.03 -0.20 -0.01 -0.02 -0.01 -0.09 -0.35 -0.03 -0.29 -0.02 -0.02 -0.01 -0.11 -0.48
Europe -0.01 -0.06 -0.01 -0.01 0.00 -0.05 -0.14 0.00 -0.02 -0.01 0.00 0.00 -0.02 -0.05

32
Table 2c. Trading Gains and Their Sources of Origin over the 1996-2009 period (Percentage point)
Baseline Estimates Adjusted Estimates
NAFTA
EU-Core
EU-Periphery
China India ROW Total
NAFTA EU-Core EU-Periphery China India ROW Total
A. Terms of Trade (1)
China 0.00 -0.01 -0.01 - -0.01 0.17 0.14
0.05 0.04 0.00 - 0.00 0.29 0.38
India 0.05 0.01 0.00 0.03 - -0.04 0.05
0.04 0.01 0.00 0.03 - -0.05 0.03
Emerging Nations
0.01 0.00 0.00 0.01 -0.01 0.10 0.11
0.05 0.03 0.00 0.01 0.00 0.18 0.26
B. Real Exchange Effect (2)
China -0.24 -0.05 -0.01 - -0.01 0.04 -0.26
-0.14 -0.02 0.00 - -0.01 0.13 -0.05
India -0.04 -0.01 0.00 0.00 - -0.03 -0.08
-0.02 0.00 0.00 0.00 - -0.04 -0.06
Emerging Nations
-0.17 -0.03 -0.01 0.00 -0.01 0.02 -0.20
-0.10 -0.01 0.00 0.00 -0.01 0.07 -0.05
C. Trading Gains (1)+(2)
China -0.24 -0.05 -0.02 - -0.02 0.21 -0.12
-0.09 0.02 -0.01 - -0.01 0.42 0.33
India 0.00 0.01 0.00 0.03 - -0.07 -0.03
0.01 0.01 0.00 0.03 - -0.09 -0.04
Emerging Nations
-0.16 -0.03 -0.01 0.01 -0.01 0.12 -0.09
-0.06 0.02 0.00 0.01 -0.01 0.25 0.21
33
Table 3. Welfare Gains and Their Sources over the 1995-2009 (Percentage)
Non-Adjusted (A) Adjusted (B) Changes (B)-(A)
Trading Gains
(1)
Multifactor Productivity
Gains (2)
Welfare Gains (1)+(2)
Trading
Gains (1)
Multifactor Productivity
Gains (2)
Welfare Gains (1)+(2)
Trading Gains
(1)
Multifactor Productivity
Gains (2)
Welfare Gains (1)+(2)
Canada -0.40 0.35 -0.06 -0.09 0.48 0.39 0.31 0.13 0.44
Mexico 0.46 -2.02 -1.56 1.27 -2.84 -1.57 0.81 -0.83 -0.02
U.S. -0.10 1.37 1.27 -0.08 1.35 1.27 0.02 -0.02 0.00
NAFTA -0.07 1.00 0.93 0.04 0.92 0.96 0.11 -0.08 0.03
Germany -0.30 0.64 0.34 -0.23 0.10 -0.13 0.07 -0.54 -0.47
France -0.29 0.66 0.37 -0.03 0.35 0.32 0.26 -0.31 -0.05
United Kingdom 0.41 0.77 1.18 0.49 0.76 1.25 0.08 -0.01 0.07
Italy 0.06 -0.54 -0.48 0.17 -0.72 -0.55 0.12 -0.18 -0.06
Netherlands -0.35 0.95 0.60 -0.48 0.82 0.34 -0.13 -0.13 -0.26
Europe -0.07 0.46 0.39 0.04 0.18 0.22 0.11 -0.28 -0.17
China -0.12 2.65 2.53 0.33 2.03 2.36 0.45 -0.62 -0.17
India -0.03 1.58 1.55 -0.04 1.34 1.31 -0.01 -0.24 -0.25
Emerging Nations -0.09 2.29 2.20 0.21 1.80 2.01 0.30 -0.49 -0.20
0.00
All countries -0.08 1.21 1.13 0.09 0.96 1.05 0.16 -0.25 -0.09

34
Table 4. Contribution of Each Measurement Problem to Components of Welfare Gains, 1996-2009 (Percentage)
Trading Gains Multifactor Productivity
Double Counting Offshoring Bias Double Counting Offshoring Bias
Canada 73.0 27.0 73.0 27.0
USA 27.0 73.0 0.0 100.0
Germany 11.0 89.0 54.0 46.0
France 17.0 83.0 51.0 49.0
United Kingdom 18.0 82.0 9.0 91.0
Italy 6.0 94.0 28.0 72.0
Netherlands 18.0 82.0 0.0 100.0
All countries 23.8 76.2 17.3 82.7
35


37
Appendix
38
Table A-2a. Trading Gains and Their Sources of Origin over the 1996-2009 period (Percentage point)
Adjusted Estimates -5% Adjusted Estimates +5%
NAFTA
EU-Core
EU-Periphery
China India ROW Total
NAFTA EU-Core EU-Periphery China India ROW Total
A. Terms of Trade (1)
Canada -0.06 -0.03 0.00 -0.03 -0.01 -0.03 -0.15 -0.08 -0.03 0.00 -0.03 -0.01 -0.03 -0.19
Mexico 0.62 0.10 0.00 0.02 0.00 0.22 0.97 0.62 0.10 0.00 0.02 0.00 0.22 0.97
U.S. -0.02 -0.02 0.00 0.00 0.00 -0.04 -0.08 -0.02 -0.02 0.00 0.00 0.00 -0.04 -0.09
NAFTA 0.03 -0.01 0.00 0.00 0.00 -0.02 0.00 0.03 -0.01 0.00 0.00 0.00 -0.02 0.01
B. Real Exchange Effect (2)
Canada 0.01 0.02 0.00 0.02 0.00 0.02 0.08 0.01 0.02 0.00 0.02 0.00 0.02 0.08
Mexico 0.22 0.04 0.00 0.01 0.00 0.01 0.29 0.22 0.04 0.00 0.01 0.00 0.01 0.29
U.S. 0.00 0.01 0.00 0.00 0.00 -0.01 0.00 0.00 0.00 0.00 0.00 0.00 -0.01 0.00
NAFTA 0.02 0.01 0.00 0.00 0.00 -0.01 0.03 0.02 0.01 0.00 0.00 0.00 -0.01 0.02
C. Trading Gains (1)+(2)
Canada -0.05 0.00 0.00 -0.01 0.00 0.00 -0.07 -0.07 -0.01 0.00 -0.01 0.00 -0.01 -0.11
Mexico 0.85 0.14 0.00 0.04 0.00 0.23 1.27 0.85 0.14 0.00 0.04 0.00 0.23 1.27
U.S. -0.02 -0.01 0.00 0.00 0.00 -0.04 -0.08 -0.02 -0.02 0.00 0.00 0.00 -0.05 -0.09
NAFTA 0.05 0.00 0.00 0.00 0.00 -0.01 0.05 0.05 -0.01 0.00 0.00 0.00 -0.02 0.03

39
Table A-2b. Trading Gains and Their Sources of Origin over the 1996-2009 period (Percentage point)
Adjusted Estimates -5% Adjusted Estimates +5%
NAFTA
EU-Core
EU-Periphery
China India ROW Total
NAFTA EU-Core EU-Periphery China India ROW Total
A. Terms of Trade (1)
Germany -0.02 -0.09 -0.02 0.00 0.00 -0.05 -0.18 -0.03 -0.13 -0.02 -0.01 0.00 -0.07 -0.26
France -0.01 -0.09 -0.01 0.00 0.00 -0.04 -0.15 -0.02 -0.10 -0.01 0.00 0.00 -0.04 -0.18
United Kingdom 0.09 0.25 0.01 0.01 0.00 0.10 0.46 0.09 0.25 0.01 0.01 0.00 0.10 0.46
Italy 0.01 0.08 0.01 0.01 0.00 0.05 0.17 0.01 0.07 0.01 0.00 0.00 0.04 0.14
Netherlands -0.04 -0.29 -0.02 -0.02 -0.01 -0.11 -0.49 -0.04 -0.32 -0.02 -0.02 -0.01 -0.13 -0.55
Europe 0.01 0.01 -0.01 0.00 0.00 0.00 0.01 0.01 -0.01 -0.01 0.00 0.00 -0.01 -0.02
B. Real Exchange Effect (2)
Germany 0.00 0.00 0.00 0.00 0.00 -0.01 0.00 0.00 0.00 0.00 0.00 0.00 -0.01 -0.01
France 0.00 0.11 0.00 0.01 0.00 0.02 0.14 0.00 0.10 0.00 0.01 0.00 0.02 0.13
United Kingdom -0.01 0.04 0.00 0.00 0.00 0.00 0.03 -0.01 0.04 0.00 0.00 0.00 0.00 0.03
Italy -0.01 0.03 0.00 0.00 0.00 0.00 0.02 -0.01 0.03 0.00 0.00 0.00 -0.01 0.01
Netherlands 0.01 0.01 0.00 0.00 0.00 0.01 0.04 0.01 0.01 0.00 0.00 0.00 0.01 0.03
Europe 0.00 0.04 0.00 0.00 0.00 0.00 0.04 0.00 0.04 0.00 0.00 0.00 0.00 0.04
C. Trading Gains (1)+(2)
Germany -0.02 -0.09 -0.01 0.00 0.00 -0.06 -0.18 -0.03 -0.13 -0.02 -0.01 0.00 -0.08 -0.27
France -0.01 0.02 0.00 0.01 0.00 -0.02 -0.01 -0.01 0.00 -0.01 0.00 0.00 -0.03 -0.04
United Kingdom 0.08 0.29 0.01 0.01 0.00 0.10 0.49 0.08 0.29 0.01 0.01 0.00 0.10 0.49
Italy 0.01 0.11 0.01 0.01 0.00 0.05 0.18 0.00 0.09 0.00 0.00 0.00 0.04 0.15
Netherlands -0.03 -0.28 -0.02 -0.02 -0.01 -0.10 -0.45 -0.03 -0.31 -0.02 -0.02 -0.01 -0.12 -0.52
Europe 0.01 0.04 0.00 0.00 0.00 0.00 0.06 0.00 0.02 -0.01 0.00 0.00 -0.01 0.01

40
Table A-2c. Trading Gains and Their Sources of Origin over the 1996-2009 period (Percentage point)
Adjusted Estimates -5% Adjusted Estimates +5%
NAFTA
EU-Core
EU-Periphery
China India ROW Total
NAFTA EU-Core EU-Periphery China India ROW Total
A. Terms of Trade (1)
China 0.05 0.04 0.00 - 0.00 0.29 0.38 0.05 0.04 0.00 - 0.00 0.29 0.38
India 0.04 0.01 0.00 0.03 0.00 -0.05 0.03 0.04 0.01 0.00 0.03 - -0.05 0.03
Emerging Nations 0.05 0.03 0.00 0.01 0.00 0.18 0.26 0.05 0.03 0.00 0.01 0.00 0.18 0.26
B. Real Exchange Effect (2)
China -0.14 -0.02 0.00 0.00 -0.01 0.13 -0.05 -0.14 -0.02 0.00 - -0.01 0.13 -0.05
India -0.02 0.00 0.00 0.00 0.00 -0.04 -0.06 -0.02 0.00 0.00 0.00 - -0.04 -0.06
Emerging Nations -0.10 -0.01 0.00 0.00 -0.01 0.07 -0.05 -0.10 -0.01 0.00 0.00 -0.01 0.07 -0.05
C. Trading Gains (1)+(2)
China -0.09 0.02 -0.01 0.00 -0.01 0.42 0.33 -0.09 0.02 -0.01 - -0.01 0.42 0.33
India 0.01 0.01 0.00 0.03 0.00 -0.09 -0.04 0.01 0.01 0.00 0.03 - -0.09 -0.04
Emerging Nations -0.06 0.02 -0.01 0.01 -0.01 0.25 0.21
-0.06 0.02 0.00 0.01 -0.01 0.25 0.21

41
Table 3A. Welfare Gains and Their Sources over the 1995-2009 (Percentage)
Non-Adjusted (-5%) Adjusted (+5%)
Trading Gains
(1)
Multifactor Productivity
Gains (2)
Welfare Gains (1)+(2)
Trading
Gains (1)
Multifactor Productivity
Gains (2)
Welfare Gains (1)+(2)
Canada -0.07 0.46 0.39 -0.11 0.50 0.39
Mexico 1.27 -2.84 -1.58 1.27 -2.84 -1.58
U.S. -0.08 1.34 1.26 -0.09 1.35 1.26
NAFTA 0.04 0.91 0.95 0.03 0.92 0.95
Germany -0.18 0.06 -0.12 -0.27 0.15 -0.12
France -0.01 0.34 0.33 -0.04 0.37 0.33
United Kingdom 0.49 0.76 1.25 0.49 0.76 1.25
Italy 0.18 -0.73 -0.55 0.15 -0.70 -0.55
Netherlands -0.45 0.79 0.34 -0.52 0.86 0.34
Europe 0.06 0.17 0.22 0.01 0.21 0.22
China 0.33 2.03 2.36 0.33 2.03 2.36
India -0.04 1.34 1.30 -0.04 1.34 1.31
Emerging Nations 0.21 1.80 2.01 0.21 1.80 2.01