global evidence on nitrogen saturation of terrestrial...
TRANSCRIPT

1 / 13
Supplementary materials for
Global evidence on nitrogen saturation of terrestrial ecosystem
net primary productivity
Dashuan Tian1, Hong Wang
2, Jian Sun
1 and Shuli Niu
1*
1 Key Laboratory of Ecosystem Network Observation and Modeling, Institute of
Geographic Sciences and Natural Resources Research, CAS, Beijing 100101, China
2 Semiarid Prairie Agricultural Research Centre, Agriculture and Agri-Food Canada,
Box 1030, Swift Current, SK S9H 3X2, Canada
* Corresponding author: Shuli Niu
Tel.: +86 10 64888062
Fax: +86 10 64889399
E-mail addresses: [email protected]
2 / 13
Note S1. A list of 33 literatures for creating the dataset of this meta-analysis
Aber JD, Magill A, Boone R, Melillo JM, Steudler P, Bowden R. 1993. PLANT AND SOIL RESPONSES TO
CHRONIC NITROGEN ADDITIONS AT THE HARVARD FOREST, MASSACHUSETTS. Ecological
Applications 3(1): 156-166.
Bai Y, Wu J, Clark CM, Naeem S, Pan Q, Huang J, Zhang L, Han X. 2010. Tradeoffs and thresholds in
the effects of nitrogen addition on biodiversity and ecosystem functioning: evidence from
inner Mongolia Grasslands. Global Change Biology 16(1): 358-372.
Bradley K, Drijber RA, Knops J. 2006. Increased N availability in grassland soils modifies their microbial
communities and decreases the abundance of arbuscular mycorrhizal fungi. Soil Biology &
Biochemistry 38(7): 1583-1595.
Chiang C, Craft CB, Rogers DW, Richardson CJ. 2000. Effects of 4 years of nitrogen and phosphorus
additions on Everglades plant communities. Aquatic Botany 68(1): 61-78.
Cole L, Buckland SM, Bardgett RD. 2008. Influence of disturbance and nitrogen addition on plant and
soil animal diversity in grassland. Soil Biology & Biochemistry 40(2): 505-514.
Collins SA, Allinson DW. 2004. Soil nitrate concentrations used to predict nitrogen sufficiency in
relation to yield in perennial grasslands. Agronomy Journal 96(5): 1272-1281.
Du Z, Wang W, Zeng W, Zeng H. 2014. Nitrogen Deposition Enhances Carbon Sequestration by
Plantations in Northern China. Plos One 9(2).
Fan H, Wu J, Liu W, Yuan Y, Huang R, Liao Y, Li Y. 2014. Nitrogen deposition promotes ecosystem
carbon accumulation by reducing soil carbon emission in a subtropical forest. Plant and Soil
379(1-2): 361-371.
Fang Y, Xun F, Bai W, Zhang W, Li L. 2012. Long-Term Nitrogen Addition Leads to Loss of Species
Richness Due to Litter Accumulation and Soil Acidification in a Temperate Steppe. Plos One
7(10).
Foster NW, Morrison IK. 2002. Carbon sequestration by a jack pine stand following urea application.
Forest Ecology and Management 169(1-2): 45-52.
Gendron F, Wilson SD. 2007. Responses to fertility and disturbance in a low-diversity grassland. Plant
Ecology 191(2): 199-207.
3 / 13
Han X, Tsunekawa A, Tsubo M, Li S. 2011. Aboveground biomass response to increasing nitrogen
deposition on grassland on the northern Loess Plateau of China. Acta Agriculturae
Scandinavica Section B-Soil and Plant Science 61(2): 112-121.
Hasselquist NJ, Metcalfe DB, Hogberg P. 2012. Contrasting effects of low and high nitrogen additions
on soil CO2 flux components and ectomycorrhizal fungal sporocarp production in a boreal
forest. Global Change Biology 18(12): 3596-3605.
He N, Yu Q, Wang R, Zhang Y, Gao Y, Yu G. 2013. Enhancement of Carbon Sequestration in Soil in the
Temperature Grasslands of Northern China by Addition of Nitrogen and Phosphorus. Plos
One 8(10).
Huang YZ, Fan HB. 2009. Impacts of simulated nitrogen deposition on carbon pool and its chemical
mechanism in the Chinese fir plantation. Graduate thesis of Fujian Agriculture and Forestry
University.
Johnson DW, Ball JT, Walker RF. 1997. Effects of CO2 and nitrogen fertilization on vegetation and soil
nutrient content in juvenile ponderosa pine. Plant and Soil 190(1): 29-40.
Johnson DW, Hoylman AM, Ball JT, Walker RF. 2006. Ponderosa pine responses to elevated CO2 and
nitrogen fertilization. Biogeochemistry 77(2): 157-175.
Johnson DW, Todd DE, Tolbert VR. 2003. Changes in ecosystem carbon and nitrogen in a loblolly pine
plantation over the first 18 years. Soil Science Society of America Journal 67(5): 1594-1601.
Lee KH, Jose S. 2003. Soil respiration, fine root production, and microbial biomass in cottonwood and
loblolly pine plantations along a nitrogen fertilization gradient. Forest Ecology and
Management 185(3): 263-273.
Li K, Liu X, Song L, Gong Y, Lu C, Yue P, Tian C, Zhang F. 2015. Response of alpine grassland to elevated
nitrogen deposition and water supply in China. Oecologia 177(1): 65-72.
Magill AH, Aber JD, Currie WS, Nadelhoffer KJ, Martin ME, McDowell WH, Melillo JM, Steudler P.
2004. Ecosystem response to 15 years of chronic nitrogen additions at the Harvard Forest
LTER, Massachusetts, USA. Forest Ecology and Management 196(1): 7-28.
Magill AH, Downs MR, Nadelhoffer KJ, Hallett RA, Aber JD. 1996. Forest ecosystem response to four
years of chronic nitrate and sulfate additions at Bear Brooks Watershed, Maine, USA. Forest
Ecology and Management 84(1-3): 29-37.
Qi Y, Mulder J, Duan L, Huang Y. 2015. Short-term effects of simulating nitrogen deposition on soil

4 / 13
organic carbon in a Stipa krylovii steppe. Acta Ecologica Sinica 35(4): 1104-1113.
Rappe-George MO, Gardenas AI, Kleja DB. 2013. The impact of four decades of annual nitrogen
addition on dissolved organic matter in a boreal forest soil. Biogeosciences 10(3):
1365-1377.
Samuel MJ, Hart RH. 1998. Nitrogen fertilization, botanical composition and biomass production on
mixed-grass rangeland. Journal of Range Management 51(4): 408-416.
Scott DA, Burger JA, Kaczmarek DJ, Kane MB. 2004. Growth and nutrition response of young
sweetgum plantations to repeated nitrogen fertilization on two site types. Biomass &
Bioenergy 27(4): 313-325.
Song Y, Song C, Li Y, Hou C, Yang G, Zhu X. 2013. Short-term Effect of Nitrogen Addition on Litter and
Soil Properties in Calamagrostis angustifolia Freshwater Marshes of Northeast China.
Wetlands 33(3): 505-513.
Vivanco L, Irvine IC, Martiny JBH. 2015. Nonlinear responses in salt marsh functioning to increased
nitrogen addition. Ecology 96(4): 936-947.
Willams BL, Silcock DJ. 1997. Nutrient and microbial changes in the peat profile beneath Sphagnum
magellanicum in response to additions of ammonium nitrate. Journal of Applied Ecology
34(4): 961-970.
Xu X, Liu H, Song Z, Wang W, Hu G, Qi Z. 2015. Response of aboveground biomass and diversity to
nitrogen addition along a degradation gradient in the Inner Mongolian steppe, China.
Scientific Reports 5.
Zhang L, Song C, Wang D, Wang Y. 2007. Effects of exogenous nitrogen on freshwater marsh plant
growth and N2O fluxes in Sanjiang Plain, Northeast China. Atmospheric Environment 41(5):
1080-1090.
Zhu M, Zhang Z, Yu J, Wu L, Han G, Yang L, Xing Q, Xie B, Mao P, Wang G. 2013. Effect of nitrogen
deposition on soil respiration in Phragmites australis wetland in the Yellow River Delta,
China. Acta Phytoecologica Sinica 37(6): 517-529.
Zhu T, Cheng S, Fang H, Yu G, Zheng J, Li Y. 2011. Early responses of soil CO2 emission to simulating
atmospheric nitrogen deposition in an alpine meadow on the Qinghai Tibetan Plateau. Acta
Ecologica Sinica 31(10): 2687-2696.
5 / 13
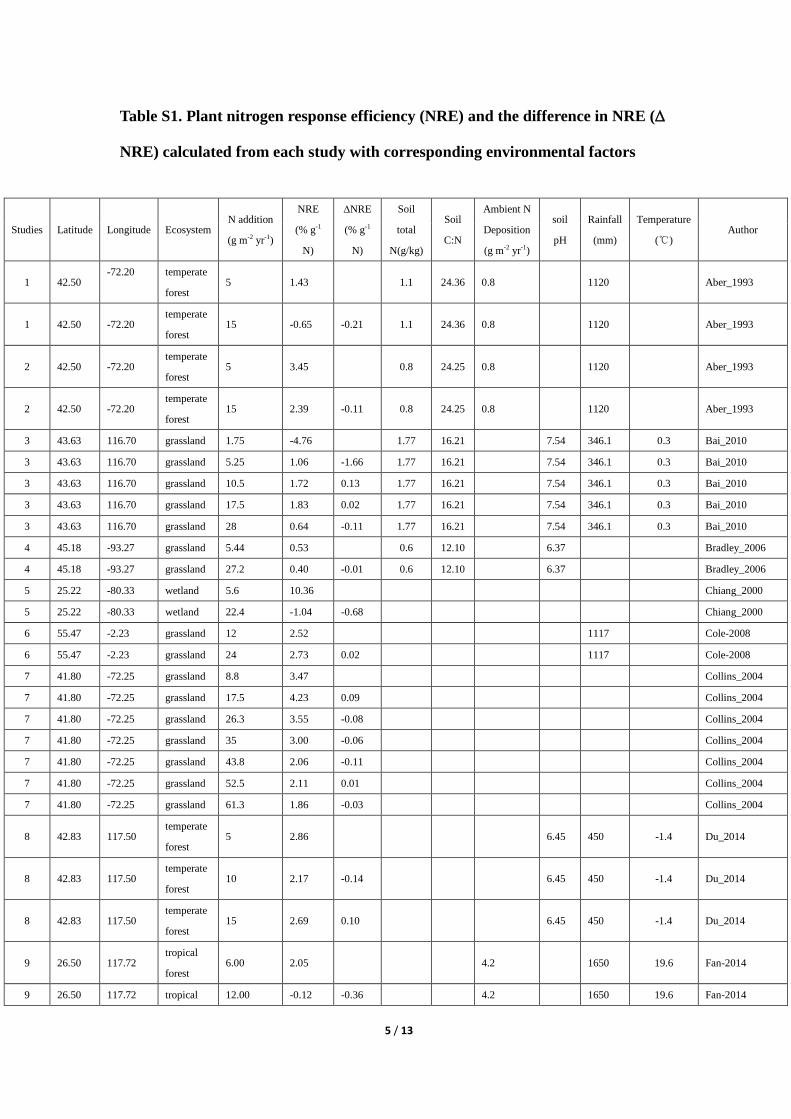
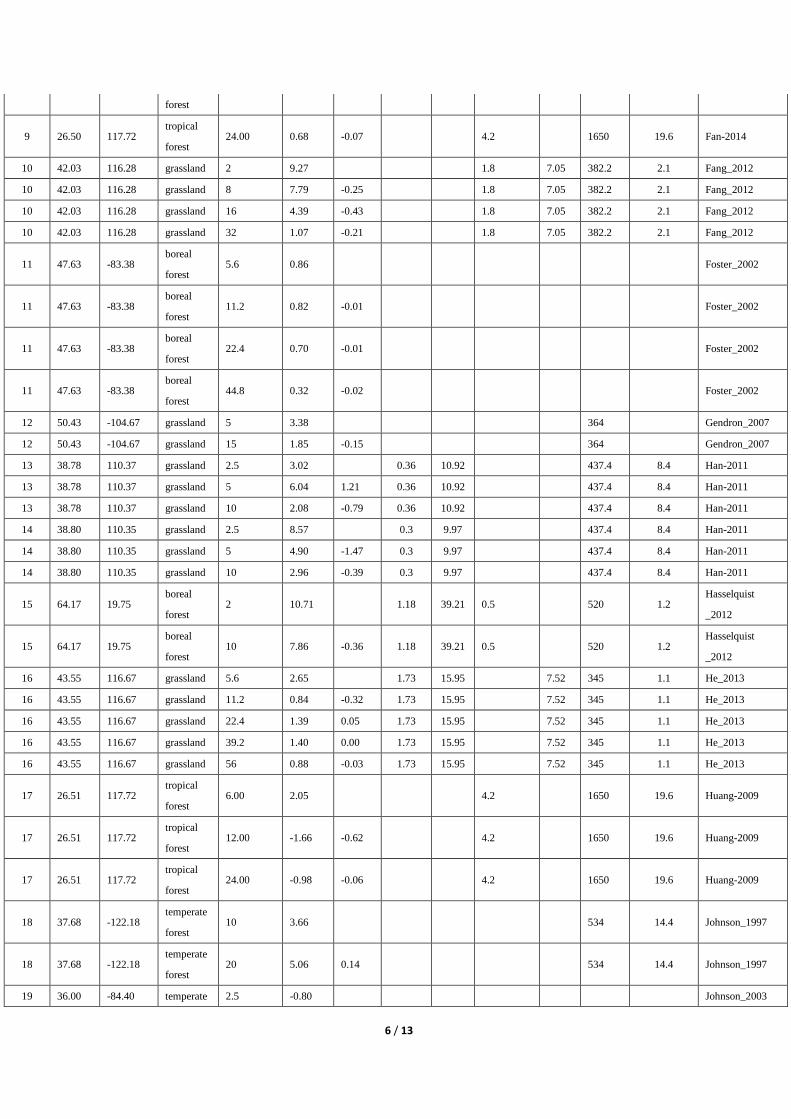
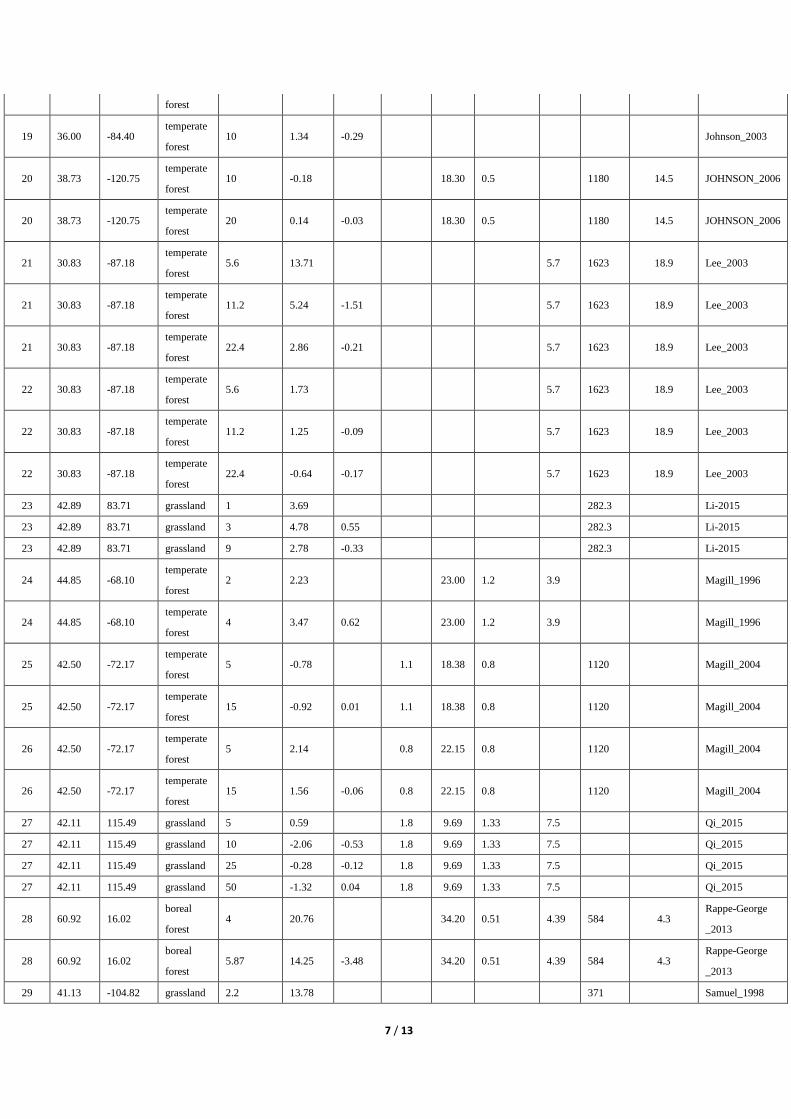
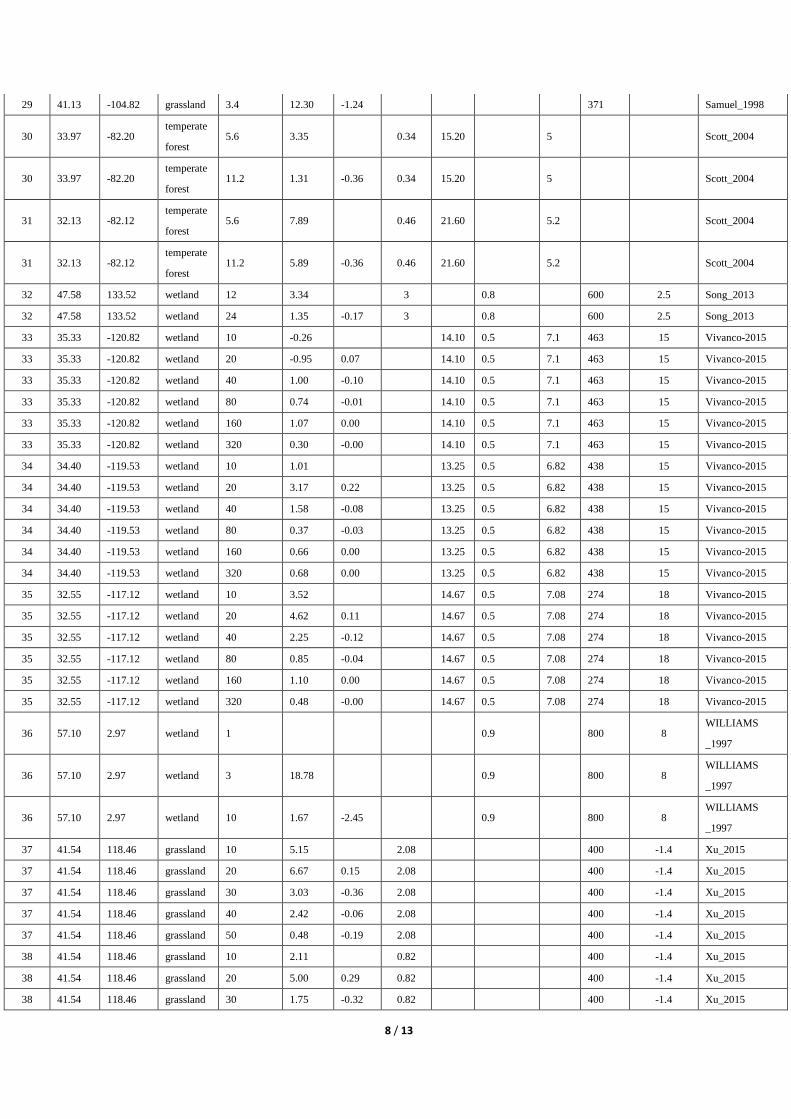
Table S1. Plant nitrogen response efficiency (NRE) and the difference in NRE (∆
NRE) calculated from each study with corresponding environmental factors
Studies Latitude Longitude Ecosystem N addition
(g m-2 yr-1)
NRE
(% g-1
N)
∆NRE
(% g-1
N)
Soil
total
N(g/kg)
Soil
C:N
Ambient N
Deposition
(g m-2 yr-1)
soil
pH
Rainfall
(mm)
Temperature
(℃) Author
1 42.50 -72.20 temperate
forest 5 1.43 1.1 24.36 0.8 1120 Aber_1993
1 42.50 -72.20 temperate
forest 15 -0.65 -0.21 1.1 24.36 0.8 1120 Aber_1993
2 42.50 -72.20 temperate
forest 5 3.45 0.8 24.25 0.8 1120 Aber_1993
2 42.50 -72.20 temperate
forest 15 2.39 -0.11 0.8 24.25 0.8 1120 Aber_1993
3 43.63 116.70 grassland 1.75 -4.76 1.77 16.21 7.54 346.1 0.3 Bai_2010
3 43.63 116.70 grassland 5.25 1.06 -1.66 1.77 16.21 7.54 346.1 0.3 Bai_2010
3 43.63 116.70 grassland 10.5 1.72 0.13 1.77 16.21 7.54 346.1 0.3 Bai_2010
3 43.63 116.70 grassland 17.5 1.83 0.02 1.77 16.21 7.54 346.1 0.3 Bai_2010
3 43.63 116.70 grassland 28 0.64 -0.11 1.77 16.21 7.54 346.1 0.3 Bai_2010
4 45.18 -93.27 grassland 5.44 0.53 0.6 12.10 6.37 Bradley_2006
4 45.18 -93.27 grassland 27.2 0.40 -0.01 0.6 12.10 6.37 Bradley_2006
5 25.22 -80.33 wetland 5.6 10.36 Chiang_2000
5 25.22 -80.33 wetland 22.4 -1.04 -0.68 Chiang_2000
6 55.47 -2.23 grassland 12 2.52 1117 Cole-2008
6 55.47 -2.23 grassland 24 2.73 0.02 1117 Cole-2008
7 41.80 -72.25 grassland 8.8 3.47 Collins_2004
7 41.80 -72.25 grassland 17.5 4.23 0.09 Collins_2004
7 41.80 -72.25 grassland 26.3 3.55 -0.08 Collins_2004
7 41.80 -72.25 grassland 35 3.00 -0.06 Collins_2004
7 41.80 -72.25 grassland 43.8 2.06 -0.11 Collins_2004
7 41.80 -72.25 grassland 52.5 2.11 0.01 Collins_2004
7 41.80 -72.25 grassland 61.3 1.86 -0.03 Collins_2004
8 42.83 117.50 temperate
forest 5 2.86 6.45 450 -1.4 Du_2014
8 42.83 117.50 temperate
forest 10 2.17 -0.14 6.45 450 -1.4 Du_2014
8 42.83 117.50 temperate
forest 15 2.69 0.10 6.45 450 -1.4 Du_2014
9 26.50 117.72 tropical
forest 6.00 2.05 4.2 1650 19.6 Fan-2014
9 26.50 117.72 tropical 12.00 -0.12 -0.36 4.2 1650 19.6 Fan-2014
6 / 13
forest
9 26.50 117.72 tropical
forest 24.00 0.68 -0.07 4.2 1650 19.6 Fan-2014
10 42.03 116.28 grassland 2 9.27 1.8 7.05 382.2 2.1 Fang_2012
10 42.03 116.28 grassland 8 7.79 -0.25 1.8 7.05 382.2 2.1 Fang_2012
10 42.03 116.28 grassland 16 4.39 -0.43 1.8 7.05 382.2 2.1 Fang_2012
10 42.03 116.28 grassland 32 1.07 -0.21 1.8 7.05 382.2 2.1 Fang_2012
11 47.63 -83.38 boreal
forest 5.6 0.86 Foster_2002
11 47.63 -83.38 boreal
forest 11.2 0.82 -0.01 Foster_2002
11 47.63 -83.38 boreal
forest 22.4 0.70 -0.01 Foster_2002
11 47.63 -83.38 boreal
forest 44.8 0.32 -0.02 Foster_2002
12 50.43 -104.67 grassland 5 3.38 364 Gendron_2007
12 50.43 -104.67 grassland 15 1.85 -0.15 364 Gendron_2007
13 38.78 110.37 grassland 2.5 3.02 0.36 10.92 437.4 8.4 Han-2011
13 38.78 110.37 grassland 5 6.04 1.21 0.36 10.92 437.4 8.4 Han-2011
13 38.78 110.37 grassland 10 2.08 -0.79 0.36 10.92 437.4 8.4 Han-2011
14 38.80 110.35 grassland 2.5 8.57 0.3 9.97 437.4 8.4 Han-2011
14 38.80 110.35 grassland 5 4.90 -1.47 0.3 9.97 437.4 8.4 Han-2011
14 38.80 110.35 grassland 10 2.96 -0.39 0.3 9.97 437.4 8.4 Han-2011
15 64.17 19.75 boreal
forest 2 10.71 1.18 39.21 0.5 520 1.2
Hasselquist
_2012
15 64.17 19.75 boreal
forest 10 7.86 -0.36 1.18 39.21 0.5 520 1.2
Hasselquist
_2012
16 43.55 116.67 grassland 5.6 2.65 1.73 15.95 7.52 345 1.1 He_2013
16 43.55 116.67 grassland 11.2 0.84 -0.32 1.73 15.95 7.52 345 1.1 He_2013
16 43.55 116.67 grassland 22.4 1.39 0.05 1.73 15.95 7.52 345 1.1 He_2013
16 43.55 116.67 grassland 39.2 1.40 0.00 1.73 15.95 7.52 345 1.1 He_2013
16 43.55 116.67 grassland 56 0.88 -0.03 1.73 15.95 7.52 345 1.1 He_2013
17 26.51 117.72 tropical
forest 6.00 2.05 4.2 1650 19.6 Huang-2009
17 26.51 117.72 tropical
forest 12.00 -1.66 -0.62 4.2 1650 19.6 Huang-2009
17 26.51 117.72 tropical
forest 24.00 -0.98 -0.06 4.2 1650 19.6 Huang-2009
18 37.68 -122.18 temperate
forest 10 3.66 534 14.4 Johnson_1997
18 37.68 -122.18 temperate
forest 20 5.06 0.14 534 14.4 Johnson_1997
19 36.00 -84.40 temperate 2.5 -0.80 Johnson_2003
7 / 13
forest
19 36.00 -84.40 temperate
forest 10 1.34 -0.29 Johnson_2003
20 38.73 -120.75 temperate
forest 10 -0.18 18.30 0.5 1180 14.5 JOHNSON_2006
20 38.73 -120.75 temperate
forest 20 0.14 -0.03 18.30 0.5 1180 14.5 JOHNSON_2006
21 30.83 -87.18 temperate
forest 5.6 13.71 5.7 1623 18.9 Lee_2003
21 30.83 -87.18 temperate
forest 11.2 5.24 -1.51 5.7 1623 18.9 Lee_2003
21 30.83 -87.18 temperate
forest 22.4 2.86 -0.21 5.7 1623 18.9 Lee_2003
22 30.83 -87.18 temperate
forest 5.6 1.73 5.7 1623 18.9 Lee_2003
22 30.83 -87.18 temperate
forest 11.2 1.25 -0.09 5.7 1623 18.9 Lee_2003
22 30.83 -87.18 temperate
forest 22.4 -0.64 -0.17 5.7 1623 18.9 Lee_2003
23 42.89 83.71 grassland 1 3.69 282.3 Li-2015
23 42.89 83.71 grassland 3 4.78 0.55 282.3 Li-2015
23 42.89 83.71 grassland 9 2.78 -0.33 282.3 Li-2015
24 44.85 -68.10 temperate
forest 2 2.23 23.00 1.2 3.9 Magill_1996
24 44.85 -68.10 temperate
forest 4 3.47 0.62 23.00 1.2 3.9 Magill_1996
25 42.50 -72.17 temperate
forest 5 -0.78 1.1 18.38 0.8 1120 Magill_2004
25 42.50 -72.17 temperate
forest 15 -0.92 0.01 1.1 18.38 0.8 1120 Magill_2004
26 42.50 -72.17 temperate
forest 5 2.14 0.8 22.15 0.8 1120 Magill_2004
26 42.50 -72.17 temperate
forest 15 1.56 -0.06 0.8 22.15 0.8 1120 Magill_2004
27 42.11 115.49 grassland 5 0.59 1.8 9.69 1.33 7.5 Qi_2015
27 42.11 115.49 grassland 10 -2.06 -0.53 1.8 9.69 1.33 7.5 Qi_2015
27 42.11 115.49 grassland 25 -0.28 -0.12 1.8 9.69 1.33 7.5 Qi_2015
27 42.11 115.49 grassland 50 -1.32 0.04 1.8 9.69 1.33 7.5 Qi_2015
28 60.92 16.02 boreal
forest 4 20.76 34.20 0.51 4.39 584 4.3
Rappe-George
_2013
28 60.92 16.02 boreal
forest 5.87 14.25 -3.48 34.20 0.51 4.39 584 4.3
Rappe-George
_2013
29 41.13 -104.82 grassland 2.2 13.78 371 Samuel_1998
8 / 13
29 41.13 -104.82 grassland 3.4 12.30 -1.24 371 Samuel_1998
30 33.97 -82.20 temperate
forest 5.6 3.35 0.34 15.20 5 Scott_2004
30 33.97 -82.20 temperate
forest 11.2 1.31 -0.36 0.34 15.20 5 Scott_2004
31 32.13 -82.12 temperate
forest 5.6 7.89 0.46 21.60 5.2 Scott_2004
31 32.13 -82.12 temperate
forest 11.2 5.89 -0.36 0.46 21.60 5.2 Scott_2004
32 47.58 133.52 wetland 12 3.34 3 0.8 600 2.5 Song_2013
32 47.58 133.52 wetland 24 1.35 -0.17 3 0.8 600 2.5 Song_2013
33 35.33 -120.82 wetland 10 -0.26 14.10 0.5 7.1 463 15 Vivanco-2015
33 35.33 -120.82 wetland 20 -0.95 0.07 14.10 0.5 7.1 463 15 Vivanco-2015
33 35.33 -120.82 wetland 40 1.00 -0.10 14.10 0.5 7.1 463 15 Vivanco-2015
33 35.33 -120.82 wetland 80 0.74 -0.01 14.10 0.5 7.1 463 15 Vivanco-2015
33 35.33 -120.82 wetland 160 1.07 0.00 14.10 0.5 7.1 463 15 Vivanco-2015
33 35.33 -120.82 wetland 320 0.30 -0.00 14.10 0.5 7.1 463 15 Vivanco-2015
34 34.40 -119.53 wetland 10 1.01 13.25 0.5 6.82 438 15 Vivanco-2015
34 34.40 -119.53 wetland 20 3.17 0.22 13.25 0.5 6.82 438 15 Vivanco-2015
34 34.40 -119.53 wetland 40 1.58 -0.08 13.25 0.5 6.82 438 15 Vivanco-2015
34 34.40 -119.53 wetland 80 0.37 -0.03 13.25 0.5 6.82 438 15 Vivanco-2015
34 34.40 -119.53 wetland 160 0.66 0.00 13.25 0.5 6.82 438 15 Vivanco-2015
34 34.40 -119.53 wetland 320 0.68 0.00 13.25 0.5 6.82 438 15 Vivanco-2015
35 32.55 -117.12 wetland 10 3.52 14.67 0.5 7.08 274 18 Vivanco-2015
35 32.55 -117.12 wetland 20 4.62 0.11 14.67 0.5 7.08 274 18 Vivanco-2015
35 32.55 -117.12 wetland 40 2.25 -0.12 14.67 0.5 7.08 274 18 Vivanco-2015
35 32.55 -117.12 wetland 80 0.85 -0.04 14.67 0.5 7.08 274 18 Vivanco-2015
35 32.55 -117.12 wetland 160 1.10 0.00 14.67 0.5 7.08 274 18 Vivanco-2015
35 32.55 -117.12 wetland 320 0.48 -0.00 14.67 0.5 7.08 274 18 Vivanco-2015
36 57.10 2.97 wetland 1 0.9 800 8 WILLIAMS
_1997
36 57.10 2.97 wetland 3 18.78 0.9 800 8 WILLIAMS
_1997
36 57.10 2.97 wetland 10 1.67 -2.45 0.9 800 8 WILLIAMS
_1997
37 41.54 118.46 grassland 10 5.15 2.08 400 -1.4 Xu_2015
37 41.54 118.46 grassland 20 6.67 0.15 2.08 400 -1.4 Xu_2015
37 41.54 118.46 grassland 30 3.03 -0.36 2.08 400 -1.4 Xu_2015
37 41.54 118.46 grassland 40 2.42 -0.06 2.08 400 -1.4 Xu_2015
37 41.54 118.46 grassland 50 0.48 -0.19 2.08 400 -1.4 Xu_2015
38 41.54 118.46 grassland 10 2.11 0.82 400 -1.4 Xu_2015
38 41.54 118.46 grassland 20 5.00 0.29 0.82 400 -1.4 Xu_2015
38 41.54 118.46 grassland 30 1.75 -0.32 0.82 400 -1.4 Xu_2015

9 / 13
38 41.54 118.46 grassland 40 2.89 0.11 0.82 400 -1.4 Xu_2015
38 41.54 118.46 grassland 50 3.16 0.03 0.82 400 -1.4 Xu_2015
39 41.54 118.46 grassland 10 1.61 1.9 400 -1.4 Xu_2015
39 41.54 118.46 grassland 20 1.29 -0.03 1.9 400 -1.4 Xu_2015
39 41.54 118.46 grassland 30 0.75 -0.05 1.9 400 -1.4 Xu_2015
39 41.54 118.46 grassland 40 1.29 0.05 1.9 400 -1.4 Xu_2015
39 41.54 118.46 grassland 50 0.39 -0.09 1.9 400 -1.4 Xu_2015
40 41.54 118.46 grassland 10 4.12 1.63 400 -1.4 Xu_2015
40 41.54 118.46 grassland 20 4.12 0.00 1.63 400 -1.4 Xu_2015
40 41.54 118.46 grassland 30 2.35 -0.18 1.63 400 -1.4 Xu_2015
40 41.54 118.46 grassland 40 2.65 0.03 1.63 400 -1.4 Xu_2015
40 41.54 118.46 grassland 50 1.65 -0.10 1.63 400 -1.4 Xu_2015
41 41.54 118.46 grassland 10 0.59 2.42 400 -1.4 Xu_2015
41 41.54 118.46 grassland 20 1.76 0.12 2.42 400 -1.4 Xu_2015
41 41.54 118.46 grassland 30 0.98 -0.08 2.42 400 -1.4 Xu_2015
41 41.54 118.46 grassland 40 -0.37 -0.13 2.42 400 -1.4 Xu_2015
41 41.54 118.46 grassland 50 0.12 -0.05 2.42 400 -1.4 Xu_2015
42 47.58 133.52 wetland 6 4.11 0.95 17.55 0.8 6 600 1.9 Zhang_2007
42 47.58 133.52 wetland 12 3.61 -0.08 0.95 17.55 0.8 6 600 1.9 Zhang_2007
43 37.62 101.32 grassland 1 23.30 1.38 580 Zhu_2011
43 37.62 101.32 grassland 2 2.89 1.38 580 Zhu_2011
43 37.62 101.32 grassland 4 1.44 -0.72 1.38 580 Zhu_2011
43 37.62 101.32 grassland 2 5.45 1.38 580 Zhu_2011
43 37.62 101.32 grassland 4 4.79 -0.33 1.38 580 Zhu_2011
43 37.62 101.32 grassland 1 21.81 1.38 580 Zhu_2011
43 37.62 101.32 grassland 2 13.91 -7.90 1.38 580 Zhu_2011
43 37.62 101.32 grassland 4 6.25 -3.83 1.38 580 Zhu_2011
44 37.76 118.99 wetland 5 18.82 0.6 26.17 630 12.9 Zhu_2013
44 37.76 118.99 wetland 10 12.24 -1.32 0.6 26.17 630 12.9 Zhu_2013

10 / 13
Figure S1. Distribution of the experiments involved in this meta-analysis across
global land
11 / 13
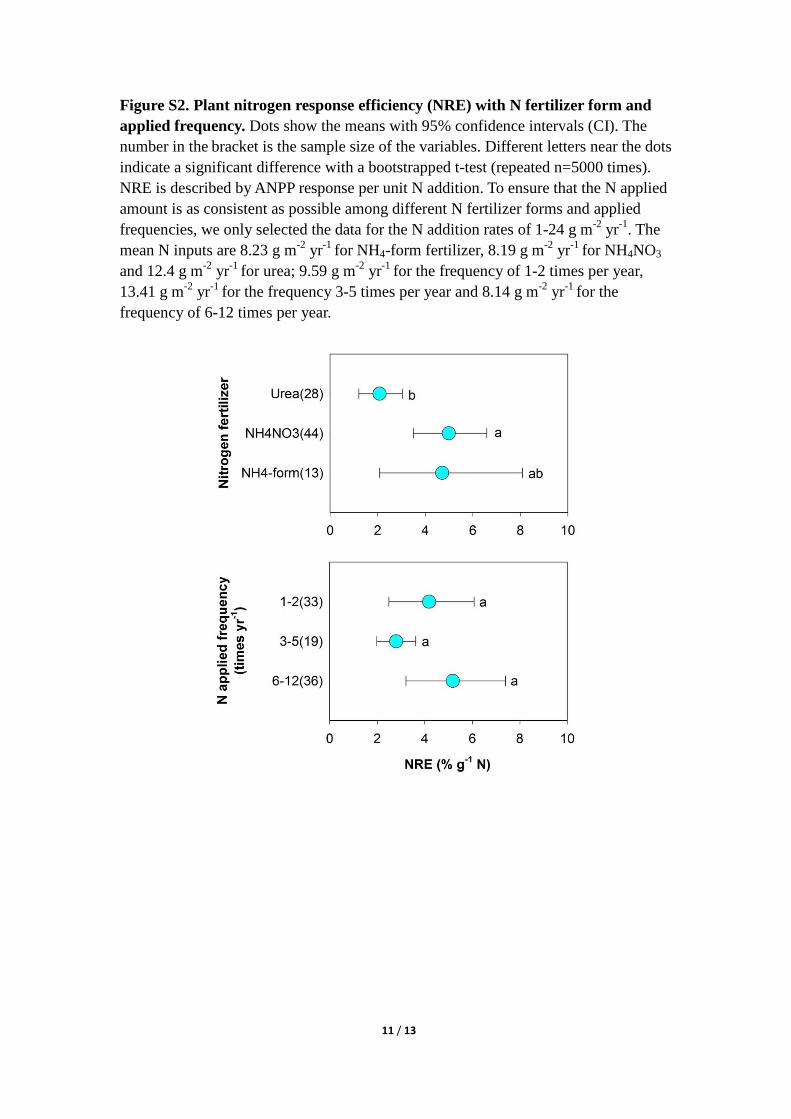
Figure S2. Plant nitrogen response efficiency (NRE) with N fertilizer form and
applied frequency. Dots show the means with 95% confidence intervals (CI). The
number in the bracket is the sample size of the variables. Different letters near the dots
indicate a significant difference with a bootstrapped t-test (repeated n=5000 times).
NRE is described by ANPP response per unit N addition. To ensure that the N applied
amount is as consistent as possible among different N fertilizer forms and applied
frequencies, we only selected the data for the N addition rates of 1-24 g m-2
yr-1
. The
mean N inputs are 8.23 g m-2
yr-1
for NH4-form fertilizer, 8.19 g m-2
yr-1
for NH4NO3
and 12.4 g m-2
yr-1
for urea; 9.59 g m-2
yr-1
for the frequency of 1-2 times per year,
13.41 g m-2
yr-1
for the frequency 3-5 times per year and 8.14 g m-2
yr-1
for the
frequency of 6-12 times per year.
12 / 13
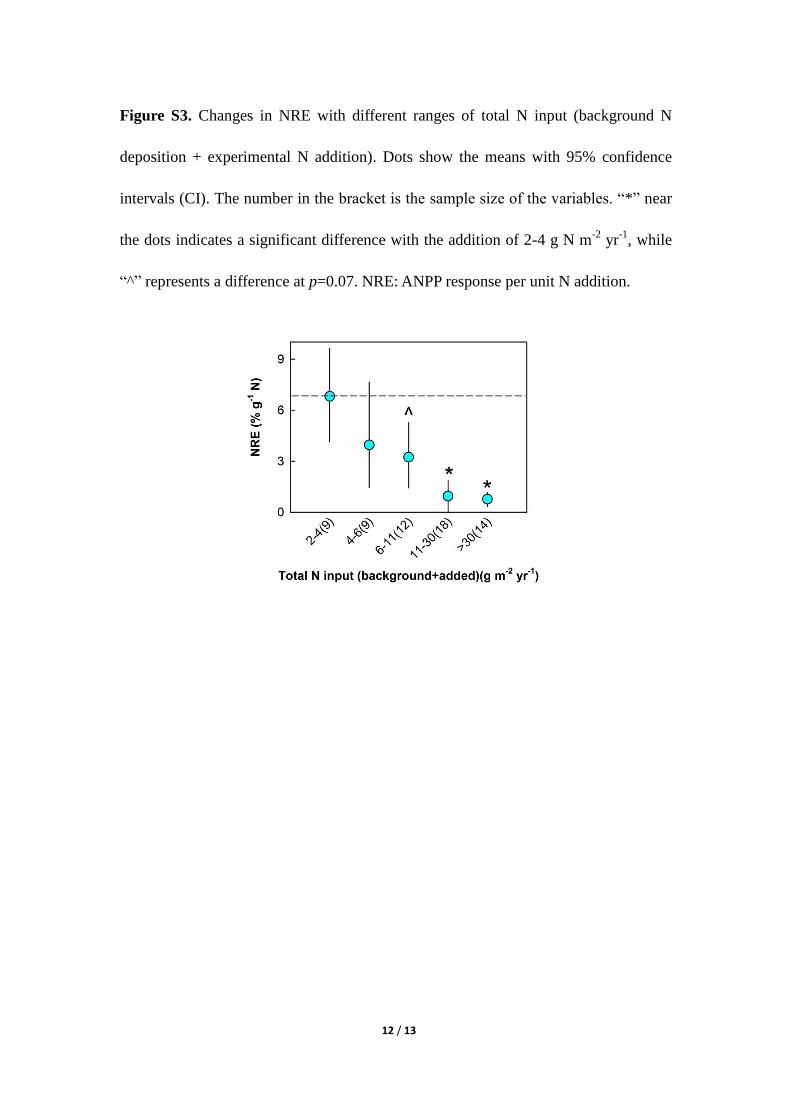
Figure S3. Changes in NRE with different ranges of total N input (background N
deposition + experimental N addition). Dots show the means with 95% confidence
intervals (CI). The number in the bracket is the sample size of the variables. “*” near
the dots indicates a significant difference with the addition of 2-4 g N m-2
yr-1
, while
“^” represents a difference at p=0.07. NRE: ANPP response per unit N addition.
13 / 13
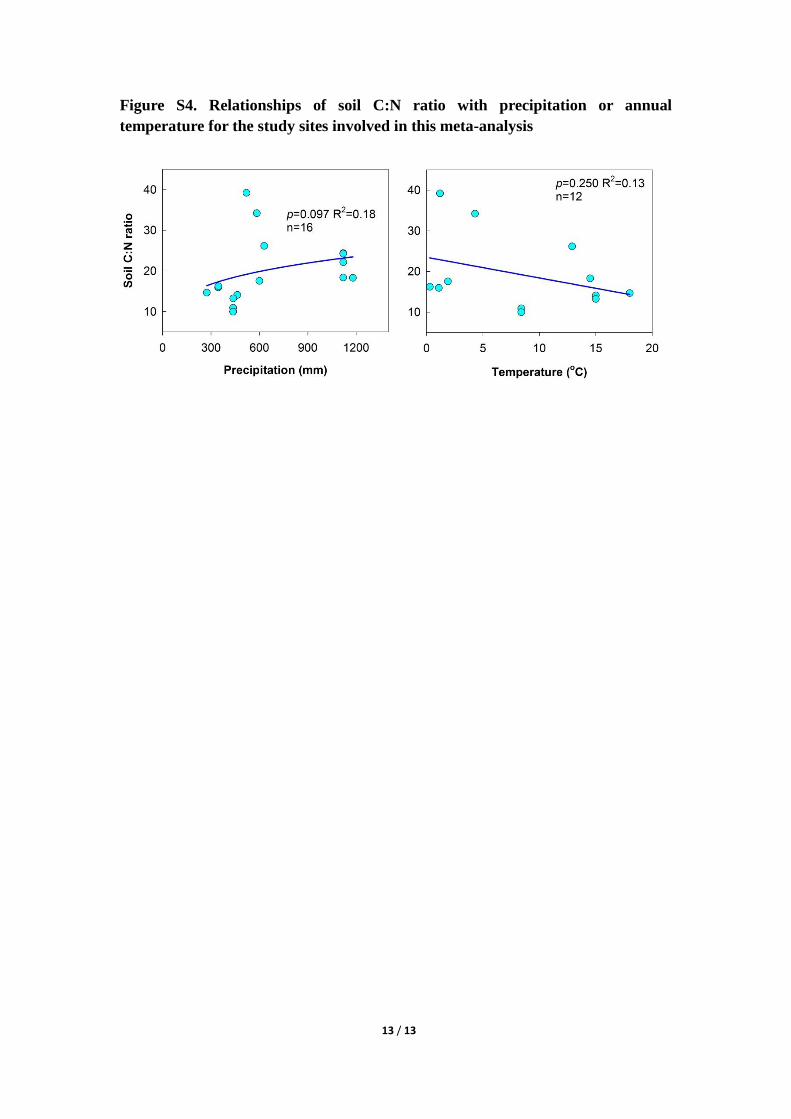
Figure S4. Relationships of soil C:N ratio with precipitation or annual
temperature for the study sites involved in this meta-analysis