glaciers. astronomical control of solar radiation earth's present-day orbit around the sun...
TRANSCRIPT

GlaciersGlaciers

Astronomical Control of Solar Radiation
Earth's present-day orbit around the Earth's present-day orbit around the SunSun Not permanentNot permanent Varies at cycles from 20,000-400,000 Varies at cycles from 20,000-400,000
years years Changes due toChanges due to
•Tilt of Earth's axisTilt of Earth's axis•Shape of Earth’s yearly path of Shape of Earth’s yearly path of revolution around the Sunrevolution around the Sun

18O Record from Benthic Foraminifera
Ice volume and T move Ice volume and T move 1818O in same directionO in same direction
Two main trendsTwo main trends Cyclic oscillationsCyclic oscillations
Orbital forcingOrbital forcing•Dominant cycles Dominant cycles
changed over last changed over last 2.75 my2.75 my
Long-term slow driftLong-term slow driftChange in COChange in CO22
Constant slow Constant slow coolingcooling

Corals found Corals found about 6 about 6 meters meters above above
present-day present-day sea levelsea level
Corals Corals formed at formed at
15-20 15-20 meters meters below below
present-day present-day sea levelsea level
Lowest level of Lowest level of submerged submerged
corals is 120 corals is 120 meters below meters below
present-day sea present-day sea levellevel

Orbital-Scale Change in CH4 & CO2 Important climate records from last 750 kyaImportant climate records from last 750 kya
Direct sampling of greenhouse gases in iceDirect sampling of greenhouse gases in ice Critical questions must be addressedCritical questions must be addressed
Before scale of variability in records Before scale of variability in records determineddetermined
Reliability of age dating of ice core?Reliability of age dating of ice core?Mechanisms and timing of gas trapping?Mechanisms and timing of gas trapping?Accuracy of the record?Accuracy of the record?
•How well gases can be measured?How well gases can be measured?•How well do they represent atmospheric How well do they represent atmospheric
compositions and concentrations?compositions and concentrations?

Carbon Dioxide Measurements of COMeasurements of CO22 concentration concentration
Core from rapidly accumulating iceCore from rapidly accumulating ice Merge well with instrumental dataMerge well with instrumental data

Methane Measurements of CHMeasurements of CH44 concentration concentration
Core from rapidly accumulating iceCore from rapidly accumulating ice Merge well with instrumental dataMerge well with instrumental data

Orbital-Scale Changes in CH4
CHCH44 variability variability Interglacial maxima 550-Interglacial maxima 550-
700 ppb700 ppb Glacial minima 350-450 Glacial minima 350-450
ppbppb Five cycles apparent in Five cycles apparent in
recordrecord 23,000 precession 23,000 precession
periodperiod Dominates low-Dominates low-
latitude insolationlatitude insolation Resemble monsoon Resemble monsoon
signalsignal• Magnitude of Magnitude of
signals matchsignals match

Monsoon forcing of CH4
Match of high CHMatch of high CH44 with strong monsoon with strong monsoon Strongly suggests connectionStrongly suggests connection
Monsoon fluctuations in SE AsiaMonsoon fluctuations in SE Asia Produce heavy rainfall, saturate groundProduce heavy rainfall, saturate ground
Builds up bogsBuilds up bogs•Organic matter deposition and Organic matter deposition and anaerobic respiration likelyanaerobic respiration likely–Bogs expand during strong Bogs expand during strong summer monsoonsummer monsoon
–Shrink during weak summer Shrink during weak summer monsoonmonsoon

Orbital-Scale Changes in CO2
COCO22 record from Vostok record from Vostok Interglacial maxima 280-300 Interglacial maxima 280-300
ppmppm Glacial minima 180-190 Glacial minima 180-190
ppmppm 100,000 year cycle dominant100,000 year cycle dominant Match ice volume recordMatch ice volume record
Timing Timing AsymmetryAsymmetry
Abrupt increases in COAbrupt increases in CO22 match rapid ice meltingmatch rapid ice melting
Slow decreases in COSlow decreases in CO22 match slow build-up of icematch slow build-up of ice

Orbital-Scale Changes in CO2
Vostok 150,000 recordVostok 150,000 record 23,000 and 41,000 23,000 and 41,000
cyclescycles Match similar cycles Match similar cycles
in ice volumein ice volume Agreement suggests Agreement suggests
cause and effect cause and effect relationshiprelationship Relationship Relationship
unknownunknown e.g., does COe.g., does CO22
lead ice volume?lead ice volume? Correlations not Correlations not
sufficient to provide sufficient to provide definite evaluationdefinite evaluation
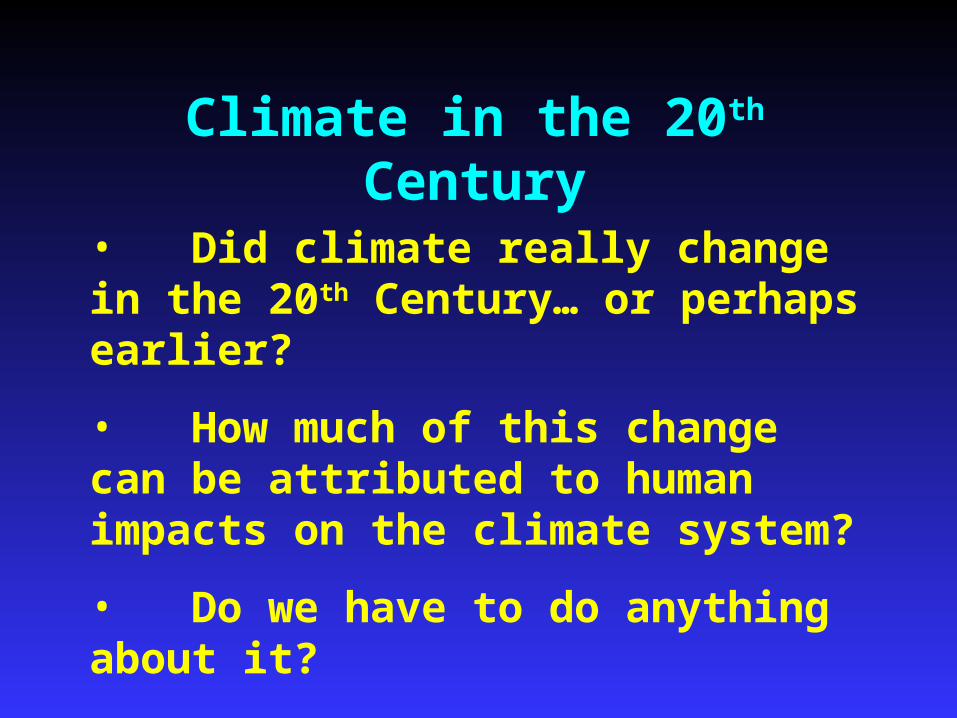
Climate in the 20th Century
• Did climate really change in the 20th Century… or perhaps earlier?
• How much of this change can be attributed to human impacts on the climate system?
• Do we have to do anything about it?

Carbon Dioxide

Did climate really change in the 20th Century?
According to IPCC’s Third Assessment Report, Climate Change 2001:
1. The global average surface temperature has increased 0.6±0.2ºC over the 20th Century.
2. Globally, it is very likely that the 1990s were the warmest decade and 1998 the warmest year in the instrumental record, since 1861 (and likely the warmest in the last 1000 years).
2001 was second warmest according to NCDC.

From Climate Change 2001: SFP WG I
Variations of Earth’s surface temperature for the past 140 years

From Climate Change 2001: SFP WG I
Variations of Earth’s surface temperature for the past 1000 years

How much of this change can be attributed to human impacts on the
climate system?
Climate Change 2001: “There is new and stronger evidence that most of the warming observed over the last 50 years is attributable to human activity.”
NRC 2001: “The changes observed over the last several decades are likely mostly due to human activities.”

How do we know??
• Measure increases in atmospheric concentrations of known greenhouse gases.
• Calculate the effects of these gases on the Earth’s heat budget.
• Model the response of global climate to calculated radiative forcing.
• Look at similar episodes in geologic record

Indicators of human influence on the atmosphere:

Average annual decrease in Average annual decrease in 1313C = ~0.014‰ yC = ~0.014‰ y-1-1 over the last 10 over the last 10 yearsyears
Reflects the influence of fossil-fuel carbon combustion in the Reflects the influence of fossil-fuel carbon combustion in the atmosphereatmosphere
Additional influences of temporal variations in oceanic and Additional influences of temporal variations in oceanic and terrestrial components of the global carbon cycle are also evident terrestrial components of the global carbon cycle are also evident
13C
of
CO
2

Climate in the 20th Century
• Did climate really change in the 20th Century? YES +0.6ºC
• How much of this change can be attributed to human impacts on the climate system? YES about +0.4ºC
• Do we have to do anything about it? ??

(Ruddiman 2005)

Ruddiman’s Hypothesis
Human activity influenced atmospheric gas Human activity influenced atmospheric gas concentrationsconcentrations COCO22 increased about 8,000 years ago increased about 8,000 years ago CHCH44 increased about 5,000 years ago increased about 5,000 years ago
Halted the development of another ice ageHalted the development of another ice age Without increase in greenhouse gases, Without increase in greenhouse gases,
northern hemisphere would have cooled northern hemisphere would have cooled by 4by 4ºCºCCool enough to form glacial iceCool enough to form glacial ice
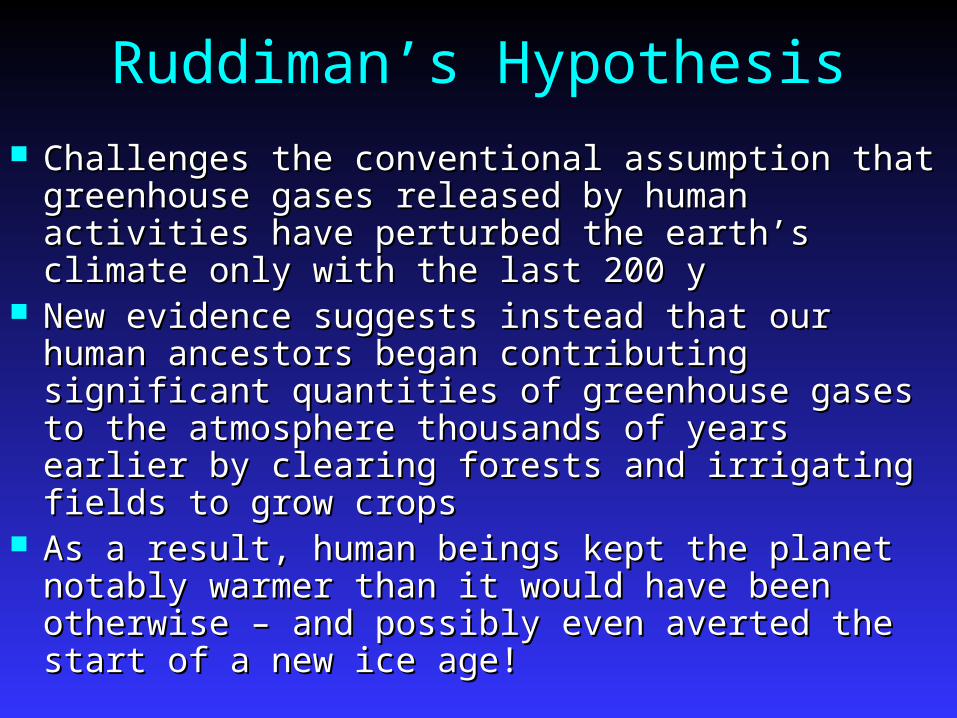
Ruddiman’s Hypothesis Challenges the conventional assumption that Challenges the conventional assumption that
greenhouse gases released by human activities greenhouse gases released by human activities have perturbed the earth’s climate only with the have perturbed the earth’s climate only with the last 200 ylast 200 y
New evidence suggests instead that our human New evidence suggests instead that our human ancestors began contributing significant ancestors began contributing significant quantities of greenhouse gases to the quantities of greenhouse gases to the atmosphere thousands of years earlier by atmosphere thousands of years earlier by clearing forests and irrigating fields to grow cropsclearing forests and irrigating fields to grow crops
As a result, human beings kept the planet notably As a result, human beings kept the planet notably warmer than it would have been otherwise – and warmer than it would have been otherwise – and possibly even averted the start of a new ice age!possibly even averted the start of a new ice age!

Agricultural terraces have been constructed for ~2000 years. The photo on the right are terraces in Guizhou Province, China.


Minimum Ice


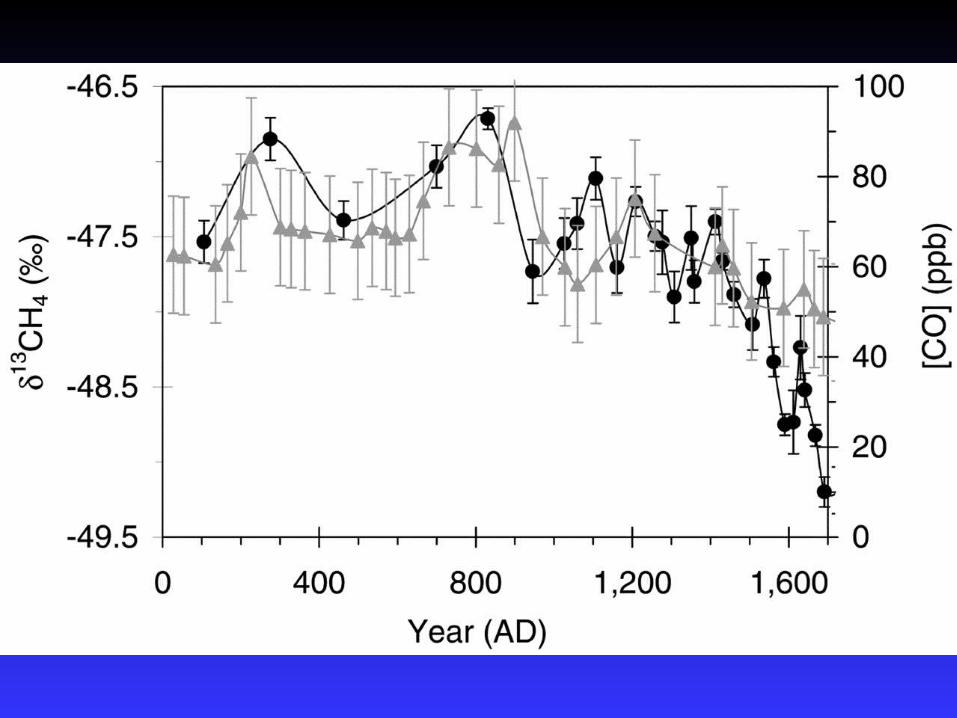
(Ferretti and others 2005)

What happenedin 1492?

Plows, Plagues & Petroleum


References Worth Reading
Ruddiman W. F. (2005) How did Ruddiman W. F. (2005) How did humans first alter global climate? humans first alter global climate? Scientific AmericanScientific American 292:292: 46-53. 46-53.
Ruddiman W. F. (2005) Ruddiman W. F. (2005) Plows, Plows, Plagues & PetroleumPlagues & Petroleum, Princeton , Princeton University Press, 202 p.University Press, 202 p.

Homework Question 1
How does glacial growth or shrinkage How does glacial growth or shrinkage result from the balance between ablation result from the balance between ablation and accumulation?and accumulation?
If ablation is equal to accumulation, the If ablation is equal to accumulation, the glacier is gaining as much ice as it is glacier is gaining as much ice as it is losing and will neither grow nor shrink. If losing and will neither grow nor shrink. If accumulation is greater, the glacier will accumulation is greater, the glacier will grow. If ablation is greater, the glacier grow. If ablation is greater, the glacier will shrink.will shrink.

Homework Question 2
How do glaciations affect sea level?How do glaciations affect sea level? The majority of the snow that forms The majority of the snow that forms
glaciers originates as water vapor from glaciers originates as water vapor from the oceans. As ice accumulates on land, the oceans. As ice accumulates on land, moisture is permanently removed from moisture is permanently removed from the oceans and sea level goes down. As the oceans and sea level goes down. As glacial ice melts, sea level rises.glacial ice melts, sea level rises.

Homework Question 3
How does carbon dioxide (COHow does carbon dioxide (CO22) in the ) in the Earth’s atmosphere affect climate?Earth’s atmosphere affect climate?
Carbon dioxide is a "greenhouse" gas. Carbon dioxide is a "greenhouse" gas. This means that it absorbs infrared This means that it absorbs infrared radiation and warms the atmosphere. radiation and warms the atmosphere. Increases in the atmosphere's carbon Increases in the atmosphere's carbon dioxide content are expected to dioxide content are expected to correspond to warmer climates.correspond to warmer climates.

Homework Question 4
When did humans 1When did humans 1stst begin to affect begin to affect Earth’s climate?Earth’s climate?
Subject covered in today’s lecture…Subject covered in today’s lecture…