gis, gps and remote sensing applications in forest...
TRANSCRIPT
International Journal of Arts and Sciences 3(9): 227-239 (2010)
CD-ROM. ISSN: 1944-6934 © InternationalJournal.org
GIS, GPS and Remote Sensing Applications in Forest Management Planning of the Urban Forests of Istanbul Municipality Ahmet Yeşil, Istanbul University, Turkey Hayati Zengin, Abant Izzet Baysal University, Turkey Ulaş Yunus Özkan, Istanbul University, Turkey Serhun Sağlam, Istanbul University, Turkey
Abstract: Istanbul is the largest urban of Turkey. It has twelve urban forests bigger than three hectares areas that belong to the Istanbul Municipality. Urban forests and forests provide significant goods and services such as timber, clean water, climate amelioration; recreation opportunity and visual amenities to name a few, for the citizen live in Istanbul. This paper deals with the results of a study concerning forest planning technique which was applied in these urban forests between 2001, 2003. Since the planning objectives are different from the state forest enterprise, inventory aims and intensity are varying in the urban forests compare to the state forest management planning units. Single tree base, or patch and group base forest inventory are unnecessary efforts in state forest inventory while they are inevitable tasks in urban forests inventories. The study may be divided into office works and field surveys. The construction of basic compartments map by using topographic maps having 1/5000 scale and the separation of varying forest covers from ortophotos having the same scale were the first phase. The definition of inventory units, sampling design and fields measurements were the second phase. Field surveys is essential to identify the forest stand type of urban forests, to record the locations of forest stand type and the accuracy of resulting forest stand type map from ortophoto classification. Almost every remote sensing study needs field surveys in order to obtain more information for the accuracy of resulting maps. Global Positioning Systems are a vital component to locate the sample plots in study area. Coordinates were determined with the Real Time Kinematic method. Producing forest stand or tree GIS can be divided into two components; i)delineating locations of forest stand area boundaries and individual trees bigger diameter than 70 cm. ii) adding characteristics of trees and stands to the delineated features in a data base. With this work an example was shown how GIS can help the urban forests’ manager and provide sound and reliable data. These data can also easily updated and exchange with the other managerial departments. Keywords: urban forests, forest inventory, GPS, GIS. Introduction The urban forestry concept, first introduced by Jorgensen at the University of Toronto, North America in 1965 has arrived Europe through United Kingdom in 1980s and then became widespread (Randrup et al 2005). This concept has grown rapidly in industrialized countries and requires its own planning and inventory techniques.

International Journal of Arts and Sciences 3(9): 227-239 (2010)
CD-ROM. ISSN: 1944-6934 © InternationalJournal.org
The cities of Turkey, which have been suffering from fast and unplanned urbanization for 20 years, are losing their livability due to the destruction of nature by ongoing unplanned development, immigration and fast-growing population. Transformation of settlement units into intense built environments on the metropolitan scale has caused urban dwellers to become estranged from their natural surroundings, with serious adverse effects on health and life quality. As environmental problems become a greater concern, urban forestry is increasingly important for improving the ecological environment as well as creating an aesthetic look and improving life quality in cities, particularly densely populated industrial cities (Serin and Gül 2006). The primary services provided to the public by urban forests include increasing the aesthetic of the natural landscape through beautification, and creating a suitable environment for sports and entertainment activities within these forests. In addition, urban forests provide less obvious benefits such as preventing noise, absorbing dust, purifying the air, regulating the climate, protecting the settlement areas close to such forests against floods, and preventing erosions. Often described as the “lungs” of cities, urban forests have a high functional value in terms of environment and public health (Grey and Deneke 1986; Asan and Özdemir 2005). The Urban Forest Concept in the World and in Turkey Examination of the urban forest and urban forestry concepts in developed countries reveals that these concepts are influenced by traditional forestry ideas worldwide, but specific definitions changes for each country. One of the most commonly-recognized definitions of an urban forest is provided by Miller (1997), who defined an urban forest as “the sum of all woody and associated vegetation in and around dense human settlements”. The situation in Turkey indicates that the main factors determining the urban forest concept are traditional forestry and the definition of urban areas. Pursuant to the Laws no. 4646 and 442, a whole constructed area located within the boundaries of a Municipality or a Metropolitan Municipality and having a population more than 20.000 people shall be called “city” (Elvan and Velioğlu 2004). Forest is defined in Article 1 of the Forest Law No. 6831 as follows: “Trees and small tree groups that grow naturally or by human efforts and the land on which they are located shall be considered as forest”. The sites not considered as forest are also defined in the said article (Aygen 2002). Taking into consideration the traditional forestry and the urban concept in Turkey, the urban forestry concept may be defined as below: “Parks, gardens, cemeteries, woodlands and forests, which (i) grow naturally or planted, (ii) are not primarily intended for wood production, (iii) have 10% or higher canopy density, (iv) consist of trees that can reach at least 5 meters height, and (v) where trees are dominantly existing, may be considered as urban forests”. Regardless of definition, the benefits of urban forests can be outlined as below:
International Journal of Arts and Sciences 3(9): 227-239 (2010)
CD-ROM. ISSN: 1944-6934 © InternationalJournal.org
To meet the recreational requirements To offer environmental and social functions To improve life quality of the society To serve as a living space for wildlife
These functions highlight the social, psychological and ecological benefits of the forests in urban areas. Because of their unique location and role, planning and inventory techniques for urban forests are different from those used in classical forestry. Inventory in Urban Forestry As in all planning processes, creating an inventory is the starting point of planning urban forests. The inventory work should provide basic data such as location, number, type and status of trees. Various sources of information such as aerial photographs, satellite images, GPS and ground measurements are used to provide this data. In order to enhance efficiency during collection of the data required, remote sensing data can be integrated into other sources of information through Geographic Information System (GIS). In order to collect spatial data, Global Positioning System (GPS), automatic measurement devices, and modern remote sensing have been used in recent years to support terrain works. This development enables more accurate and less expensive collection of spatial digital data than the previous data acquisition methods. Requirement for collection and analysis of spatial data may be easily met by remote sensing data (Corona et al 2003; Holopainen and Kalliovirta 2006). The data required for planning is organized by vegetation classes, which are divided into different-sized inventory units by automatic classification of remote sensing data by computer programs, or visual interpretation. However, there is a major question researchers face when using remote sensing data in these studies: should aerial photographs or satellite images be used? The answer to this question depends on the size of inventory area, inventory objectives, accuracy level required and imaging costs. In cases where highly detailed information is not required, a favorably-priced and high resolution image such as LANDSAT may be used. If the study to be done requires highly detailed information, the best choice would be very high resolution images or aerial photographs or LIDAR, laser scanner images. The most suitable remote sensing image for forest planning purposes is digital aerial photographs, while for inventories of large areas satellite images are preferable. Advantages of high resolution satellite images versus aerial photographs are their lower-price per unit area and higher spectral resolution (Holmgren and Thuresson 1998; Hyppa and Inkinen 1999; Pitkanen 2001; Tuominen and Poso 2001; Pekkarinen 2002; Pekkarinen 2004; Holopainen and Kalliovirta 2006). Silvicultural treatments for reaching management goals in urban forests are different from those used in traditional forest managements. Therefore, the methods and intensities of the inventories used in the planning of ordinary forests do not seem applicable to urban forests. It

International Journal of Arts and Sciences 3(9): 227-239 (2010)
CD-ROM. ISSN: 1944-6934 © InternationalJournal.org
seems compulsory to perform both inventory and planning on the basis of units reduced, as far as possible, to single-tree basis (Asan and Özdemir 2005). Due to heterogeneous structure of urban areas, detecting tree cover in small groups and single trees is difficult. Most approaches use image identification, classification and GIS. Classification is a standard approach for remote sensing data and used for uniform and homogeneous classes. The most important problem in classification of tree cover and single trees in urban areas via remote sensing data are the mixed pixels. Mixed pixels represent the pixels that have more than one land cover within the same pixel. Spatial resolution of the images provided by platforms such as LANDSAT and SPOT are very superficial, in terms of practical use, for urban planners and their applications. It is very difficult to find an urban area where the same vegetation class is represented by a single pixel (Hung 2002; Szantoi et al 2008). Very high resolution satellite images and aerial photographs such as IKONOS and QUICKBIRD may solve these problems. Because the planning process is different from traditional forestry, new approaches are used in the inventory preparation. Some of the functions and services provided by urban forests can only be observed and measured through ground observations. For example, functions such as carbon storage, oxygen production, dust capturing and reduced heating and cooling of the buildings around the forest, have become part of the inventory and can be measured more accurately. For determining these qualities during the inventory, the coordinates and all physical properties of each tree are specified with the detailed measurements and modeling packages, such as “UFORE” (Urban Forest Effect Model), which are developed to reveal each tree’s status in performing their identified functions. The UFORE model developed by USDA Forest Services, can determine the value of functions such as energy conservation, air pollution reduction, and carbon sequestration (Andreu et al 2009). Another significant function of urban forests is the habitats they provide for wildlife and biodiversity. The biggest threat to these habitats is forest fragmentation. Forest land fragmentation dramatically endangers global biodiversity and causes significant problems in ecosystem function and services (Millennium Ecosystem Assessment 2005). The remote sensing researchers and landscape ecologists developed programs such as Fragstats for evaluating the effects of forest fragmentation on natural processes (McGarigal and Marks 1995). In fragmentation studies, various measurements are performed in the inventory to monitor fragmentation’s effect on biological diversity and health (physical conditions such as tree species, diameter, height, soil type, insects, fungi, etc.). Many programs developed for the analysis of these measured values, such as “Fragstats”, are popular for presenting wildlife and biological diversity. In this project, the techniques of GPS, GIS, remote sensing and ground measurement are applied during the preparation of Istanbul urban forests’ Silviculture and Management Plans and methods of determining the spatial forest functions, unique to these urban forests, are introduced.

International Journal of Arts and Sciences 3(9): 227-239 (2010)
CD-ROM. ISSN: 1944-6934 © InternationalJournal.org
Working Area Istanbul is the biggest city of Turkey with its population approximately of 12 million. It spreads over an area which is 80 km long from east to west and 40 km long from north to south. Due to prolonged settlement (≈6000 years) most of the natural vegetation had been significantly damaged, but some groves and city parks still remain as urban forests although they do not meet all needs of the urban population. The study area includes several urban forests spreading over both sides of the Bosporus strait (Figure 1), the largest of which is 122 ha.
Figure 1: Geographic Location of the Working Area
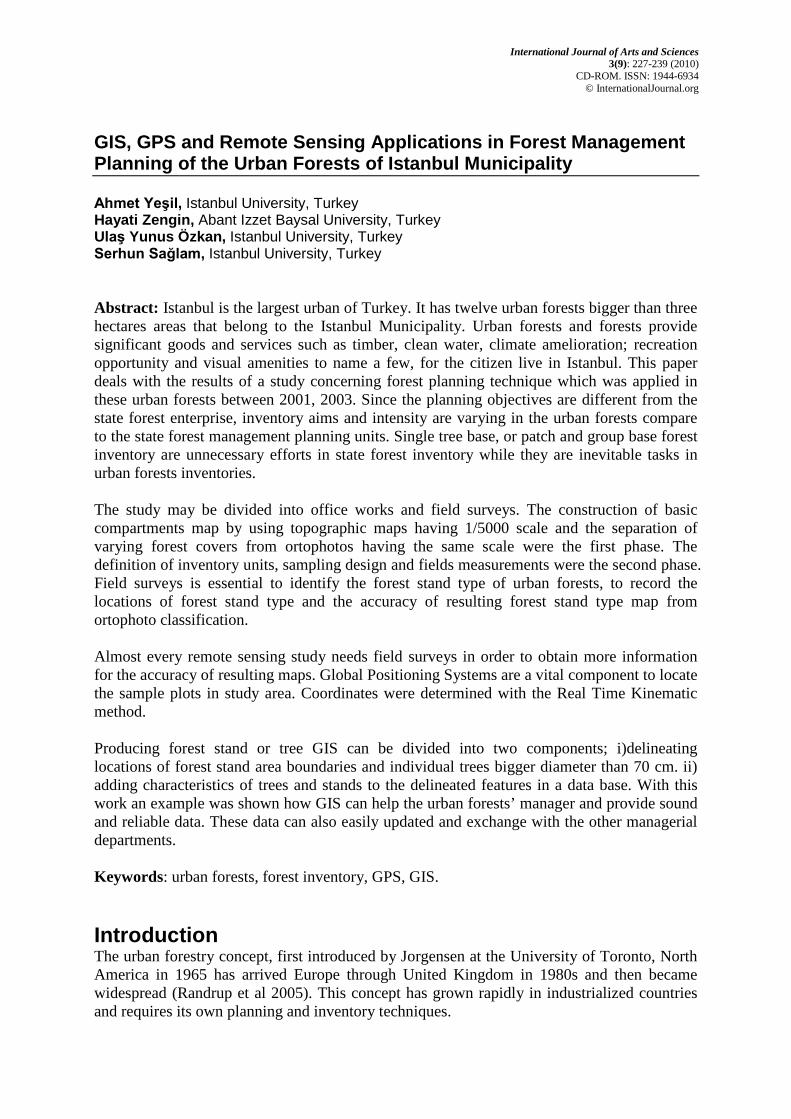
Method Data Due to the heterogeneous structure of Istanbul’s urban forestry (which includes numerous local and foreign species), it is difficult to identify small groups consisting of single tree, shrubs and bushes. Because of this structure and the project’s focus on small units (single tree), orthophotos were preferred because of their high spatial resolution as remote sensing data. Creating Spatial Vegetation Map In the planning of urban forests some standard forestry terms became meaningless so new definitions are necessary. For this project, the terms of “inventory unit” instead of stand and “Spatial Vegetation Map” instead of stand type map, were used (Asan and Özdemir 2005; Ventura, 1997). Interpretation of the Ortho-photos and Preparing of the Digital Draft Maps 1/5000 scale orthophotos created with 1/4500 average scale aerial photos and 1/5000 scale and contour map were used for editing the spatial vegetation map (Figure 2). Ortho-photos in the analog format, has been transferred to the computer via scanners. With the help of GIS based NETCAD, geometric correction of orthophotos were made by using ground control points determined from the cadastral map. The planning unit urban forests’ boundaries were defined by transferring cadastral boundaries in vector format on the orthophotos.
International Journal of Arts and Sciences 3(9): 227-239 (2010)
CD-ROM. ISSN: 1944-6934 © InternationalJournal.org
Figure 2: Ortho-photo and planning unit’s boundaries (Hacıosman Urban Forest)
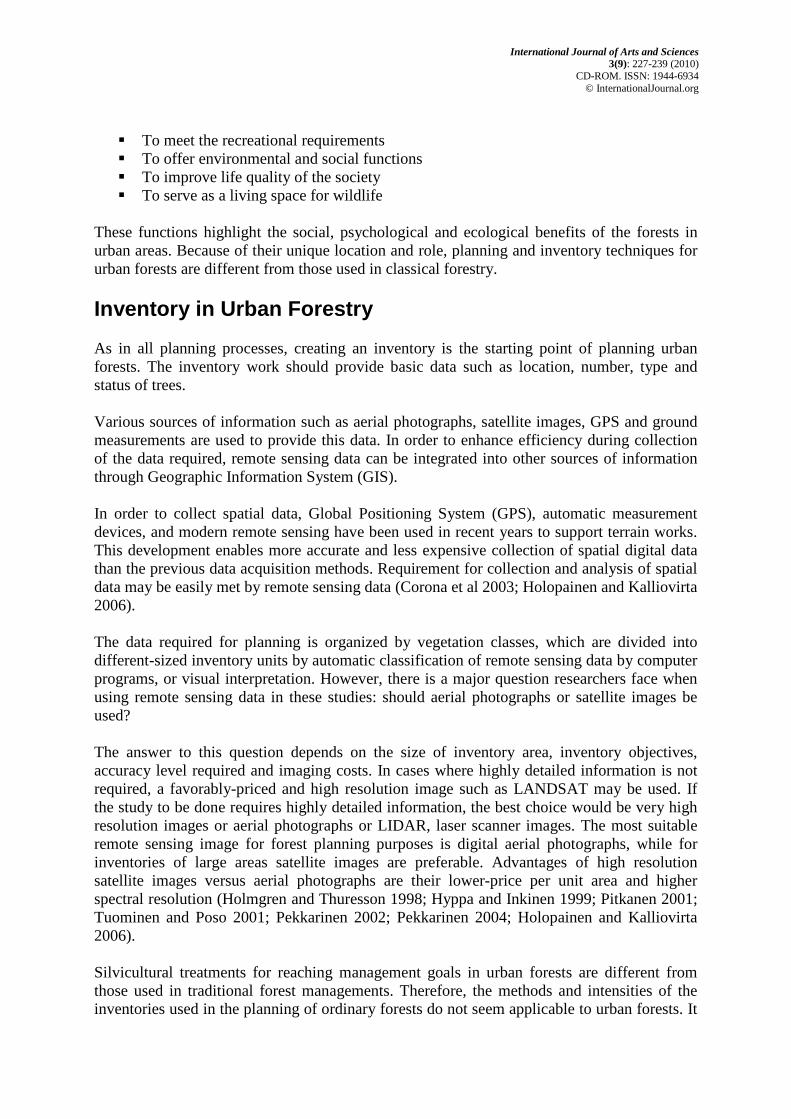
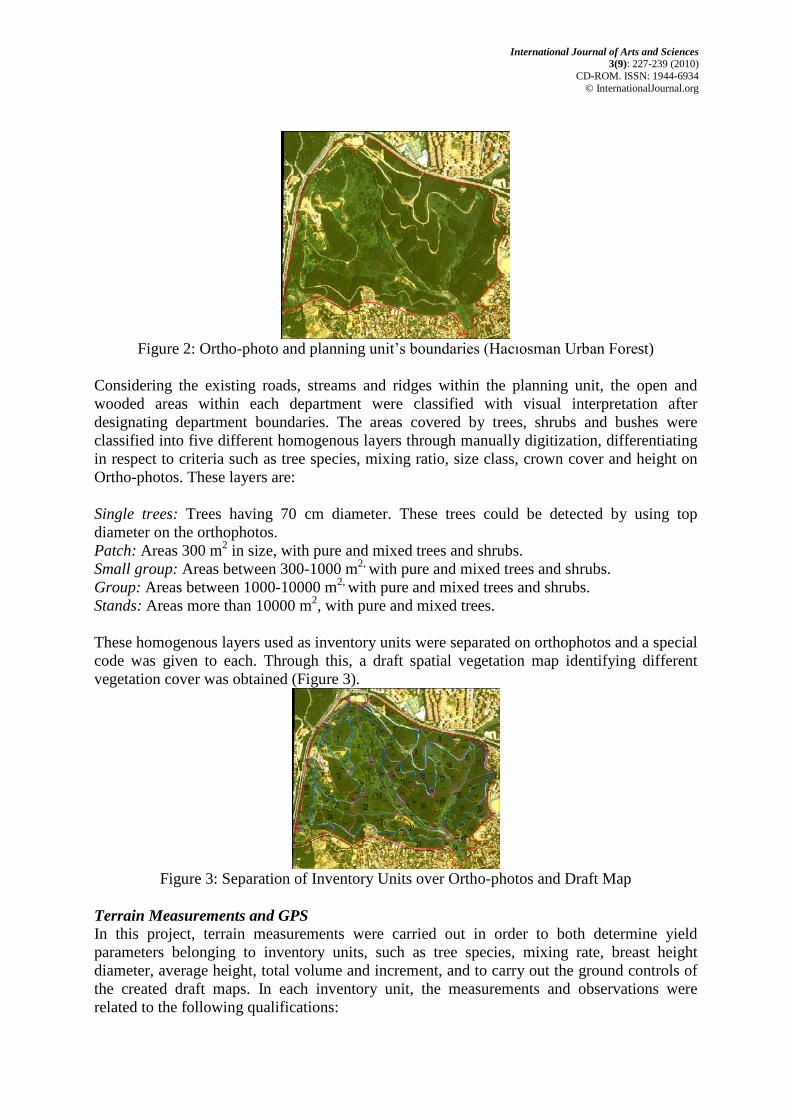
Considering the existing roads, streams and ridges within the planning unit, the open and wooded areas within each department were classified with visual interpretation after designating department boundaries. The areas covered by trees, shrubs and bushes were classified into five different homogenous layers through manually digitization, differentiating in respect to criteria such as tree species, mixing ratio, size class, crown cover and height on Ortho-photos. These layers are: Single trees: Trees having 70 cm diameter. These trees could be detected by using top diameter on the orthophotos. Patch: Areas 300 m2 in size, with pure and mixed trees and shrubs. Small group: Areas between 300-1000 m2, with pure and mixed trees and shrubs. Group: Areas between 1000-10000 m2, with pure and mixed trees and shrubs. Stands: Areas more than 10000 m2, with pure and mixed trees. These homogenous layers used as inventory units were separated on orthophotos and a special code was given to each. Through this, a draft spatial vegetation map identifying different vegetation cover was obtained (Figure 3).
Figure 3: Separation of Inventory Units over Ortho-photos and Draft Map
Terrain Measurements and GPS In this project, terrain measurements were carried out in order to both determine yield parameters belonging to inventory units, such as tree species, mixing rate, breast height diameter, average height, total volume and increment, and to carry out the ground controls of the created draft maps. In each inventory unit, the measurements and observations were related to the following qualifications:

International Journal of Arts and Sciences 3(9): 227-239 (2010)
CD-ROM. ISSN: 1944-6934 © InternationalJournal.org
1- Dominant and co dominant trees and other species, 2- Vertical structure form (one-storied, two-storied, or multi-storied ), 3- Size classes of each species (small, medium and large diameter), 4- Average height of the dominant type, 5- Mixture forms and ratios, 6- Total number of individuals, 7- Silvicultural treatment needs (pruning, thinning, rehabilitation, regeneration etc.), 8- Health conditions and apparent damages(fungi, insects, broken top, discoloration of
leaves, loss of leaf and needle), 9- Ecological conditions (altitude, slope, aspect, soil and humus types), 10- Expected benefits and functions of the unit.
In the case that each inventory unit is on the terrain, the present position of the inventory unit was compared with that in the draft map. Then, different measurement techniques were applied in order to collect the ground data, with respect of area size, number of trees and vertical structure in the inventory units. Creating a forest inventory is the hardest stage in the development of a management plan, requiring the most time, effort and money. In forests covering large areas, the method of sampling determines various features for the aim of inventory. In the forest inventory where information gathering works are largely based on sample points, one of the most important problems is to find the points in the terrain. This process can be performed with supporting devices such as compass, rope and aerial photos, but difficulties still arise from terrain conditions, tools used, and subjective evaluations, and various errors can occur. Determining the sample points in the terrain is made more difficult in dense vegetation cover and steep slopes. Vegetation cover in the lower layer and other mechanical barriers can hinder walking, especially moving with rope in a fixed direction. While data was obtained by carrying out inventory in whole measurement in small units, such as clusters and groups in city groves, sampling was used for the largest units of “stands”, and GPS was used to find the sample points specified on the map in the terrain. Use of GPS has become widespread in many sectors due to its advantages in accuracy, speed, multi-purpose use and efficacy. GPS has been largely used to find “single trees” within the stands. In forest inventory measurements, it is generally sufficient to determine the location with around ±5-10 m error and this accuracy level under forest cover can be reached with the standard handheld GPSs. However, for evaluating the usage potential in the cases that required more accurate point location information, it was necessary to perform measurements with the Real Time Kinematic method using relative positioning techniques. At least two GPS receivers that perform real time measures are needed in order to obtain location information with relative positioning techniques. One of them enables accurate measurements by providing correction signals to the mobile receiver thanks to its stable position. GPS technology is constantly improving and as a result its use is increasingly more widespread. Three-dimensional accurate coordinates (X,Y,Z) are acquired thanks to Global Navigation Satellite Systems (GNSS), Real Time Kinematic (RTK) correction techniques, the Continuously Operating Reference Station (CORS), mobile internet, telecommunications and the development of GNSS user equipments, all combined under an umbrella network. In our

International Journal of Arts and Sciences 3(9): 227-239 (2010)
CD-ROM. ISSN: 1944-6934 © InternationalJournal.org
country, by establishing The CORS network model in 145 points, instant point location information in cm accuracy can be found and with post processing it is possible to obtain accuracies in the mm range (Yıldırım et al 2007; Eren and Uzel 2009). Symbolization of the Unit Types and Completing the Spatial Vegetation Map After the necessary arrangements were done based on observations drawn from the draft maps, the symbolization of unit types began. In the symbolization, tree types are written at the head, the developmental stage is written to the middle and crown closure class is written at the end (Figure 4). This information had been processed on the polygon’s database representing the unit types on the digital maps. The final maps were obtained by completing the preparation process of spatial vegetation map after symbolization of the unit types and the necessary corrections (Figure 5).
Figure 4: Symbolization of Inventory Units
Figure 5: Final spatial vegetation map

International Journal of Arts and Sciences 3(9): 227-239 (2010)
CD-ROM. ISSN: 1944-6934 © InternationalJournal.org
Determination of Spatial Forest Functions The base in determining spatial forest functions is Digital Terrain Models (DTM). The DTMs were obtained by using 1/5000 scale topographic map. Height values were entered by digitizing the contour level in the topographic map defined in the coordination system, in every 5 m. The terrain model was then obtained by using the relevant module of the computer program from vector values (Figure 6-a). In every urban forest included in the project, a thorough examining of the forest in respect to department and stand boundaries with the help of an overlaid digital terrain model helped determine the functions existed (Figure 6-b,c). The boundaries on the map where the related function is prominent were redrawn on a new map with respect to natural lines and boundaries of plant communities, with the help of some technical and scientific indicators that changed in accordance with function features. It was determined by social demands and by these technical indicators whether the related function was unique to the urban forest or was just a quality of a forest in general.
Figure 6: The overlaid digital terrain model (a,b) and digital terrain model of Hacıosman urban forest Soil Protection and Erosion Control Function Intense land transport is not seen in the grove areas because of dense vegetation, so the erosion risk of the examined areas was studied to determine the soil protection and erosion control function of the forest, but actual erosion was not observed (Figure 7).

International Journal of Arts and Sciences 3(9): 227-239 (2010)
CD-ROM. ISSN: 1944-6934 © InternationalJournal.org
Figure 7: Slope Groups (yellow: < %30, blue: >%31 and <%60, red: >%61 and more)
The sites where the slope of the terrain exceeds 30% were identified as areas where erosion and soil protection functions overweigh. For that purpose, these slope groups have been created on DTMs of the planning unit.
Table 1: Change of erosion risk according to slope group Slope Groups (%) Risk Group Explanation
0,00-30,00 III Weak Erosion 31,00-60,00 II Medium Erosion
>61,00 I Intense Erosion The areas in I. Group; are the areas having high sensitivity of erosion. In these areas, the erosion risk is very high. The areas in II. Group; are the areas having medium sensitivity of erosion. The areas in III. Group; are the areas not having any risk of erosion.
Water Conservation and Hydrological Function
Small basins within the forests, containing pools and ponds, were separated for Water Conservation and Hydrological Function. The small basins regulating the water economy of these facilities were considered as miniature water basins. In the Validebağ urban forest, the areas with hydrological function are shown in Figure 8.

International Journal of Arts and Sciences 3(9): 227-239 (2010)
CD-ROM. ISSN: 1944-6934 © InternationalJournal.org
Figure 8: The areas functioning as water conservation in Validebağ urban forest Determination of the Areas Having Aesthetic Function The areas to be functioned are discussed in four categories: Determination of the Areas Having Silhouette Effect Areas with a silhouette effect were determined by looking at the top and back of the groves using the 3D digital terrain model overlaid spatial vegetation map from different points of the Bosporus and main roads. Then, based on 30 m wide lane, it was defined how tree and shrub communities on the lane changed in regard to diameter and height distribution. The parts where there were large diameter (30 cm and larger) and tall (12 m and over) trees on the lanes, were determined as first silhouette effect areas and the parts where there were young trees or shrubs were separated as second silhouette effect areas (Figure 9).
Figure 9: The view of the areas open to the silhouette effect in Çubuklu-Hıdiv urban forest
from different point of views. Determination of the Areas Having Mosaic Effect By examining the topographical map overlaid onto the digital terrain model, the backs and slopes of each urban forest within the field of view from the Bosporus and the main arteries were determined. Then, by transferring the spatial vegetation map in the digital terrain model, tree species and mixing ratios of shrub groups in these viewing areas were determined. The sites where there were mixed plant associations in respect to tree species (leaf/needle), form of mix (single trees, clumps, groups) were classified as a first mosaic effect, and the sites consisting of the broadleaved or needle leaved plant communities were classified as a second mosaic effect (Figure 10).

International Journal of Arts and Sciences 3(9): 227-239 (2010)
CD-ROM. ISSN: 1944-6934 © InternationalJournal.org
Figure10: Mosaic effect classes in Emirgan urban forest (the area shaded red is back view)
Conclusion and Recommendations A part of work on concerning inventory stage of forest management planning for the urban forests of Istanbul municipality was introduced in this study. After giving brief information about urban groves of Istanbul and functions of urban forest and urban trees, the study area and the procedure followed in the study was outlined. Definition of inventory units, ground controls, sampling design and measurements, preparation of spatial vegetation maps, presentation of some functions map outputs of the study were shown on this paper. With this work an example was shown how GPS, GIS and remote sensing data can help the urban groves’ manager and provide sound and reliable information. These data can also easily updated and exchange with the other managerial departments. Recent decade forestry professionals are forced to find reliable inventory and planning models for urban forest and urban trees in Istanbul based on sound scientific principles. With this example it has been encountered the inventory and planning model need to some extend. Acknowledgement This work was supported by Scientific Research Projects Coordination Unit of Istanbul University. Project number: UDP-5961/26022010. References Andreu, M.G.,Melissa, H. F., and Rob J. N., 2009; The structure and composition of Tampa’s
Urban Forest, University of Florida IFAS Extension FOR 9. Asan, Ö., Ve Özdemir, İ., 2005. Kent Korularında Envanter, İ.Ü. Orman Fakültesi dergisi,
Seri:B, Sayı:1, s. 15-30. Aygen, D. 2002. Orman Yasası ve İlgili Mevzuat, ISBN-975-6749-3198 Adil Yayınevi,
Ankara. Corona, P., Köhl, M., Marchetti, M., 2003, Advances in forest inventory for sustainable forest
management and biodiversity monitoring, Kluwert Academic Publishers, Dordrecht, Netherlands.
Elvan,O.D Ve Velioğlu, N., 2004. Kent Orman Yönetiminin Esasları. I. Ulusal Kent Ormancılığı Kongresi, 9-11 Nisan, Ankara.
Grey G.W., F. J.Deneke. 1986.Urban Forestry. John Wiley & Sons, 299 p

International Journal of Arts and Sciences 3(9): 227-239 (2010)
CD-ROM. ISSN: 1944-6934 © InternationalJournal.org
Holmgren, P. And Thuresson, T., 1998: Satellite Remote Sensing for Forestry Planning-A
Review, Scandinavian Journal of Forest Research, 13(1), s. 90-110. Holopainen, M. And Kalliovirta, J., 2006, Modern Data Acquisition for Forest Inventories,
Forest Inventory – Methodology and Applications, Springer, Netherlands, 1-4020-4379-1, s.343-362
Hung, M. C., 2002, Urban Land Cover Analysis From Satellite Images, Pecora 15, Land Satellite Information IV/ISPRS Commission I/FIEOS 2002 Conference Proceedings.
Konijnendijk, C.C.2003, A decade of urban forestry in Europe, Forest Policy and Economics 5 (2003) 173–186 7
McGarigal,K & Marks, B.J.(1995) FRAGSTATS:spatial pattern analysis program for quantifying landscape structure. US Department of Agriculture, Forest Service, Pasific Northwest Research Station, Portland, OR.
Millenium Ecosystem Assesment(2005) Ecosystem and human well-being: biodiversity synthesis. World Resources Institute, Washington DC.
Miller RW(1997), Urban Forestry: Planning and Managing urban gren spaces, 2nd ed.Prentice Hall, New Jersey.
Pekkarinen, A. 2002. A method for the segmentation of very high spatial resolution images of forested landscapes. International Journal of Remote Sensing 23 (14) :2817-2836.
Pekkarinen, A. 2004. Image segmentation in multi-source forest inventory, Finnish Forest Research Institute, Vantana Research Centre, Finland, Research Papers 926, 952-10-2003-2.
Pitkanen, J. 2001. Individual tree detection in digital aerial images by combining locally adaptive binarization and local maxima methods. Canadian Journal of Forest Research, 31:832-844.
Raundrup, T.B., Konijnendijk, C., Dobbertin, M.K., Prüller, R., 2005; The Concept of Urban Forestry in Europe, Urban Forests and Trees
Serin, N., Gül, A., 2006. Kent Ormancılığı Kavramı ve Isparta Kent İçi Ölçeğinde İrdelenmesi, S.D.Ü. Orman Fakültesi Dergisi, Seri:A, Sayı:2, Yıl: 2006, ISSN: 1302-7085, s. 97-115
Szantoi, Z., Escobedo, F., Dobbs, C., Smith, S., 2008, Rapid Methods for Estimating and Monitoring Tree Cover Change in Florida Urban Forests: The Role of Hurricanes and Urbanization, In Proceedings of the 6th Southern Forestry and Natural resources GIS Conference, 93-104.
Tuominen, S. And Poso, S. 2001. Improving multi-source forest inventory by weighting auxiliary data sources. Silva Fennica, 35:203-214.
Uzel, T. And Eren, K., 2009. CORS TR (TUSAGA Aktif) Projesi. [mmf.iku.edu.tr/file/6572DW4F.pdf]
Ventura, S., G. Barry. 1997. How to Create a Forest / Tree Geographic Information System. 19 p
Yeşil, A.; Asan, Ü.; Özkan, U.Y.; Özdemir, İ., İstanbul Korularında İki Aşamalı Envanter Uygulamaları, Orman Amenajmanı’nda Kavramsal Açılımlar ve Yeni Hedefler Sempozyumu, 18-19 Nisan 2002, s.158-163, İstanbul, 2002.
Yildirim, Ö, Bakici, S., Cingöz, A., Erkan, Y., Gülal, E., Dindar, A.A., 2007. Tusaga-Aktif (Cors Tr) Projesi ve Ülkemize Katkıları. TMMOB Harita ve Kadastro Mühendisleri Odası. Ulusal Coğrafi Bilgi Sistemleri Kongresi. 30 Ekim –02 Kasım 2007, KTÜ, Trabzon.