gh aga ashanti 1999
DESCRIPTION
GH_AGA_Ashanti_1999 ASHANTI GOLDFIELDS CL Annual Report 1999TRANSCRIPT
Annual Report 1999
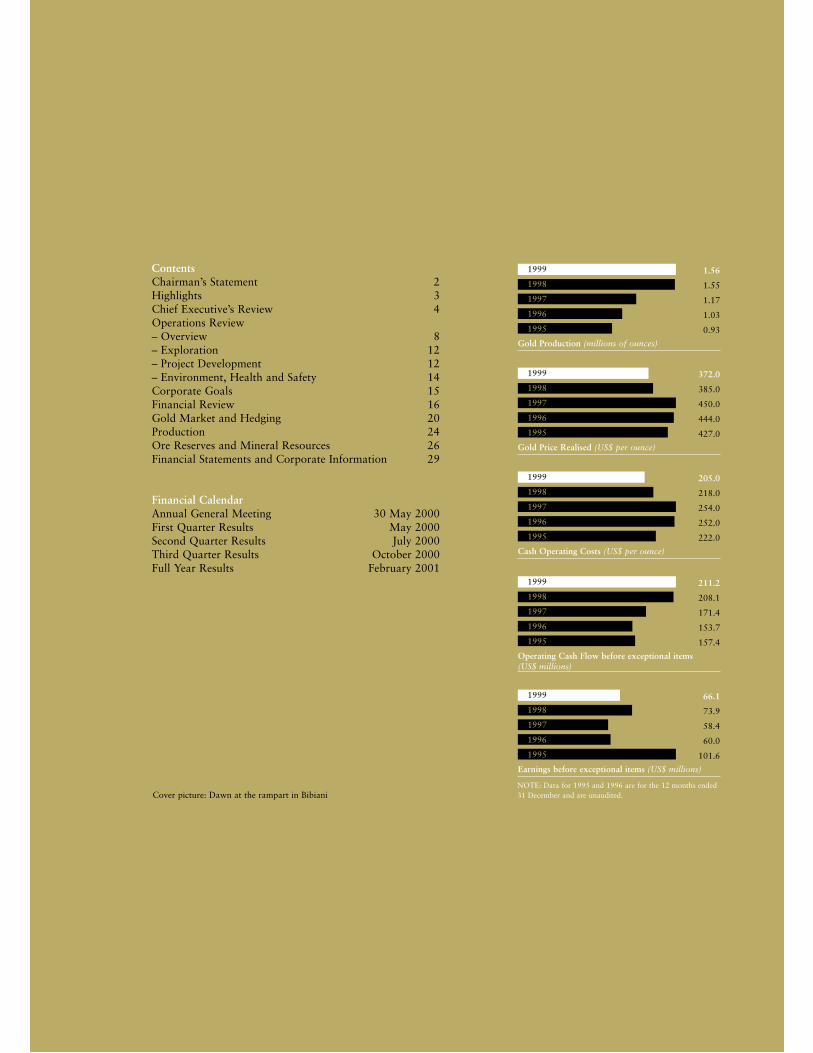
1.56
1.55
1.17
1.03
0.93
Gold Production (millions of ounces)
1999
1998
1997
1996
1995
372.0
385.0
450.0
444.0
427.0
Gold Price Realised (US$ per ounce)
1999
1998
1997
1996
1995
205.0
218.0
254.0
252.0
222.0
Cash Operating Costs (US$ per ounce)
1999
1998
1997
1996
1995
211.2
208.1
171.4
153.7
157.4
Operating Cash Flow before exceptional items(US$ millions)
1999
1998
1997
1996
1995
66.1
73.9
58.4
60.0
101.6
Earnings before exceptional items (US$ millions)
1999
1998
1997
1996
1995
ContentsChairman’s Statement 2Highlights 3Chief Executive’s Review 4Operations Review– Overview 8– Exploration 12– Project Development 12– Environment, Health and Safety 14Corporate Goals 15Financial Review 16Gold Market and Hedging 20Production 24Ore Reserves and Mineral Resources 26Financial Statements and Corporate Information 29
Financial CalendarAnnual General Meeting 30 May 2000First Quarter Results May 2000Second Quarter Results July 2000Third Quarter Results October 2000Full Year Results February 2001
NOTE: Data for 1995 and 1996 are for the 12 months ended31 December and are unaudited.Cover picture: Dawn at the rampart in Bibiani
Ashanti Goldfields Company Limited is an African-based international gold mining and exploration group with six producing mines in three Africancountries: Ghana, Guinea and Zimbabwe. A seventh mine will be commissioned in Tanzania in the year 2000.
The Group has 25 active exploration projects in six African countries and has 37 millionounces of measured and indicated gold resources. The largest of Ashanti’s operations, the 100-year-old Obuasi mine in Ghana, is among the top producing gold mines in the world and the largest in Africa outside South Africa. Ashanti Goldfields is listed on six internationalstock exchanges.
Ashanti’s VisionTo be the premier gold producing company in Africa.
Ashanti’s Objectives and StrategyAgainst a backdrop of last October’s hedge and liquidity crisis, the continuing consolidationoccurring within the industry and the Group’s commitment to continual improvement, Ashanti has outlined the following objectives and strategies:
Objective: Reduce debt levels
Strategy: Complete Geita project on schedule and gain access to project cash flows.
Complete the sale of 50 per cent of Geita and raise at least US$200 million in proceeds.
Objective: Maintain appropriate levels of hedge protection to ensure that the Group can meet its commitmentsas and when they fall due
Strategy: Restructure the hedge book with the assistance of new external and internal resources.
Objective: Retain and consolidate its position as a senior tier Gold producer for the long-term
Strategy: Maintain extreme cost and performance focus by setting and attaining critical measures in production, cost and profitability.
Secure operational and financial gains in a process of continually improving internal resources and systems and relationships with key stakeholders.
Objective: Deliver improved potential and shareholder value for the long term
Strategy: Maintain and increase ore reserves by focusing on exploration near existing operations.
Increase asset portfolio with focused exploration in strategic countries.
Objective: To maintain the best mining practices and highest safety standards
Strategy: Continue with the high degree of safety-consciousness established among staff with a view to achieving aNational Occupational Safety Award (NOSA) Five-Star rating across the Group.
Corporate Profile 1
Chairman’s Statement
In the Chairman’s statement last year, Richard K Peprah notedthat the Group’s steady progress to date had provided a strongfoundation for Ashanti’s transition into the new millennium.This was underlined in 1999 by the achievement of recordgold production of over 1.56 million ounces at a reduced cashoperating cost of US$205 per ounce.
The expansion of the Siguiri mine was successfully completedin the third quarter, increasing annual production to8 million tonnes. It is also very satisfying to report that thedevelopment of the Geita project in Tanzania, which wasexpanded as a result of the acquisition of SAMAX at the endof 1998, commenced in April 1999 and was 50 per centcomplete by the year end. Commissioning of the new mine,which is planned to produce approximately 500,000 ouncesper annum at a cash operating cost below US$180 per ouncefrom a resource base of 12 million ounces including inferred,is now expected to occur by the end of the second quarter of 2000.
Earnings and DividendEarnings before exceptional charges decreased by 11 per centto US$66.1 million (US$0.59 per share). However, afterexceptional charges of US$250.0 million, there was a net lossof US$183.9 million (US$1.64 per share). In the circumstances,the directors do not recommend paying a dividend for 1999(1998: US$0.10 per share).
Corporate DevelopmentsAs a result of the short-term rise in the price of gold inSeptember 1999, the Group was faced with a serious shortterm liquidity problem. This is dealt with in more detail inthe Financial Review on page 19.
Prior to this problem arising, preliminary merger discussionshad been underway with Lonmin Plc (Lonmin), theCompany’s largest single shareholder (32 per cent), whichwould have provided strong commercial, financial andstrategic logic for both companies. The discussions were,therefore, accelerated in order to provide a possible solutionto the liquidity crisis. Eventually, Lonmin’s proposal valuedAshanti shares at US$7 per share and included a US$100million unsecured line of credit to cover the Group’s workingcapital needs. However, Lonmin’s proposal was withdrawnbecause the conditions attaching to it could not be met.
Since the year-end, the Group has entered into agreements toovercome its financial difficulties and secure its future. Theseagreements provide a debt facility of US$100 million tocomplete the Geita project and for general working capitalpurposes, the renewal of the US$270 million RevolvingCredit Facility and an agreement with its hedgecounterparties to retain the benefits of hedge protection,
without the pressure of potential cash calls for a three-yearperiod subject to satisfaction of certain conditions. Our bankers, led by Barclays Capital, and the hedgecounterparties showed confidence in the Group by arrangingthe integrated package to finance the completion of the Geita Project and we thank them for their support.
On 5 April 2000, we announced the signing of a non-bindingHeads of Agreement for the sale to AngloGold Limited(AngloGold) of a 50 per cent joint venture interest in theGeita project, which will result in a cash injection of US$335million to Ashanti. Further details of the transaction arecontained in the Financial Review on page 19.
Board of DirectorsIt was with great regret that we announced in February thisyear the resignation of Richard Kwame Peprah as bothChairman and a director, due to the increasing burden of hisresponsibilities as Ghana’s Minister of Finance. Hisstewardship since 1982 guided the Company through itsmost difficult years in the 1980s and through its recoveryplan following the passing of the new mining law in 1986,which he was instrumental in implementing. In the 1990s heoversaw the development of the Company into a publiclyquoted, pan-African gold mining group and the Board hasplaced on record its sincere thanks for his exemplaryleadership and sterling support. We extend to him our verybest wishes for the future.
In the meantime, pending the appointment of a newChairman, the Board has asked me to assume the role ofacting Chairman until my forthcoming retirement at theAnnual General Meeting on 30 May 2000, by which time asuccessor should have been announced.
Also in February this year, as part of a plan to restructure theBoard, we appointed as additional non-executive directors,Mr A Ashiabor, Mr E N Awoonor, Dr C A Crocker,Dr K Duffuor and Dr M P Martineau, followed in March by the appointment of The Rt. Hon. The Baroness Chalker ofWallasey PC and Mr T Gibian. In April, we also appointedDr D R Creed as a non-executive director. We welcome themand the additional breadth of experience they bring to theBoard. With effect from the Annual General Meeting, Messrs. Ansah, Keatley, Ohene-Kena and Otoo and Sir William Ryrie and I will retire from the Board. We thankthem for their service and wish them well in the future. At thetime of reporting, we have yet to appoint a Finance Directorto fill the vacancy which will occur when Mr M B Keatleysteps down from his position on 30 May 2000.
In October 1999, Mr J C Gandur resigned as a non-executive director due to his other business interests.
2
“Ashanti has survived many set-backs during its 102-year history and welook forward to putting the recent financial difficulties behind us and restoringinvestor confidence in the future prosperity of the Group.”
AuditorsPannell Kerr Forster have indicated their intention to stepdown as one of the Company’s joint auditors at the close ofthe Annual General Meeting this year. Formerly known asPannell Fitzpatrick, their long standing association withAshanti dates from 1973 and I should like to express theCompany’s appreciation for their valuable professional service since then and to wish their former senior partner,Mr J Q Bampoe-Addo, a long and well earned retirement.
Deloitte & Touche will now assume the responsibility ofsole auditor.
FutureThe past turbulent six months have been exceptionallytraumatic, not only for management and employees but alsofor our shareholders, creditors and the communities in whichwe operate. We consider that these troubles are substantiallyresolved and we can now refocus our efforts on building onthe considerable strengths which Ashanti possesses in its largeand increasing gold resources and the new modern low-costprocessing facilities currently under development.
Ashanti has survived many set-backs during its 102-yearhistory and we look forward to putting the recent financialdifficulties behind us and restoring investor confidence in thefuture prosperity of the Group. Ashanti is fully mindful of thechallenges of modern mining in a global economy. However,the Group’s operating and management capabilities remainstrong and that is the basis upon which the future of theGroup ultimately rests.
Although 1999 was overshadowed by the Group’s financialcrisis, there were many accomplishments which would not havebeen achieved without the unflagging resolve and untiringefforts of the Group’s 11,000 employees throughout Africa.As we look forward to a new beginning in this millennium,my colleagues on the Board join me in thanking theemployees for their enormous contribution to the Group’ssuccessful operating performance during the year.
Philip M TarshChairman
Salient Features� Record Group Gold production of 1.56 million ounces
� Operating cash cost reduced to US$205 per ounce
� Geita’s resource including inferred increased to 12 millionounces
� Geita planned to produce 500,000 ounces per year at an operating cash cost below US$180 per ounce –Commissioning ahead of schedule
� Company enters into an agreement with counterparties tosecure its future
� US$100 million additional financing secured to build theexpanded Geita project
� Heads of Agreement signed for sale of 50 per cent ofGeita project
Highlights 1999 1998
Financial (US$)Turnover 582.1m 600.3mEarnings before exceptional items 66.1m 73.9mEarnings after exceptional items (183.9m) 40.7mOperating cash flow beforeexceptional items 211.2m 208.1mEarnings per share before exceptional items 0.59 0.68Earnings per share after exceptional items (1.64) 0.37Dividend per share – 0.10
Gold Production (ounces)Obuasi 743,111 885,342Bibiani 261,899 151,727Iduapriem 163,700 155,233Ayanfuri 44,424 46,290Siguiri 239,218 193,879Freda-Rebecca 109,184 108,280Total 1,561,536 1,540,751
Production Costs (US$ per ounce)Cash operating costs 205 218Royalties 8 8Depreciation and amortisation 72 68Total costs before exceptional items 285 294
Ore Reserves and Mineral Resources (million ounces)Proved and Probable Ore Reserves 22.6 23.0Measured and Indicated Mineral Resources 37.1 36.9
3
Philip M Tarsh Chairman
Chief Executive’s Review
Over the year, the Group produced a record 1,561,536ounces at an average cash operating cost of US$205 perounce. The excellent operational results were achieveddespite a 12-day illegal strike at Obuasi in the second quarterand flooding at Siguiri in the third quarter.
Our Freda-Rebecca and Bibiani mines attained South Africa’sNational Occupational Safety Award (NOSA) Four-Star ratings while Iduapriem was awarded a NOSA Three-Star.
In Tanzania, our geologists increased Geita’s resource basefrom 6.4 million ounces to 12 million ounces includinginferred, and the reserves increased from 4.1 million to5.5 million ounces.
On the financial front, the Group faced a formidable challengewhen the gold price rose dramatically late last Septemberthereby exposing the Group to possible margin calls on itsoutstanding hedge contracts.
Existing and new credit lines that were being negotiated werefrozen, triggering a working capital shortfall andjeopardising the completion of the Geita mine. After monthsof intense negotiations with the Group’s hedgingcounterparties and creditor banks, resultant agreementsenabled the Group to continue as a going concern. Thesolutions reached have given the Group three years ofmargin-free trading. In return, the Group issued equity warrants to its hedge banks and undertook to sell a 50 percent interest in Geita in order to lower the debt level andreposition the Group for the future.
OperationsFour of our six mines operated at record levels in 1999.These were Bibiani and Iduapriem in Ghana, Siguiri in Guineaand Freda-Rebecca in Zimbabwe. Iduapriem in particularposted excellent cost and production results, reducing costs by8 per cent and increasing production by 5 per cent.
The Obuasi mine contributed over 740,000 ounces to Groupproduction. Depletion of surface reserves warranted therationalisation of Obuasi’s operations, based on a revised lifeof mine plan to maximise the net present value of the orereserves and resources. Open pit mining will come to an endat the end of 2000. Tailings re-treatment will cease at the endof 2002 while the Oxide, Tailings and Pompora TreatmentPlants will cease operation. The Sulphide Treatment Plantwill be upgraded to a capacity of close to three milliontonnes per annum. Annual production of 2.5 million tonnesof ore will in future be produced from underground. Theproduction and cost target of Obuasi from 2001 onward will be around 550,000 ounces a year at an average cashoperating cost below US$200 per ounce.
The commissioning of the Siguiri expansion in the thirdquarter of 1999 increased processing capacity to athroughput of 8.0 million tonnes per annum from theprevious 4.0 million tonnes to increase annual production toapproximately 300,000 ounces per year.
The Geita mine project made excellent progress during theyear with construction 50 per cent complete by year-end.Commissioning is now expected by the end of the secondquarter, ahead of schedule and within budget. The mine isplanned to produce 500,000 ounces per year at an operating cash cost below US$180 per ounce.
4
The year ended as one in which the Group set records in production and safety and registered the lowest production cost per ounce in five years.
FinanceThe Group faced a major crisis late last September when thegold price rose US$86 in eleven trading days and turned themark-to-market valuation of the Group’s hedge book from apositive US$290 million at the end of the June quarter to anall-time low of negative US$570 million in early October 1999.The large negative valuation required the Group to postUS$270 million in cash as collateral which was not available.The crisis was exacerbated by a working capital shortfalloccasioned by the strike at Obuasi, the redundancyprogramme, and the exceptional weather conditions thataffected production at the Siguiri mine in Guinea.
The crisis was partially resolved by an issue of equity warrants over 15 per cent of the Company’s shares to itshedge counterparties in exchange for three years of margin-free trading and two subsequent years during which themargin limits will be higher than they are currently.
Ashanti also undertook to sell a 50 per cent interest in theGeita mine, as part of a long-term restructuring that wouldreduce its debt. On 5 April 2000, we were able to announcethe signing of a non-binding Heads of Agreement for the saleof this interest to AngloGold, which we hope to complete by 30 September 2000.
In response to the financial challenges of 1999, the Grouphas implemented changes to strengthen its financialmanagement and systems.
5
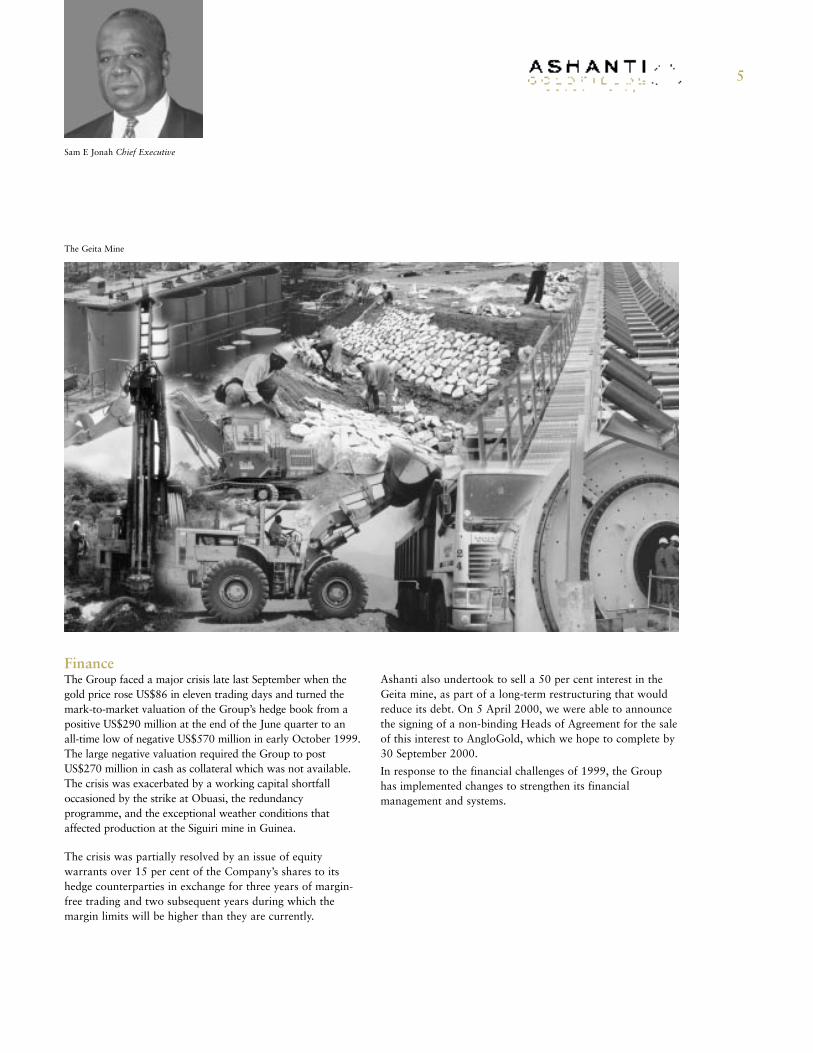
Sam E Jonah Chief Executive
The Geita Mine
Chief Executive’s Review
HedgingWe have initiated a programme of restructuring the hedgebook, the objectives being:
� The reduction of levels of commitments;� The reduction of lease rate exposure;� Maintaining prudent levels of protection;� Ensuring that available margin limits, beyond our three
year margin free trading period, will be sufficient toensure that the Group is not once again exposed tomargin calls.
The above mentioned objectives, which will be part of anongoing process, are not achievable in the short term.However, considerable progress has already been madetowards these objectives.
The hedging policy is under ongoing review and a newManaging Director of International Treasury, Mark Arnesen,is working together with recently appointed external hedgingconsultants to review hedge book reporting and monitoringprocedures.
The FutureThe rationalised life-of-mine for Obuasi, which maximisesthe profitability of the mine, requires less capitalexpenditure, thereby giving it a higher net present value.With the same focus on greater profitability, the Groupcontinues to target efficiencies through lower costs at othermines. This new spirit is best captured at Iduapriem where,through dedication and hard work, the employees haveensured an extended life-of-mine to the middle of 2001.Management is also hoping to extend the mine’s life further through corporate acquisition.
The Geita mine will be very significant in Ashanti’s futureand is scheduled to be commissioned at the end of the secondquarter. Though the Group is selling half of the mine, stepswill be taken to ensure that it contributes effectively toGroup results. Current estimates envisage a productivecapacity that is almost twice previously planned levels. The choice of a partner was dictated by the consideration of factors that would help achieve the vision of the Group to be the premier gold producing company in Africa.
We have initiated plans to strengthen further the TreasuryGroup, and the departments of the Financial Controller,Internal Audit, Government and Public Affairs and InvestorRelations, all of which have been restructured to revitaliseinternal systems and communication links withall stakeholders.
6
This ullamcorper suscipit lobois nisl ut aliquip ex eacoe mftsemodo consequat lobois nisl ut aliquip ex eac Duis autem vel eum iriure dolorinhendrerit in vulputate velit esse molestie consequat, vel illum.
Last year’s crisis significantly taxed our managementresources. We are grateful to all those in the managementteam who devoted themselves tirelessly to this problem. Werecognise, however, that the task of rebuilding managementcredibility and shareholder value will be difficult, painstakingand long.
I shall continue to count on the perseverance and hard workof our employees and management team and the goodwilland support of you, our shareholders to re-establish realvalue for the Group.
In summary, Ashanti has recorded another strong operationalperformance despite the challenges it faced in 1999. We takepride in having consistently delivered on our operationaltargets during the last two years and look to the future with determination.
Sam E JonahChief Executive and Group Managing Director
7
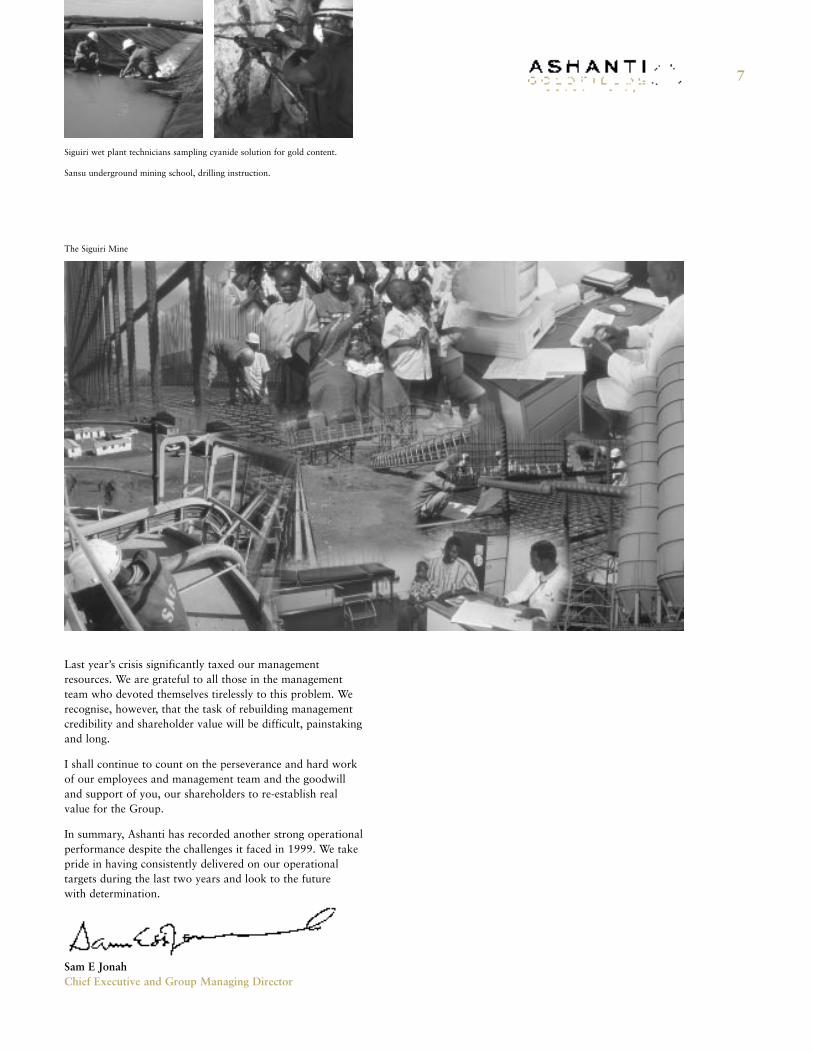
Siguiri wet plant technicians sampling cyanide solution for gold content.
Sansu underground mining school, drilling instruction.
The Siguiri Mine
Operations Review
OverviewGold production at 1,561,536 ounces was better than themid-year revised target and a record for the Ashanti Group.Cash operating costs at US$205 per ounce were well belowthe Group target of US$220 per ounce.
Construction on the Geita project started in April 1999 andmade excellent progress during the year. Outstandingexploration results continued to be achieved in theNyankanga deposit at Geita and resulted in an enlargementof the open pit with total reserves increasing to 5.5 millionounces. A potential underground operation based on aninferred resource of 10 million tonnes at 8.4 grammes pertonne was also identified. Commissioning of the Geita mineis now expected towards the end of the second quarter in2000, which, if achieved, will be approximately three monthsahead of schedule.
The new life of mine plan for Obuasi, based on a revisedreserve estimate for the underground of 43.4 million tonnesgrading 7.9 grammes per tonne, containing 11.0 millionounces of gold, was completed by year end. Details of therevised Obuasi resource and reserve estimates are providedon pages 26 and 27. The new plan has been adopted andwill result in a slimmed down operation with a focus on theunderground mine and an upgraded Sulphide TreatmentPlant (“STP”). The STP is ideally located to treat the bulktonnage from the central and southern sections of the mine.The new mine plan at Obuasi projects cash costs falling tobelow US$200 per ounce in 2001 and sustaining capitalexpenditures falling to around US$50 an ounce from 2003.
The Iduapriem mine turned in a strong performance withrecord gold production at costs substantially below target.As a result of the improved production and cost performancethe closure of the Iduapriem mine, previously planned for theend of 1999, has been deferred until mid 2001.
Bibiani and Freda-Rebecca also achieved record productionlevels of 261,899 ounces at US$162 per ounce and109,184 ounces at US$174 per ounce respectively.
Expansion of the low cost Siguiri mine in Guinea to athroughput rate of 8 million tonnes per year was successfullycompleted at the end of the third quarter.
The Group continued to perform at world class levels ofsafety with a lost time injury frequency rate of less than threeinjuries per million man hours worked. Bibiani and Freda-Rebecca were upgraded to NOSA Four-Star ratings whileIduapriem, at its first attempt, achieved a Three-Star rating.
ObuasiProduction and CostsThe mine produced 743,111 ounces of gold, 14,111 ouncesabove the target of 729,000 ounces which was reviseddownwards in the third quarter, following the strike in thesecond quarter and the decision to suspend high cost oxidemining and treatment operations. The strike resulted in aproduction loss of approximately 70,000 ounces. Operatingcosts continued to drop as a result of improved undergroundproductivity, rationalisation of operations and tight controlson materials consumption. Obuasi’s cash operating cost for1999 was US$222 per ounce compared to US$234 per ouncethe previous year.
Underground production increased to 2.3 million tonnes,5 per cent above the 1998 total of 2.2 million tonnes. Theoverall head grade for the year was 7.86 grammes per tonnecompared to the target of 7.96 grammes per tonne. Over thenext five years the mined head grade is forecast to averageclose to 8 grammes per tonne.
8
Ashanti posted a record operating performance in 1999 despitesignificant operational setbacks.
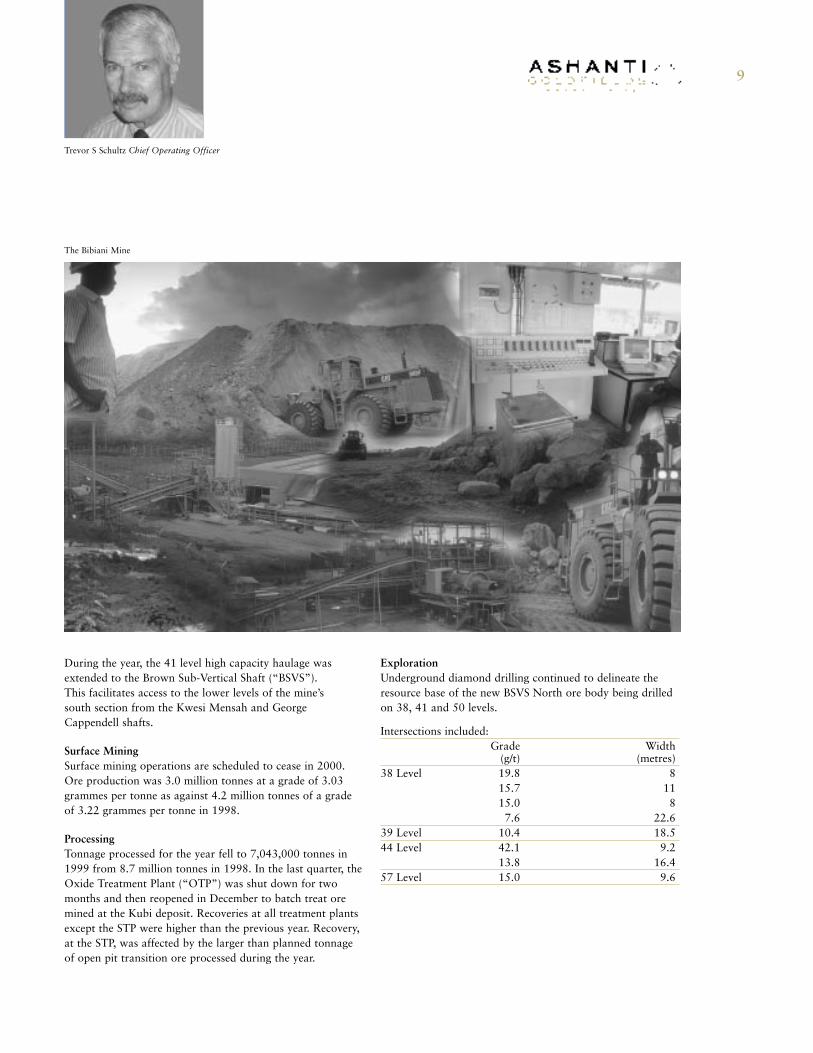
During the year, the 41 level high capacity haulage wasextended to the Brown Sub-Vertical Shaft (“BSVS”). This facilitates access to the lower levels of the mine’s south section from the Kwesi Mensah and GeorgeCappendell shafts.
Surface MiningSurface mining operations are scheduled to cease in 2000.Ore production was 3.0 million tonnes at a grade of 3.03grammes per tonne as against 4.2 million tonnes of a gradeof 3.22 grammes per tonne in 1998.
ProcessingTonnage processed for the year fell to 7,043,000 tonnes in1999 from 8.7 million tonnes in 1998. In the last quarter, theOxide Treatment Plant (“OTP”) was shut down for twomonths and then reopened in December to batch treat oremined at the Kubi deposit. Recoveries at all treatment plantsexcept the STP were higher than the previous year. Recovery,at the STP, was affected by the larger than planned tonnageof open pit transition ore processed during the year.
ExplorationUnderground diamond drilling continued to delineate theresource base of the new BSVS North ore body being drilledon 38, 41 and 50 levels.
Intersections included:Grade Width
(g/t) (metres)38 Level 19.8 8
15.7 1115.0 87.6 22.6
39 Level 10.4 18.544 Level 42.1 9.2
13.8 16.457 Level 15.0 9.6
9
Trevor S Schultz Chief Operating Officer
The Bibiani Mine
Operations Review
AyanfuriAyanfuri gold production reduced to 44,424 ounces in 1999from 46,290 ounces in 1998 as the mining operation movedto lower grade deposits. Metallurgical recovery from theleach pads improved to 85 per cent compared to 70 per centthe previous year and consequently the decrease in goldproduction was kept at only 4 per cent. Cash operating costfor the year fell to US$202 per ounce from US$210 in 1998.
The life of the Ayanfuri mine has been extended to September2000. The search is ongoing to identify mineralised zoneswithin economic trucking distance of the processing plant.
Iduapriem (80%)The mine produced a record 163,700 ounces of gold. Its cashoperating costs reduced to US$248 per ounce from US$266per ounce although the mined grades were lower than theprevious year. The major reasons for this improvedperformance were increased plant throughputs and sustainedcost control efforts from the employees and managementteam. Mineral resources in Blocks 4 and 5 were positivelyre-evaluated during the year as future sources of productionand the mine closure planned for the end of 1999 has beendeferred until mid 2001.
Negotiations to acquire additional resources on the Tarkwagold belt have made good progress.
BibianiBibiani produced 261,899 ounces of gold at a cash operatingcost of US$162 per ounce during the year under reviewcompared to 151,727 ounces at a cash operating cost ofUS$180 per ounce in 1998.
Milled throughput for the year was 2.48 million tonnes at ahead grade of 3.82 grammes per tonne. As was the case in1998, the reconciliation between the resource model and theactual mined grade and tonnage showed a positive varianceand the operation continues to outperform the feasibilitystudy and mine plan. An evaluation of underground miningto exploit extensions of open pit resources at depth wasencouraging and the evaluation will continue in 2000.
Business initiatives to acquire prospective ground withineconomic haulage distance of the processing plant to extendmine life beyond 2004 are also being progressed.
The Bibiani mine was upgraded, from a Three-Star NOSArating, awarded in 1998, to Four-Star, in 1999. The injuryfrequency rate was reduced to 2.74 injuries from 5.74injuries per million man hours worked in 1998.
Siguiri – Guinea (85%)239,218 ounces of gold were produced at a cash operatingcost of US$185 per ounce for the year. Both production andcash costs were heavily impacted by exceptionally heavyrains in the third quarter. The result was a loss ofapproximately 15,000 ounces in production and increasedcash costs.
The Siguiri mine expansion, commissioned in the third quarterof the year, has doubled planned throughput from anannualised rate of 4.0 million tonnes to 8.0 million tonnes.With the expansion commissioned and operating efficiently,the production in 2000 is expected to be approximately300,000 ounces.
Exploration results were encouraging and the reservesdepleted during the year were replaced by new material.
10
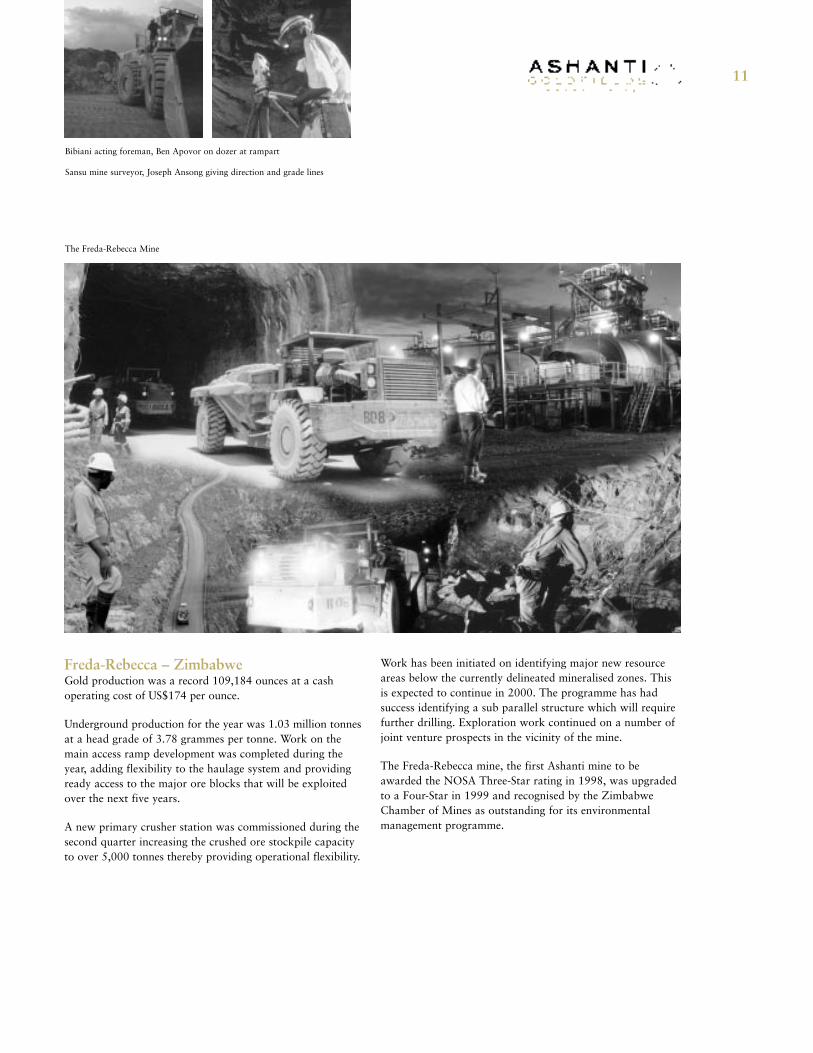
Freda-Rebecca – ZimbabweGold production was a record 109,184 ounces at a cashoperating cost of US$174 per ounce.
Underground production for the year was 1.03 million tonnesat a head grade of 3.78 grammes per tonne. Work on themain access ramp development was completed during theyear, adding flexibility to the haulage system and providingready access to the major ore blocks that will be exploitedover the next five years.
A new primary crusher station was commissioned during thesecond quarter increasing the crushed ore stockpile capacityto over 5,000 tonnes thereby providing operational flexibility.
Work has been initiated on identifying major new resourceareas below the currently delineated mineralised zones. Thisis expected to continue in 2000. The programme has hadsuccess identifying a sub parallel structure which will requirefurther drilling. Exploration work continued on a number ofjoint venture prospects in the vicinity of the mine.
The Freda-Rebecca mine, the first Ashanti mine to beawarded the NOSA Three-Star rating in 1998, was upgradedto a Four-Star in 1999 and recognised by the ZimbabweChamber of Mines as outstanding for its environmentalmanagement programme.
11
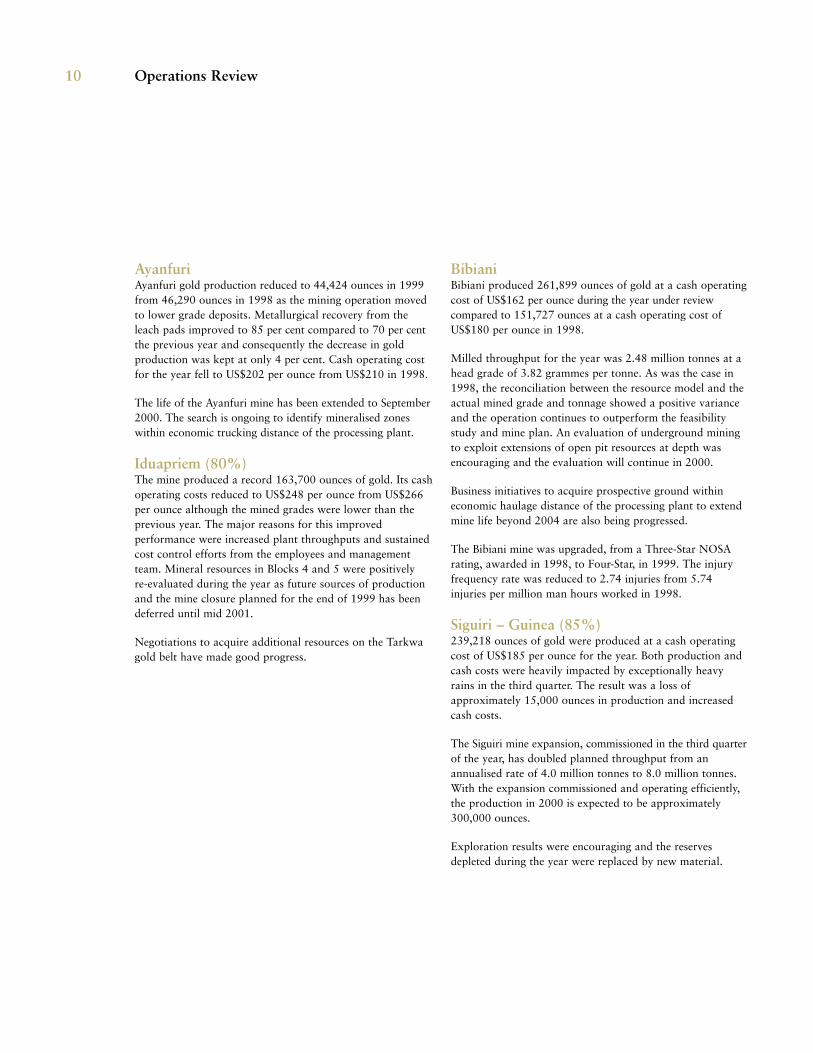
Bibiani acting foreman, Ben Apovor on dozer at rampart
Sansu mine surveyor, Joseph Ansong giving direction and grade lines
The Freda-Rebecca Mine
Operations Review
ExplorationDuring the year Ashanti Exploration focused on the mainproducing gold belts of West, East and Southern Africa andespecially around the Group’s existing operations anddevelopments.
Nyankanga at Geita is one of the most significant newdiscoveries found in Africa over the last five years. Itcontributed significantly to increasing the total resourcesincluding inferred at Geita to 12.0 million ounces.
Over the last three years, Ashanti Exploration has outlinedresources of 9.5 million equity ounces at a discovery cost ofless than US$5.0 per ounce, one of the lowest in the industry.
East AfricaIn Tanzania, apart from ongoing work at Geita, explorationcontinued on the Bulyanhulu South and Rubondo projects(Pangea Joint Venture) with a limited reverse circulationdrilling programme being completed at Kakindu.
In November, Ashanti reached a joint venture agreementwith Spinifex on a number of properties including Buckreef.
West AfricaReverse circulation and core drilling on a number ofprospects in the Youga project (Ashanti – Echo Bay JointVenture) in Burkina Faso outlined resources of 1.2 millionounces including inferred. This drilling was undertaken aspart of the full feasibility study.
At Siguiri, exploration on the Eureka Hill deposit increasedthe resource including inferred, during the year to 9.0 milliontonnes at a grade of 1.59 grammes per tonne (0.5 millionounces). In addition, a new deposit, Tubani, was foundimmediately to the south of Sanu Tinti. Further drilling willbe undertaken to fully define this new deposit. At year-end,reserves remained unchanged from 1998.
Several early and late stage projects in south-west Ghanawere evaluated during 1999 with the focus being on projectsin the vicinity of Ashanti’s existing operations. We reachedan agreement with Birim on their Mampon deposit, whichcan be processed at Ayanfuri and Obuasi. A small resourcewas also outlined on Semafo’s Anwia deposit where Ashantiis earning a majority interest.
Southern AfricaExploration focused around the Freda-Rebecca mine. Anumber of geochemical and geophysical targets in geologicalsettings similar to Freda-Rebecca were drilled on thesurrounding Mazowe exclusive prospecting order (Kinrossjoint venture). Groundwork also commenced on the RANmine claims, immediately east of Bindura.
Central AfricaIn the north-eastern area of the Democratic Republic ofCongo (DRC), Ashanti now has an 86.22 per cent interest inKilo-Moto International S.Z.A.R.L. (“Kimin”), a miningcompany which holds exploration and mining rights over apotentially rich gold belt. Development of the project iscurrently on hold due to continued unrest in the area.
Project DevelopmentConstruction on the Geita project was approximately50 per cent complete by the year end. Commissioning isexpected at the end of the second quarter of 2000.
Leach tanks were completed at the end of the year, as weremajor foundations, permanent accommodation, airstrip andaccess roads to Bulyanhulu and Nungwe Bay. Extensive workon the power plant, tailings dam, mine development, processplant and water pipeline has also been completed.
The capital cost estimate for the project currently stands at US$165 million. By the end of 1999 the total amountcommitted was US$130 million, of which US$80 million had been spent.
At the end of the year the Geita resource and reserve stood at 12.0 million ounces, including inferred, and 5.5 millionounces respectively compared to 6.4 million and 4.1 millionounces respectively at the end of 1998.
Exploration has defined several additional targets and thepotential for further increases as extensions to Nyankangaand in new areas is considered excellent.
The mine is planned to produce 500,000 ounces a year at acash cost below US$180 ounce from 2001, the first full yearof production.
12
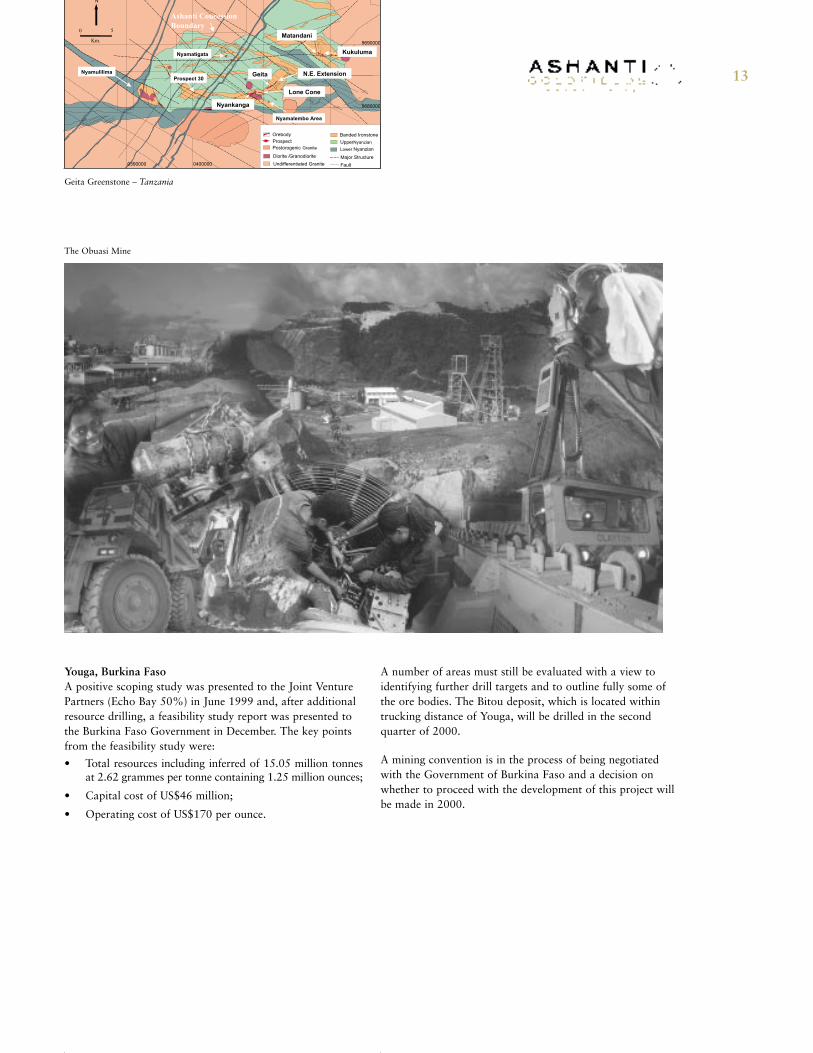
1999 was an excellent year for Ashanti Exploration. We tripled theNyankanga total resource at Geita from 2.3 to 7.4 million ounces.
13
Youga, Burkina FasoA positive scoping study was presented to the Joint VenturePartners (Echo Bay 50%) in June 1999 and, after additionalresource drilling, a feasibility study report was presented tothe Burkina Faso Government in December. The key pointsfrom the feasibility study were:
• Total resources including inferred of 15.05 million tonnesat 2.62 grammes per tonne containing 1.25 million ounces;
• Capital cost of US$46 million;
• Operating cost of US$170 per ounce.
A number of areas must still be evaluated with a view toidentifying further drill targets and to outline fully some ofthe ore bodies. The Bitou deposit, which is located withintrucking distance of Youga, will be drilled in the secondquarter of 2000.
A mining convention is in the process of being negotiatedwith the Government of Burkina Faso and a decision onwhether to proceed with the development of this project willbe made in 2000.
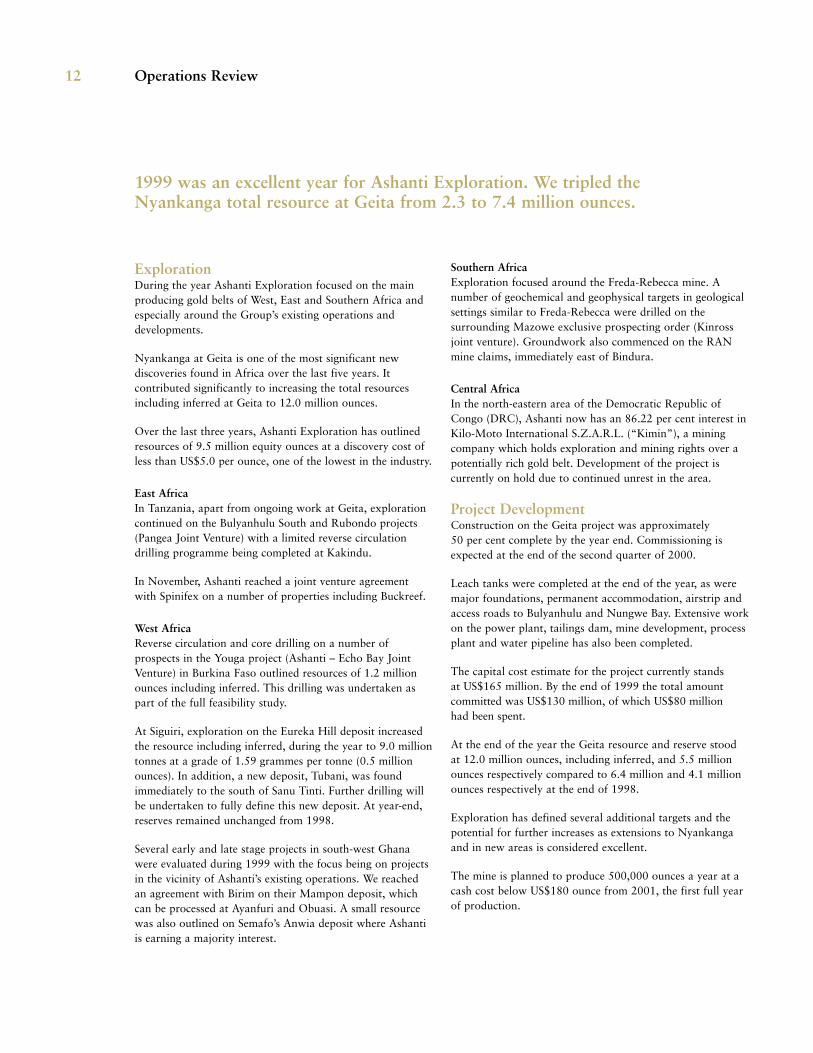
The Obuasi Mine
Geita Greenstone – Tanzania
Operations Review
EnvironmentEnvironmental audits were undertaken at all mines and therewere no significant out-of-compliance reports relating to theenvironment within the Group.
The Environmental Impact Statement for Geita wascompleted and a report presented to the Tanzanianauthorities.
Preparation of the Ayanfuri mine closure plans continuedand the major components of the rehabilitation programmewere prioritised, allocated, costed and scheduled. A plan wasalso prepared to monitor progress and develop qualitycontrol procedures over the work carried out on the mineclosure/rehabilitation programmes.
Test work that was undertaken to determine the treatmentrequirements for arsenic tainted water pumped from the oldworkings at Bibiani achieved the desired result. The nextphase of the investigation will focus on the disposal optionsfor arsenic and the process design parameters for the reactor.
Ashanti participated in the drafting and submission ofproposed guidelines for mining in forest reserve areas inGhana to the relevant government authorities for review.
A team of consultants from SGS visited all operations andprepared a report on the technical aspects and costs of mineclosure requirements for each operation.
In 1999 Freda-Rebecca mine was runner up in the NaturalResources Board/Chamber of Mines national minesenvironmental competition in Zimbabwe.
Health and SafetyThe Group continued to pursue international best practice inhealth and safety standards and as a result furtherimprovements on the already low lost time injury rate wereachieved in 1999. Group lost time injury rate for 1999 was2.62 per million man hours compared with 3.03 per millionman hours in 1998. At Obuasi the lost time injury rate was2.54 injuries per million man hours compared to 3.39 in1998, which is a world class performance for anunderground mine with a large labour force.
High-level executive support, regular workshops, rigoroustraining in safety practices and regular safety audits andawards throughout the Group’s operations were the keyfactors contributing to the improved safety performance. The Freda-Rebecca and Bibiani mines were awarded theNOSA Four-Star safety rating during the year whilstIduapriem was awarded a Three-Star rating.
The Bibiani mine was awarded the Chief Executive’s awardfor the best safety performance in 1999.
14
Environmental work on all operating units proceeded according to plan with rehabilitation of dumps, monitoring of air, water and noise pollution levels and implementation of services for local communities.
Corporate Goals 15
2000 Operational and Financial Goals
The Company’s specific goals for 2000 are as follows:
� Produce 1.65 million ounces of gold at a cash operating cost of US$205 per ounce
� Achieve return on capital employed of nine per cent for the Group
� Achieve an injury frequency rate of less than five per year for the whole Group
� Improve and upgrade:Human Resource Management SystemsInformation SystemsSupply Chain Management Systemsand improve on Engineering Maintenance Costs
� Reduce the Group debt levels so as to reduce ongoing interest charges and financial risk
� Negotiate greater flexibility in Ashanti’s debt structure and banking covenants to permit the Group to respond to business development opportunities and to allow more flexibility in possible dividend payments
� Generate maximum levels of cash flow from the business to achieve satisfactory returns on the considerable investments that Ashanti has made in its mine developments
� Access other financial resources to sustain Ashanti’s growth
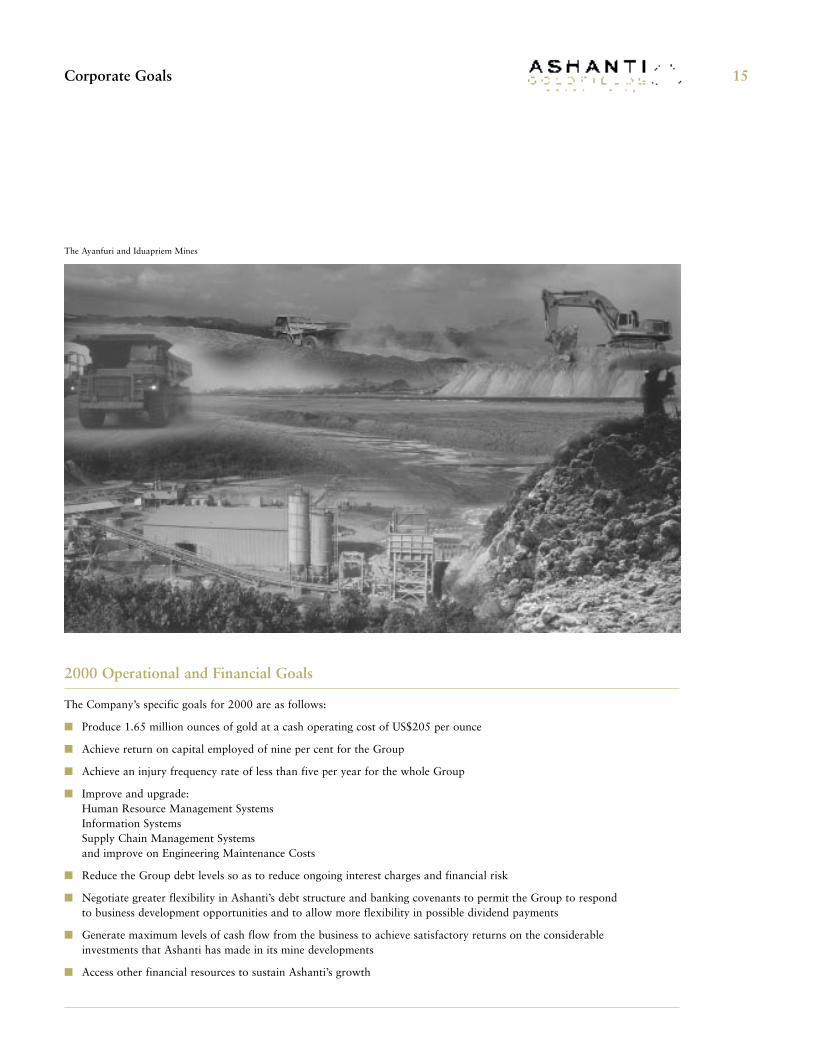
The Ayanfuri and Iduapriem Mines
Financial Review
Summary� Record Group gold production of 1,561,536 ounces� Group average cash operating costs per ounce, down
6 per cent to US$205 per ounce� Earnings before exceptional items, down 11 per cent to
US$66.1 million� Implementation of rationalisation programme at Obuasi
to further reduce operating costs. Cash flows willimprove but exceptional charges totalling US$240 millionhave been taken in respect of Obuasi
� Operating cash flow US$211.2 million, up fromUS$208.1 million in 1998
� New debt facility of US$100 million secured to completeGeita Project
RevenueRevenue from gold activities fell to US$581.1 million (1998:US$596.9 million) due to lower average realised gold priceof US$372 per ounce (1998: US$385 per ounce). This wasUS$93 per ounce over the average spot price. Revenueincluded US$77.7 million (US$50 per ounce) in cashproceeds from maturing hedging contracts, and US$65.3million (US$42 per ounce) in income from previously closed-out hedging contracts.
In accordance with Ashanti’s accounting policy, income fromearly close-outs is credited to revenue for the originallydesignated delivery period. At 31 December 1999, deferredhedging income earned forward totalled US$157 million(1998: US$231 million) of which US$42 million will becredited to revenue in 2000.
Cash Operating CostsCash operating costs for the Group for 1999 fell by 6 percent to US$205 per ounce. Cash costs for the fourth quarterwere US$183 per ounce. This is in line with Ashanti’sobjective of reducing Group cash operating costs to belowUS$200 per ounce on a sustainable basis.
ObuasiObuasi cash operating costs fell from US$234 per ounce in1998 to US$222 per ounce in 1999, a reduction of 5 percent. Cost cutting measures initiated two and half years ago,resulted in a fall in material costs of 12 per cent. This benefit
was reduced by the fall in production due to the unofficialstrike action in May. The implementation of therationalisation programme in September 1999 is expected toreduce Obuasi operating costs by US$7 million per annumequivalent to US$9 per ounce at current production levels.
Underground production of 490,013 ounces (1998: 503,570)was, at a cash operating cost of US$207 per ounce,unchanged from last year despite lower production, reflectingtight control of cost during the year.
Gold production from surface mining declined from 332,332ounces in 1998 to 209,797 ounces in 1999 at a cashoperating cost of US$277 per ounce (1998: US$289 perounce). Despite declining costs, on-going reassessments haveindicated that surface mining is uneconomic at current goldprices and will be phased out during 2000.
Retreatment of tailings contributed 43,301 ounces (1998:49,440 ounces) at a cash operating cost of US$144 per ounce(1998: US$141 per ounce).
AyanfuriProduction at Ayanfuri was 44,424 ounces, (1998: 46,290ounces). Cash operating costs fell 4 per cent to US$202 perounce (1998: US$210 per ounce) reflecting continued costcontrol measures and efficiency drives at Ayanfuri. The mineis expected to close by the end of 2000.
BibianiBibiani recorded an excellent year with gold production of261,899 ounces exceeding target (1998: 151,727 ounces).Cash operating costs fell by 10 per cent to US$162 perounce, the lowest in the Group, due to tighter cost controland increased production.
IduapriemIduapriem had another record year with gold production at163,700 ounces (1998: 155,233 ounces). Cash costsdeclined by 7 per cent to US$248 per ounce as a result ofincreased productivity. The planned closure of Iduapriemat the end of 1999 has been deferred as a result of arevaluation of mine reserves.
16
Siguiri (Guinea)Production at Siguiri for the year was 239,218 ounces at acash cost of US$185 per ounce (1998: 193,879 ounces atUS$162 per ounce). The Siguiri mine expansion wascommissioned in the third quarter of 1999, more thandoubling processing capacity. However, exceptionally heavyrains severely affected production in the third quarter resultingin a 14 per cent increase in annual cash operating costs.
Freda-Rebecca (Zimbabwe)Freda-Rebecca produced 109,184 ounces, marginally above1998 production of 108,280 ounces at a cash operating costof US$174 per ounce (1998: US$170). Improvedunderground infrastructure completed during the year willenable production levels to be maintained in the coming year.
ExplorationUS$12.4 million was written off against profit as the cost ofearly stage exploration compared to US$13.4 million in1998. The fall of 7 per cent reflects the rationalisation of theexploration portfolio, focusing on the main gold producingbelts around existing operations.
Corporate Administration CostCorporate costs for the year fell marginally to US$25.8 million(1998: US$26.5 million).
DepreciationDepreciation charges increased from US$108.6 million in1998 to US$114.9 million due principally to full year chargesat Bibiani and Siguiri.
Total CostsTotal operating costs before exceptional operating itemsat US$485.8 million were marginally down on last yearreflecting lower cash operating costs offset by higherdepreciation charges. Total cost of production was equivalentto US$285 per ounce (1998: US$294 per ounce).
Exceptional ItemsExceptional items have been identified separately in theprofit and loss account to show the impact of the exceptionalitems on the underlying results of the business. The charge in1999 totalled US$250.0 million (1998: US$33.2 million).
Exceptional items include a US$171.1 million write-down offixed assets at Obuasi resulting from the re-engineering ofthe mine to maximise future cash flows. This mainly arisesfrom the plan to close surface mining, and certain shafts atthe north end of the mine and to consolidate processingoperations around STP, leading to the closure of PTP. Afurther provision of US$30 million has been made for thecarrying value of assets compared to future cash flows basedon proved and probable reserves. In conjunction with this,provision has been made for redundancy costs of US$22.0million which relates to redundancies announced in thesecond quarter for 2,155 employees, payments in respect offormer employees and rationalisation in the last quarter of1999. Obsolete stocks of US$10.0 million have beenprovided and costs of US$7.4 million were incurred in thesecond quarter in relation to the strike at Obuasi.
Following the hedge crisis in 1999, Ashanti in conjunctionwith its financial advisors and lawyers sought severallong term solutions for the Group. The professional costswhich have been incurred totalled US$9.0 million and havebeen written off as exceptional costs.
Profit on Disposal of BusinessesDuring the year the Company realised a profit ofUS$0.2 million on the disposal of interests in non core activities,namely Jei River Farms Limited and Hotel Investments (Ghana)Limited. An interest in Saoura, an exploration project inNiger, was also disposed of at approximately book value.The Company also sold its 50 per cent interest in the GoldenPride mine in Tanzania which was carried as a current assetinvestment (see note 14 to the financial statements).
RoyaltiesRoyalties of US$12.2 million (1998: US$12.6 million) werepaid to the Governments of Ghana and Guinea at a rateequal to 3 per cent of revenue derived in both countries.
17
Summary of production and cash operating costs per ounce
Obuasi Obuasi Obuasi Obuasi Freda- Total/
Underground Surface Tailings Total Ayanfuri Iduapriem Bibiani Siguiri Rebecca Average
Year ended 31 Dec 1999
Production (ounces) 490,013 209,797 43,301 743,111 44,424 163,700 261,899 239,218 109,184 1,561,536
Cost per ounce (US$) 206 277 144 222 202 248 162 185 174 205
Year ended 31 Dec 1998
Production (ounces) 503,570 332,332 49,440 885,342 46,290 155,233 151,727 193,879 108,280 1,540,751*
Cost per ounce (US$) 207 289 144 234 210 266 180 162 170 218*
*excludes Asikam
Mark KeatleyChief Financial Officer
Financial Review
Taxation The tax charge for the year of US$2.7 million relates to taxcharges due in respect of prior years. No tax charge aroseout of gold operations in 1999 as the Group continues tobenefit from capital allowances arising out of its ongoinghigh level of investments in its operations.
Financing CostsTotal interest cost for the year was US$41.4 million (1998:US$37.9 million) due to additional interest on the US$270million Revolving Credit Facility which was fully drawn down.US$1.8 million has been capitalised in respect of interest costincurred during the development of the Geita mine.
Interest income of US$11.5 million (1998: US$14.7 million)includes a gain of US$5.3 million on the refinancing of theUS$15.8 million prepaid forward sale facility forFreda-Rebecca in Zimbabwe.
DividendNo dividend is proposed for 1999, given the Group’scommitment to strengthen its financial position and thecurrent banking covenants prohibit the payment of cashdividends until gross borrowings fall below US$300 million.Of the final dividend of US$10.9 million for 1998, US$7.5 million was paid in cash and US$3.4 million wasissued in shares to shareholders who elected to receive their dividends in scrip.
EarningsEarnings before exceptional items were US$66.1 million,down from US$73.9 million in 1998. The fall in earningswas principally due to a reduction in realised gold price fromUS$385 per ounce in 1998 to US$372 per ounce in 1999.Tighter control of operating costs and increased productivityoffset the effects of the US$13 per ounce drop in revenue.After exceptional charges of US$250.0 million the Groupmade a loss of US$183.9 million (1998: profit of US$40.7million). Earnings per share before exceptional items wereUS$0.59 per share (1998: US$0.68 per share).
Cash FlowOperating cash flow before operating exceptionals for 1999was US$211.2 million. Net cash inflow from operatingactivities was US$120.3 million, with the difference relatingmainly due to the release of deferred hedging income. Netinterest and dividend paid were US$28.8 million and US$7.5million respectively whilst US$189.0 million was invested indeveloping the Group’s operations, resulting in a net cashoutflow before financing of US$89.7 million.
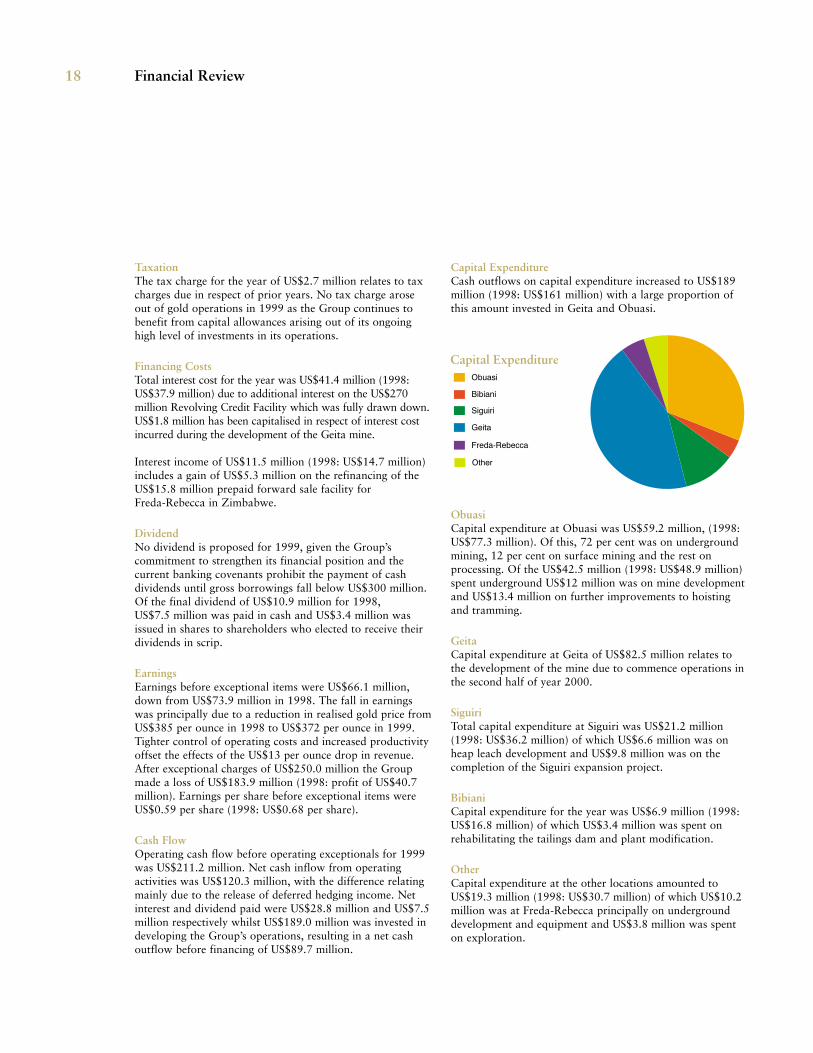
Capital ExpenditureCash outflows on capital expenditure increased to US$189million (1998: US$161 million) with a large proportion ofthis amount invested in Geita and Obuasi.
ObuasiCapital expenditure at Obuasi was US$59.2 million, (1998:US$77.3 million). Of this, 72 per cent was on undergroundmining, 12 per cent on surface mining and the rest onprocessing. Of the US$42.5 million (1998: US$48.9 million)spent underground US$12 million was on mine developmentand US$13.4 million on further improvements to hoistingand tramming.
GeitaCapital expenditure at Geita of US$82.5 million relates tothe development of the mine due to commence operations inthe second half of year 2000.
SiguiriTotal capital expenditure at Siguiri was US$21.2 million(1998: US$36.2 million) of which US$6.6 million was onheap leach development and US$9.8 million was on thecompletion of the Siguiri expansion project.
BibianiCapital expenditure for the year was US$6.9 million (1998:US$16.8 million) of which US$3.4 million was spent onrehabilitating the tailings dam and plant modification.
Other Capital expenditure at the other locations amounted toUS$19.3 million (1998: US$30.7 million) of which US$10.2million was at Freda-Rebecca principally on undergrounddevelopment and equipment and US$3.8 million was spenton exploration.
18
Capital Expenditure
Financial Review 19
FinancingsDuring 1999 Ashanti drew down fully the US$270 millionRevolving Credit Facility (“RCF”) signed in December 1998.US$203 million of the facility was used to repay existingfacilities and the balance of US$67 million was usedprimarily for the development of Geita.
In mid 1999 Ashanti was in discussions with a number ofbanks to secure further financing to complete theconstruction of the expanded Geita mine project in Tanzaniadue to the cash flow shortfall caused by the Obuasi strikeand poor weather conditions at Siguiri. With the problemscaused by margin calls on the hedge book, these discussionswere put on hold.
After late September 1999, when the gold price rose sharply,the Group was faced with margin calls from its hedgecounterparties, which the Group could not meet and thiscaused a short term liquidity crisis. Although agreement wasreached with the hedge counterparties exempting the Groupfrom the requirement to post margin on any of its contractsup to 2002, the Company continued to experience a liquiditycrisis due to the fact that it had not been able to secure theadditional financing it needed to put in place to developGeita, nor to close out hedge contracts early at a profit.
The Board of Ashanti reviewed several long-term solutions tothe crisis, and following discussions with the Government ofGhana and its banks, the solution which the Group feltwould be acceptable to all stakeholders was to secure a newUS$100 million debt facility to enable the completion ofGeita and to secure the sale of a 50 per cent joint ventureinterest in Geita in order to reduce debt levels.
In February 2000, Ashanti signed an agreement for a newUS$100 million loan facility arranged by Barclays Capitalwhich was syndicated amongst existing lenders under theRCF. The facility is repayable on the earlier of 30 September2000 and the date of the completion of a sale of assets toraise a net amount of at least US$200 million. The facilitywill carry a margin over US LIBOR at an average of 350basis points. At the same time, Ashanti agreed amendmentsto its existing RCF which has been increased to US$326million from US$270 million following the consolidation ofvarious bilateral facilities which were fully drawn. Therevised RCF carries a margin over US LIBOR of 200 basispoints for the facilities repayable by December 2000 and 250basis points for the balance. US$151 million of the facility isdue for repayment by 31 December 2000 and the balance ofUS$175 million is repayable in January 2003.
At 31 December 1999, the Group’s cash balance stood atUS$89.7 million (1998: US$112.9 million). Total borrowingswere US$582.6 million (1998: US$490.3 million) of which
US$159.4 million is repayable within one year. Net gearingequates to 126 per cent. Writing back goodwill written off inprevious years net gearing was 55 per cent.
Millennium ComplianceIn January 1998, Ashanti set up a programme to ensure thatall critical computer systems and computer controlled plantand equipment would be Year 2000 compliant. The principalobjective was to ensure that neither business performancenor functionality were adversely affected prior to, during andafter Year 2000.
There was no disruption to any of Ashanti’s operations oroffices as a result of the rollover into the year 2000. The Group will continue to monitor the position over thenext few months to ensure all systems are proved fullycompliant. The costs involved in ensuring compliance werenot significant.
Going ConcernAfter making enquiries, the directors have formed ajudgement, at the time of approving the financial statements,that there is reasonable expectation that the Group hasadequate resources to continue in operational existence forthe foreseeable future.
It should be noted, however, that the Group has significantcommitments in 2000 under the terms of the bankingarrangements, including the need to raise US$200 million by30 September 2000 from asset sales, in order to retire aUS$100 million bridge loan facility and repayUS$151 million of the US$326 million RCF by 31 December2000. The Group expects to repay these facilities from the proceeds of the sale of a 50 per cent interest in the Geita project in Tanzania. In connection with this Ashantiannounced in early April 2000 that it had signed a non-binding Heads of Agreement with AngloGold. The terms ofthe agreement are that the Group will receive US$205 millionin cash for a 50 per cent interest in the project andAngloGold will procure or provide project financing for theGeita project totalling US$130 million. The project financingwill be used to repay in full the existing US$100 millionbridge facility arranged by Barclays Capital and the balancewill be used to reduce inter-company loans made to theproject by Ashanti. AngloGold will acquire 50 per cent ofthe balance of these inter-company loans. The result will bethat Ashanti will have available US$335 million in cash tomake its repayment commitments. The sale of the 50 per cent will require the approval of Ashanti’sshareholders and certain other regulatory approvals.

Gold Market and Hedging
ObjectivesAshanti’s gold hedging programme has the primary objectiveof protecting the Group’s revenue stream such that thecashflow of the Group going forward will be adequate to meetall obligations as they fall due. This objective takes intoaccount the level of Ashanti’s commitments, in terms ofoperating costs, capital expenditure and debt serviceobligations, relative to the potential fluctuations in the goldprice. This objective is pursued in a manner that is intended topreserve, to the extent that is reasonably possible, the exposureof Ashanti’s cashflows to potential increases in the gold price.
Summary of Ashanti’s Gold Hedging PortfolioAshanti has entered into gold hedging contracts in order toachieve certain minimum prices for its gold production. Asummary of the Ashanti hedging programme is provided in
this section and the programme details are presented in anAppendix on page 53. The hedge portfolios at both31 December 1999 and 3 March 2000 have been included,so as to reflect certain adjustments during the early part of2000, which have resulted in a simplification of the hedgeportfolio and a reduction in the number of committedounces. The analysis and tabulations of the hedge portfolioin this section and in the Appendix on page 53 have beenprepared by the consultants, Standard Risk and TreasuryManagement Services (Pty) Limited of South Africa(SRTMS).
In summary, as at year-end 1999, Ashanti was protectedagainst downward movement in the gold price to the extent of 8.13 million ounces at an average price of approximatelyUS$364.3 per ounce. This amount is made up of 5.38 million
20
Hedging commitments as at 31 December 1999Type 2000 2001 2002 2003 2004 2005 2006 2007 2008 2009 2010 2011 2012 2013 Totals
Forward Sales (ounces) 626,639 611,758 602,500 1,003,750 1,048,500 358,000 219,600 206,320 149,080 130,000 180,000 80,000 80,000 80,000 5,376,147Forward Sales (US$/ounce) 334.66 358.85 363.39 358.22 353.98 382.10 353.77 374.60 331.57 317.48 362.11 264.50 264.50 280.13 351.79
Contango Locks (ounces) – – – – – – – 100,000 100,000 100,000 – 100,000 100,000 – 500,000Contango Locks – – – – – – – 4.71% 4.78% 4.80% – 4.95% 4.97% – 4.84%
Puts:Bought (ounces) 190,000 190,003 170,000 50,000 – – – – – – – – – – 600,003Bought (US$/ounce) 323.16 321.05 319.41 354.00 – – – – – – – – – – 324.00
Sold (ounces) 150,000 50,000 50,000 50,000 50,000 – – – – – – – – – 350,000Sold (US$/ounce) 270.00 270.00 270.00 270.00 270.00 – – – – – – – – – 270.00
Subtotal (ounces) 40,000 140,003 120,000 – (50,000) – – – – – – – – – 250,003
Calls:Sold (ounces) 323,550 1,050,100 1,179,500 935,800 482,050 410,550 420,520 348,740 304,740 96,220 56,500 56,500 56,500 56,500 5,777,770Sold (US$/ounce) 395.52 343.18 357.98 370.37 386.50 363.57 365.73 368.60 366.95 362.38 350.00 350.00 350.00 350.00 363.62
Bought (ounces) 100,000 – – 212,000 302,000 32,000 265,000 265,000 182,000 200,000 200,000 200,000 200,000 150,000 2,308,000Bought (US$/ounce) 300.00 – – 443.16 440.73 430.00 399.81 399.81 364.07 350.00 350.00 350.00 350.00 350.00 381.92
Subtotal (ounces) 223,550 1,050,100 1,179,500 723,800 180,050 378,550 155,520 83,740 122,740 (103,780) (143,500) (143,500) (143,500) (93,500) 3,469,770
Convertible Structures:Put Protection (ounces) – – 100,000 200,000 279,200 279,200 279,200 279,200 179,200 179,200 179,200 100,000 100,000 50,000 2,204,400Put Protection (US$/ounce) – – 400.75 402.13 396.93 398.72 400.51 402.30 390.47 390.47 390.47 400.75 400.75 401.00 397.80
Forward Commitment (ounces) – – 200,000 300,000 300,000 300,000 300,000 300,000 200,000 100,000 100,000 100,000 100,000 50,000 2,350,000Forward Commitment (US$/ounce) – – 400.75 401.67 403.33 405.00 406.67 408.33 400.75 400.75 400.75 400.75 400.75 401.00 403.47
Call Commitment (ounces) – – – – 79,200 79,200 79,200 79,200 79,200 179,200 179,200 100,000 100,000 50,000 1,004,400Call Commitment (US$/ounce) – – – – 380.00 380.00 380.00 380.00 380,00 391.58 391.58 400.75 400.75 401.00 389.31
Put Swaptions (ounces) 100,000 100,000 100,000 – – – – – – – – – – – 300,000Put Swaptions (US$/ounce) 307.30 312.30 317.30 – – – – – – – – – – – 312.30
SummaryProtected (ounces) 766,639 851,761 922,500 1,203,750 1,277,700 637,200 498,800 485,520 328,280 309,200 359,200 180,000 180,000 130,000 8,130,550
Committed (ounces) 850,189 1,661,858 1,982,000 2,027,550 1,607,750 1,115,750 754,320 669,260 551,020 305,420 315,700 136,500 136,500 88,500 12,200,317
Put Binaries – – – – – – ($2m) ($2m) ($3m) ($4m) ($4m) ($4m) ($4m) ($3m) ($26m)
Lease Rate Swap (ounces) 7,645,812 7,303,500 6,895,438 6,369,500 5,608,375 4,760,575 3,853,963 3,047,853 2,390,520 1,897,650 1,454,470 1,015,250 623,750 216,000 7,645,812Amortising Volume
This table should be read in conjunction with the Gold Market and Hedging Appendix on page 53.
Gold Market and Hedging
ounces of forward sales at an average price of about US$352per ounce, and a net amount of 2.45 million ounces (2.75million ounces including Swap Options) of put options. Theforward contracts represent a commitment to deliver gold at aspecific price while the put options give Ashanti the right, butnot the obligation, to sell gold at specified prices. Ashanti’sdownside protection represented 38 per cent of the Group’sproved and probable reserves at year-end 1999.
In constructing the hedge portfolio, Ashanti has entered intocontracts for call options and contingent forward sales. As atyear-end 1999, the maximum number of ounces committedunder Ashanti’s hedge contracts, if all call options andcontingent positions were to materialise, was 12.2 millionounces at an average gold price of US$364.7 per ounce. This is equivalent to 58 per cent of proved and probable reserves.The call options sold, which cover a net amount of
3.47 million ounces, represent a potential commitment todeliver gold if the price rises. In addition, under certainconditions, which would be triggered by the spot gold pricein future years exceeding certain “trigger” levels rangingbetween US$340 to US$373 per ounce (see note on page 53),2.2 million ounces of the 2.45 million ounces of putsmentioned above would convert to 2.35 million ounces offorward sales at an average price of US$403 per ounce and1 million ounces of calls sold at an average price ofUS$389 per ounce.
Changes in the PortfolioAs at 31 December 1999 the hedge book had not changedmaterially from the 30 September quarterly report. Allcontracts that were due for maturity in 1999 were rolledforward into year 2000, under the Standstill Agreement withthe Group’s hedging counterparties.
21
Hedging commitments as at 3 March 2000Type 2000 2001 2002 2003 2004 2005 2006 2007 2008 2009 2010 2011 2012 2013 Totals
Forward Sales (ounces) 525,008 501,758 572,500 953,750 528,500 318,000 319,600 306,320 249,080 230,000 140,000 140,000 120,000 120,000 5,024,516
Forward Sales (US$/ounce) 334.81 353.72 352.26 349.36 361.69 360.12 356.89 360.32 358.04 357.70 346.86 346.86 348.00 348.00 352.35
Contango Locks (ounces) – – – – – – – 100,000 100,000 100,000 – – – – 300,000
Contango Locks – – – – – – – 4.71% 4.78% 4.80% – – – – 4.76%
Puts:
Bought (ounces) 190,000 190,003 170,000 50,000 – – – – – – – – – – 600,003
Bought (US$/ounce) 323.16 321.05 319.41 354.00 – – – – – – – – – – 324.00
Sold (ounces) 50,000 50,000 50,000 50,000 50,000 – – – – – – – – – 250,000
Sold (US$/ounce) 270.00 270.00 270.00 270.00 270.00 – – – – – – – – – 270.00
Subtotal (ounces) 140,000 140,003 120,000 – (50,000) – – – – – – – – – 350,003
Calls:
Sold (ounces) 273,550 1,010,100 1,091,500 830,900 377,150 305,650 315,620 287,840 287,840 96,220 56,500 56,500 56,500 56,500 5,102,370
Sold (US$/ounce) 384.65 341.72 356.20 369.26 388.53 358.21 361.25 366.48 366.48 362.38 350.00 350.00 350.00 350.00 360.81
Bought (ounces) – – 60,000 240,000 280,000 60,000 173,000 173,000 – – – – – – 986,000
Bought (US$/ounce) – – 380.00 429.13 444.43 380.00 418.44 418.44 – – – – – – 423.74
Subtotal (ounces) 273,550 1,010,100 1,031,500 590,900 97,150 245,650 142,620 114,840 287,840 96,220 56,500 56,500 56,500 56,500 4,116,370
Convertible Structures:
Put Protection (ounces) – – 100,000 100,000 179,200 179,200 179,200 179,200 179,200 179,200 179,200 100,000 100,000 50,000 1,704,400
Put Protection (US$/ounce) – – 400.75 400.75 390.47 390.47 390.47 390.47 390.47 390.47 390.47 400.75 400.75 401.00 393.19
Forward Commitment (ounces) – – 200,000 200,000 200,000 200,000 200,000 200,000 200,000 100,000 100,000 100,000 100,000 50,000 1,850,000
Forward Commitment (US$/ounce) – – 400.75 400.75 400.75 400.75 400.75 400.75 400.75 400.75 400.75 400.75 400.75 401.00 400.76
Call Commitment (ounces) – – – – 79,200 79,200 79,200 79,200 79,200 179,200 179,200 100,000 100,000 50,000 1,004,400
Call Commitment (US$/ounce) – – – – 380.00 380.00 380.00 380.00 380.00 391.58 391.58 400.75 400.75 401.00 389.31
Summary:
Protected (ounces) 665,008 641,761 792,500 1,053,750 657,700 497,200 498,800 485,520 428,280 409,200 319,200 240,000 220,000 170,000 7,078,919
Committed (ounces) 798,558 1,511,858 1,804,000 1,744,650 904,850 842,850 741,420 700,360 816,120 605,420 475,700 396,600 376,500 276,500 11,995,286
Lease Rate Swap (ounces) 6,089,750 5,907,250 5,693,875 5,376,375 4,781,500 4,041,200 3,252,400 2,559,415 1,945,520 1,427,650 1,014,470 695,250 428,750 161,000 6,089,750
Amortising Volume
This table should be read in conjunction with the Gold Market and Hedging Appendix on page 53.
Gold Market and Hedging
Between 31 December 1999 and 3 March 2000, Ashantireduced the hedge portfolio and effected a number ofsimplifications. The number of contracts that provide downsideprotection was reduced to 7.1 million ounces (33 per cent ofreserves) at an average price of about US$362.7 per ounce.The maximum number of ounces that would be committed,if all call options were to be exercised, was reduced to justbelow 12 million ounces (57 per cent of reserves) at anaverage price of about US$360.64 per ounce. Actions takento simplify the portfolio included reductions in all types ofoption contracts outstanding and a reduction in the numberof ounces covered by lease rate swaps to 6.1 million ounces.
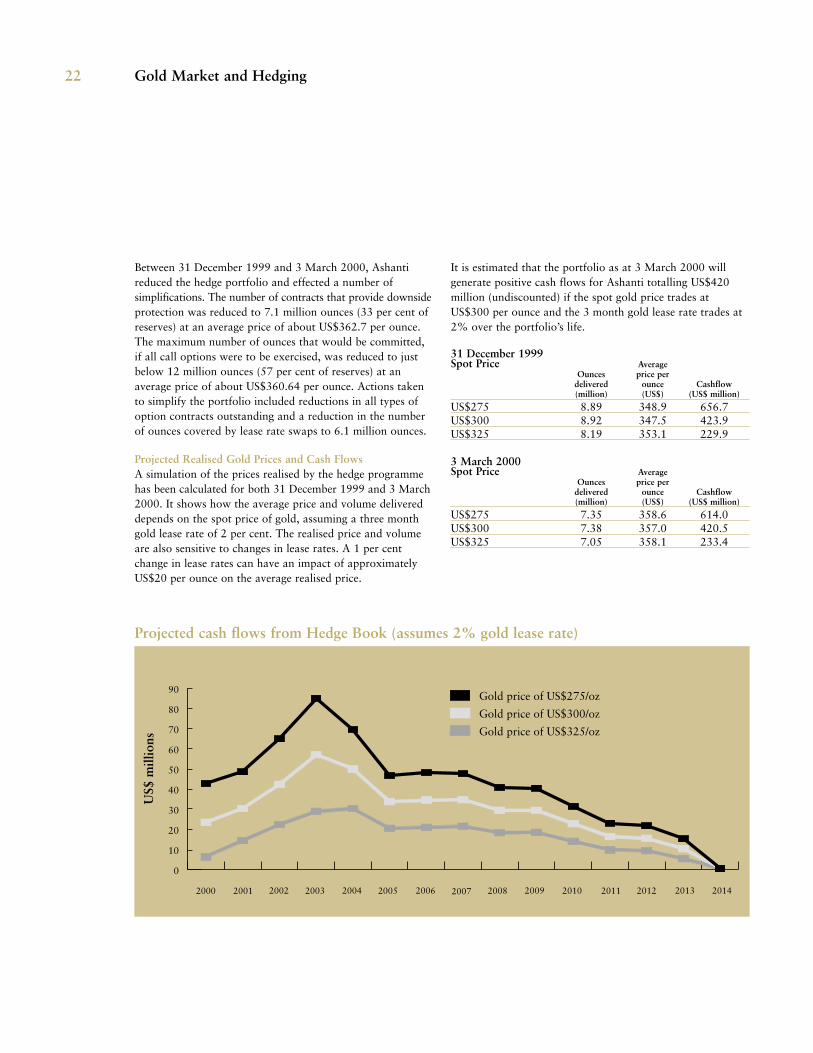
Projected Realised Gold Prices and Cash FlowsA simulation of the prices realised by the hedge programmehas been calculated for both 31 December 1999 and 3 March2000. It shows how the average price and volume delivereddepends on the spot price of gold, assuming a three monthgold lease rate of 2 per cent. The realised price and volumeare also sensitive to changes in lease rates. A 1 per centchange in lease rates can have an impact of approximatelyUS$20 per ounce on the average realised price.
It is estimated that the portfolio as at 3 March 2000 willgenerate positive cash flows for Ashanti totalling US$420million (undiscounted) if the spot gold price trades atUS$300 per ounce and the 3 month gold lease rate trades at2% over the portfolio’s life.
31 December 1999Spot Price Average
Ounces price perdelivered ounce Cashflow(million) (US$) (US$ million)
US$275 8.89 348.9 656.7US$300 8.92 347.5 423.9US$325 8.19 353.1 229.9
3 March 2000Spot Price Average
Ounces price perdelivered ounce Cashflow(million) (US$) (US$ million)
US$275 7.35 358.6 614.0US$300 7.38 357.0 420.5US$325 7.05 358.1 233.4
22
90
80
70
60
50
40
30
20
10
0
201420132012201120102009200820072006200520042003200220012000
Gold price of US$275/oz
Gold price of US$300/oz
Gold price of US$325/oz
US$
mill
ions
Projected cash flows from Hedge Book (assumes 2% gold lease rate)
Gold Market and Hedging
Mark-to-Market ValuationsThe hedge book had a negative mark-to-market value ofUS$231 million at 31 December 1999 (at a gold price ofUS$290 per ounce) and a negative value of US$253 million at 3 March 2000 (at a gold price of US$289 per ounce).These mark-to-market valuations give an indication of thecost of closing out the hedge portfolio at that time. As anongoing concern, however, Ashanti will realise the prices andcashflows indicated as on the previous page, subject to thegiven assumptions.
The increase in the negative mark-to-market since year-end1999 was primarily due to an increase in US dollar interestrates. US$9.4 million of cash was also realised during thisperiod.
The delta in Ashanti’s hedge portfolio as at 3 March 2000was negative 9.2 million ounces. This provides an indicationthat under the same market conditions, a US$1 change in thespot price of gold would change the mark-to-marketvaluation by approximately US$9.2 million.
Strategy and PolicyThe Board of Directors has approved a revised gold hedgingpolicy. While the objectives of the revised policy are broadlysimilar to the previous policy the revised policy has theeffect of:
� limiting protection and commitments levels to apercentage of future forecast production levels, the above mentioned percentage decreasing over time.
� setting a minimum level of protection sufficient to ensurethat the Group should be able to meet its commitmentsas and when they fall due.
� limiting lease rate exposure to a percentage of protection.
Under the revised policy it is unlikely that the size of thehedge book will be increased (unless production substantiallyincreases). The portfolio will, however, have to berestructured to meet the objectives set out on page 6.
The implementation and management of the policy will alsotake into account a wider range of potential movements inthe gold price and other market parameters, in order tominimise the risk of exceeding the margin limits (post themargin free period) provided to Ashanti by its hedgecounterparties.
The Board has also reviewed the adequacy of the resourcesand controls in the gold hedging area. Resources have beenstrengthened in January 2000 by the appointment of anexperienced individual as Managing Director, InternationalTreasury and the engagement of SRTMS as independentconsultants. Controls have been further strengthened by thecreation of a Risk Management Committee chaired by a non-executive director.
OutlookAshanti has an agreement with its hedging counterpartiesthat provides for margin-free trading up to the end of 2002,and expanded margin limits during 2003 and 2004. Duringthe three years ending 31 December 2002, protectioncontracts covering 2.1 million ounces and commitmentcontracts covering 4.1 million ounces are currently scheduledto expire. The analysis described earlier, which wasperformed as of 3 March 2000, indicates that, at the marketconditions prevailing at that date, the mark-to-market valueof Ashanti’s hedging portfolio would reduce to about US$90million negative by year-end 2002 and the delta wouldreduce to about 6 million ounces. Under the assumptions inthis forecast it is estimated that Ashanti’s exposure to margincalls will be substantially reduced.
Ashanti management are reviewing further ways to maintainor improve the levels of hedge protection for future years’production, while reducing commitment levels.
23
24
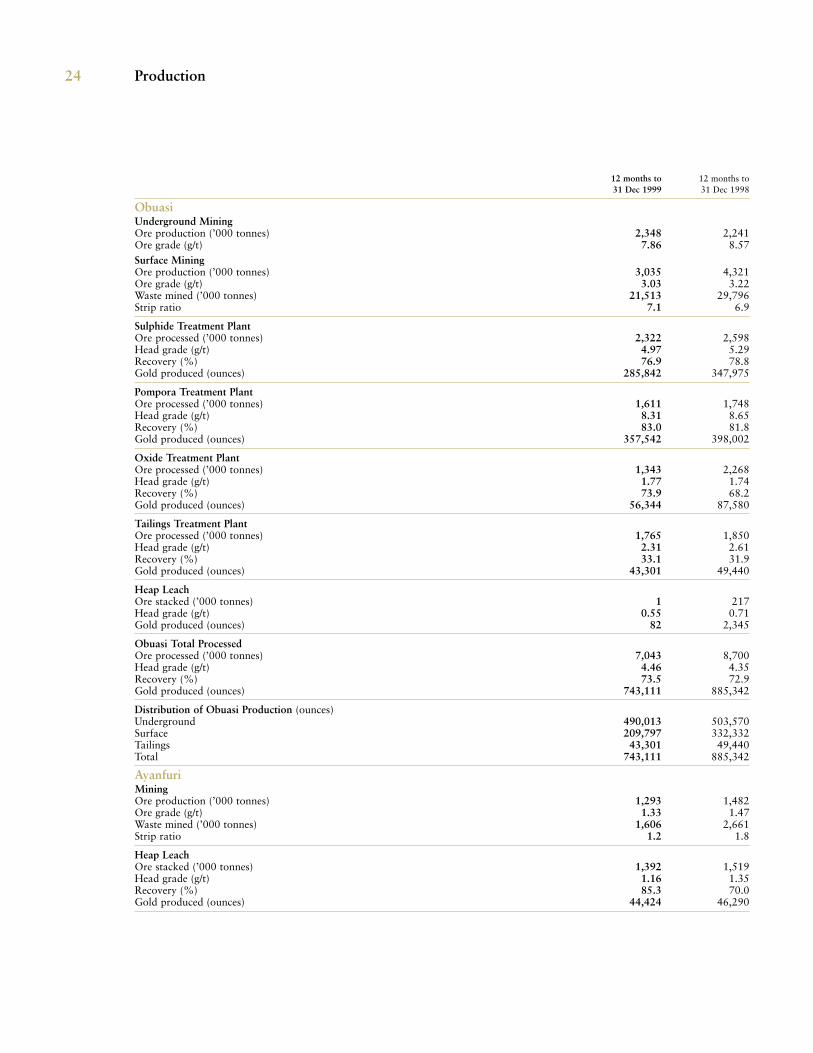
12 months to 12 months to31 Dec 1999 31 Dec 1998
ObuasiUnderground MiningOre production (’000 tonnes) 2,348 2,241Ore grade (g/t) 7.86 8.57Surface MiningOre production (’000 tonnes) 3,035 4,321Ore grade (g/t) 3.03 3.22Waste mined (’000 tonnes) 21,513 29,796Strip ratio 7.1 6.9
Sulphide Treatment PlantOre processed (’000 tonnes) 2,322 2,598Head grade (g/t) 4.97 5.29Recovery (%) 76.9 78.8Gold produced (ounces) 285,842 347,975
Pompora Treatment PlantOre processed (’000 tonnes) 1,611 1,748Head grade (g/t) 8.31 8.65Recovery (%) 83.0 81.8Gold produced (ounces) 357,542 398,002
Oxide Treatment PlantOre processed (’000 tonnes) 1,343 2,268Head grade (g/t) 1.77 1.74Recovery (%) 73.9 68.2Gold produced (ounces) 56,344 87,580
Tailings Treatment PlantOre processed (’000 tonnes) 1,765 1,850Head grade (g/t) 2.31 2.61Recovery (%) 33.1 31.9Gold produced (ounces) 43,301 49,440
Heap LeachOre stacked (’000 tonnes) 1 217Head grade (g/t) 0.55 0.71Gold produced (ounces) 82 2,345
Obuasi Total ProcessedOre processed (’000 tonnes) 7,043 8,700Head grade (g/t) 4.46 4.35Recovery (%) 73.5 72.9Gold produced (ounces) 743,111 885,342
Distribution of Obuasi Production (ounces)Underground 490,013 503,570Surface 209,797 332,332Tailings 43,301 49,440Total 743,111 885,342
AyanfuriMiningOre production (’000 tonnes) 1,293 1,482Ore grade (g/t) 1.33 1.47Waste mined (’000 tonnes) 1,606 2,661Strip ratio 1.2 1.8
Heap LeachOre stacked (’000 tonnes) 1,392 1,519Head grade (g/t) 1.16 1.35Recovery (%) 85.3 70.0Gold produced (ounces) 44,424 46,290
Production
25
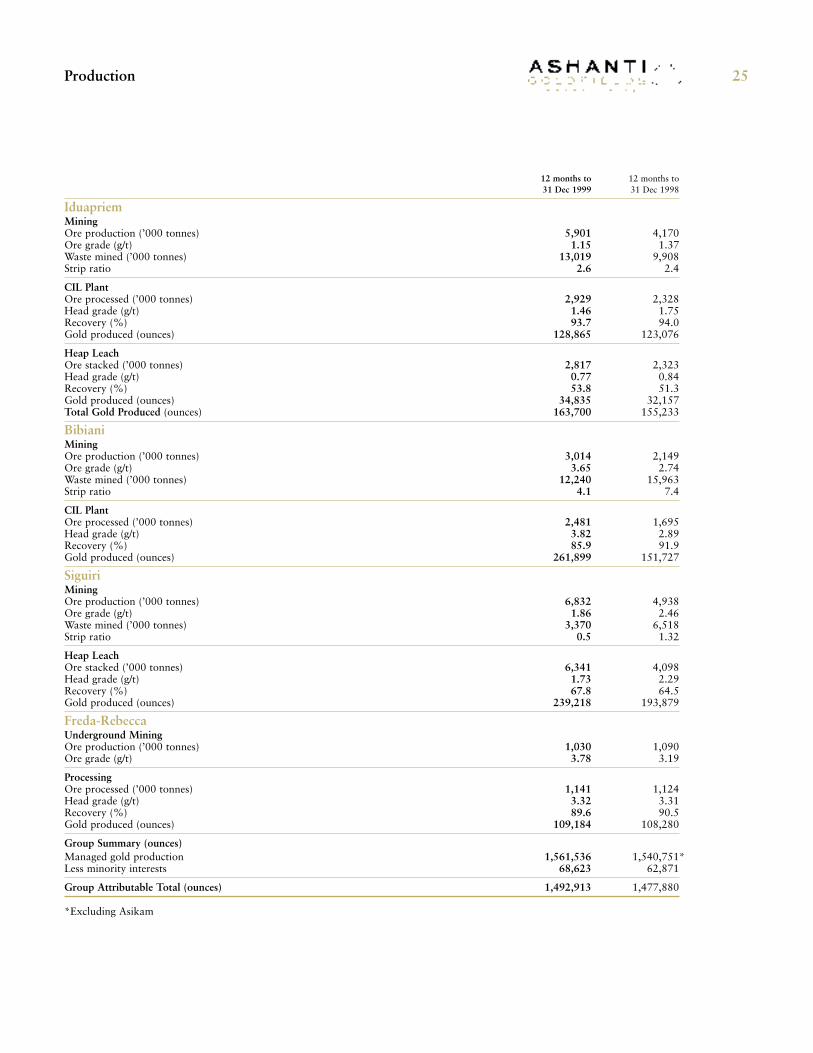
12 months to 12 months to31 Dec 1999 31 Dec 1998
IduapriemMiningOre production (’000 tonnes) 5,901 4,170Ore grade (g/t) 1.15 1.37Waste mined (’000 tonnes) 13,019 9,908Strip ratio 2.6 2.4
CIL PlantOre processed (’000 tonnes) 2,929 2,328Head grade (g/t) 1.46 1.75Recovery (%) 93.7 94.0Gold produced (ounces) 128,865 123,076
Heap LeachOre stacked (’000 tonnes) 2,817 2,323Head grade (g/t) 0.77 0.84Recovery (%) 53.8 51.3Gold produced (ounces) 34,835 32,157Total Gold Produced (ounces) 163,700 155,233
BibianiMiningOre production (’000 tonnes) 3,014 2,149Ore grade (g/t) 3.65 2.74Waste mined (’000 tonnes) 12,240 15,963Strip ratio 4.1 7.4
CIL PlantOre processed (’000 tonnes) 2,481 1,695Head grade (g/t) 3.82 2.89Recovery (%) 85.9 91.9Gold produced (ounces) 261,899 151,727
SiguiriMiningOre production (’000 tonnes) 6,832 4,938Ore grade (g/t) 1.86 2.46Waste mined (’000 tonnes) 3,370 6,518Strip ratio 0.5 1.32
Heap LeachOre stacked (’000 tonnes) 6,341 4,098Head grade (g/t) 1.73 2.29Recovery (%) 67.8 64.5Gold produced (ounces) 239,218 193,879
Freda-RebeccaUnderground MiningOre production (’000 tonnes) 1,030 1,090Ore grade (g/t) 3.78 3.19
ProcessingOre processed (’000 tonnes) 1,141 1,124Head grade (g/t) 3.32 3.31Recovery (%) 89.6 90.5Gold produced (ounces) 109,184 108,280
Group Summary (ounces)Managed gold production 1,561,536 1,540,751*Less minority interests 68,623 62,871
Group Attributable Total (ounces) 1,492,913 1,477,880
*Excluding Asikam
Production
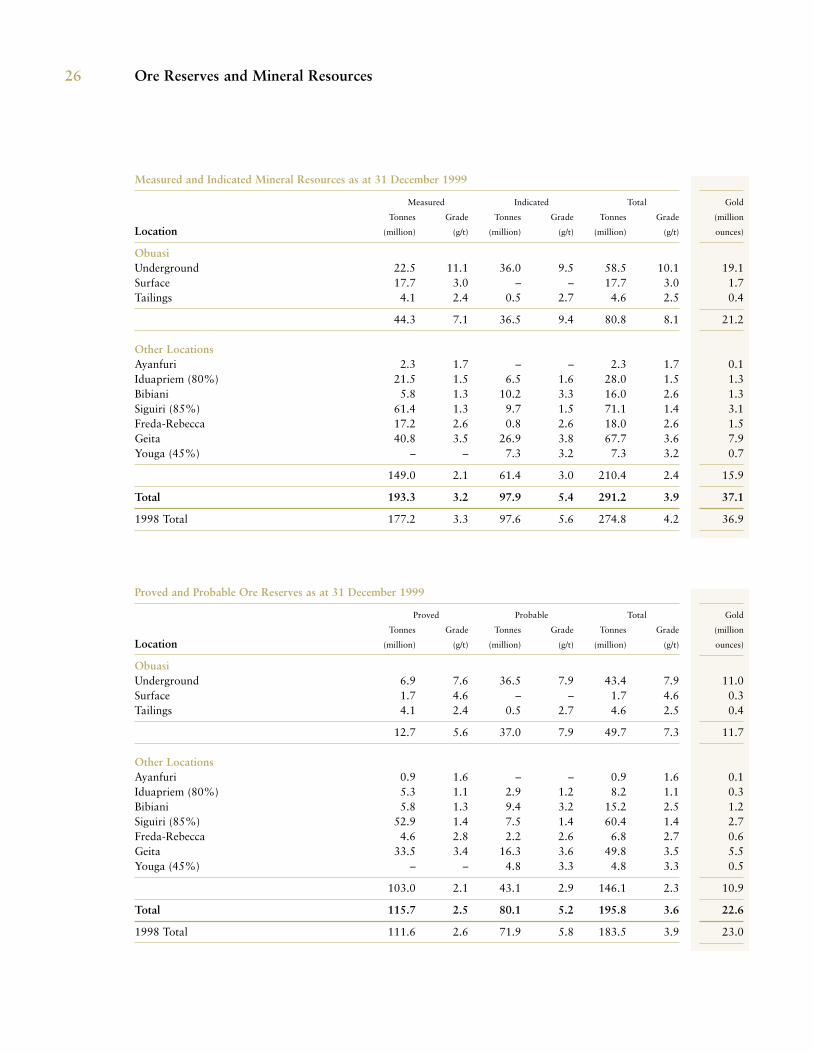
Measured and Indicated Mineral Resources as at 31 December 1999
Measured Indicated Total
Tonnes Grade Tonnes Grade Tonnes Grade
Location (million) (g/t) (million) (g/t) (million) (g/t)
ObuasiUnderground 22.5 11.1 36.0 9.5 58.5 10.1Surface 17.7 3.0 – – 17.7 3.0Tailings 4.1 2.4 0.5 2.7 4.6 2.5
44.3 7.1 36.5 9.4 80.8 8.1
Other LocationsAyanfuri 2.3 1.7 – – 2.3 1.7Iduapriem (80%) 21.5 1.5 6.5 1.6 28.0 1.5Bibiani 5.8 1.3 10.2 3.3 16.0 2.6Siguiri (85%) 61.4 1.3 9.7 1.5 71.1 1.4Freda-Rebecca 17.2 2.6 0.8 2.6 18.0 2.6Geita 40.8 3.5 26.9 3.8 67.7 3.6Youga (45%) – – 7.3 3.2 7.3 3.2
149.0 2.1 61.4 3.0 210.4 2.4
Total 193.3 3.2 97.9 5.4 291.2 3.9
1998 Total 177.2 3.3 97.6 5.6 274.8 4.2
Gold
(million
ounces)
19.11.70.4
21.2
0.11.31.33.11.57.90.7
15.9
37.1
36.9
Ore Reserves and Mineral Resources26
Proved and Probable Ore Reserves as at 31 December 1999
Proved Probable Total
Tonnes Grade Tonnes Grade Tonnes Grade
Location (million) (g/t) (million) (g/t) (million) (g/t)
ObuasiUnderground 6.9 7.6 36.5 7.9 43.4 7.9Surface 1.7 4.6 – – 1.7 4.6Tailings 4.1 2.4 0.5 2.7 4.6 2.5
12.7 5.6 37.0 7.9 49.7 7.3
Other LocationsAyanfuri 0.9 1.6 – – 0.9 1.6Iduapriem (80%) 5.3 1.1 2.9 1.2 8.2 1.1Bibiani 5.8 1.3 9.4 3.2 15.2 2.5Siguiri (85%) 52.9 1.4 7.5 1.4 60.4 1.4Freda-Rebecca 4.6 2.8 2.2 2.6 6.8 2.7Geita 33.5 3.4 16.3 3.6 49.8 3.5Youga (45%) – – 4.8 3.3 4.8 3.3
103.0 2.1 43.1 2.9 146.1 2.3
Total 115.7 2.5 80.1 5.2 195.8 3.6
1998 Total 111.6 2.6 71.9 5.8 183.5 3.9
Gold
(million
ounces)
11.00.30.4
11.7
0.10.31.22.70.65.50.5
10.9
22.6
23.0
Ore Reserves and Mineral Resources 27
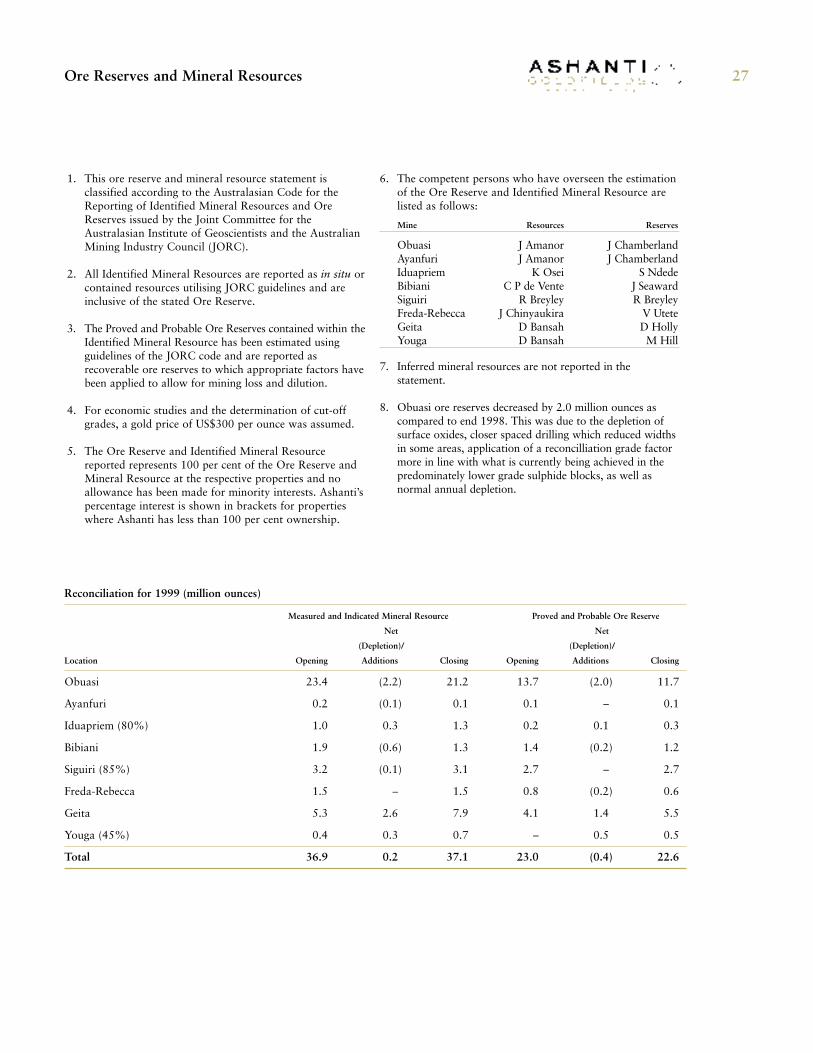
1. This ore reserve and mineral resource statement isclassified according to the Australasian Code for theReporting of Identified Mineral Resources and OreReserves issued by the Joint Committee for theAustralasian Institute of Geoscientists and the AustralianMining Industry Council (JORC).
2. All Identified Mineral Resources are reported as in situ orcontained resources utilising JORC guidelines and areinclusive of the stated Ore Reserve.
3. The Proved and Probable Ore Reserves contained within theIdentified Mineral Resource has been estimated usingguidelines of the JORC code and are reported asrecoverable ore reserves to which appropriate factors havebeen applied to allow for mining loss and dilution.
4. For economic studies and the determination of cut-offgrades, a gold price of US$300 per ounce was assumed.
5. The Ore Reserve and Identified Mineral Resourcereported represents 100 per cent of the Ore Reserve andMineral Resource at the respective properties and noallowance has been made for minority interests. Ashanti’spercentage interest is shown in brackets for propertieswhere Ashanti has less than 100 per cent ownership.
6. The competent persons who have overseen the estimationof the Ore Reserve and Identified Mineral Resource arelisted as follows:
Mine Resources Reserves
Obuasi J Amanor J ChamberlandAyanfuri J Amanor J ChamberlandIduapriem K Osei S NdedeBibiani C P de Vente J SeawardSiguiri R Breyley R BreyleyFreda-Rebecca J Chinyaukira V UteteGeita D Bansah D HollyYouga D Bansah M Hill
7. Inferred mineral resources are not reported in thestatement.
8. Obuasi ore reserves decreased by 2.0 million ounces ascompared to end 1998. This was due to the depletion ofsurface oxides, closer spaced drilling which reduced widthsin some areas, application of a reconcilliation grade factormore in line with what is currently being achieved in thepredominately lower grade sulphide blocks, as well asnormal annual depletion.
Reconciliation for 1999 (million ounces)
Measured and Indicated Mineral Resource Proved and Probable Ore Reserve
Net Net
(Depletion)/ (Depletion)/
Location Opening Additions Closing Opening Additions Closing
Obuasi 23.4 (2.2) 21.2 13.7 (2.0) 11.7
Ayanfuri 0.2 (0.1) 0.1 0.1 – 0.1
Iduapriem (80%) 1.0 0.3 1.3 0.2 0.1 0.3
Bibiani 1.9 (0.6) 1.3 1.4 (0.2) 1.2
Siguiri (85%) 3.2 (0.1) 3.1 2.7 – 2.7
Freda-Rebecca 1.5 – 1.5 0.8 (0.2) 0.6
Geita 5.3 2.6 7.9 4.1 1.4 5.5
Youga (45%) 0.4 0.3 0.7 – 0.5 0.5
Total 36.9 0.2 37.1 23.0 (0.4) 22.6
Glossary of Terms
adit A tunnel driven horizontally into a mountainside providing access to anore deposit.
BIOX® Gencor’s registered name for its bio-oxidation leaching process.
bio-oxidation The use of bacterial activity to oxidise sulphide minerals.
carbon-in-leach (CIL) process A modification of CIP whereby carbon isadded directly into the slurry during leaching as opposed to CIP where carbonis added after leaching is complete.
carbon-in-pulp (CIP) process A process used to recover dissolved gold from acyanide leach slurry. Coarse activated carbon particles are moved counter-current to the slurry, absorbing the gold as it passes through the circuit.Loaded carbon is removed from the slurry by screening. The gold is recoveredfrom the loaded carbon by stripping in a caustic cyanide solution followed byelectrolysis or by zinc precipitation.
cash operating cost A measure of the average cost of producing an ounce ofgold, calculated by dividing the total working costs in a period by the totalgold production over the same period. Working costs represent total operatingcosts less royalties and depreciation.
contained ounces Represents ounces in the ground without reduction due tomining loss or dilution.
cyanide leaching The extraction of a precious metal from an ore by itsdissolution in a cyanide solution.
decline An inclined underground access way.
diamond drilling or core drilling A drilling method, where the rock is cutwith a diamond bit, usually to extract cores.
dilution Waste which is commingled with ore in the mining process.
feasibility study A detailed technical and economic analysis of the viability ofa project covering all aspects from geology, environmental and legal matters tomining, processing and operations.
flotation A recovery process by which valuable minerals are separated fromwaste to produce a concentrate. Selected minerals are induced to becomeattached to air bubbles and to float.
forward sales The sale of a commodity for delivery at a specified future dateand price, usually at a premium to the spot price.
geochemical sampling Samples of soils, stream sediments or rock chips takento ensure the quantities of trace and minor elements.
grade The relative quality or percentage of ore metal content.
heap leaching A low-cost technique for extracting metals from ore bypercolating leaching solutions through heaps of ore placed on imperviouspads. Generally used on low-grade ores.
indicated mineral resource That part of a Mineral Resource which has beenexplored, sampled and tested through appropriate techniques at locationswhich are too widely or inappropriately spaced to confirm geological and/orgrade continuity but which are spaced closely enough for continuity to beassumed, and from which data have been collected to allow tonnage, densities,shape, physical characteristics, grade and mineral content to be estimated witha reasonable level of confidence.
inferred mineral resource That part of a Mineral Resource inferred fromgeological evidence and assumed but not verified geological and/or gradecontinuity, where information gathered through appropriate techniques fromlocations such as outcrops, trenches, pits, workings and drill holes is limited orof uncertain quality and reliability and on the basis of which tonnage, gradeand mineral content can be estimated with a low level of confidence.
measured mineral resource That part of a Mineral Resource which has beenexplored, sampled and tested through appropriate techniques at locations suchas outcrops, trenches, pits, workings and drill holes which are spaced closelyenough to confirm geological and/or grade continuity, and from which detailedreliable data have been collected to allow tonnage, densities, shape, physicalcharacteristics, grade and mineral content to be estimated with a high level ofconfidence.
milling/mill The comminution of the ore, although the term has come tocover the broad range of machinery inside the treatment plant where the goldis separated from the ore.
mineralised zone Any mass of host rock in which minerals, at least one ofwhich has commercial value occur.
mtpa Million tonnes per annum.
ore Material that contains one or more minerals, at least one of which hascommercial value and which can be recovered at a profit.
open pit/open cut Surface mining in which the ore is extracted from a pit. Thegeometry of the pit may vary with the characteristics of the orebody.
orebody A continuous well defined mass of material of sufficient ore contentto make extraction economically feasible.
oxide That portion of a mineral deposit within which sulphide minerals havebeen oxidised, usually by surface weathering processes.
pre-stripping Removal of overburden in advance of beginning operations toremove ore in an open pit operation.
probable ore reserve That mineable part of a Measured and/or IndicatedMineral Resource, inclusive of diluting materials and allowing for losses whichmay occur when the material is mined, on which appropriate assessments havebeen carried out, including consideration of and modification by realisticallyassumed mining, metallurgical, economic, marketing, legal, environmental,social and governmental factors, to demonstrate at the time of reporting thatextraction could reasonably be justified.
prospect A mineral deposit with insufficient data available on themineralisation to determine if it is economically recoverable, but warrantingfurther investigation.
prospecting licence An area for which permission to explore has been granted.
proved ore reserve That mineable part of a Measured Mineral Resource,inclusive of diluting materials and allowing for losses which may occur whenthe material is mined, on which appropriate assessments have been carried out,including consideration of and modification by realistically assumed mining,metallurgical, economic, marketing, legal, environmental, social andgovernmental factors, to demonstrate at the time of reporting that extractioncould reasonably be justified.
reclamation The process by which lands disturbed as a result of miningactivity are reclaimed back to a beneficial land use.
recoverable ounces Represents ounces in the ground factored for mining lossand dilution.
recovery A term used to indicate the proportion of valuable material obtainedduring the mining or processing of an ore. The recovery is generally expressedas a percentage of the material recovered compared to the total materialpresent.
reverse circulation drilling A drilling method employing double walled drillrods. The drilling fluid (usually air or water) is pushed down the annulusbetween the rods. The cuttings are blown up the middle.
spot price The current price of a metal for immediate delivery.
stope The underground excavation from which ore is extracted.
strike length Horizontal distance along the direction that a structural surfacetakes as it intersects the horizontal.
stripping The process of removing overburden to expose ore.
strip ratio The ratio of overburden and segregable waste to ore in an open pitoperation.
sulphide A mineral characterised by the linkages of sulphur with a metal orsemi-metal, iron sulphide. Also a zone in which sulphide minerals occur.
tailings The waste material from ore after the economically recoverable metalsor minerals have been extracted. Changes in the metal prices and improvementsin technology can sometimes make the tailings economic to reprocess at a laterdate.
trenching Making elongated open-air excavations for the purposes ofmapping and sampling.
waste Rock lacking sufficient grade and/or other characteristics of ore to beeconomic.
Metric Conversion
1 tonne = 1 t = 1.10231 tons1 gramme = 1 g = 0.03215 ounces1 gramme per tonne = 1 g/t = 0.02917 ounces per ton1 hectare = 1 ha = 2.47105 acres1 kilometre = 1 km = 0.621371 miles1 metre = 1 m = 3.28084 feet
All tons are short tons of 2,000 pounds.All ounces are troy ounces: 29.166 troy ounces equal one ton.
28
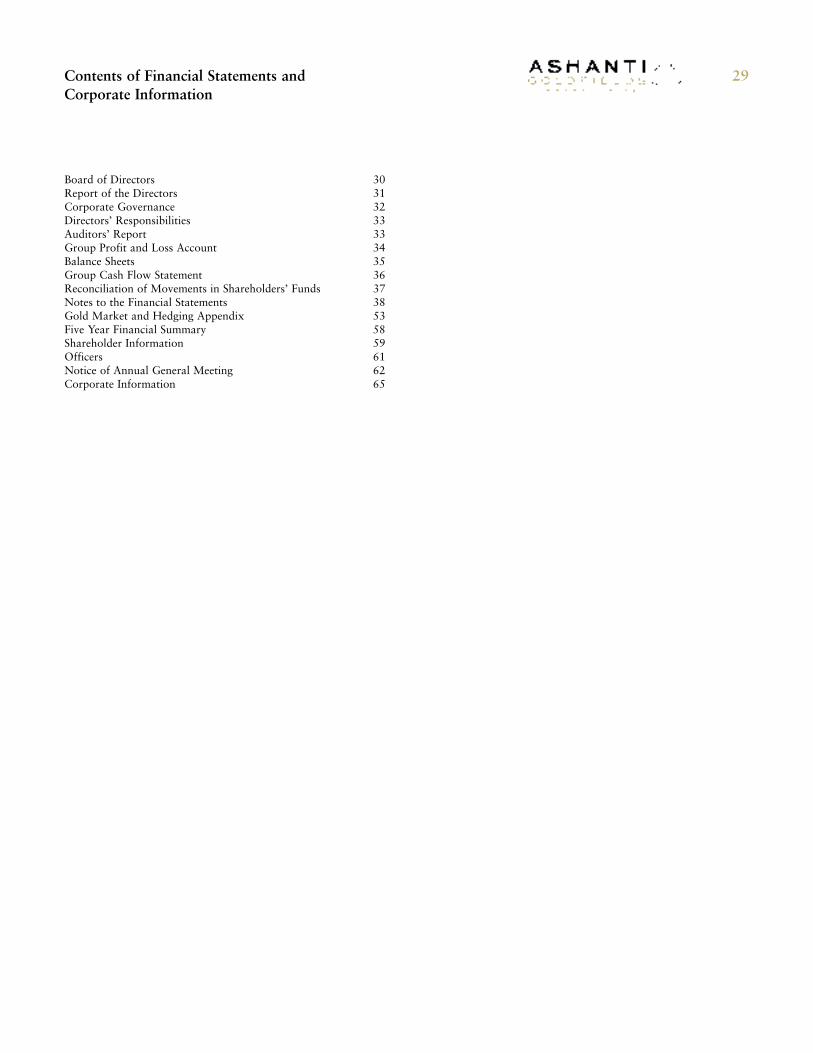
Contents of Financial Statements and Corporate Information
Board of Directors 30Report of the Directors 31Corporate Governance 32Directors’ Responsibilities 33Auditors’ Report 33Group Profit and Loss Account 34Balance Sheets 35Group Cash Flow Statement 36Reconciliation of Movements in Shareholders’ Funds 37Notes to the Financial Statements 38Gold Market and Hedging Appendix 53Five Year Financial Summary 58Shareholder Information 59Officers 61Notice of Annual General Meeting 62Corporate Information 65
29
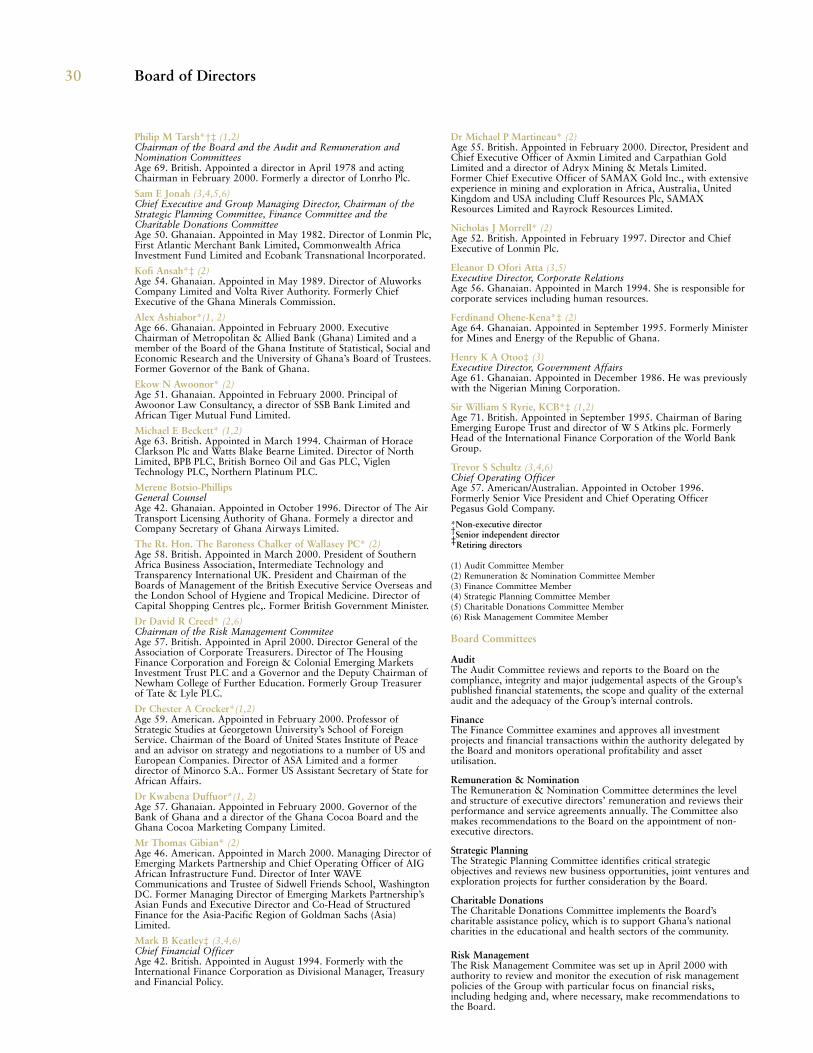
Board of Directors
Philip M Tarsh*†‡ (1,2)Chairman of the Board and the Audit and Remuneration andNomination CommitteesAge 69. British. Appointed a director in April 1978 and actingChairman in February 2000. Formerly a director of Lonrho Plc.
Sam E Jonah (3,4,5,6)Chief Executive and Group Managing Director, Chairman of theStrategic Planning Committee, Finance Committee and theCharitable Donations CommitteeAge 50. Ghanaian. Appointed in May 1982. Director of Lonmin Plc,First Atlantic Merchant Bank Limited, Commonwealth AfricaInvestment Fund Limited and Ecobank Transnational Incorporated.
Kofi Ansah*‡ (2)Age 54. Ghanaian. Appointed in May 1989. Director of AluworksCompany Limited and Volta River Authority. Formerly ChiefExecutive of the Ghana Minerals Commission.
Alex Ashiabor*(1, 2)Age 66. Ghanaian. Appointed in February 2000. ExecutiveChairman of Metropolitan & Allied Bank (Ghana) Limited and amember of the Board of the Ghana Institute of Statistical, Social andEconomic Research and the University of Ghana’s Board of Trustees.Former Governor of the Bank of Ghana.
Ekow N Awoonor* (2)Age 51. Ghanaian. Appointed in February 2000. Principal ofAwoonor Law Consultancy, a director of SSB Bank Limited andAfrican Tiger Mutual Fund Limited.
Michael E Beckett* (1,2)Age 63. British. Appointed in March 1994. Chairman of HoraceClarkson Plc and Watts Blake Bearne Limited. Director of NorthLimited, BPB PLC, British Borneo Oil and Gas PLC, ViglenTechnology PLC, Northern Platinum PLC.
Merene Botsio-PhillipsGeneral CounselAge 42. Ghanaian. Appointed in October 1996. Director of The AirTransport Licensing Authority of Ghana. Formely a director andCompany Secretary of Ghana Airways Limited.
The Rt. Hon. The Baroness Chalker of Wallasey PC* (2)Age 58. British. Appointed in March 2000. President of SouthernAfrica Business Association, Intermediate Technology andTransparency International UK. President and Chairman of theBoards of Management of the British Executive Service Overseas andthe London School of Hygiene and Tropical Medicine. Director ofCapital Shopping Centres plc,. Former British Government Minister.
Dr David R Creed* (2,6)Chairman of the Risk Management CommiteeAge 57. British. Appointed in April 2000. Director General of theAssociation of Corporate Treasurers. Director of The HousingFinance Corporation and Foreign & Colonial Emerging MarketsInvestment Trust PLC and a Governor and the Deputy Chairman ofNewham College of Further Education. Formerly Group Treasurerof Tate & Lyle PLC.
Dr Chester A Crocker*(1,2)Age 59. American. Appointed in February 2000. Professor ofStrategic Studies at Georgetown University’s School of ForeignService. Chairman of the Board of United States Institute of Peaceand an advisor on strategy and negotiations to a number of US andEuropean Companies. Director of ASA Limited and a formerdirector of Minorco S.A.. Former US Assistant Secretary of State forAfrican Affairs.
Dr Kwabena Duffuor*(1, 2)Age 57. Ghanaian. Appointed in February 2000. Governor of theBank of Ghana and a director of the Ghana Cocoa Board and theGhana Cocoa Marketing Company Limited.
Mr Thomas Gibian* (2)Age 46. American. Appointed in March 2000. Managing Director ofEmerging Markets Partnership and Chief Operating Officer of AIGAfrican Infrastructure Fund. Director of Inter WAVECommunications and Trustee of Sidwell Friends School, WashingtonDC. Former Managing Director of Emerging Markets Partnership’sAsian Funds and Executive Director and Co-Head of StructuredFinance for the Asia-Pacific Region of Goldman Sachs (Asia)Limited.
Mark B Keatley‡ (3,4,6)Chief Financial OfficerAge 42. British. Appointed in August 1994. Formerly with theInternational Finance Corporation as Divisional Manager, Treasuryand Financial Policy.
Dr Michael P Martineau* (2)Age 55. British. Appointed in February 2000. Director, President andChief Executive Officer of Axmin Limited and Carpathian GoldLimited and a director of Adryx Mining & Metals Limited.Former Chief Executive Officer of SAMAX Gold Inc., with extensiveexperience in mining and exploration in Africa, Australia, UnitedKingdom and USA including Cluff Resources Plc, SAMAXResources Limited and Rayrock Resources Limited.
Nicholas J Morrell* (2)Age 52. British. Appointed in February 1997. Director and ChiefExecutive of Lonmin Plc.
Eleanor D Ofori Atta (3,5)Executive Director, Corporate RelationsAge 56. Ghanaian. Appointed in March 1994. She is responsible forcorporate services including human resources.
Ferdinand Ohene-Kena*‡ (2)Age 64. Ghanaian. Appointed in September 1995. Formerly Ministerfor Mines and Energy of the Republic of Ghana.
Henry K A Otoo‡ (3)Executive Director, Government AffairsAge 61. Ghanaian. Appointed in December 1986. He was previouslywith the Nigerian Mining Corporation.
Sir William S Ryrie, KCB*‡ (1,2)Age 71. British. Appointed in September 1995. Chairman of BaringEmerging Europe Trust and director of W S Atkins plc. FormerlyHead of the International Finance Corporation of the World BankGroup.
Trevor S Schultz (3,4,6) Chief Operating OfficerAge 57. American/Australian. Appointed in October 1996.Formerly Senior Vice President and Chief Operating OfficerPegasus Gold Company.
*Non-executive director†Senior independent director‡Retiring directors
(1) Audit Committee Member(2) Remuneration & Nomination Committee Member(3) Finance Committee Member(4) Strategic Planning Committee Member(5) Charitable Donations Committee Member(6) Risk Management Commitee Member
Board Committees
AuditThe Audit Committee reviews and reports to the Board on thecompliance, integrity and major judgemental aspects of the Group’spublished financial statements, the scope and quality of the externalaudit and the adequacy of the Group’s internal controls.
FinanceThe Finance Committee examines and approves all investmentprojects and financial transactions within the authority delegated bythe Board and monitors operational profitability and assetutilisation.
Remuneration & NominationThe Remuneration & Nomination Committee determines the leveland structure of executive directors’ remuneration and reviews theirperformance and service agreements annually. The Committee alsomakes recommendations to the Board on the appointment of non-executive directors.
Strategic PlanningThe Strategic Planning Committee identifies critical strategicobjectives and reviews new business opportunities, joint ventures andexploration projects for further consideration by the Board.
Charitable DonationsThe Charitable Donations Committee implements the Board’scharitable assistance policy, which is to support Ghana’s nationalcharities in the educational and health sectors of the community.
Risk ManagementThe Risk Management Commitee was set up in April 2000 withauthority to review and monitor the execution of risk managementpolicies of the Group with particular focus on financial risks,including hedging and, where necessary, make recommendations tothe Board.
30
The directors present their report and the audited financialstatements for the year ended 31 December 1999.
Principal ActivitiesThe principal activities of the Group are the exploration,development and mining of gold. The progress of thebusiness during the year and likely future developments arereported in the Chairman’s Statement, the Chief Executive’sReview and the Operations Review.
Results and DividendThe results for the year are set out on page 34. The directorsdo not recommend paying a dividend for the year ended31 December 1999.
Employment PoliciesThe Group respects and values its employees as individualsand places emphasis on policies which benefit both theGroup and its employees. The Group is committed toproviding equal advancement opportunities, safe, cleanworking conditions and remuneration in the upper range ofthe industry. It recognises the merit of all employees, yet itendeavours to attract and retain the best people byrewarding superior performance and giving themopportunities to expand their skills, develop their potentialand apply their creativity.
DirectorsDetails of the directors of the Company are given onpage 30. All the directors shown served throughout the yearwith the exception of Mr J C Gandur, who resigned on4 October 1999, Mr A Ashiabor, Mr E N Awoonor, Dr C ACrocker, Dr K Duffuor and Dr M P Martineau, who wereappointed on 22 February 2000, The Rt. Hon. The BaronessChalker of Wallasey PC and Mr T Gibian, who wereappointed on 24 March 2000 and Dr D R Creed, who wasappointed on 7 April 2000. All of the directors appointed inthe current year will retire and offer themselves for electionat the Annual General Meeting.
Since the year end, Mr R K Peprah resigned as a director andChairman of the Board on 11 February 2000 and wassucceeded as acting Chairman by Mr P M Tarsh.
The directors retiring by rotation at the Annual GeneralMeeting are Mr K Ansah, Mr H K A Otoo, Mr N J Morrelland Mr P M Tarsh of whom only Mr Morrell offers himselffor re-election. Sir William Ryrie, who has reached retirementage for non-executive directors, will also retire at the AnnualGeneral Meeting.
As non-executives, none of the directors offering themselvesfor election or re-election has a service agreement.
As part of a general restructuring of the Board,Mr M B Keatley and Mr F Ohene-Kena will retire asdirectors at the Annual General Meeting and Mrs M Botsio-Phillips will become a substitute director for Mrs E D Ofori Atta.
Directors’ InterestsThe interests of the directors holding office at the end of theyear in the ordinary shares of the Company are shown innote 24 to the financial statements.
None of the directors had any interests in the shares of any ofthe Company’s subsidiaries at any time during the year. None ofthe directors had a material interest in any contract ofsignificance with the Group during the year, other thanMr S E Jonah, who had an interest in a Technical ServicesAgreement dated 14 March 1994 between the Company andLonmin Plc. Under this agreement, Lonmin Plc has agreed toprovide to Ashanti technical services and the services ofMr S E Jonah. As remuneration for such services, the Companypaid Lonmin Plc a total of US$1.8 million during the year.
Share CapitalDetails of the changes in the share capital during the yearincluding treasury shares and the number of ordinary sharesreserved for issue at the year end are shown in note 23 to thefinancial statements.
As has been our annual practice, the directors are seekingrenewal at the Annual General Meeting of the authority toallot shares for cash with a disapplication of pre-emptionrights. Similarly authority for the Company to purchase itsown shares, as and if appropriate, is being sought.
DonationsCharitable donations for the year amounted toUS$0.3 million. No donations were made for politicalpurposes.
Substantial ShareholdersDetails of the Company’s 20 largest shareholders are shownon page 59.
AuditorsPannell Kerr Forster have indicated their intention to stepdown as joint auditors of the Company after the AnnualGeneral Meeting and Deloitte & Touche have agreed tocontinue as the Company’s sole auditors. A resolution toauthorise the directors to determine the auditors’remuneration will be proposed at the Annual GeneralMeeting.
Annual General MeetingThe Annual General Meeting will be held at the Len ClayStadium, Obuasi, Ghana on Tuesday 30 May 2000 at 11.00 a.m. Full details are given in the Notice of Meeting onpage 62.
By order of the Board
Philip M Tarsh Sam E JonahChairman Chief Executive and
Group Managing Director
12 April 2000 12 April 2000
Report of the Directors 31
Corporate Governance
Statement of Compliance with the Provisions of the CombinedCodeAll companies listed on the London Stock Exchange, otherthan overseas companies such as the Company, are required toreport on their compliance with the Combined Code onCorporate Governance, which forms part of the Listing Rulesof the London Stock Exchange. Notwithstanding thisdispensation, the Board reports that the Company, in applyingthe principles of good governance, has complied throughoutthe year with the provisions of Section 1 of the CombinedCode, except for paragraphs A.3.2, A.6.2, B.1.7 and B.3.1,where the requirements differ from general practice in Ghana.
Statement of Appliance of the Principles of the Combined CodeThe Board of directors, which currently comprises sixexecutive and fourteen non-executive directors, meetsformally at least five times a year. During 1999, the Boardmet more than twenty times due to the financial crisis thatwas faced by the Group. The Board’s primary role is todetermine the Group’s long-term direction and strategy andto monitor the management of the business to ensure thatagreed performance targets are achieved.
The strong representation of non-executive directors on theBoard, who are drawn from a wide variety of backgrounds,brings a broad diversity of experience to the business.
There is a clear separation between the roles of the Chairmanand the Chief Executive. The Chairman is responsible for theeffectiveness of the Board, the balance of membership andfor ensuring that all directors’ views are heard. The ChiefExecutive is responsible for the day-to-day operation of thebusiness and for developing future strategies. In this, he isassisted by his fellow executive directors and the other seniormanagers who, together, form the Chief Executive’sCommittee as detailed on page 61.
Biographical details of the Board of directors and a briefdescription of the roles and functions of the principal Boardcommittees are given on page 30.
The Remuneration & Nomination Committee is responsible fordetermining the level and composition of the executive directors’remuneration, linked to corporate performance targets.
Regular meetings are held with institutional shareholders,fund managers and brokers’ analysts, which also include visitsto the Company’s operations, with a view to ensuring that theplans and objectives of the Company are fully understood.
Shareholders’ interests and the Group’s assets are safeguarded bya system of internal control overseen by the Audit Committee.
Internal ControlThe Group has adopted the transitional approach for theinternal control aspects of the Combined Code as set out inthe letter from the London Stock Exchange dated27 September 1999. During 1999 the Group Internal AuditDepartment initiated a review of the Group’s risk managementprocesses and controls throughout its operations. Riskidentification and assessment training was provided to ensureongoing procedures for identifying, evaluating and managing
risk under the control of risk committees, which have been orare being established at each operating location and corporateoffice. We expect these procedures to be fully in place by30 September 2000.
The directors’ review of the effectiveness of the Group’ssystem of internal control for which they are responsible wasrestricted to a review of the effectiveness of internal financialcontrol, as permitted by the London Stock Exchange. Indischarging that responsibility, the directors have evolved asystem of financial control which is designed to safeguard theassets of the Group and the integrity of its accountingrecords, although such a system can provide only reasonable,but not absolute, assurance against material misstatement orloss. The directors have reviewed the effectiveness of theGroup’s system of internal financial control for the year andthe period to the date of approval of the financial statementsand have considered the major business risks and the controlenvironment. These controls and procedures include:
Organisational StructureThe Group operates through a clearly defined organisationalstructure. The Board of directors, which meets regularly, isresponsible for overall strategy, while the Chief Executiveand Group Managing Director, assisted by the ChiefExecutive’s Committee, has day to day operationalresponsibility. The Finance Committee is responsible formonitoring operational profitability and asset utilisation.
Financial ReportingBudgets are prepared annually for financial performance,operating costs and capital expenditure. Financial informationis produced monthly and monitored against budgets.Variances are considered by the relevant management andappropriate action taken. Financial information is reviewed inrelation to comprehensive information regarding productioninformation, primarily quantities and grades.
Approval ProceduresSystems are in place to ensure that transactions in respect ofmajor areas of risk are subject to approval procedures,including the need for Finance Committee approval of anysignificant capital expenditure.
Controls over Hedging TransactionsThe hedging programme is carried out within the riskmanagement policy approved by the Board. Controls includethe authorisation procedure referred to above, theprohibition of speculative transactions, the separation ofdealing and settlement functions, regular reconciliations ofpositions by the two functions and regular monitoring andreporting of market positions.
Since the year end, the Board has set up a Risk ManagementCommittee responsible for ongoing monitoring of the riskmanagement activities of the treasury function.
Monitoring of ControlsAn internal audit function monitors the control proceduresof the Group. The Audit Committee, comprising certain non-executive directors, monitors the adequacy of theGroup’s systems of internal financial control.
32
Directors’ Responsibilities/Auditors’ Report
Directors’ ResponsibilitiesThe Ghana Companies Code, 1963 (Act 179) (“theCompanies Code”) requires the directors to prepare financialstatements for each financial period which give a true andfair view of the state of affairs of the Company and theGroup as at the end of the financial year and of the profit orloss of the Group for that period. In preparing thosefinancial statements, the directors are required to:
• select suitable accounting policies and then apply themconsistently;
• make judgements and estimates that are reasonableand prudent;
• state whether applicable accounting standards havebeen followed; and
• prepare the financial statements on a going concernbasis unless it is inappropriate to presume that theGroup will continue in business.
The directors are responsible for ensuring that the Groupkeeps accounting records which disclose with reasonableaccuracy the financial position of the Company and theGroup and which enable them to ensure that the financialstatements comply with the Companies Code. They are alsoresponsible for taking such steps as are reasonably open tothem to safeguard the assets of the Company and the Groupand to prevent and detect fraud and other irregularities.
The above statement, should be read in conjunction with thestatement of the auditors’ responsibilities set out below.
33
We have audited the financial statements on pages 34 to 52which have been prepared under the accounting policies setout on pages 38 and 39.
Respective responsibilities of directors and auditorsThe directors are responsible for preparing the AnnualReport, including as described above the financialstatements. Our responsibilities, as independent auditors, areestablished by statute, the United Kingdom AuditingPractices Board, the Listing Rules of the London StockExchange, and by our profession’s ethical guidance.
We report to you our opinion as to whether the financialstatements give a true and fair view and are properly preparedin accordance with the Ghana Companies Code, 1963 (Act179). We also report to you as to whether in our opinion thefinancial statements are in agreement with the books, whetherthe books have been properly kept, whether we obtained theinformation and explanations we required and if, in ouropinion, the directors’ report is not consistent with thefinancial statements.
We review whether the corporate governance statement onpage 32 reflects the Company’s compliance with the sevenprovisions of the Combined Code specified for our review bythe Stock Exchange, and we report if it does not. We are notrequired to consider whether the Board’s statements oninternal control cover all risks and controls, or form anopinion on the effectiveness of the Group’s corporategovernance procedures or its risk and control procedures. Weread the other information contained in the Annual Report,including the corporate governance statement, and considerwhether it is consistent with the audited financial statements.We consider the implications for our report if we becomeaware of any apparent misstatement or materialinconsistencies with the financial statements.
Basis of Audit OpinionWe conducted our audit in accordance with Auditing Standardsissued by the United Kingdom Auditing Practices Board. An
audit includes examination, on a test basis, of evidence relevantto the amounts and disclosures in the financial statements. Italso includes an assessment of the significant estimates andjudgements made by the directors in the preparation of thefinancial statements and of whether the accounting policies areappropriate to the Company’s and Group’s circumstances,consistently applied and adequately disclosed.
We planned and performed our audit so as to obtain all theinformation and explanations which we considered necessaryin order to provide us with sufficient evidence to givereasonable assurance that the financial statements are freefrom material misstatement, whether caused by fraud orother irregularity or error. In forming our opinion we alsoevaluated the overall adequacy of the presentation ofinformation in the financial statements.
In forming our opinion, we have considered the adequacy ofthe disclosures made in note 1 to the financial statementsconcerning the uncertainty as to the Group meeting itscommitments under the terms of its banking arrangements.In view of the significance of this uncertainty, we considerthat it should be drawn to your attention but our opinion isnot qualified in this respect.
OpinionThe financial statements are in agreement with the books,which in our opinion have been properly kept. We obtainedthe information and explanations we required. In ouropinion the financial statements give a true and fair view ofthe state of affairs of the Company and the Group as at31 December 1999 and of the loss of the Group for the yearthen ended and have been properly prepared in accordancewith the Ghana Companies Code, 1963 (Act 179) andUnited Kingdom Accounting Standards.
Deloitte & Touche Pannell Kerr ForsterAccra, Ghana Accra, Ghana
12 April 2000 12 April 2000
Auditors’ Reportto the shareholders of Ashanti Goldfields Company Limited
1999 1998Before After Before After
exceptional Exceptional exceptional exceptional Exceptional exceptionalitems items items items items items
Notes US$m US$m US$m US$m US$m US$m
Turnover 2 582.1 – 582.1 600.3 – 600.3
Operating costs 3, 4 (358.7) (49.1) (407.8) (379.6) (9.2) (388.8)Royalties (12.2) – (12.2) (12.6) – (12.6)Depreciation 4 (114.9) (30.0) (144.9) (108.6) – (108.6)
Total costs (485.8) (79.1) (564.9) (500.8) (9.2) (510.0)
Operating profit 5 96.3 (79.1) 17.2 99.5 (9.2) 90.3Exceptional provision for loss on disposal of fixed assets 6 – (171.1) (171.1) – – –Profit/(loss) on sale/termination of businesses 7 – 0.2 0.2 – (24.0) (24.0)
Profit/(loss) on ordinary activities before interest 96.3 (250.0) (153.7) 99.5 (33.2) 66.3Net interest payable 9 (29.9) – (29.9) (23.2) – (23.2)
Profit/(loss) on ordinary activities before taxation 66.4 (250.0) (183.6) 76.3 (33.2) 43.1Taxation 10 (2.7) – (2.7) – – –
Profit/(loss) on ordinary activities after taxation 63.7 (250.0) (186.3) 76.3 (33.2) 43.1Equity minority interests 2.4 – 2.4 (2.4) – (2.4)
Profit/(loss) attributable to shareholders 66.1 (250.0) (183.9) 73.9 (33.2) 40.7Dividend 11 – – – (10.9) – (10.9)
Retained profit/(loss) for the year 25 66.1 (250.0) (183.9) 63.0 (33.2) 29.8
Earnings per share (US$) 12 0.59 (2.23) (1.64) 0.68 (0.31) 0.37Diluted earnings per share (US$) 12 0.54 (2.30) (1.76) 0.68 (0.31) 0.37
Group Profit and Loss AccountFor the year ended 31 December
34
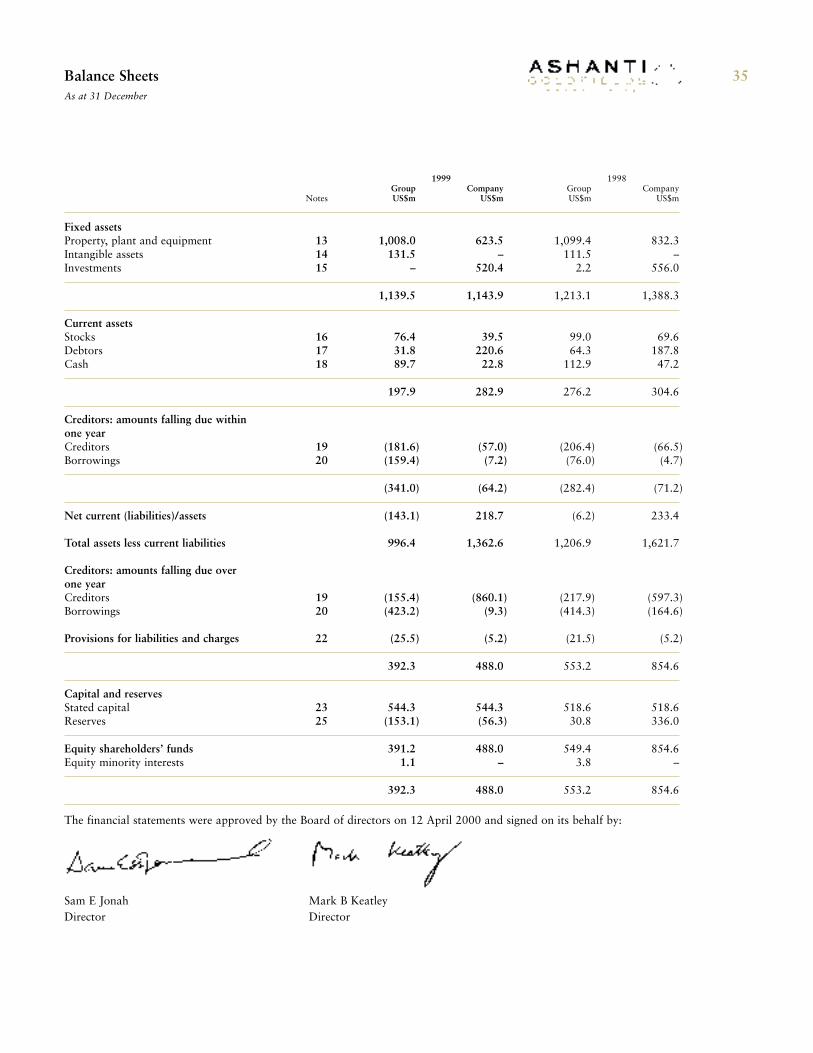
1999 1998Group Company Group Company
Notes US$m US$m US$m US$m
Fixed assetsProperty, plant and equipment 13 1,008.0 623.5 1,099.4 832.3Intangible assets 14 131.5 – 111.5 –Investments 15 – 520.4 2.2 556.0
1,139.5 1,143.9 1,213.1 1,388.3
Current assetsStocks 16 76.4 39.5 99.0 69.6Debtors 17 31.8 220.6 64.3 187.8Cash 18 89.7 22.8 112.9 47.2
197.9 282.9 276.2 304.6
Creditors: amounts falling due within one yearCreditors 19 (181.6) (57.0) (206.4) (66.5)Borrowings 20 (159.4) (7.2) (76.0) (4.7)
(341.0) (64.2) (282.4) (71.2)
Net current (liabilities)/assets (143.1) 218.7 (6.2) 233.4
Total assets less current liabilities 996.4 1,362.6 1,206.9 1,621.7
Creditors: amounts falling due over one yearCreditors 19 (155.4) (860.1) (217.9) (597.3)Borrowings 20 (423.2) (9.3) (414.3) (164.6)
Provisions for liabilities and charges 22 (25.5) (5.2) (21.5) (5.2)
392.3 488.0 553.2 854.6
Capital and reservesStated capital 23 544.3 544.3 518.6 518.6Reserves 25 (153.1) (56.3) 30.8 336.0
Equity shareholders’ funds 391.2 488.0 549.4 854.6Equity minority interests 1.1 – 3.8 –
392.3 488.0 553.2 854.6
The financial statements were approved by the Board of directors on 12 April 2000 and signed on its behalf by:
Sam E Jonah Mark B KeatleyDirector Director
Balance SheetsAs at 31 December
35
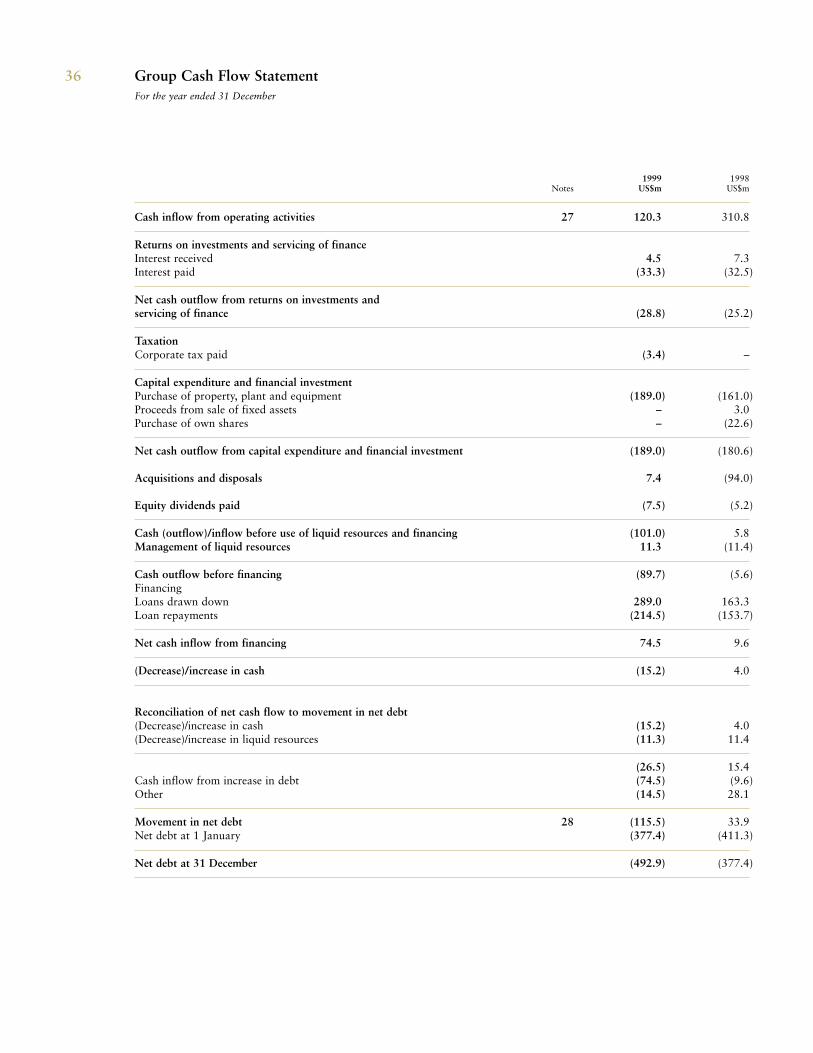
1999 1998Notes US$m US$m
Cash inflow from operating activities 27 120.3 310.8
Returns on investments and servicing of financeInterest received 4.5 7.3Interest paid (33.3) (32.5)
Net cash outflow from returns on investments andservicing of finance (28.8) (25.2)
TaxationCorporate tax paid (3.4) –
Capital expenditure and financial investmentPurchase of property, plant and equipment (189.0) (161.0)Proceeds from sale of fixed assets – 3.0Purchase of own shares – (22.6)
Net cash outflow from capital expenditure and financial investment (189.0) (180.6)
Acquisitions and disposals 7.4 (94.0)
Equity dividends paid (7.5) (5.2)
Cash (outflow)/inflow before use of liquid resources and financing (101.0) 5.8Management of liquid resources 11.3 (11.4)
Cash outflow before financing (89.7) (5.6)FinancingLoans drawn down 289.0 163.3Loan repayments (214.5) (153.7)
Net cash inflow from financing 74.5 9.6
(Decrease)/increase in cash (15.2) 4.0
Reconciliation of net cash flow to movement in net debt(Decrease)/increase in cash (15.2) 4.0(Decrease)/increase in liquid resources (11.3) 11.4
(26.5) 15.4Cash inflow from increase in debt (74.5) (9.6)Other (14.5) 28.1
Movement in net debt 28 (115.5) 33.9Net debt at 1 January (377.4) (411.3)
Net debt at 31 December (492.9) (377.4)
Group Cash Flow StatementFor the year ended 31 December
36
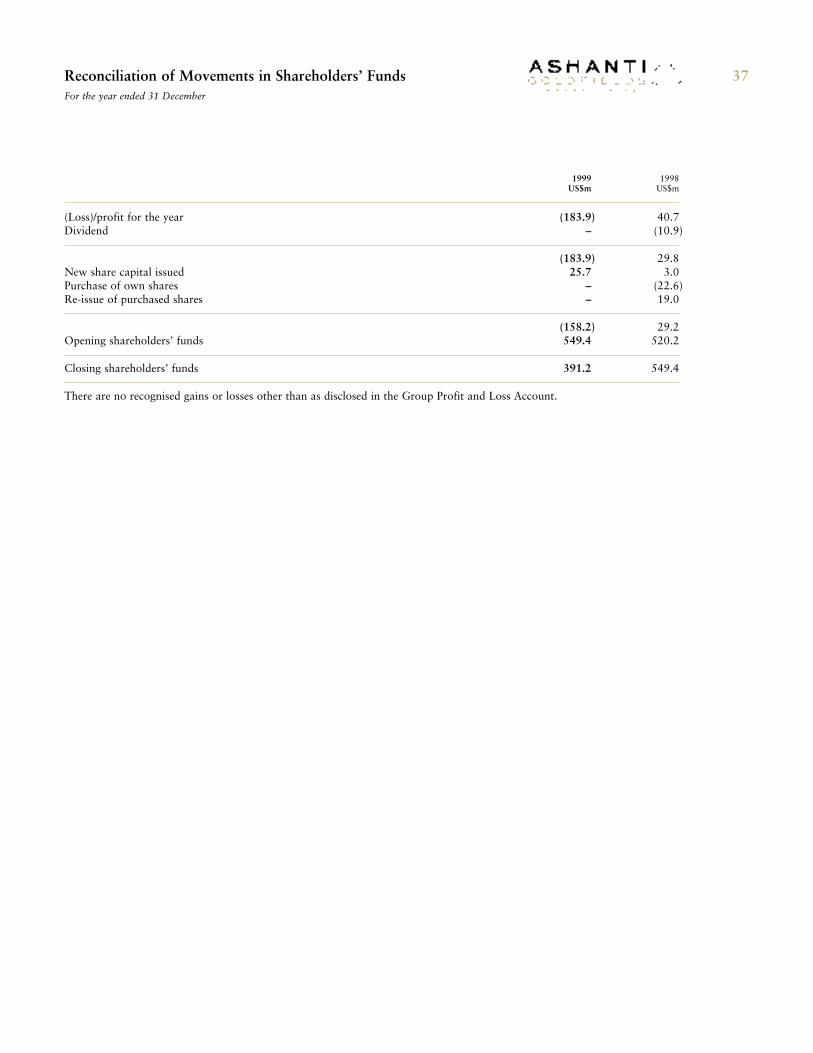
1999 1998US$m US$m
(Loss)/profit for the year (183.9) 40.7Dividend – (10.9)
(183.9) 29.8New share capital issued 25.7 3.0Purchase of own shares – (22.6)Re-issue of purchased shares – 19.0
(158.2) 29.2Opening shareholders’ funds 549.4 520.2
Closing shareholders’ funds 391.2 549.4
There are no recognised gains or losses other than as disclosed in the Group Profit and Loss Account.
Reconciliation of Movements in Shareholders’ FundsFor the year ended 31 December
37
1 Accounting policiesThe principal accounting policies adopted by the Group and used in the preparation of these financial statements are set outbelow. The accounting policies used in preparing the financial statements are consistent with those used by the Group in itsfinancial statements for the period ended 31 December 1998 except as noted below.
In the year ended 31 December 1999 a number of changes in accounting policy has been introduced in order to implementthe requirements of new Financial Reporting Standards.
The Group has adopted the requirements of the following Financial Reporting Standards:FRS 12 – Provisions, contingent liabilities and contingent assets.FRS 13 – Derivatives and other financial instruments: disclosures.FRS 14 – Earnings per share.FRS 15 – Tangible Fixed Assets.The changes arising from the implementation of FRS 12 are set out in the policy below on environmental and site restorationobligations. The disclosures required by FRS 13 have been included in the financial statements. The calculation of earningsper share have been revised to comply with FRS 14 and the requirements of FRS 15 have been adopted early.
Basis of preparationAfter making enquiries, the directors have formed a judgement, at the time of approving the financial statements, that thereis reasonable expectation that the Group has adequate resources to continue in operational existence for the foreseeablefuture. On this basis, the directors consider it appropriate to prepare the financial statements on a going concern basis.It should be noted, however, that the Group has significant commitments in 2000 under the terms of the bankingarrangements, including the need to raise US$200 million by 30 September 2000 from asset sales, in order to retire aUS$100 million bridge loan facility and repay US$151 million of the US$326 million RCF by 31 December 2000. The Groupexpects to repay these facilities from the proceeds of the sale of a 50 per cent interest in the Geita project in Tanzania. Inconnection with this Ashanti announced in early April 2000 that it had signed a non-binding Heads of Agreement withAngloGold Group.
Basis of accountingThe financial statements have been prepared under the historical cost convention and in accordance with applicable UnitedKingdom Accounting Standards.Because the Group earns all its revenue in US dollars and the majority of its transactions are in US dollars, or based on them,the Group’s functional and reporting currency is US dollars.
Basis of consolidationThe Group accounts comprise a consolidation of the results, assets and liabilities of the Company and its subsidiaryundertakings. The results and cash flows of subsidiaries acquired or disposed of in the year are included in the consolidatedprofit and loss account and the consolidated cash flow statement from the date of acquisition or up to the date of disposal.Investments in associated undertakings are accounted for under the equity accounting method. An associated undertaking isone in which the Group’s interest is considered to be long term and is substantial and over which the Group exercises asignificant influence.Businesses that were acquired with the sole intention of a subsequent resale are included as a current asset valued at netrealisable value. The trading results of these businesses are not consolidated in the Group profit and loss account.
GoodwillGoodwill, arising from the purchase of subsidiary undertakings and interests in associates and joint ventures represents theexcess of the fair value of the purchase consideration over the fair value of the net assets acquired. Goodwill in accordanccewith FRS 10 is capitalised and amortised over the life of the underlying mine assets. Prior to 1 January 1998, goodwill wascharged to reserves in the year of acquisition.On the subsequent disposal or termination of a previously acquired business, the profit or loss on disposal or termination iscalculated after charging or crediting the amount of any goodwill previously charged to reserves or capitalised and not yetcharged to the profit and loss account.
Transactions in other currenciesMonetary assets and liabilities denominated in currencies other than the US dollar are translated at the rates of exchangeruling at the year end. Transactions denominated in currencies other than US dollars are translated at the rates ruling at thedates of the transactions. All translation differences are taken to the profit and loss account.
Revenue recognitionSale of bullion is recognised when doré is produced in the gold room. The proceeds from sales of bullion producedimmediately prior to the year end but which have not been received are included as ‘gold in transit’ within cash balances.Property, plant and equipmentTangible assets are recorded at cost less depreciation. Repairs and maintenance expenditures are charged against profits;major improvements and replacements which extend the useful life of an asset are capitalised.Costs associated with initial or grass roots exploration are charged against profits in the year in which they are incurred.When it has been established that a mineral property has development potential, further exploration costs and the costs ofdeveloping the mine, are capitalised. Major development expenditures incurred to expose the ore body, to increaseproduction or extend the life of the mine are capitalised.
Notes to the Financial Statements38
1 Accounting policies (continued)
Depreciation is provided, other than on assets in the course of construction, so as to amortise the assets over their estimateduseful economic lives of the specific assets concerned or the life of the mine as follows:(a) Shafts, development and pre-production costs, plant and equipment and processing plants are depreciated using the unit
of production method based on recoverable proved and probable gold reserves at the commencement of the year, or ona straight line basis over their estimated useful lives if shorter.For assets depreciated on a straight line basis, the estimated useful lives range from three years for software to five yearsfor vehicles and five to 15 years for plant and equipment.
(b) Buildings are depreciated using the straight line method, based on an estimated useful life of up to 30 years.(c) Assets in the course of construction are depreciated in accordance with the policies described above from the time that
they become operational.Interest costs related to the period of construction of mines are included in the costs of such assets and are depreciated aspart of the total cost.Tangible fixed assets are reviewed for impairment if events or changes in circumstances indicate that the carrying amountmay not be recoverable. When a review for impairment is conducted, the recoverable amount is assessed by reference to thenet present value of the expected future cash flows of the relevant operation or its disposable value, if higher, in accordancewith FRS 11.
StocksStocks are valued at the lower of cost and net realisable value (which includes an appropriate proportion of productionoverheads).
Interest and finance costsInterest payable is charged against profits in the year in which it arises.Front end fees, commitment fees, and other costs associated with the initial loan are brought into account and amortisedover the term of the loan.Interest costs directly related to funding mine development are included as part of the capital cost up to the start ofcommercial operations.
Financial InstrumentsIn order to protect against the impact of falling bullion prices, the Group enters into hedging transactions which provide aminimum price for future production and allow the Group to take advantage of increases in the gold price. Hedgingtransactions include spot deferred, gold price swaps and forward sale contracts, put and call option contracts and gold loans. Gains and losses on all hedging contracts, including premiums receivable and payable on options, are recognised in the profitand loss account as designated production is delivered. In the case of early settlement of hedge contracts, gains or losses aredeferred and brought into income at the originally designated delivery date.
Deferred taxationProvision is made for deferred taxation only to the extent that it is probable that a liability or asset will crystallise in theforeseeable future.
Environmental and site restoration obligationsMining operations are generally required to restore mine and processing sites at the end of their producing lives to a conditionacceptable to the relevant authorities and consistent with the Group’s environmental policies. The expected cost of anycommitted decommissioning or restoration programme, discounted to its net present value is provided and capitalised at thebeginning of each project and amortised over the life of the mine concerned. Although this is a change in accounting policy fromthe previous method of accruing for such costs over the life of the mine concerned it had no material effect on prior years’provisions. The new accounting policy has resulted in US$4.3 million of the increase in provision during 1999 being capitalised.
Stripping costsPre-stripping costs are the costs of removing overburden to expose ore. These costs are capitalised prior to the commencementof production and are expensed on a unit of production basis relative to the mine’s estimated surface ore reserves.
Stripping costs are the costs associated with the removal of waste materials after ore has been exposed. These costs aredeferred and expensed relative to waste materials associated with the ore mined during the period under review.
InvestmentsIn the Company balance sheet, investments in subsidiary undertakings are stated at cost less provision for any permanentdiminution in value.
Leased assetsAssets acquired under finance leases are included in the balance sheet at cost less depreciation. The present value of futurerentals is shown as a liability.The interest element of rental obligations is charged to the profit and loss account over the period of the lease in proportionto the balance of capital repayments outstanding.Rentals payable under operating leases are charged to the profit and loss account as incurred.
Notes to the Financial Statements 39
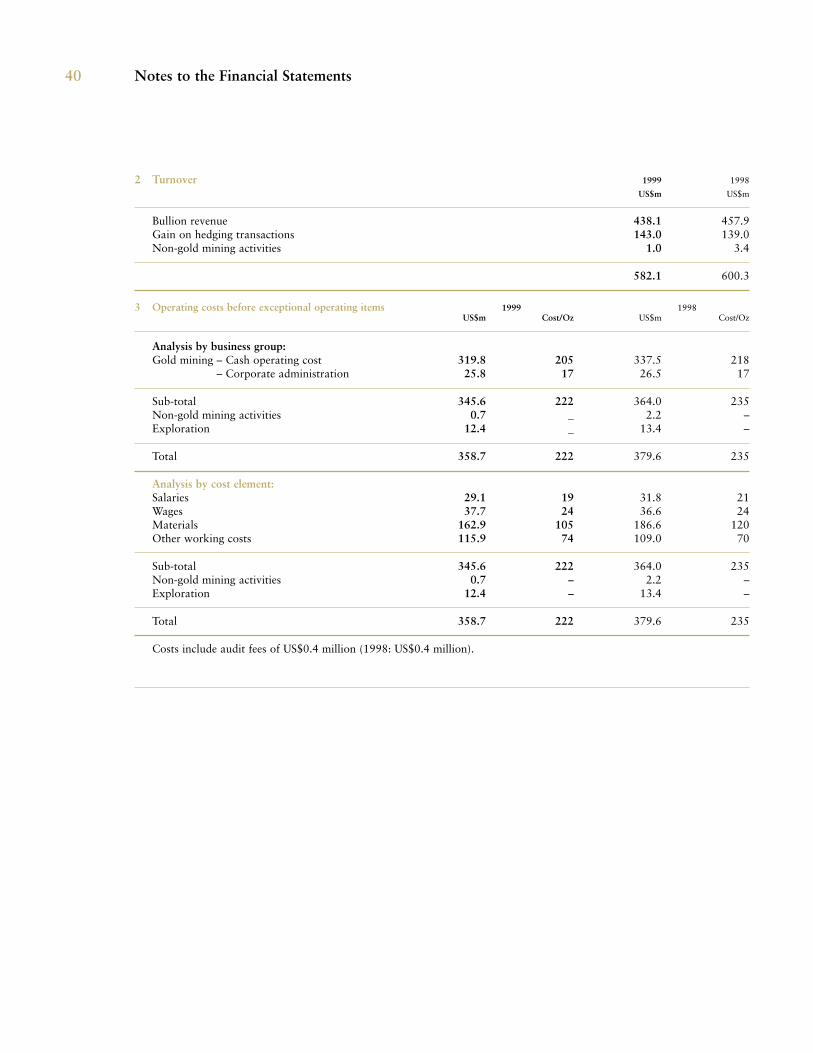
2 Turnover 1999 1998
US$m US$m
Bullion revenue 438.1 457.9Gain on hedging transactions 143.0 139.0Non-gold mining activities 1.0 3.4
582.1 600.3
3 Operating costs before exceptional operating items 1999 1998US$m Cost/Oz US$m Cost/Oz
Analysis by business group:Gold mining – Cash operating cost 319.8 205 337.5 218Gold mining – Corporate administration 25.8 17 26.5 17
Sub-total 345.6 222 364.0 235Non-gold mining activities 0.7 _ 2.2 –Exploration 12.4 _ 13.4 –
Total 358.7 222 379.6 235
Analysis by cost element:Salaries 29.1 19 31.8 21Wages 37.7 24 36.6 24Materials 162.9 105 186.6 120Other working costs 115.9 74 109.0 70
Sub-total 345.6 222 364.0 235Non-gold mining activities 0.7 – 2.2 –Exploration 12.4 – 13.4 –
Total 358.7 222 379.6 235
Costs include audit fees of US$0.4 million (1998: US$0.4 million).
Notes to the Financial Statements40
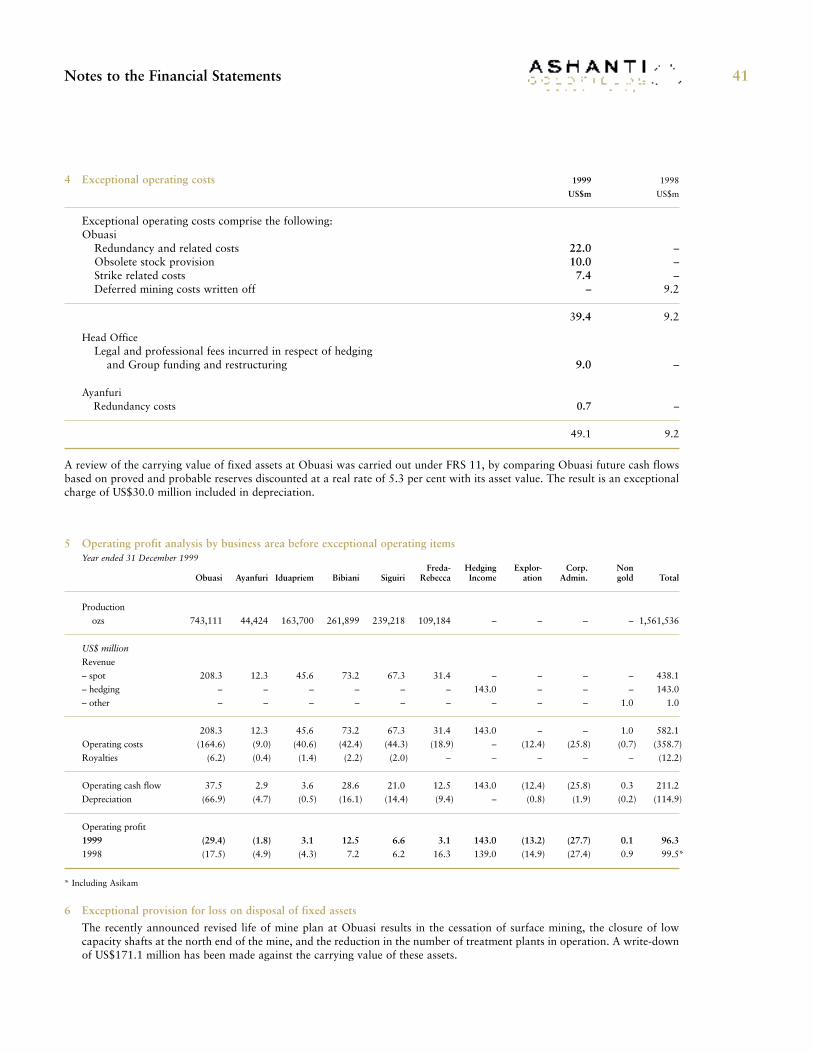
4 Exceptional operating costs 1999 1998
US$m US$m
Exceptional operating costs comprise the following:Obuasi
Redundancy and related costs 22.0 –Obsolete stock provision 10.0 –Strike related costs 7.4 –Deferred mining costs written off – 9.2
39.4 9.2
Head OfficeLegal and professional fees incurred in respect of hedging
and Group funding and restructuring 9.0 –
AyanfuriRedundancy costs 0.7 –
49.1 9.2
A review of the carrying value of fixed assets at Obuasi was carried out under FRS 11, by comparing Obuasi future cash flowsbased on proved and probable reserves discounted at a real rate of 5.3 per cent with its asset value. The result is an exceptionalcharge of US$30.0 million included in depreciation.
5 Operating profit analysis by business area before exceptional operating itemsYear ended 31 December 1999
Freda- Hedging Explor- Corp. NonObuasi Ayanfuri Iduapriem Bibiani Siguiri Rebecca Income ation Admin. gold Total
Production
ozs 743,111 44,424 163,700 261,899 239,218 109,184 – – – – 1,561,536
US$ million
Revenue
– spot 208.3 12.3 45.6 73.2 67.3 31.4 – – – – 438.1
– hedging – – – – – – 143.0 – – – 143.0
– other – – – – – – – – – 1.0 1.0
208.3 12.3 45.6 73.2 67.3 31.4 143.0 – – 1.0 582.1
Operating costs (164.6) (9.0) (40.6) (42.4) (44.3) (18.9) – (12.4) (25.8) (0.7) (358.7)
Royalties (6.2) (0.4) (1.4) (2.2) (2.0) – – – – – (12.2)
Operating cash flow 37.5 2.9 3.6 28.6 21.0 12.5 143.0 (12.4) (25.8) 0.3 211.2
Depreciation (66.9) (4.7) (0.5) (16.1) (14.4) (9.4) – (0.8) (1.9) (0.2) (114.9)
Operating profit
1999 (29.4) (1.8) 3.1 12.5 6.6 3.1 143.0 (13.2) (27.7) 0.1 96.31998 (17.5) (4.9) (4.3) 7.2 6.2 16.3 139.0 (14.9) (27.4) 0.9 99.5*
* Including Asikam
6 Exceptional provision for loss on disposal of fixed assets
The recently announced revised life of mine plan at Obuasi results in the cessation of surface mining, the closure of lowcapacity shafts at the north end of the mine, and the reduction in the number of treatment plants in operation. A write-downof US$171.1 million has been made against the carrying value of these assets.
Notes to the Financial Statements 41
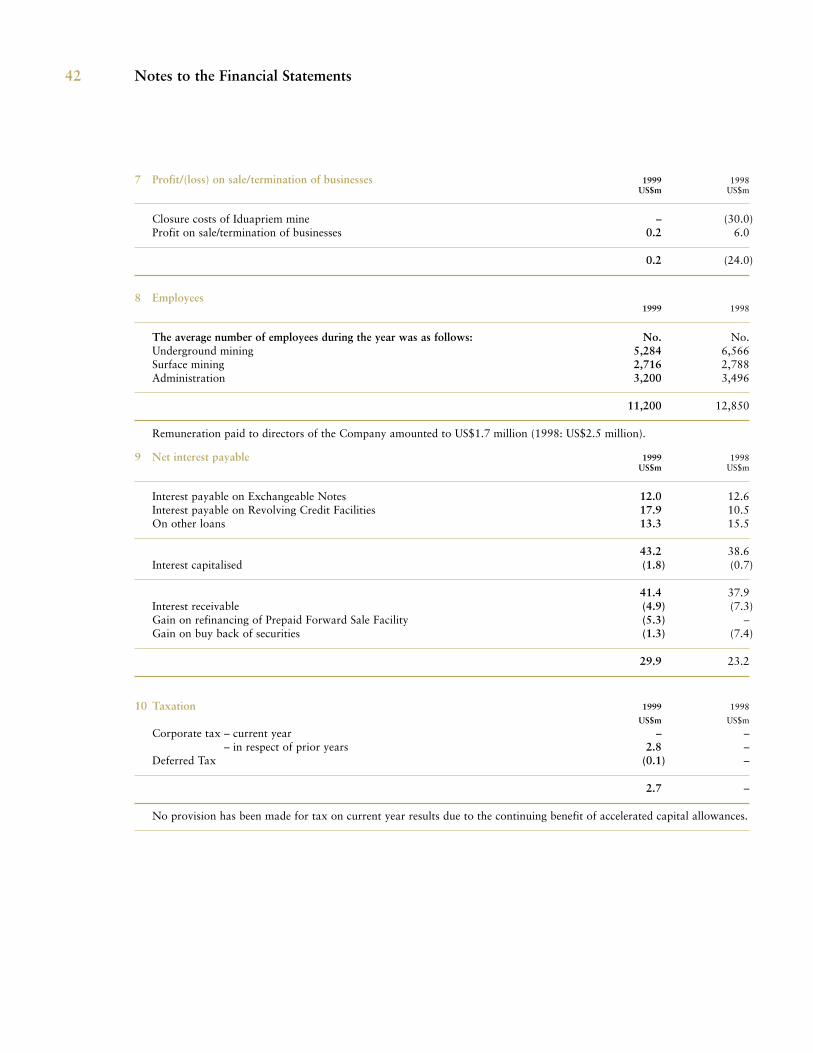
7 Profit/(loss) on sale/termination of businesses 1999 1998US$m US$m
Closure costs of Iduapriem mine – (30.0)Profit on sale/termination of businesses 0.2 6.0
0.2 (24.0)
8 Employees1999 1998
The average number of employees during the year was as follows: No. No.Underground mining 5,284 6,566Surface mining 2,716 2,788Administration 3,200 3,496
11,200 12,850
Remuneration paid to directors of the Company amounted to US$1.7 million (1998: US$2.5 million).
9 Net interest payable 1999 1998US$m US$m
Interest payable on Exchangeable Notes 12.0 12.6Interest payable on Revolving Credit Facilities 17.9 10.5On other loans 13.3 15.5
43.2 38.6Interest capitalised (1.8) (0.7)
41.4 37.9Interest receivable (4.9) (7.3)Gain on refinancing of Prepaid Forward Sale Facility (5.3) –Gain on buy back of securities (1.3) (7.4)
29.9 23.2
10 Taxation 1999 1998
US$m US$m
Corporate tax – current year – –Corporate tax – in respect of prior years 2.8 –Deferred Tax (0.1) –
2.7 –
No provision has been made for tax on current year results due to the continuing benefit of accelerated capital allowances.
Notes to the Financial Statements42
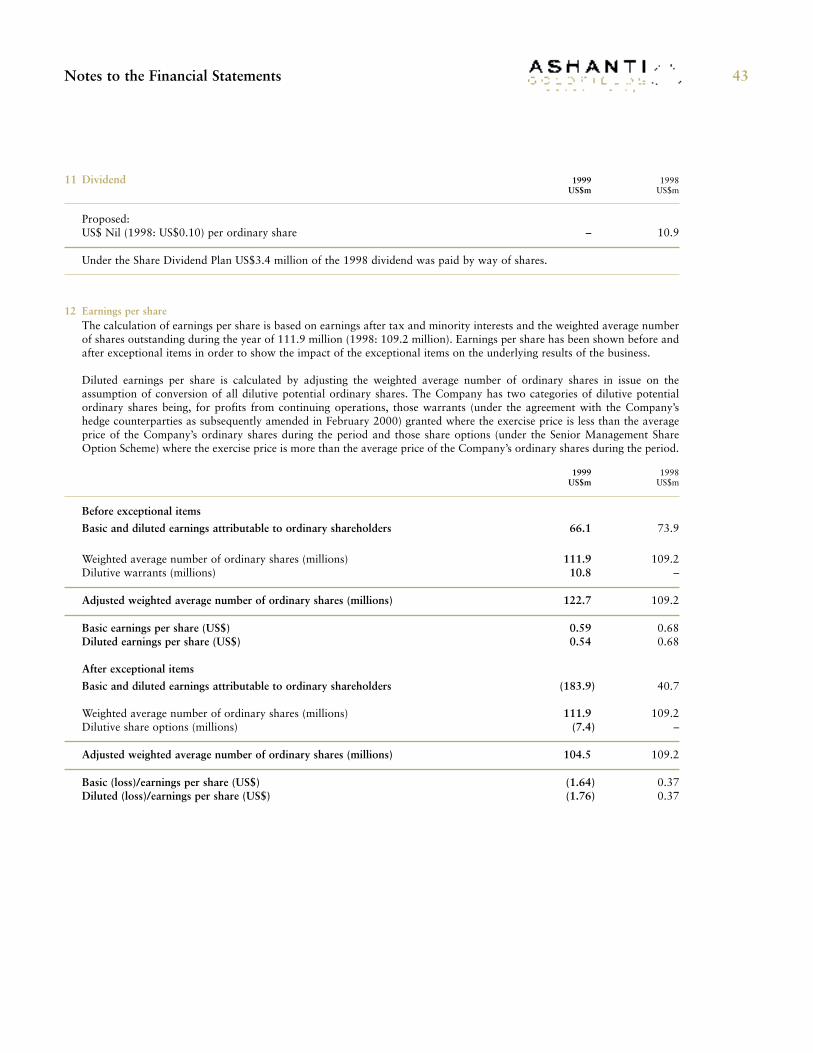
11 Dividend 1999 1998US$m US$m
Proposed:US$ Nil (1998: US$0.10) per ordinary share – 10.9
Under the Share Dividend Plan US$3.4 million of the 1998 dividend was paid by way of shares.
12 Earnings per shareThe calculation of earnings per share is based on earnings after tax and minority interests and the weighted average numberof shares outstanding during the year of 111.9 million (1998: 109.2 million). Earnings per share has been shown before andafter exceptional items in order to show the impact of the exceptional items on the underlying results of the business.
Diluted earnings per share is calculated by adjusting the weighted average number of ordinary shares in issue on theassumption of conversion of all dilutive potential ordinary shares. The Company has two categories of dilutive potentialordinary shares being, for profits from continuing operations, those warrants (under the agreement with the Company’shedge counterparties as subsequently amended in February 2000) granted where the exercise price is less than the averageprice of the Company’s ordinary shares during the period and those share options (under the Senior Management ShareOption Scheme) where the exercise price is more than the average price of the Company’s ordinary shares during the period.
1999 1998US$m US$m
Before exceptional items
Basic and diluted earnings attributable to ordinary shareholders 66.1 73.9
Weighted average number of ordinary shares (millions) 111.9 109.2Dilutive warrants (millions) 10.8 –
Adjusted weighted average number of ordinary shares (millions) 122.7 109.2
Basic earnings per share (US$) 0.59 0.68Diluted earnings per share (US$) 0.54 0.68
After exceptional items
Basic and diluted earnings attributable to ordinary shareholders (183.9) 40.7
Weighted average number of ordinary shares (millions) 111.9 109.2Dilutive share options (millions) (7.4) –
Adjusted weighted average number of ordinary shares (millions) 104.5 109.2
Basic (loss)/earnings per share (US$) (1.64) 0.37Diluted (loss)/earnings per share (US$) (1.76) 0.37
Notes to the Financial Statements 43
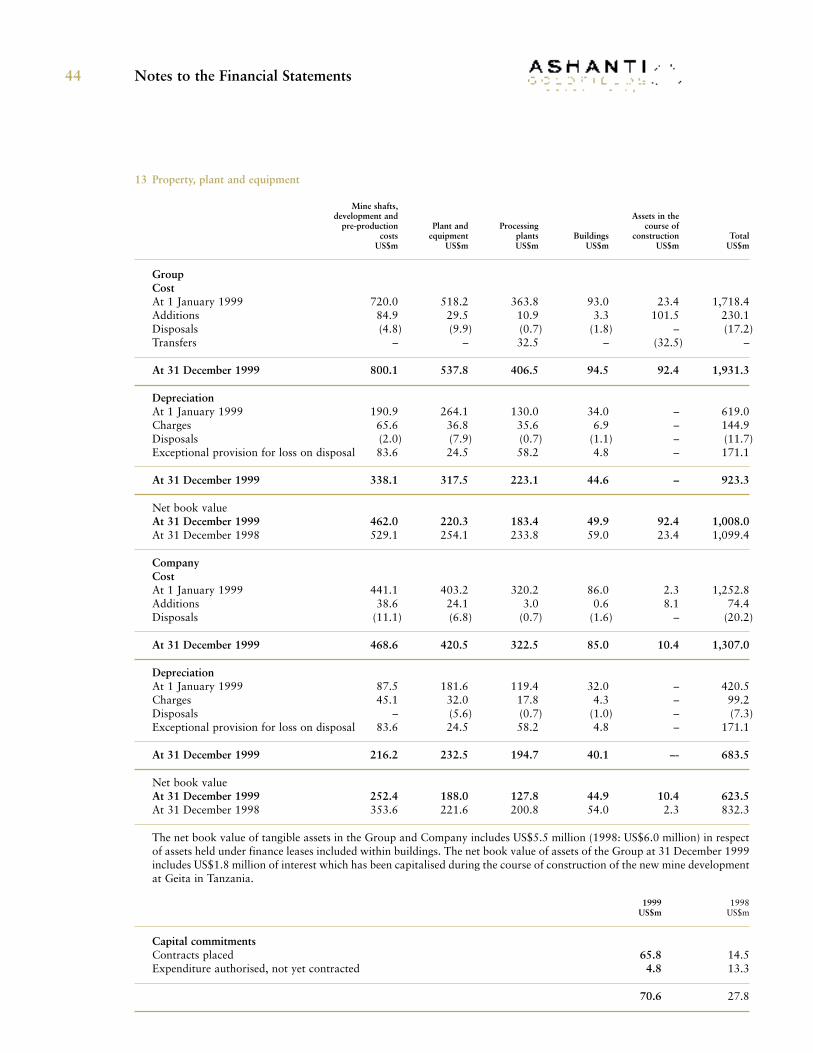
Notes to the Financial Statements 44
13 Property, plant and equipment
Mine shafts,development and Assets in the
pre-production Plant and Processing course ofcosts equipment plants Buildings construction Total
US$m US$m US$m US$m US$m US$m
GroupCostAt 1 January 1999 720.0 518.2 363.8 93.0 23.4 1,718.4Additions 84.9 29.5 10.9 3.3 101.5 230.1Disposals (4.8) (9.9) (0.7) (1.8) – (17.2)Transfers – – 32.5 – (32.5) –
At 31 December 1999 800.1 537.8 406.5 94.5 92.4 1,931.3
DepreciationAt 1 January 1999 190.9 264.1 130.0 34.0 – 619.0Charges 65.6 36.8 35.6 6.9 – 144.9Disposals (2.0) (7.9) (0.7) (1.1) – (11.7)Exceptional provision for loss on disposal 83.6 24.5 58.2 4.8 – 171.1
At 31 December 1999 338.1 317.5 223.1 44.6 – 923.3
Net book valueAt 31 December 1999 462.0 220.3 183.4 49.9 92.4 1,008.0At 31 December 1998 529.1 254.1 233.8 59.0 23.4 1,099.4
CompanyCostAt 1 January 1999 441.1 403.2 320.2 86.0 2.3 1,252.8Additions 38.6 24.1 3.0 0.6 8.1 74.4Disposals (11.1) (6.8) (0.7) (1.6) – (20.2)
At 31 December 1999 468.6 420.5 322.5 85.0 10.4 1,307.0
DepreciationAt 1 January 1999 87.5 181.6 119.4 32.0 – 420.5Charges 45.1 32.0 17.8 4.3 – 99.2Disposals – (5.6) (0.7) (1.0) – (7.3)Exceptional provision for loss on disposal 83.6 24.5 58.2 4.8 – 171.1
At 31 December 1999 216.2 232.5 194.7 40.1 –- 683.5
Net book valueAt 31 December 1999 252.4 188.0 127.8 44.9 10.4 623.5At 31 December 1998 353.6 221.6 200.8 54.0 2.3 832.3
The net book value of tangible assets in the Group and Company includes US$5.5 million (1998: US$6.0 million) in respectof assets held under finance leases included within buildings. The net book value of assets of the Group at 31 December 1999includes US$1.8 million of interest which has been capitalised during the course of construction of the new mine developmentat Geita in Tanzania.
1999 1998US$m US$m
Capital commitmentsContracts placed 65.8 14.5Expenditure authorised, not yet contracted 4.8 13.3
70.6 27.8
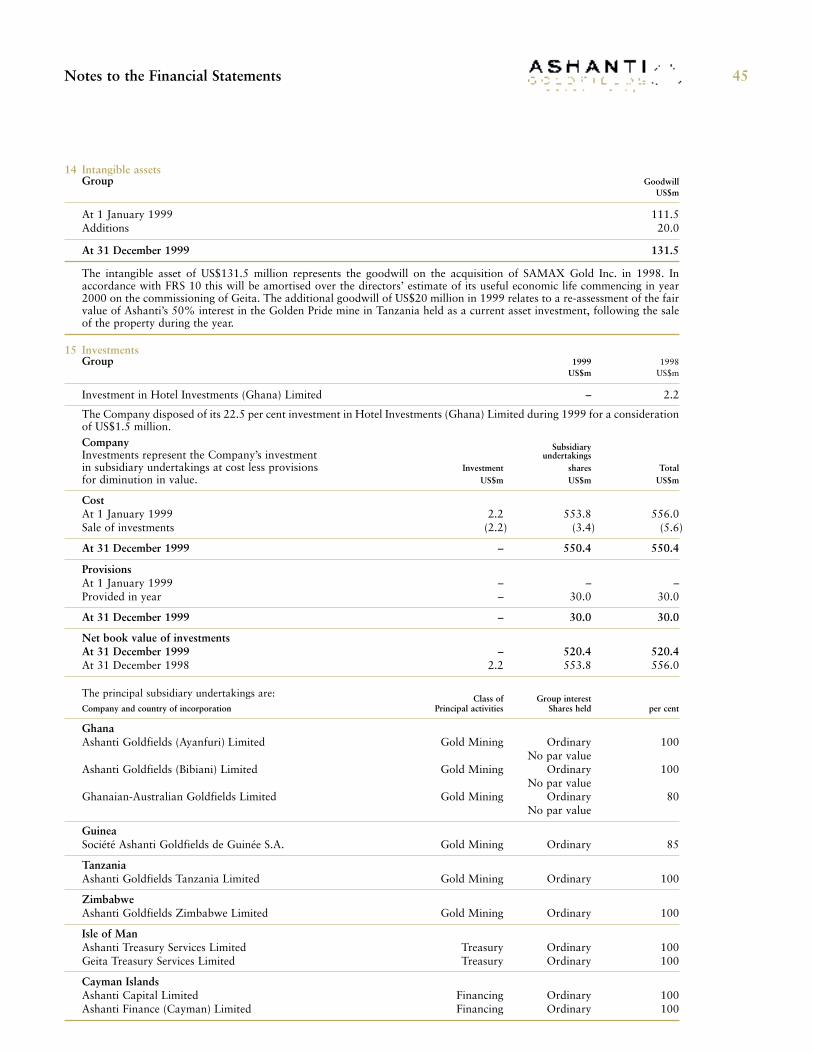
45
14 Intangible assetsGroup Goodwill
US$m
At 1 January 1999 111.5Additions 20.0
At 31 December 1999 131.5
The intangible asset of US$131.5 million represents the goodwill on the acquisition of SAMAX Gold Inc. in 1998. Inaccordance with FRS 10 this will be amortised over the directors’ estimate of its useful economic life commencing in year2000 on the commissioning of Geita. The additional goodwill of US$20 million in 1999 relates to a re-assessment of the fairvalue of Ashanti’s 50% interest in the Golden Pride mine in Tanzania held as a current asset investment, following the saleof the property during the year.
15 InvestmentsGroup 1999 1998
US$m US$m
Investment in Hotel Investments (Ghana) Limited – 2.2
The Company disposed of its 22.5 per cent investment in Hotel Investments (Ghana) Limited during 1999 for a considerationof US$1.5 million.Company SubsidiaryInvestments represent the Company’s investment undertakingsin subsidiary undertakings at cost less provisions Investment shares Totalfor diminution in value. US$m US$m US$m
CostAt 1 January 1999 2.2 553.8 556.0Sale of investments (2.2) (3.4) (5.6)
At 31 December 1999 – 550.4 550.4
ProvisionsAt 1 January 1999 – – –Provided in year – 30.0 30.0
At 31 December 1999 – 30.0 30.0
Net book value of investmentsAt 31 December 1999 – 520.4 520.4At 31 December 1998 2.2 553.8 556.0
The principal subsidiary undertakings are: Class of Group interestCompany and country of incorporation Principal activities Shares held per cent
GhanaAshanti Goldfields (Ayanfuri) Limited Gold Mining Ordinary 100
No par valueAshanti Goldfields (Bibiani) Limited Gold Mining Ordinary 100
No par valueGhanaian-Australian Goldfields Limited Gold Mining Ordinary 80
No par value
GuineaSociété Ashanti Goldfields de Guinée S.A. Gold Mining Ordinary 85
TanzaniaAshanti Goldfields Tanzania Limited Gold Mining Ordinary 100
ZimbabweAshanti Goldfields Zimbabwe Limited Gold Mining Ordinary 100
Isle of ManAshanti Treasury Services Limited Treasury Ordinary 100Geita Treasury Services Limited Treasury Ordinary 100
Cayman IslandsAshanti Capital Limited Financing Ordinary 100Ashanti Finance (Cayman) Limited Financing Ordinary 100
Notes to the Financial Statements
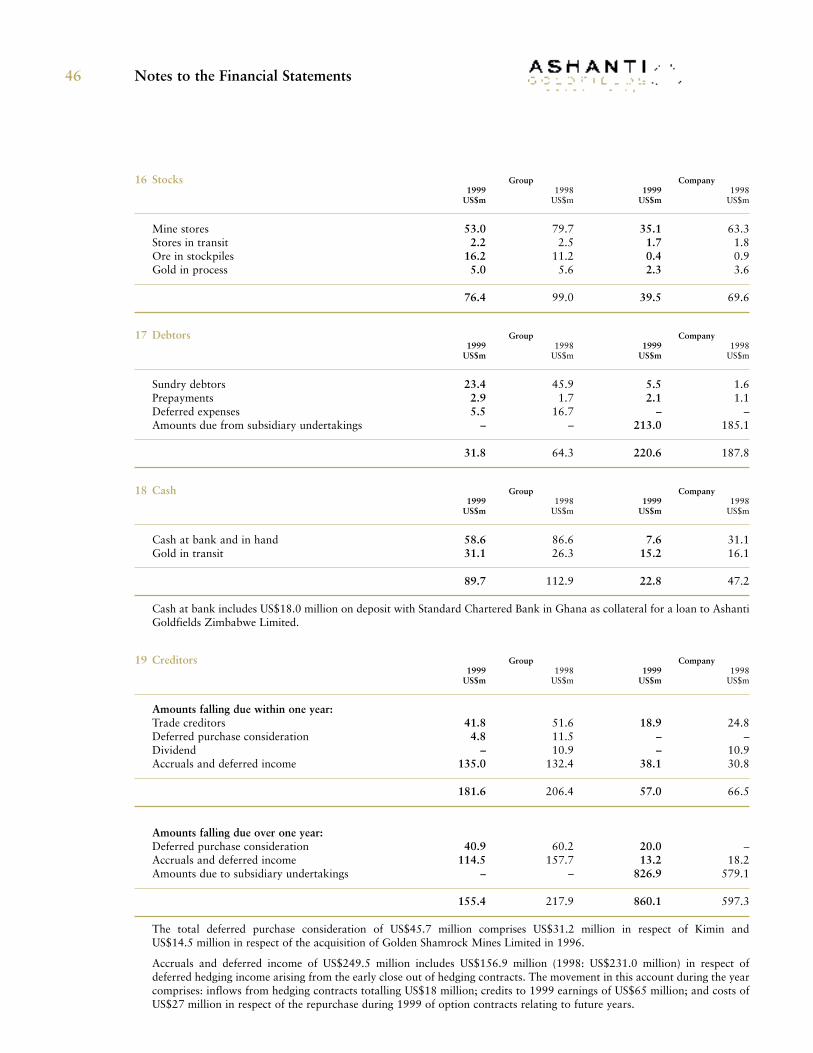
Notes to the Financial Statements 46
16 Stocks Group Company1999 1998 1999 1998
US$m US$m US$m US$m
Mine stores 53.0 79.7 35.1 63.3Stores in transit 2.2 2.5 1.7 1.8Ore in stockpiles 16.2 11.2 0.4 0.9Gold in process 5.0 5.6 2.3 3.6
76.4 99.0 39.5 69.6
17 Debtors Group Company1999 1998 1999 1998
US$m US$m US$m US$m
Sundry debtors 23.4 45.9 5.5 1.6Prepayments 2.9 1.7 2.1 1.1Deferred expenses 5.5 16.7 – –Amounts due from subsidiary undertakings – – 213.0 185.1
31.8 64.3 220.6 187.8
18 Cash Group Company1999 1998 1999 1998
US$m US$m US$m US$m
Cash at bank and in hand 58.6 86.6 7.6 31.1Gold in transit 31.1 26.3 15.2 16.1
89.7 112.9 22.8 47.2
Cash at bank includes US$18.0 million on deposit with Standard Chartered Bank in Ghana as collateral for a loan to AshantiGoldfields Zimbabwe Limited.
19 Creditors Group Company1999 1998 1999 1998
US$m US$m US$m US$m
Amounts falling due within one year:Trade creditors 41.8 51.6 18.9 24.8Deferred purchase consideration 4.8 11.5 – –Dividend – 10.9 – 10.9Accruals and deferred income 135.0 132.4 38.1 30.8
181.6 206.4 57.0 66.5
Amounts falling due over one year:Deferred purchase consideration 40.9 60.2 20.0 –Accruals and deferred income 114.5 157.7 13.2 18.2Amounts due to subsidiary undertakings – – 826.9 579.1
155.4 217.9 860.1 597.3
The total deferred purchase consideration of US$45.7 million comprises US$31.2 million in respect of Kimin andUS$14.5 million in respect of the acquisition of Golden Shamrock Mines Limited in 1996.
Accruals and deferred income of US$249.5 million includes US$156.9 million (1998: US$231.0 million) in respect ofdeferred hedging income arising from the early close out of hedging contracts. The movement in this account during the yearcomprises: inflows from hedging contracts totalling US$18 million; credits to 1999 earnings of US$65 million; and costs ofUS$27 million in respect of the repurchase during 1999 of option contracts relating to future years.
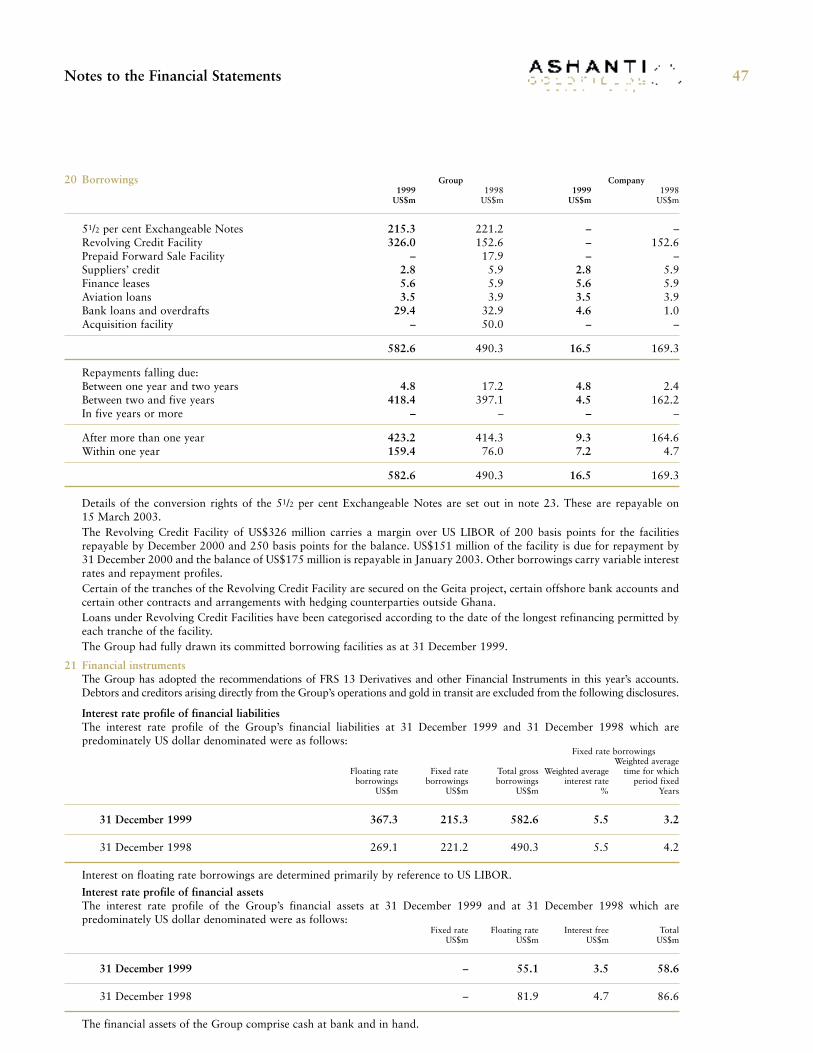
Notes to the Financial Statements 47
20 Borrowings Group Company1999 1998 1999 1998
US$m US$m US$m US$m
51/2 per cent Exchangeable Notes 215.3 221.2 – –Revolving Credit Facility 326.0 152.6 – 152.6Prepaid Forward Sale Facility – 17.9 – –Suppliers’ credit 2.8 5.9 2.8 5.9Finance leases 5.6 5.9 5.6 5.9Aviation loans 3.5 3.9 3.5 3.9Bank loans and overdrafts 29.4 32.9 4.6 1.0Acquisition facility – 50.0 – –
582.6 490.3 16.5 169.3
Repayments falling due:Between one year and two years 4.8 17.2 4.8 2.4Between two and five years 418.4 397.1 4.5 162.2In five years or more – – – –
After more than one year 423.2 414.3 9.3 164.6Within one year 159.4 76.0 7.2 4.7
582.6 490.3 16.5 169.3
Details of the conversion rights of the 51/2 per cent Exchangeable Notes are set out in note 23. These are repayable on 15 March 2003.The Revolving Credit Facility of US$326 million carries a margin over US LIBOR of 200 basis points for the facilitiesrepayable by December 2000 and 250 basis points for the balance. US$151 million of the facility is due for repayment by31 December 2000 and the balance of US$175 million is repayable in January 2003. Other borrowings carry variable interestrates and repayment profiles.Certain of the tranches of the Revolving Credit Facility are secured on the Geita project, certain offshore bank accounts andcertain other contracts and arrangements with hedging counterparties outside Ghana.Loans under Revolving Credit Facilities have been categorised according to the date of the longest refinancing permitted byeach tranche of the facility.The Group had fully drawn its committed borrowing facilities as at 31 December 1999.
21 Financial instrumentsThe Group has adopted the recommendations of FRS 13 Derivatives and other Financial Instruments in this year’s accounts.Debtors and creditors arising directly from the Group’s operations and gold in transit are excluded from the following disclosures.
Interest rate profile of financial liabilitiesThe interest rate profile of the Group’s financial liabilities at 31 December 1999 and 31 December 1998 which arepredominately US dollar denominated were as follows:
Fixed rate borrowingsWeighted average
Floating rate Fixed rate Total gross Weighted average time for whichborrowings borrowings borrowings interest rate period fixed
US$m US$m US$m % Years
31 December 1999 367.3 215.3 582.6 5.5 3.2
31 December 1998 269.1 221.2 490.3 5.5 4.2
Interest on floating rate borrowings are determined primarily by reference to US LIBOR.
Interest rate profile of financial assetsThe interest rate profile of the Group’s financial assets at 31 December 1999 and at 31 December 1998 which arepredominately US dollar denominated were as follows:
Fixed rate Floating rate Interest free TotalUS$m US$m US$m US$m
31 December 1999 – 55.1 3.5 58.6
31 December 1998 – 81.9 4.7 86.6
The financial assets of the Group comprise cash at bank and in hand.
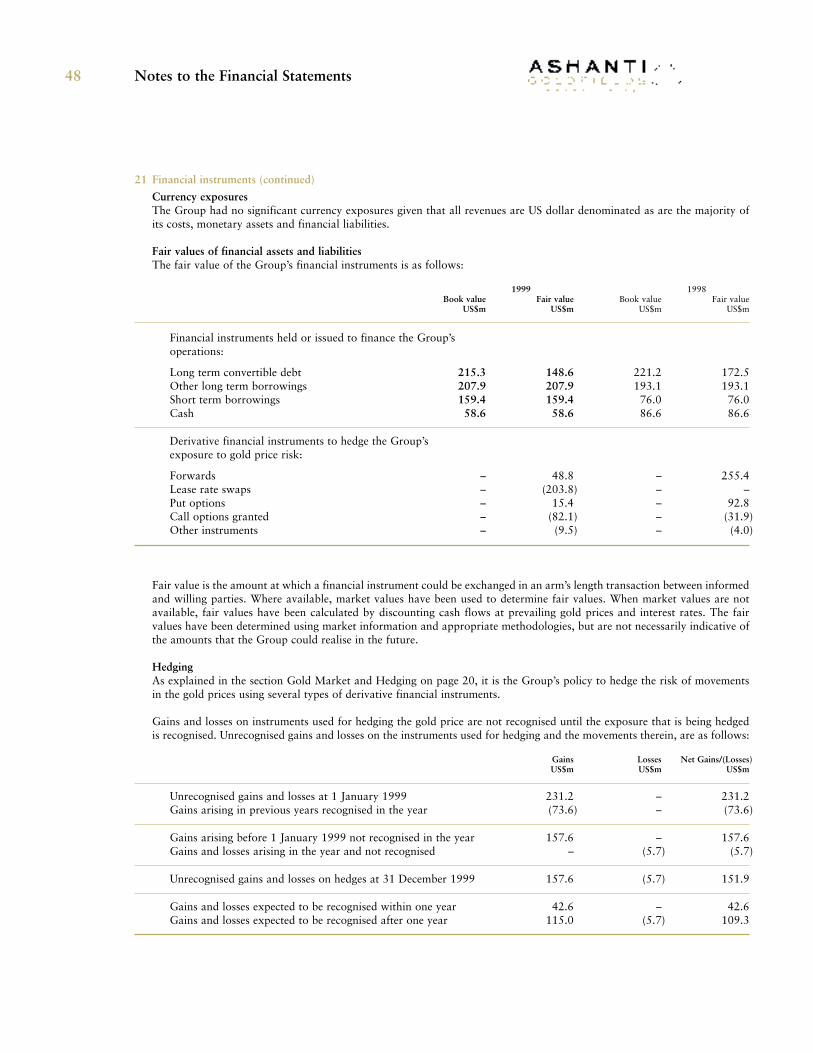
Notes to the Financial Statements 48
21 Financial instruments (continued)
Currency exposuresThe Group had no significant currency exposures given that all revenues are US dollar denominated as are the majority ofits costs, monetary assets and financial liabilities.
Fair values of financial assets and liabilitiesThe fair value of the Group’s financial instruments is as follows:
1999 1998Book value Fair value Book value Fair value
US$m US$m US$m US$m
Financial instruments held or issued to finance the Group’soperations:
Long term convertible debt 215.3 148.6 221.2 172.5Other long term borrowings 207.9 207.9 193.1 193.1Short term borrowings 159.4 159.4 76.0 76.0Cash 58.6 58.6 86.6 86.6
Derivative financial instruments to hedge the Group’s exposure to gold price risk:
Forwards – 48.8 – 255.4Lease rate swaps – (203.8) – –Put options – 15.4 – 92.8Call options granted – (82.1) – (31.9)Other instruments – (9.5) – (4.0)
Fair value is the amount at which a financial instrument could be exchanged in an arm’s length transaction between informedand willing parties. Where available, market values have been used to determine fair values. When market values are notavailable, fair values have been calculated by discounting cash flows at prevailing gold prices and interest rates. The fairvalues have been determined using market information and appropriate methodologies, but are not necessarily indicative ofthe amounts that the Group could realise in the future.
HedgingAs explained in the section Gold Market and Hedging on page 20, it is the Group’s policy to hedge the risk of movementsin the gold prices using several types of derivative financial instruments.
Gains and losses on instruments used for hedging the gold price are not recognised until the exposure that is being hedgedis recognised. Unrecognised gains and losses on the instruments used for hedging and the movements therein, are as follows:
Gains Losses Net Gains/(Losses)US$m US$m US$m
Unrecognised gains and losses at 1 January 1999 231.2 – 231.2Gains arising in previous years recognised in the year (73.6) – (73.6)
Gains arising before 1 January 1999 not recognised in the year 157.6 – 157.6Gains and losses arising in the year and not recognised – (5.7) (5.7)
Unrecognised gains and losses on hedges at 31 December 1999 157.6 (5.7) 151.9
Gains and losses expected to be recognised within one year 42.6 – 42.6Gains and losses expected to be recognised after one year 115.0 (5.7) 109.3
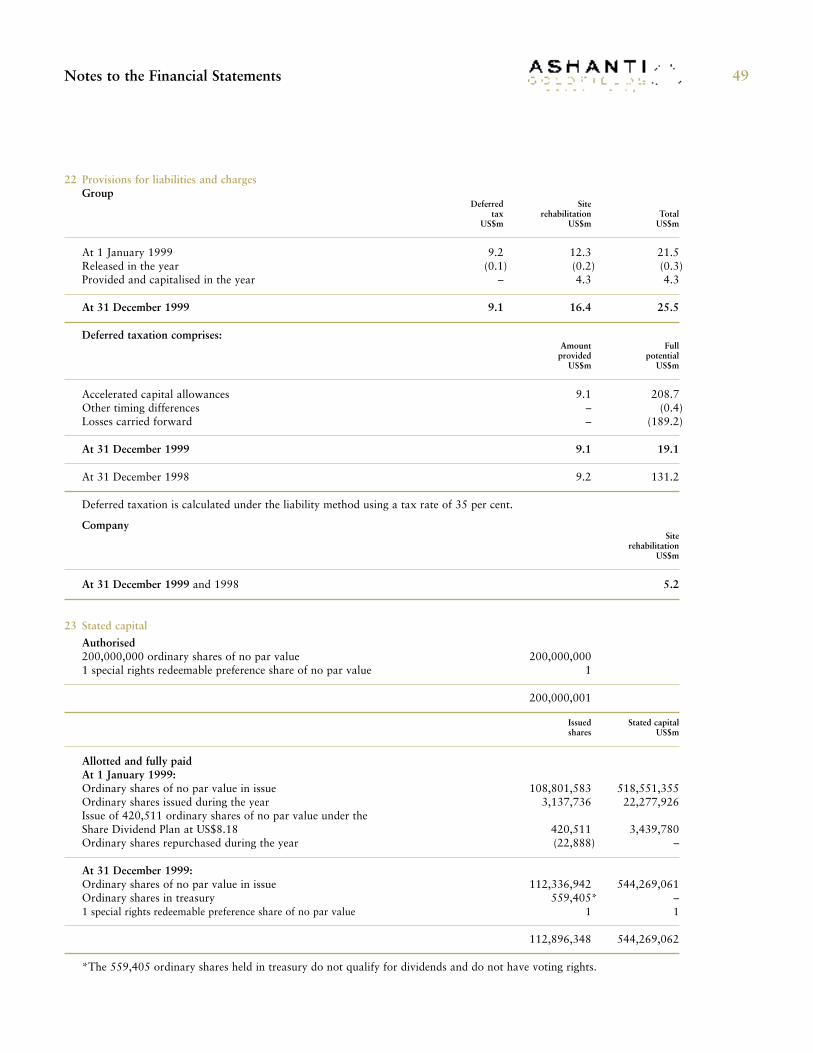
49
22 Provisions for liabilities and chargesGroup
Deferred Sitetax rehabilitation Total
US$m US$m US$m
At 1 January 1999 9.2 12.3 21.5Released in the year (0.1) (0.2) (0.3)Provided and capitalised in the year – 4.3 4.3
At 31 December 1999 9.1 16.4 25.5
Deferred taxation comprises:Amount Full
provided potentialUS$m US$m
Accelerated capital allowances 9.1 208.7Other timing differences – (0.4)Losses carried forward – (189.2)
At 31 December 1999 9.1 19.1
At 31 December 1998 9.2 131.2
Deferred taxation is calculated under the liability method using a tax rate of 35 per cent.
CompanySite
rehabilitationUS$m
At 31 December 1999 and 1998 5.2
23 Stated capital
Authorised200,000,000 ordinary shares of no par value 200,000,0001 special rights redeemable preference share of no par value 1
200,000,001
Issued Stated capitalshares US$m
Allotted and fully paidAt 1 January 1999:Ordinary shares of no par value in issue 108,801,583 518,551,355Ordinary shares issued during the year 3,137,736 22,277,926Issue of 420,511 ordinary shares of no par value under theShare Dividend Plan at US$8.18 420,511 3,439,780Ordinary shares repurchased during the year (22,888) –
At 31 December 1999:Ordinary shares of no par value in issue 112,336,942 544,269,061Ordinary shares in treasury 559,405* –1 special rights redeemable preference share of no par value 1 1
112,896,348 544,269,062
*The 559,405 ordinary shares held in treasury do not qualify for dividends and do not have voting rights.
Notes to the Financial Statements
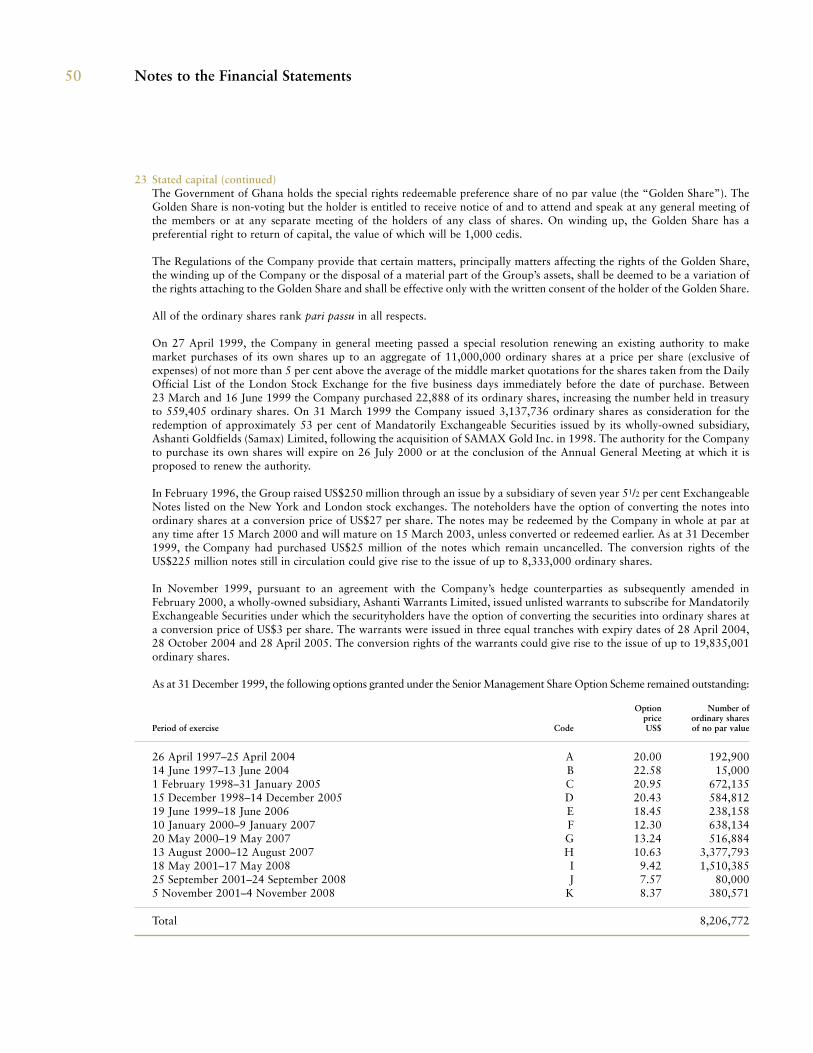
50
23 Stated capital (continued)The Government of Ghana holds the special rights redeemable preference share of no par value (the “Golden Share”). TheGolden Share is non-voting but the holder is entitled to receive notice of and to attend and speak at any general meeting ofthe members or at any separate meeting of the holders of any class of shares. On winding up, the Golden Share has apreferential right to return of capital, the value of which will be 1,000 cedis.
The Regulations of the Company provide that certain matters, principally matters affecting the rights of the Golden Share,the winding up of the Company or the disposal of a material part of the Group’s assets, shall be deemed to be a variation ofthe rights attaching to the Golden Share and shall be effective only with the written consent of the holder of the Golden Share.
All of the ordinary shares rank pari passu in all respects.
On 27 April 1999, the Company in general meeting passed a special resolution renewing an existing authority to makemarket purchases of its own shares up to an aggregate of 11,000,000 ordinary shares at a price per share (exclusive ofexpenses) of not more than 5 per cent above the average of the middle market quotations for the shares taken from the DailyOfficial List of the London Stock Exchange for the five business days immediately before the date of purchase. Between23 March and 16 June 1999 the Company purchased 22,888 of its ordinary shares, increasing the number held in treasuryto 559,405 ordinary shares. On 31 March 1999 the Company issued 3,137,736 ordinary shares as consideration for theredemption of approximately 53 per cent of Mandatorily Exchangeable Securities issued by its wholly-owned subsidiary,Ashanti Goldfields (Samax) Limited, following the acquisition of SAMAX Gold Inc. in 1998. The authority for the Companyto purchase its own shares will expire on 26 July 2000 or at the conclusion of the Annual General Meeting at which it isproposed to renew the authority.
In February 1996, the Group raised US$250 million through an issue by a subsidiary of seven year 51/2 per cent ExchangeableNotes listed on the New York and London stock exchanges. The noteholders have the option of converting the notes intoordinary shares at a conversion price of US$27 per share. The notes may be redeemed by the Company in whole at par atany time after 15 March 2000 and will mature on 15 March 2003, unless converted or redeemed earlier. As at 31 December1999, the Company had purchased US$25 million of the notes which remain uncancelled. The conversion rights of theUS$225 million notes still in circulation could give rise to the issue of up to 8,333,000 ordinary shares.
In November 1999, pursuant to an agreement with the Company’s hedge counterparties as subsequently amended inFebruary 2000, a wholly-owned subsidiary, Ashanti Warrants Limited, issued unlisted warrants to subscribe for MandatorilyExchangeable Securities under which the securityholders have the option of converting the securities into ordinary shares ata conversion price of US$3 per share. The warrants were issued in three equal tranches with expiry dates of 28 April 2004,28 October 2004 and 28 April 2005. The conversion rights of the warrants could give rise to the issue of up to 19,835,001ordinary shares.
As at 31 December 1999, the following options granted under the Senior Management Share Option Scheme remained outstanding:
Option Number ofprice ordinary shares
Period of exercise Code US$ of no par value
26 April 1997–25 April 2004 A 20.00 192,90014 June 1997–13 June 2004 B 22.58 15,0001 February 1998–31 January 2005 C 20.95 672,13515 December 1998–14 December 2005 D 20.43 584,81219 June 1999–18 June 2006 E 18.45 238,15810 January 2000–9 January 2007 F 12.30 638,13420 May 2000–19 May 2007 G 13.24 516,88413 August 2000–12 August 2007 H 10.63 3,377,79318 May 2001–17 May 2008 I 9.42 1,510,38525 September 2001–24 September 2008 J 7.57 80,0005 November 2001–4 November 2008 K 8.37 380,571
Total 8,206,772
Notes to the Financial Statements
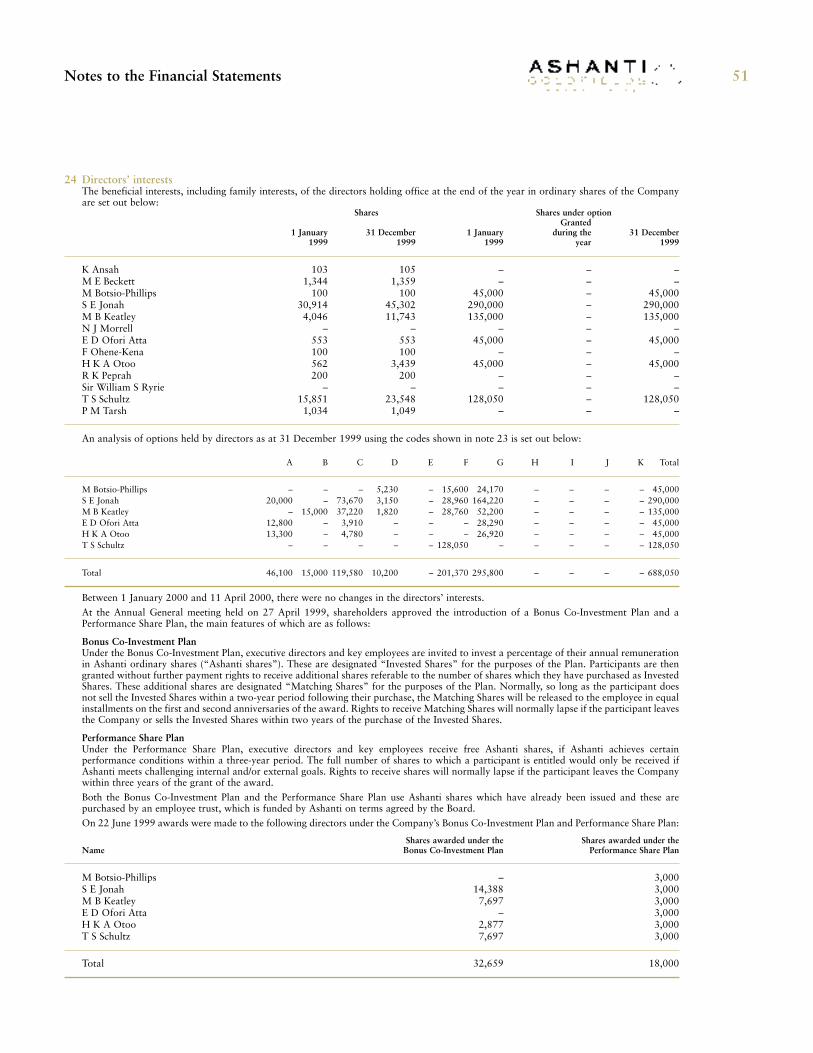
51
24 Directors’ interestsThe beneficial interests, including family interests, of the directors holding office at the end of the year in ordinary shares of the Companyare set out below:
Shares Shares under optionGranted
1 January 31 December 1 January during the 31 December1999 1999 1999 year 1999
K Ansah 103 105 – – –M E Beckett 1,344 1,359 – – –M Botsio-Phillips 100 100 45,000 – 45,000S E Jonah 30,914 45,302 290,000 – 290,000M B Keatley 4,046 11,743 135,000 – 135,000N J Morrell – – – – –E D Ofori Atta 553 553 45,000 – 45,000F Ohene-Kena 100 100 – – –H K A Otoo 562 3,439 45,000 – 45,000R K Peprah 200 200 – – –Sir William S Ryrie – – – – –T S Schultz 15,851 23,548 128,050 – 128,050P M Tarsh 1,034 1,049 – – –
An analysis of options held by directors as at 31 December 1999 using the codes shown in note 23 is set out below:
A B C D E F G H I J K Total
M Botsio-Phillips – – – 5,230 – 15,600 24,170 – – – – 45,000S E Jonah 20,000 – 73,670 3,150 – 28,960 164,220 – – – – 290,000M B Keatley – 15,000 37,220 1,820 – 28,760 52,200 – – – – 135,000E D Ofori Atta 12,800 – 3,910 – – – 28,290 – – – – 45,000H K A Otoo 13,300 – 4,780 – – – 26,920 – – – – 45,000T S Schultz – – – – – 128,050 – – – – – 128,050
Total 46,100 15,000 119,580 10,200 – 201,370 295,800 – – – – 688,050
Between 1 January 2000 and 11 April 2000, there were no changes in the directors’ interests.
At the Annual General meeting held on 27 April 1999, shareholders approved the introduction of a Bonus Co-Investment Plan and aPerformance Share Plan, the main features of which are as follows:
Bonus Co-Investment PlanUnder the Bonus Co-Investment Plan, executive directors and key employees are invited to invest a percentage of their annual remunerationin Ashanti ordinary shares (“Ashanti shares”). These are designated “Invested Shares” for the purposes of the Plan. Participants are thengranted without further payment rights to receive additional shares referable to the number of shares which they have purchased as InvestedShares. These additional shares are designated “Matching Shares” for the purposes of the Plan. Normally, so long as the participant doesnot sell the Invested Shares within a two-year period following their purchase, the Matching Shares will be released to the employee in equalinstallments on the first and second anniversaries of the award. Rights to receive Matching Shares will normally lapse if the participant leavesthe Company or sells the Invested Shares within two years of the purchase of the Invested Shares.
Performance Share PlanUnder the Performance Share Plan, executive directors and key employees receive free Ashanti shares, if Ashanti achieves certainperformance conditions within a three-year period. The full number of shares to which a participant is entitled would only be received ifAshanti meets challenging internal and/or external goals. Rights to receive shares will normally lapse if the participant leaves the Companywithin three years of the grant of the award.
Both the Bonus Co-Investment Plan and the Performance Share Plan use Ashanti shares which have already been issued and these arepurchased by an employee trust, which is funded by Ashanti on terms agreed by the Board.
On 22 June 1999 awards were made to the following directors under the Company’s Bonus Co-Investment Plan and Performance Share Plan:
Shares awarded under the Shares awarded under theName Bonus Co-Investment Plan Performance Share Plan
M Botsio-Phillips – 3,000S E Jonah 14,388 3,000M B Keatley 7,697 3,000E D Ofori Atta – 3,000H K A Otoo 2,877 3,000T S Schultz 7,697 3,000
Total 32,659 18,000
Notes to the Financial Statements
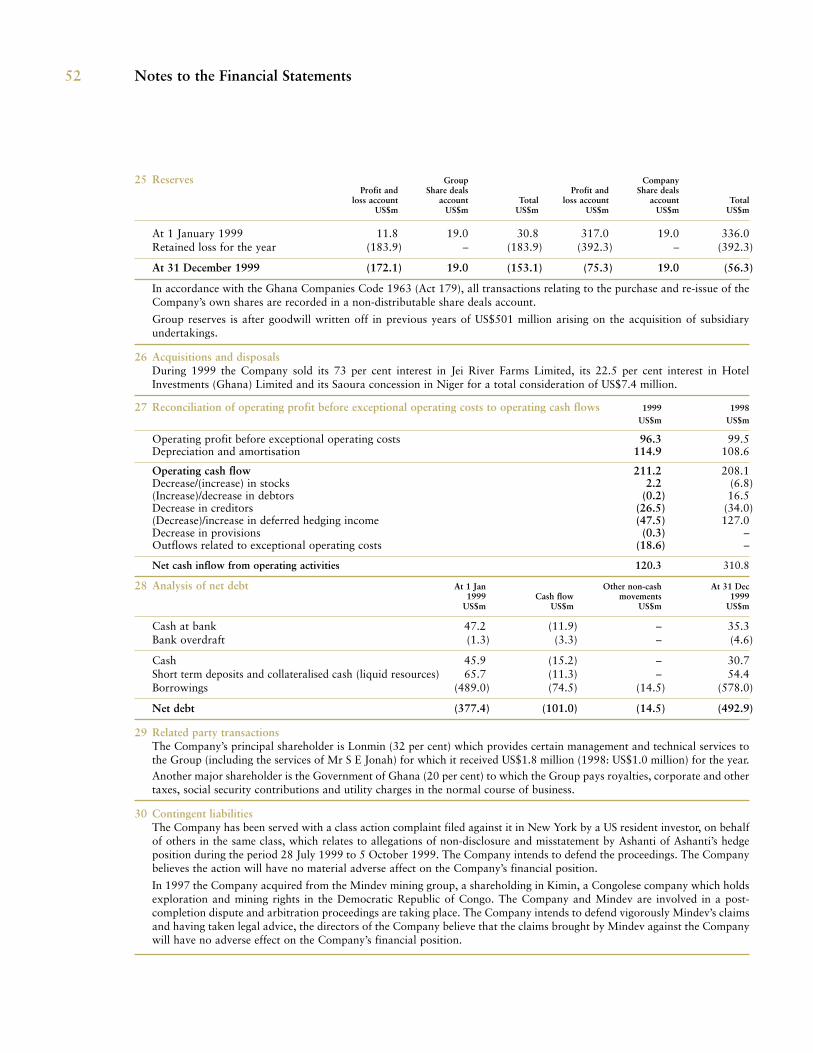
52
25 Reserves Group CompanyProfit and Share deals Profit and Share deals
loss account account Total loss account account TotalUS$m US$m US$m US$m US$m US$m
At 1 January 1999 11.8 19.0 30.8 317.0 19.0 336.0Retained loss for the year (183.9) – (183.9) (392.3) – (392.3)
At 31 December 1999 (172.1) 19.0 (153.1) (75.3) 19.0 (56.3)
In accordance with the Ghana Companies Code 1963 (Act 179), all transactions relating to the purchase and re-issue of theCompany’s own shares are recorded in a non-distributable share deals account.
Group reserves is after goodwill written off in previous years of US$501 million arising on the acquisition of subsidiaryundertakings.
26 Acquisitions and disposalsDuring 1999 the Company sold its 73 per cent interest in Jei River Farms Limited, its 22.5 per cent interest in HotelInvestments (Ghana) Limited and its Saoura concession in Niger for a total consideration of US$7.4 million.
27 Reconciliation of operating profit before exceptional operating costs to operating cash flows 1999 1998US$m US$m
Operating profit before exceptional operating costs 96.3 99.5Depreciation and amortisation 114.9 108.6
Operating cash flow 211.2 208.1Decrease/(increase) in stocks 2.2 (6.8)(Increase)/decrease in debtors (0.2) 16.5Decrease in creditors (26.5) (34.0)(Decrease)/increase in deferred hedging income (47.5) 127.0Decrease in provisions (0.3) –Outflows related to exceptional operating costs (18.6) –
Net cash inflow from operating activities 120.3 310.8
28 Analysis of net debt At 1 Jan Other non-cash At 31 Dec1999 Cash flow movements 1999
US$m US$m US$m US$m
Cash at bank 47.2 (11.9) – 35.3Bank overdraft (1.3) (3.3) – (4.6)
Cash 45.9 (15.2) – 30.7Short term deposits and collateralised cash (liquid resources) 65.7 (11.3) – 54.4Borrowings (489.0) (74.5) (14.5) (578.0)
Net debt (377.4) (101.0) (14.5) (492.9)
29 Related party transactionsThe Company’s principal shareholder is Lonmin (32 per cent) which provides certain management and technical services tothe Group (including the services of Mr S E Jonah) for which it received US$1.8 million (1998: US$1.0 million) for the year.Another major shareholder is the Government of Ghana (20 per cent) to which the Group pays royalties, corporate and othertaxes, social security contributions and utility charges in the normal course of business.
30 Contingent liabilitiesThe Company has been served with a class action complaint filed against it in New York by a US resident investor, on behalfof others in the same class, which relates to allegations of non-disclosure and misstatement by Ashanti of Ashanti’s hedgeposition during the period 28 July 1999 to 5 October 1999. The Company intends to defend the proceedings. The Companybelieves the action will have no material adverse affect on the Company’s financial position.
In 1997 the Company acquired from the Mindev mining group, a shareholding in Kimin, a Congolese company which holdsexploration and mining rights in the Democratic Republic of Congo. The Company and Mindev are involved in a post-completion dispute and arbitration proceedings are taking place. The Company intends to defend vigorously Mindev’s claimsand having taken legal advice, the directors of the Company believe that the claims brought by Mindev against the Companywill have no adverse effect on the Company’s financial position.
Notes to the Financial Statements
53
Details of the Hedging Portfolio
Forward Sales:All bought and sold forward contracts are netted off. For example, a short position of 20,000 ounces at US$300 and a longposition of 10,000 ounces at US$310 will result in a short position of 10,000 ounces at US$290.
Contango Locks: Ashanti may enter into a contract to sell the specified volume for the corresponding future dates before June 2000. The contangoused for this calculation is fixed. The contango locks may be cash settled.
Put Options:Ashanti has purchased 600,000 ounces of put options that entitle Ashanti to receive an average gold price of US$324 per ounce.Ashanti has also sold 350,000 ounces of put options at an average strike price of US$270 per ounce.
Call Options:As at year-end 1999, Ashanti had sold call options covering 5.8 million ounces at an average strike price of approximatelyUS$364 per ounce. As a partial offset, Ashanti had also bought 2.3 million ounces of call options at an average strike price ofabout US$382 per ounce. The bought call options enable Ashanti to participate in the upside potential of the gold price abovethe relevant strike price.
As at 3 March 2000, the number of both sold and bought call options had reduced, with consequential changes in the relevantstrike prices.
Convertible Structures: The portfolio contains four types of convertible structures:
1. Ashanti owns 500,000 ounces of put options at strike levels ranging from US$403.50 to US$423.50 for the period March2003 to December 2007. Each option converts to a forward contract if gold trades above a predetermined barrier level withina specified time period. This period starts 3 months before expiry of each option and ends at expiry. The barrier level for eachoption is US$20 above the strike level for that option. (This structure has been cancelled since 31 December 1999.)
2. Ashanti has sold 554,400 ounces of call options at a strike price of US$380 for the period March 2004 to December 2010.These call options convert to put options (with a strike price of US$377.50) if gold trades below predetermined barrier levels onspecified dates starting from 2002. The average barrier level is US$347.
3. Ashanti owns 700,000 ounces of put options for the period March 2002 to December 2008 with strike prices of US$401.Each option has a conversion level and a strip of conversion dates associated with it. If the conversion occurs the put optionsconvert into twice the amount of forward sales at the same strike price.
4. Ashanti owns 450,000 ounces of put options for the period March 2009 to December 2013 with strike prices of US$401.Each option has a conversion level and a strip of conversion dates associated with it. If the conversion occurs the put optionsconvert into twice the amount of forward sales and calls (sold) at the same strike price.
The average conversion level for Convertibles 3 and 4 is US$356. Note: A short-term spike above the conversion levels will notcause any puts to convert into forwards and calls.
The hedging tables break the above structures into protected and committed ounces. The “Put Protection” represents the amountof ounces that may be sold should gold continue trading at current levels. Under certain conditions (given above) these puts maycease to exist and may be replaced by forward sales and calls sold (“Forward Commitment” and “Call Commitment”).
Swaptions: As of 13 January 2000, Ashanti had the right but not the obligation to exercise any of the put swaptions. Each exercised putswaption converts into a one year strip of 25,000 ounces per quarter forward sales at the price indicated. (These contracts havebeen cancelled since 31 December 1999.)
Deferred Payment Binary options:As of year-end 1999, Ashanti had sold binary put options for the period March 2001 to December 2008 at a strike price ofUS$320 per ounce. If gold fixes below US$320 at expiry of any contract then Ashanti has the obligation to pay a fixed cashamount five years from that date. This cash amount is US$500,000 for the first ten quarters, US$1,000,000 for the next20 quarters and US$500,000 for the last two quarters. – (These contracts have been cancelled since 31 December, 1999.)
Gold Market and Hedging Appendix
54
Gold Lease Rate Swaps:As of 31 December 1999, 7.6 million ounces of Ashanti’s hedged production (equivalent to approximately 76 per cent of thedelta of the hedge book) was exposed to the floating one, three, and six month lease rate. By 3 March 2000, this quantity hadbeen reduced to 6.1 million ounces, equivalent to 66 per cent of the delta of the hedge portfolio. This quantity amortises eachyear.
The lease rate swaps as at year-end 1999 can be broken down into the following types. As noted in the following table, undermost of these contracts Ashanti receives a certain lease rate income, which can be regarded as compensation for the lease rateexposure that Ashanti takes on.
Deferred Premiums:Ashanti has obligations totalling approximately US$27 million, which arose during the third and fourth quarters of 1999, withrespect to the purchase of option contracts on a deferred basis. As part of the agreements entered into in February 2000 withAshanti’s banks and hedge counterparties, these obligations have been included in Ashanti’s secured debt facilities within TrancheD of the Revolving Credit Facility. They are not included in any of the hedge valuations or tables.
Changes subsequent to year-end 1999Between 31 December 1999 and 3 March 2000 there was:
• a reduction in lease rate swaps• a reduction in convertible options• a reduction in contango locks• cancellation of all binaries• cancellation of all swaptions• a reduction in both calls sold and calls bought• a reduction in sold puts• a reduction in forward sales
Delta:The amount of gold (in ounces) that needs to be bought (negative delta) or sold (positive delta) to neutralise the effect of asmall movement in the gold price on the mark-to-market value of a hedge portfolio. It can, therefore, be used to calculate theapproximate change in mark-to-market value given a movement in the gold price.
Table 1 Fixed Rate (%) Volume (ozs)
Ashanti pays a monthly floating rate and receives a monthly fixed rate of 2% 2.00 294,500
Ashanti pays a three monthly floating rate and receives 0% 0 175,000
Ashanti pays a six monthly floating rate and receives a six monthly fixed rate of 2% 2.00 1,546,000
Ashanti pays a three monthly floating rate and receives a six monthly fixed rate of 1.75%.The fixed amount of ounces is converted to dollars at a fixed spot price of US$290 1.75 3,470,312
Ashanti pays a three monthly floating rate and receives a fixed amount of dollars at maturity. The quarterly amount is rolled until maturity of each forward contract. The fixed amount for eachcontract is calculated using the formula: Volume*YearsToMaturity*302*1.75% 2.00 1,080,000
Ashanti pays a three monthly floating rate and receives a fixed rate ranging from 0% to 1.75%depending on where gold fixes 1.75 840,000Gold Fix Fixed Rate ReceivedSpot<US$345 1.75%US$345<Spot<US$400 Linearly interpolated between 0% and 1.75%US$400<Spot 0%
Ashanti pays a three monthly floating rate and receives a fixed rate ranging from 0% to 2.25%depending on where gold fixes 2.25 240,000Gold Fix Fixed Rate ReceivedSpot<US$360 2.25%US$360<Spot<US$400 Linearly interpolated between 0% and 2.25%US$400<Spot 0%
Total 7,645,812
Gold Market and Hedging Appendix (continued)
55
Mark-to-Market ValuationsOn 31 December 1999 the portfolio had a negative mark-to-market value of US$231.2 million. This valuation was based on aspot price of US$290 and the then prevailing mid US interest rates, gold forward rates and volatilities. This valuation is presentedas an indicative valuation of the Ashanti gold hedge position based on prevailing market conditions on that day. The delta atthat time was negative 10.17 million ounces. This implies that a US$1 increase in the price of gold would have a US$10.17million negative impact (approximate) on the mark-to-market valuation of the hedge book. Movements in US interest rates, goldlease rates, volatilities and time will also have a sizeable impact on the mark-to-market valuation. All these variables can changesignificantly over short time periods and can consequently materially affect the mark-to-market valuation.
On 3 March 2000 the portfolio had a negative mark-to-market value of US$252.9 million. The delta at that time was 9.18million ounces. These values were calculated using a spot price of US$289.
The difference in mark-to-market from 31 December 1999 to 3 March 2000 was primarily due to:
• Realising value from the portfolio from maturing deals and restructuring positions (a total amount of US$9.4 million wasrealised)
• An increase in US interest rates• A decrease in lease rates (this is favourable to Ashanti in terms of cashflows, because lease rate swaps are then fixed at a
lower rate. However, it increases the hedge book’s overall negative mark-to-market value).
The approximate breakdown by type of contract of the mark-to-market valuation at 3 March 2000 was as follows:
Table 2 US$ m1 1
Forward contracts and contango locks (5.2)Put options (net bought) 15.3Other options (including convertibles) (129.4)Lease rate swaps (133.6)
1
(252.9)2
The negative valuation is largely explained by call options and lease rate swaps and is influenced by the following factors:
(1) The mark-to-market values for options are strongly influenced by the prevailing level of gold volatilities. Market conditionson 3 March, 2000 assume a volatility of 19 per cent over three months reducing to 11.5 per cent over ten years. These levelsof volatility are relatively high compared to long term historical averages. Lower volatility levels and the passage of timewould normally reduce the exposure to this portion of Ashanti’s hedge portfolio. Conversely, higher volatility levels wouldnormally increase the exposure.
(2) Market conditions on 3 March, 2000 are based on contango rates derived from a yield curve with rates of 5.7 per cent perannum for one month, 5.16 per cent per annum for one year and 5.23 per cent per annum for ten years. These contangorates are relatively high as compared to long term historical averages. Lower contango rates would normally reduce thenegative mark-to-market valuation.
(3) The mark-to-market estimate of the gold lease rate swaps is based on the gold lease rate curve with rates increasing to 5.0per cent per annum over ten years. Ashanti will receive fixed rate payments of approximately 1.75 per cent on a short-termbasis and will pay the prevailing market short-term lease rate. Short-term gold lease rates on 3 March 2000 were indicating0.6 per cent per annum for three months and 0.9 per cent per annum for six months. Ashanti normally manages its lease rateexposure with roll overs of three to six months and is therefore currently benefiting from these arrangements. Based onaverage historical short term gold lease rates of 1.35 per cent, Ashanti’s lease rate exposure should provide cashflows overtime (provided gold remains within its current range).
The “theta” (time decay factor) of the portfolio shows how the value of the portfolio changes with respect to time, all elseremaining equal. As of the 3 March 2000, the portfolio’s mark-to-market improves by approximately US$2.8 million per week.This value is not constant and will change with changes in market rates, calculation date and as contracts expire.
The gold rho and dollar rho show how changes in interest rates affect the mark-to-market valuation of the portfolio.A 5pt (0.05 per cent) parallel shift upwards in annual gold interest rates will improve the mark-to-market valuation of theportfolio by US$1.8 million. A 5pt (0.05 per cent) parallel shift upwards in annual US interest rates will decrease themark-to-market valuation by US$5.6 million.
Gold Market and Hedging Appendix (continued)
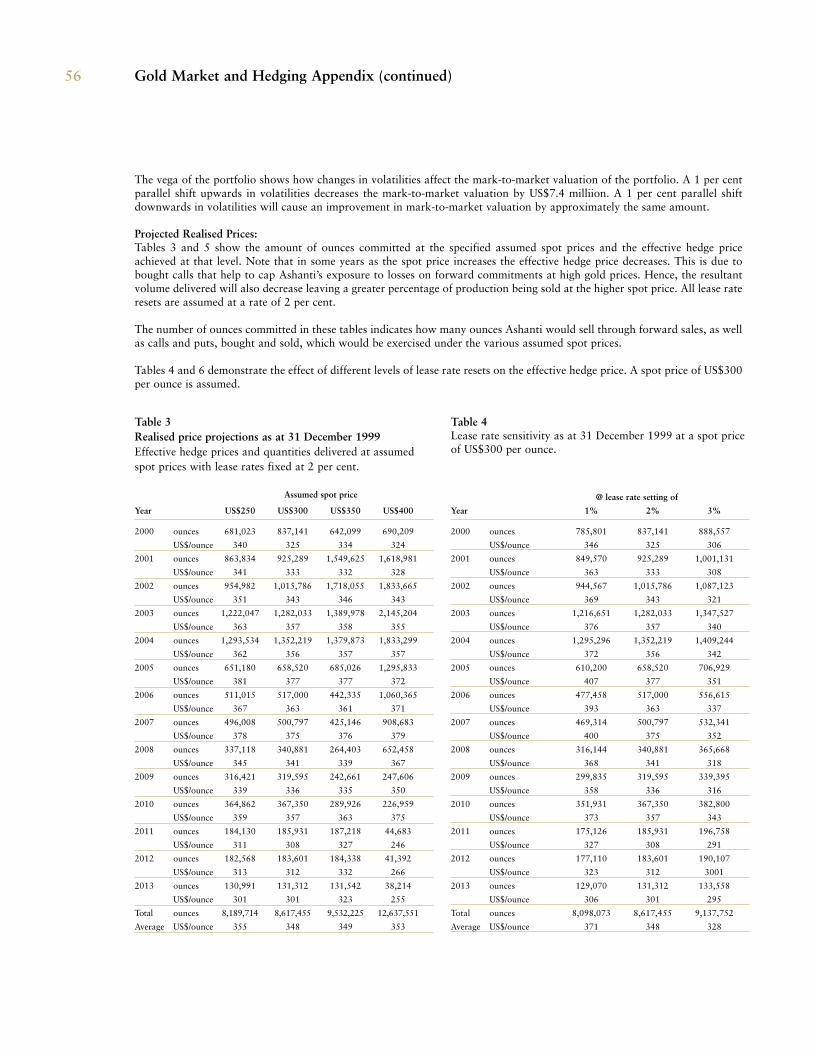
56 Gold Market and Hedging Appendix (continued)
The vega of the portfolio shows how changes in volatilities affect the mark-to-market valuation of the portfolio. A 1 per centparallel shift upwards in volatilities decreases the mark-to-market valuation by US$7.4 milliion. A 1 per cent parallel shiftdownwards in volatilities will cause an improvement in mark-to-market valuation by approximately the same amount.
Projected Realised Prices:Tables 3 and 5 show the amount of ounces committed at the specified assumed spot prices and the effective hedge priceachieved at that level. Note that in some years as the spot price increases the effective hedge price decreases. This is due tobought calls that help to cap Ashanti’s exposure to losses on forward commitments at high gold prices. Hence, the resultantvolume delivered will also decrease leaving a greater percentage of production being sold at the higher spot price. All lease rateresets are assumed at a rate of 2 per cent.
The number of ounces committed in these tables indicates how many ounces Ashanti would sell through forward sales, as wellas calls and puts, bought and sold, which would be exercised under the various assumed spot prices.
Tables 4 and 6 demonstrate the effect of different levels of lease rate resets on the effective hedge price. A spot price of US$300per ounce is assumed.
Table 3Realised price projections as at 31 December 1999Effective hedge prices and quantities delivered at assumedspot prices with lease rates fixed at 2 per cent.
Assumed spot price
Year US$250 US$300 US$350 US$400
2000 ounces 681,023 837,141 642,099 690,209
US$/ounce 340 325 334 324
2001 ounces 863,834 925,289 1,549,625 1,618,981
US$/ounce 341 333 332 328
2002 ounces 954,982 1,015,786 1,718,055 1,833,665
US$/ounce 351 343 346 343
2003 ounces 1,222,047 1,282,033 1,389,978 2,145,204
US$/ounce 363 357 358 355
2004 ounces 1,293,534 1,352,219 1,379,873 1,833,299
US$/ounce 362 356 357 357
2005 ounces 651,180 658,520 685,026 1,295,833
US$/ounce 381 377 377 372
2006 ounces 511,015 517,000 442,335 1,060,365
US$/ounce 367 363 361 371
2007 ounces 496,008 500,797 425,146 908,683
US$/ounce 378 375 376 379
2008 ounces 337,118 340,881 264,403 652,458
US$/ounce 345 341 339 367
2009 ounces 316,421 319,595 242,661 247,606
US$/ounce 339 336 335 350
2010 ounces 364,862 367,350 289,926 226,959
US$/ounce 359 357 363 375
2011 ounces 184,130 185,931 187,218 44,683
US$/ounce 311 308 327 246
2012 ounces 182,568 183,601 184,338 41,392
US$/ounce 313 312 332 266
2013 ounces 130,991 131,312 131,542 38,214
US$/ounce 301 301 323 255
Total ounces 8,189,714 8,617,455 9,532,225 12,637,551
Average US$/ounce 355 348 349 353
Table 4Lease rate sensitivity as at 31 December 1999 at a spot priceof US$300 per ounce.
@ lease rate setting of
Year 1% 2% 3%
2000 ounces 785,801 837,141 888,557
US$/ounce 346 325 306
2001 ounces 849,570 925,289 1,001,131
US$/ounce 363 333 308
2002 ounces 944,567 1,015,786 1,087,123
US$/ounce 369 343 321
2003 ounces 1,216,651 1,282,033 1,347,527
US$/ounce 376 357 340
2004 ounces 1,295,296 1,352,219 1,409,244
US$/ounce 372 356 342
2005 ounces 610,200 658,520 706,929
US$/ounce 407 377 351
2006 ounces 477,458 517,000 556,615
US$/ounce 393 363 337
2007 ounces 469,314 500,797 532,341
US$/ounce 400 375 352
2008 ounces 316,144 340,881 365,668
US$/ounce 368 341 318
2009 ounces 299,835 319,595 339,395
US$/ounce 358 336 316
2010 ounces 351,931 367,350 382,800
US$/ounce 373 357 343
2011 ounces 175,126 185,931 196,758
US$/ounce 327 308 291
2012 ounces 177,110 183,601 190,107
US$/ounce 323 312 3001
2013 ounces 129,070 131,312 133,558
US$/ounce 306 301 295
Total ounces 8,098,073 8,617,455 9,137,752
Average US$/ounce 371 348 328
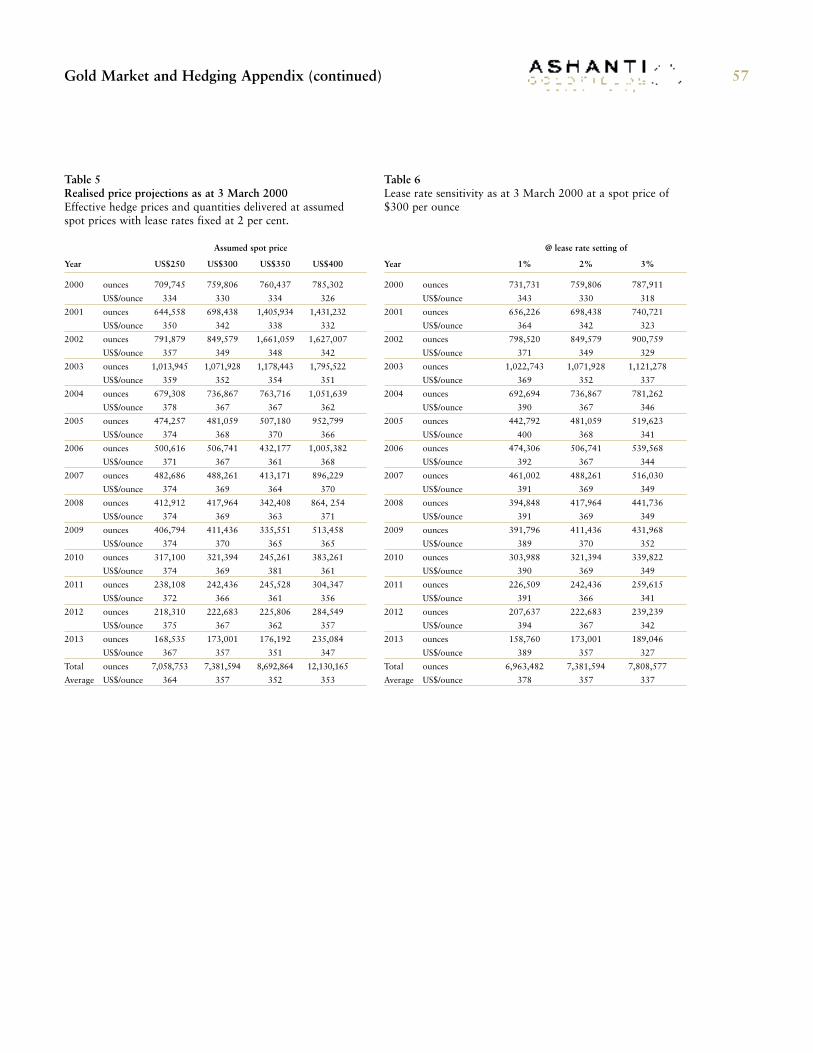
57
Table 5Realised price projections as at 3 March 2000Effective hedge prices and quantities delivered at assumedspot prices with lease rates fixed at 2 per cent.
Assumed spot price
Year US$250 US$300 US$350 US$400
2000 ounces 709,745 759,806 760,437 785,302
US$/ounce 334 330 334 326
2001 ounces 644,558 698,438 1,405,934 1,431,232
US$/ounce 350 342 338 332
2002 ounces 791,879 849,579 1,661,059 1,627,007
US$/ounce 357 349 348 342
2003 ounces 1,013,945 1,071,928 1,178,443 1,795,522
US$/ounce 359 352 354 351
2004 ounces 679,308 736,867 763,716 1,051,639
US$/ounce 378 367 367 362
2005 ounces 474,257 481,059 507,180 952,799
US$/ounce 374 368 370 366
2006 ounces 500,616 506,741 432,177 1,005,382
US$/ounce 371 367 361 368
2007 ounces 482,686 488,261 413,171 896,229
US$/ounce 374 369 364 370
2008 ounces 412,912 417,964 342,408 864, 254
US$/ounce 374 369 363 371
2009 ounces 406,794 411,436 335,551 513,458
US$/ounce 374 370 365 365
2010 ounces 317,100 321,394 245,261 383,261
US$/ounce 374 369 381 361
2011 ounces 238,108 242,436 245,528 304,347
US$/ounce 372 366 361 356
2012 ounces 218,310 222,683 225,806 284,549
US$/ounce 375 367 362 357
2013 ounces 168,535 173,001 176,192 235,084
US$/ounce 367 357 351 347
Total ounces 7,058,753 7,381,594 8,692,864 12,130,165
Average US$/ounce 364 357 352 353
Table 6Lease rate sensitivity as at 3 March 2000 at a spot price of$300 per ounce
@ lease rate setting of
Year 1% 2% 3%
2000 ounces 731,731 759,806 787,911
US$/ounce 343 330 318
2001 ounces 656,226 698,438 740,721
US$/ounce 364 342 323
2002 ounces 798,520 849,579 900,759
US$/ounce 371 349 329
2003 ounces 1,022,743 1,071,928 1,121,278
US$/ounce 369 352 337
2004 ounces 692,694 736,867 781,262
US$/ounce 390 367 346
2005 ounces 442,792 481,059 519,623
US$/ounce 400 368 341
2006 ounces 474,306 506,741 539,568
US$/ounce 392 367 344
2007 ounces 461,002 488,261 516,030
US$/ounce 391 369 349
2008 ounces 394,848 417,964 441,736
US$/ounce 391 369 349
2009 ounces 391,796 411,436 431,968
US$/ounce 389 370 352
2010 ounces 303,988 321,394 339,822
US$/ounce 390 369 349
2011 ounces 226,509 242,436 259,615
US$/ounce 391 366 341
2012 ounces 207,637 222,683 239,239
US$/ounce 394 367 342
2013 ounces 158,760 173,001 189,046
US$/ounce 389 357 327
Total ounces 6,963,482 7,381,594 7,808,577
Average US$/ounce 378 357 337
Gold Market and Hedging Appendix (continued)
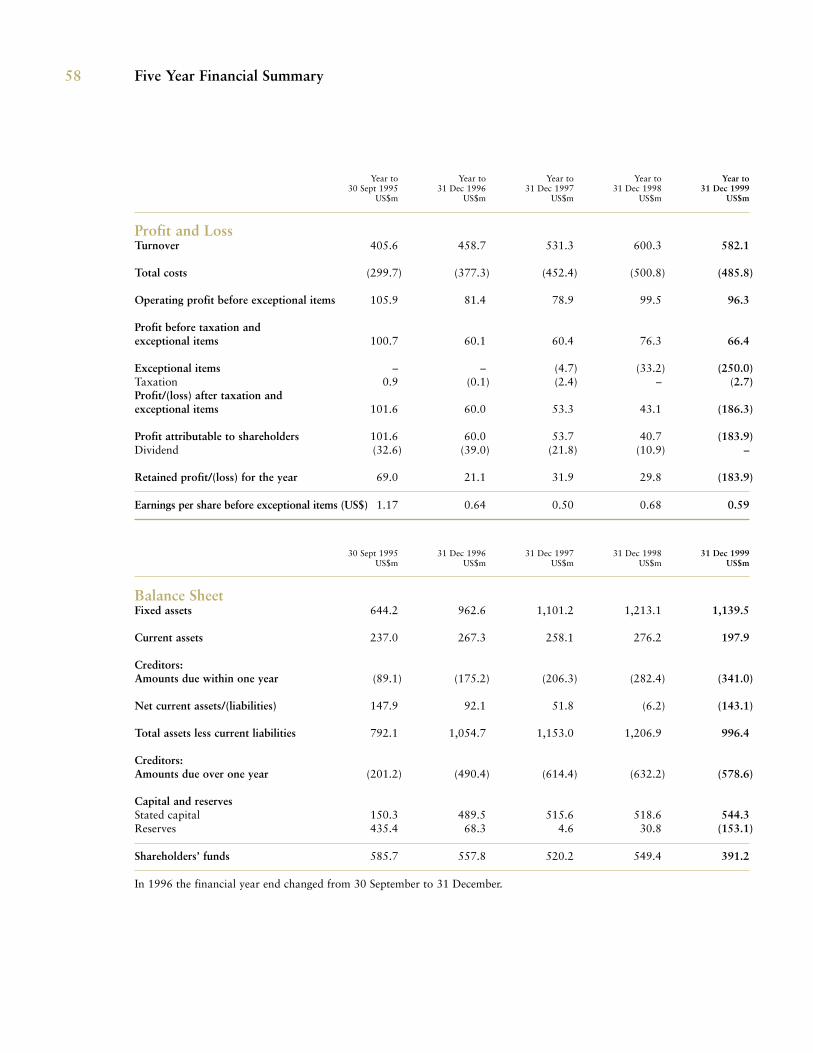
58
Year to Year to Year to Year to Year to30 Sept 1995 31 Dec 1996 31 Dec 1997 31 Dec 1998 31 Dec 1999
US$m US$m US$m US$m US$m
Profit and LossTurnover 405.6 458.7 531.3 600.3 582.1
Total costs (299.7) (377.3) (452.4) (500.8) (485.8)
Operating profit before exceptional items 105.9 81.4 78.9 99.5 96.3
Profit before taxation andexceptional items 100.7 60.1 60.4 76.3 66.4
Exceptional items – – (4.7) (33.2) (250.0)Taxation 0.9 (0.1) (2.4) – (2.7)Profit/(loss) after taxation andexceptional items 101.6 60.0 53.3 43.1 (186.3)
Profit attributable to shareholders 101.6 60.0 53.7 40.7 (183.9)Dividend (32.6) (39.0) (21.8) (10.9) –
Retained profit/(loss) for the year 69.0 21.1 31.9 29.8 (183.9)
Earnings per share before exceptional items (US$) 1.17 0.64 0.50 0.68 0.59
30 Sept 1995 31 Dec 1996 31 Dec 1997 31 Dec 1998 31 Dec 1999US$m US$m US$m US$m US$m
Balance SheetFixed assets 644.2 962.6 1,101.2 1,213.1 1,139.5
Current assets 237.0 267.3 258.1 276.2 197.9
Creditors:Amounts due within one year (89.1) (175.2) (206.3) (282.4) (341.0)
Net current assets/(liabilities) 147.9 92.1 51.8 (6.2) (143.1)
Total assets less current liabilities 792.1 1,054.7 1,153.0 1,206.9 996.4
Creditors:Amounts due over one year (201.2) (490.4) (614.4) (632.2) (578.6)
Capital and reservesStated capital 150.3 489.5 515.6 518.6 544.3Reserves 435.4 68.3 4.6 30.8 (153.1)
Shareholders’ funds 585.7 557.8 520.2 549.4 391.2
In 1996 the financial year end changed from 30 September to 31 December.
Five Year Financial Summary
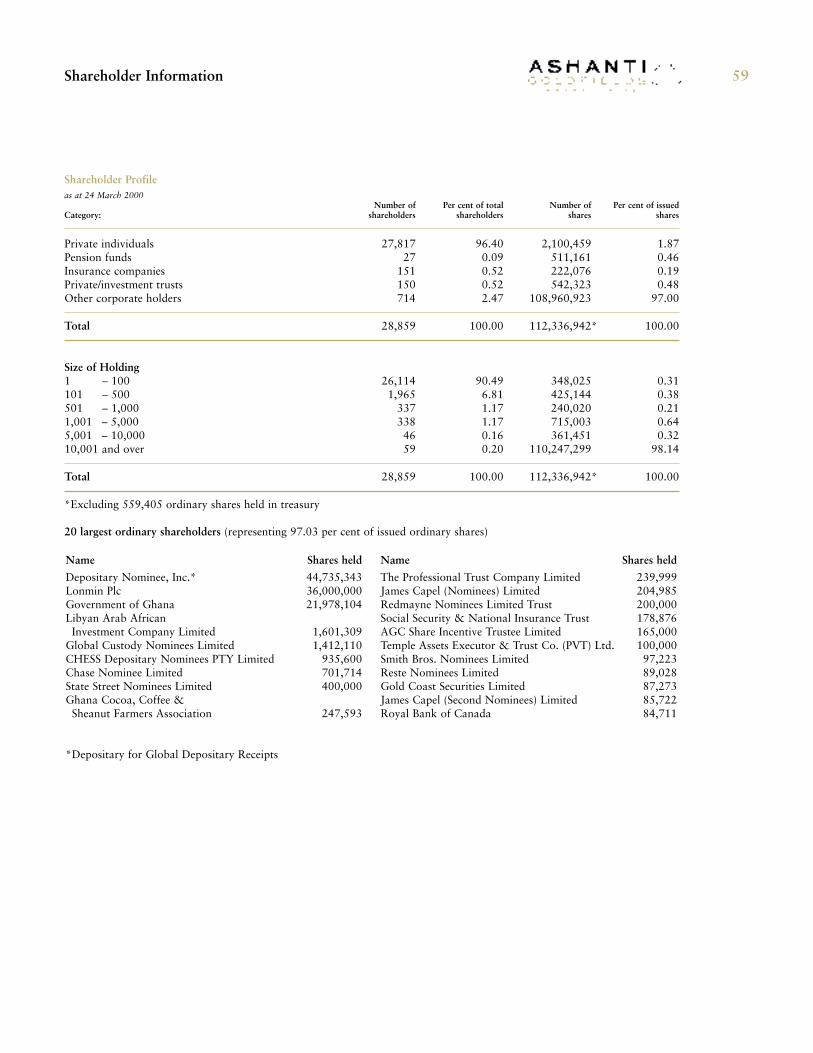
59Shareholder Information
Shareholder Profile as at 24 March 2000
Number of Per cent of total Number of Per cent of issuedCategory: shareholders shareholders shares shares
Private individuals 27,817 96.40 2,100,459 1.87Pension funds 27 0.09 511,161 0.46Insurance companies 151 0.52 222,076 0.19Private/investment trusts 150 0.52 542,323 0.48Other corporate holders 714 2.47 108,960,923 97.00
Total 28,859 100.00 112,336,942* 100.00
Size of Holding1 – 100 26,114 90.49 348,025 0.31101 – 500 1,965 6.81 425,144 0.38501 – 1,000 337 1.17 240,020 0.211,001 – 5,000 338 1.17 715,003 0.645,001 – 10,000 46 0.16 361,451 0.3210,001 and over 59 0.20 110,247,299 98.14
Total 28,859 100.00 112,336,942* 100.00
*Excluding 559,405 ordinary shares held in treasury
20 largest ordinary shareholders (representing 97.03 per cent of issued ordinary shares)
Name Shares held
Depositary Nominee, Inc.* 44,735,343Lonmin Plc 36,000,000Government of Ghana 21,978,104Libyan Arab AfricanInvestment Company Limited 1,601,309
Global Custody Nominees Limited 1,412,110CHESS Depositary Nominees PTY Limited 935,600Chase Nominee Limited 701,714State Street Nominees Limited 400,000Ghana Cocoa, Coffee &Sheanut Farmers Association 247,593
*Depositary for Global Depositary Receipts
Name Shares held
The Professional Trust Company Limited 239,999James Capel (Nominees) Limited 204,985Redmayne Nominees Limited Trust 200,000Social Security & National Insurance Trust 178,876AGC Share Incentive Trustee Limited 165,000Temple Assets Executor & Trust Co. (PVT) Ltd. 100,000Smith Bros. Nominees Limited 97,223Reste Nominees Limited 89,028Gold Coast Securities Limited 87,273James Capel (Second Nominees) Limited 85,722Royal Bank of Canada 84,711
60 Shareholder Information
Listing of Ordinary SharesThe Company’s ordinary shares are listed on the following international stock exchangesand trade under the symbols shown:
Australia AHAGhana AGCLondon AGLSNew York ASL (CUSIP # 043743202)Toronto AHD.U (CUSIP # 043743202)Zimbabwe –
On the Australian Stock Exchange, the shares also trade as CHESS Units of ForeignSecurities (CUFS).
The Company’s shares are also traded on the London, New York and Toronto stockexchanges by way of a sponsored Global Depositary Receipt (GDR) facility with The Bankof New York as Depositary. The ratio of GDRs to ordinary shares is 1:1. The securities arealso traded as ordinary shares on the Ghana and London stock exchanges.
On the Zimbabwe Stock Exchange, the Company’s securities are traded by way of asponsored Zimbabwe Depositary Receipt (ZDR) facility with Temple Assets Executor andTrust Company (Private) Limited as Depositary and are also traded as ordinary shares.The ratio of ZDRs to ordinary shares is 100:1.
Dividend PaymentsThe Company’s ordinary dividends are declared and paid in US dollars to shareholders onthe International Register unless they elect to receive them in pounds sterling.
Shareholders on the Australian Register receive their dividends in Australian dollars unlessthey elect to receive them in US dollars or pounds sterling.
Shareholders on the Ghana Register receive their dividends in Cedis unless they are non-resident and elect to receive them in US dollars or pounds sterling.
Shareholders on the Zimbabwe Register receive their dividends in Zimbabwe dollars.
The exchange rates used to determine the payments in other currencies are as at thedividend record date.
Dividend MandatesShareholders who wish to have their dividends paid directly into a bank or building societyaccount should contact their Registrars for a dividend mandate form.
Share Dividend PlanShareholders are normally offered the opportunity under the Ashanti Share Dividend Planto reinvest their cash dividends in the Company’s shares. In 1999 a share dividend wasoffered in respect of the final dividend for 1998. For tax purposes, the cash equivalentvalue of one new share in respect of the dividend was US$8.18.
To date the Ashanti Share Dividend Plan has not been offered to shareholders on theZimbabwe Register because they would be disadvantaged by the significant share pricedifferential between the London and Zimbabwe stock exchanges. The Company is monitoringthe share price differential and will offer a share alternative once the differential is consideredto be immaterial.
Shareholder Enquiries:
International Registrars’UK Transfer OfficeIRG plcBourne House, 34 Beckenham Road,Beckenham, Kent BR3 4TUTelephone: (208) 639 2000Fax: (020) 8639 2487
Australian RegistrarsPerpetual Securities Registration ServicesLevel 4333 Collins StreetMelbourne, Victoria 3000Telephone: (+61-3) 9205 4999Fax: (+61-3) 9205 4900
Ghana RegistrarsBarclays Bank of Ghana LimitedRegistrar’s DepartmentHigh StreetP O Box 2949AccraTelephone: (+233-21) 669404Fax: (+233-21) 667420
Zimbabwe RegistrarsSyfrets Corporate and Merchant Bank1st Floor 99 Jason Moyo AvenueP O Box 2540Harare, ZimbabweTelephone: (+263-4) 736 011Fax: (+263-4) 736 022
GDR Holder Enquiries:
The Bank of New YorkADR Department101 Barclay Street, 22nd FloorNew York, NY 10286Telephone: (+1-212) 815 5133Fax: (+1-212) 571 3050
61Officers
Corporate Office
S E Jonah *Chief Executive and Group Managing Director
Mrs M Botsio-Phillips *General Counsel
M B Keatley *Chief Financial Officer
Mrs E D Ofori Atta *Executive Director, Corporate Relations
H K A Otoo *Executive Director, Government Affairs
T S Schultz *Chief Operating Officer
E Abankroh *Company Secretary
J K Anaman *Managing Director, Public Affairs
K Awotwi *Managing Director, Strategic Planning & New Business Development
M. ArnesenManaging Director, International Treasury
A Darko *Managing Director, Information Systems & Telecoms
E Dwomoh-AppiahGroup Manager, Properties
A de FreitasGroup Mining Engineer
E Harlley *Group Manager, Internal Audit
E Twum-BarimahGroup Human Resources Co-ordinator
J E McGinleyGroup Health & Safety Co-ordinator
S OkrahCorporate Executive, Industrial Relations
A Owusu AnsahGeneral Manager, Logistics and Shipping
G TownsendGroup Financial Controller
K TshribiGeneral Manager, Legal
Freda-Rebecca, ZimbabweA NtiniManaging Director
K Akosah-BempahFinance Director
Bibiani MineD M A OwireduManaging Director
Iduapriem MineB HorochuckGeneral Manager
Obuasi and Ayanfuri MinesA DodsManaging Director
M K MracekDeputy Managing Director
M A AhorneyFinancial Controller
J A AmanorSenior Manager, Geology
Mrs E KwamiActing General Manager, Human Resources
D Mensah-AbrampahGeneral Manager, Processing
S Osei-BempahGeneral Manager, Ayunfuri
S Oti-BrakoGeneral Manager, Mining
J Y TimbillaGeneral Manager, Projects
Siguiri, GuineaI DansoDirecteur Générale and Managing Director,Société Ashanti Goldfields de Guinée
P DaviesDeputy Managing Director, Siguiri
Y AcheampongMine Manager, Siguiri
Group ProjectsG Potter *Managing Director
Geita, TanzaniaH MichaelManaging Director
O MajuruFinance Director
Ashanti ExplorationP N Cowley *Managing Director
*Member of the Chief Executive’s Committee
62 Notice of Annual General Meeting
Notice is hereby given that the twenty-seventh Annual General Meeting of Ashanti GoldfieldsCompany Limited will be held at the Len Clay Stadium, Obuasi, Ghana on Tuesday 30 May
2000 at 11.00 a.m. to transact the following business:
Ordinary ResolutionsOrdinary Business1. To receive and consider the reports of the directors and auditors and the accounts for the
year ended 31 December 1999.
2. To re-elect as a director Mr N J Morrell who is retiring by rotation.
To elect the following directors who were appointed by the Board since the last AnnualGeneral Meeting:
3. Mr A Ashiabor4. Mr E N Awoonor5. The Rt. Hon. The Baroness Chalker of Wallasey PC6. Dr D R Creed7. Dr C A Crocker8. Dr K Duffuor9. Mr T Gibian
10. Dr M P Martineau
11. To authorise the directors to determine the fees of the Company’s auditors.
Special Business12. THAT the directors be and they are hereby generally and unconditionally authorised
pursuant to Section 202(1) of the Companies Code, 1963 (Act 179) to exercise all thepowers of the Company to allot and issue:
(a) ordinary shares in connection with any option scheme or share scheme for directorsand/or employees approved by the members in General Meeting,
(b) up to 38,000,000 ordinary shares without offering such shares to existingshareholders in accordance with the provisions of sub-paragraph (b) of the saidSection 202(1) PROVIDED that this authority shall be limited so that, otherwise thanpursuant to the authority referred to above and a rights issue or similar offer whereshares or other securities are offered to ordinary shareholders and such holders ofother securities of the Company as the directors may determine on a fixed record datein proportion (as nearly as may be) to their then holdings of securities or inaccordance with the rights attached thereto (subject to such exclusions or otherarrangements as the directors may deem necessary or expedient in relation tofractional entitlements or having regard to any restrictions, obligations or practicalproblems arising from or under the laws or the requirements of any territory or of anyrecognised regulatory body or stock exchange or otherwise howsoever) the aggregatenumber of shares to be issued for cash by the directors pursuant to the authoritycontained in this sub-paragraph (b) shall not in aggregate exceed 5,600,000 ordinaryshares and such authority (unless previously revoked or renewed) shall expire on30 August 2001 or the conclusion of the next Annual General Meeting of theCompany (whichever is the earlier) save that the Company may before such expirymake an offer or agreement which would or might require shares to be allotted aftersuch expiry and the directors may allot and issue shares in pursuance of such offer oragreement as if the said authority had not expired.
13. THAT subject to the passing of Resolution 12 above the provisions of Section 202(2) ofthe Companies Code, 1963 (Act 179) be and they are hereby disapplied in connectionwith: (i) any issue of shares pursuant to the authorities conferred by Resolution 11 above;and (ii) any issue of treasury shares.
It is proposed by Resolution 12 to enablethe directors to allot unissued anduncommitted share capital of theCompany amounting to 38,000,000Ashanti shares (representing approxi-mately one-third of the current issuedshare capital of the Company) until30 August 2001 or the conclusion of thenext Annual General Meeting (whicheveris the earlier). This Resolution isproposed so as to give the directors thenecessary flexibility to take advantage ofbusiness opportunities as they arise. Thedirectors, other than in connection withoption schemes or share plans, have nopresent intention of using this authoritywhich renews an existing authority givento the directors each year.
It is also proposed by Resolution 12 toempower the directors to allot equitysecurities for cash without first offeringthem to existing shareholders inproportion to their holdings, subject to amaximum of 5,600,000 Ashanti sharesrepresenting approximately 5 per cent ofthe current issued share capital. Thedirectors, other than in connection withoption schemes or share plans, have nopresent intention of using this authoritywhich replaces the equivalent resolutionpassed at the last Annual GeneralMeeting and will expire on 30 August2001 or at the conclusion of next year’sAnnual General Meeting (whichever isthe earlier). This Resolution is proposedso as to give the directors the necessaryflexibility to take advantage of businessopportunities as they arise and the5,600,000 ordinary shares limit for issuesof shares for cash ensures that existingshareholders’ interests are protected.
63Notice of Annual General Meeting
Special Resolution14. THAT the Company be and it is hereby unconditionally authorised to exercise all the
powers of the Company to make market or off market purchases of the Company’sordinary shares up to an aggregate of 12,000,000 ordinary shares at a price per share(exclusive of expenses) of not more than 5 per cent above the average of the respectivemiddle market quotations for the shares as derived from the Daily Official List of theLondon Stock Exchange for the 5 business days before the purchase is made, suchauthority (unless previously revoked or renewed) shall expire on 30 August 2001 or atthe conclusion of the next Annual General Meeting of the Company (whichever is theearlier) save that the Company may before such expiry enter into a contract topurchase shares which would or might require to be executed wholly or partly aftersuch expiry and may make a purchase of shares pursuant to such contract as if the saidauthority had not expired.
By order of the Board Registered OfficeGold House
Patrice Lumumba RoadRoman RidgePO Box 2665
AccraErnest AbankrohSecretary 12 April 2000
Notes:1. A member entitled to attend and vote at the meeting is entitled to appoint a proxy to attend and
vote instead of him. A proxy need not be a member. Completion and return of an instrumentappointing a proxy will not preclude a member from attending and voting in person at themeeting.
2. In order to be valid, the instrument appointing a proxy and the power of attorney or otherauthority (if any) under which it is signed, or a copy of such authority certified notarially or insome other way approved by the Board, must be deposited at the offices of the Company’sRegistrars in Ghana, Barclays Bank of Ghana Limited, High Street, PO Box 2949, Accra, Ghanaor at the UK Transfer Office of the Company’s International Registrars, IRG plc, Bourne House,34 Beckenham Road, Beckenham, Kent BR3 4TU, UK or at the offices of the Company’sRegistrars in Australia, Perpetual Securities Registration Services, Level 4, 333 Collins Street,Melbourne, Victoria 3001, Australia or at the offices of the Company’s Registrars in Zimbabwe,Syfrets Corporate and Merchant Bank, 1st Floor, 99 Jason Moyo Avenue, PO Box 2540, Harare,Zimbabwe, not less than 48 hours before the time appointed for holding the meeting.
FAILURE TO DEPOSIT THE FORM OF PROXY AS REQUIRED WILL RESULT IN THEPROXY NOT BEING ADMITTED TO, OR PARTICIPATING IN THE MEETING.
3. In the case of joint registered holders of any share, the vote of the senior who tenders a vote,whether in person or by proxy, shall be accepted to the exclusion of the vote of the other jointholders. For this purpose seniority shall be determined by the order in which the names of theholders stand in the register.
4. Copies of the directors’ service agreement of more than one year’s duration will be available forinspection during business hours at the Company’s registered office and the UK Transfer Officereferred to in Note 2 above from the date of this Notice and at the Len Clay Stadium, Obuasi,Ghana from 10.00 a.m. on Tuesday 30 May 2000 until the end of the meeting.
It is proposed by Resolution 14 to renewthe Company’s authority to purchase itsown issued shares at a price which is notmore than 5 per cent (exclusive ofexpenses) above the average of themarket values of Ashanti shares takenfrom the London Stock Exchange DailyOfficial List for the five business daysbefore the purchase is made. Theauthority will be for the purchase of amaximum of 12,000,000 Ashanti shares(approximately 10 per cent of theCompany’s current issued share capital)and will expire on 30 August 2001 or atthe conclusion of next year’s AnnualGeneral Meeting (whichever is theearlier). It is presently intended that aresolution for its renewal will beproposed at each succeeding AnnualGeneral Meeting. The Company willcontinue to make purchases when itconsiders appropriate although nopurchases will be made unless the effectwill be to increase expected earnings pershare and such purchases would be in thebest interests of shareholders generally.
64
This annual report contains a number of statements relatingto future results of Ashanti that are considered “forwardlooking statements” as defined in the Private SecuritiesLitigation Reform Act 1995 of the United States of America.Statements that are not historical facts, including statementsabout our beliefs and expectations, are forward lookingstatements. Such statements may include statements regardingfuture plans, objectives or goals, anticipated production orconstruction commencement dates, construction completiondates, expected costs or production output and theanticipated productive lives of mines.
These statements are based on current plans, estimates andprojections and, therefore, undue reliance should not beplaced on them. Ashanti can give no assurances that suchresults, including the actual production or commencementdates, construction or completion dates, costs or productionoutput or anticipated lives of the projects and minesdiscussed will not differ materially from the statementscontained in the annual report. Such forward lookingstatements are not guarantees of future performance andinvolve known and unknown risks, uncertainties and otherfactors, many of which are beyond the control of Ashanti,which may cause actual results to differ materially from thoseexpressed in the statements contained in this annual report.For example, future revenues from projects or minesdescribed herein will be based in part upon the market priceof gold, which may vary significantly from current levels.Such variations, if materially adverse, may impact the timingor feasibility of the developments of a particular project orthe expansion of specified mines.
Other factors that may affect the actual construction orproduction commencement dates, costs or production outputand anticipated lives of mines include the ability to profitablyproduce and transport gold extracted therefrom to applicablemarkets, the impact of foreign currency exchange rates onmarket prices of gold and activities by governmentalauthorities where such projects or mines are being exploredor developed, including increases in taxes, changes inenvironmental and other regulations and political uncertainty.
Forward looking statements speak only as of the date theyare made, and Ashanti undertakes no obligation to updatepublicly any of them in light of new information or future events.
65
Designed and produced by THE & FACTOR. Printed in England by royle corporate print
Corporate Information
Registered OfficeGold HousePatrice Lumumba RoadPO Box 2665Accra, GhanaTelephones: (+233-21) 772190
(+233-21) 772235(+233-21) 778160(+233-21) 778167(+233-21) 761311
(Satellite) 874 1562524Fax: (+233-21) 775947(Satellite) 874 1562525Website www.ashanti.com.gh
Ernest AbankrohCompany SecretaryTelephone: (+233-21) 774977Fax: (+233-21) 778155E-Mail Address [email protected]
London Office3rd Floor, Roman HouseWood StreetLondon EC2Y 5BAUnited KingdomTelephone: (+44-20) 7256 9938Fax: (+44-20) 7256 9939
Investor RelationsCorporate OfficeKweku AwotwiManaging Director, Strategic PlanningNew Business DevelopmentTelephones: (+233-21) 772331
(+233-21) 774069Fax: (+233-21) 776501E-Mail Address [email protected]
London OfficeCorinne GaisieUK RepresentativeTelephone: (+44-20) 7256 9938Fax: (+44-20) 7256 9939E-Mail Address [email protected]
4C Communications LtdCarina CorbettTelephone: +44 (0)20 8949 7171Fax: +44 (0)20 8942 5733E-Mail Address [email protected]
Golin HarrisAllan Jordan (New York)Telephone: (+1-212) 697 9191Fax: (+1-212) 697 3720
Ayanfuri MinePO Box 393, Dunkwa-on-Offin, GhanaTelephones: (+233-31) 21451/2
(+233-31) 21448(Satellite) 871 68620025Fax: (+233-31) 21572(Satellite) 871 68620026
Bibiani MinePO Box 98, Bibiani, GhanaTelephone: (+233-51) 20118Satellite Fax: 873 761314865
Freda-Rebecca MinePO Box 70, Bindura, ZimbabweTelephone: (+263-71) 7300/1Fax: (+263-71) 6919
Iduapriem MinePO Box 283, Tarkwa, GhanaTelephone: (+233-362) 505(Satellite) 873 1627111Fax: (+233-362) 479(Satellite) 873 1627112
Obuasi MinePO Box 10, Obuasi, GhanaTelephones: (+233-582) 494–8
(+233-582) 475Fax: (+233-582) 268
Geita Mine48 Mkadini StreetOyster Bay, Dar es SalaamPO Box 75803Telephone: (+255-51) 666521
(+255-51) 666277(+255-51) 668391
Fax: (+255-51) 602889
Siguiri Minec/o Société Ashanti Goldfields de GuinéeKM4, Cameroun B.P. 1006Conakry, GuinéeTelephone: (+1-301) 916 53 87Satellite 873 761333884
873 685-51881Fax: (+1-301) 916 53 79Satellite 873 76333885
Ashanti Exploration4, Nortei Ababio StreetRoman RidgePO Box 2665, Accra, GhanaTelephones: (+233-21) 774377
(+233-21) 767335/6Fax: (+233-21) 778739
Group Projects16 Noi Fretreke StreetPO Box 9255, Accra, GhanaTelephones: (+233-21) 772215
(+233-21) 772287Fax: (+233-21) 773521
International ProcurementRoman House, Wood StreetLondon EC2Y 5HQUnited KingdomTelephone: (+44-20) 7448 3900Fax: (+44-20) 7638 9670
Ashanti Goldfields Company Limited Registered in Ghana No. 7094 ARBN 074 370 862