georgia alternate assessment 2009-2010 post assessment workshop kathy cox, state superintendent of...
TRANSCRIPT
Georgia Alternate Assessment
2009-2010Post Assessment Workshop
Kathy Cox, State Superintendent of Schools“We will lead the nation in improving student achievement.”

2
Purpose of this Workshop
• The purpose of this workshop is to provide System and School personnel with information to interpret reports and data related to the Georgia Alternate Assessment (GAA).
3
The Georgia Alternate Assessment
The GAA is designed to ensure that students with
significant cognitive disabilities are:
• Provided access to the state-mandated curriculum.
• Given the opportunity to demonstrate progress toward achievement of curriculum knowledge, concepts, and skills.
4
Topics that will be presented and discussed
• The Georgia Alternate AssessmentThe Use of Alternate Assessments and GAA ScoresGAA Scoring Rubric
• Portfolios Submitted2008-2009 vs. 2009-2010
• Nonscorables
• How Scores Are Calculated
• GAA Score Reports
• Interpreting the GAA Scores
5
The Use of Alternate
Assessments and GAA Scores
• The GAA serves as one indicator of student achievement and progress and should be interpreted in conjunction with other available information about the student.
• The GAA no longer serves as a direct evaluation of the progress a student makes on IEP goals and objectives. However, IEP goals remain important and should be considered along with GAA scores.

6
Rubric Dimensions• Fidelity to Standard:
A dimension of the scoring rubric that assesses the degree to which the instructional activity, as demonstrated by student work, addresses the grade-level standard.
• Context: A dimension of the scoring rubric that assesses the degree to which the
student work exhibits the use of grade-appropriate materials that reflect a purposeful and natural/real-world application.
• Achievement/Progress: A dimension of the scoring rubric that assesses the measurable, forward
movement of a student’s performance of a standards-based instructional task as documented by increased proficiency over time. Progress will be assessed from the first collection period, which will demonstrate the student’s initial skill level, to the second collection period, which will demonstrate a more advanced level of skill development.
• Generalization: A dimension of the scoring rubric that assesses the student’s opportunity
to apply learned skills in other settings and with various individuals in addition to the teacher or paraprofessional. Generalization is scored once across the portfolio.

7
Possible scores for each dimension are as follows:
Dimension Possible Points
Fidelity to Standard 1-3
Context 1-4
Achievement/Progress 1-4
Generalization 1-4
•Fidelity to Standard, Context, and Achievement/Progress are scored for each entry.
•Generalization is scored once across the entire portfolio.
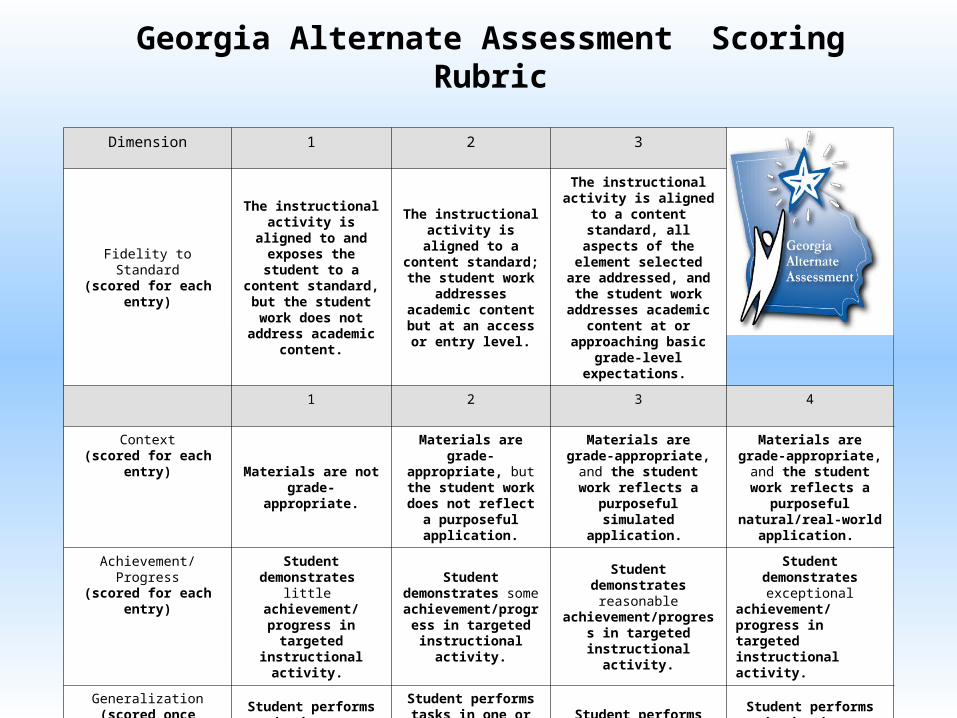
Georgia Alternate Assessment Scoring Rubric
Dimension 1 2 3
Fidelity to Standard(scored for each entry)
The instructional activity is aligned to and exposes the student to a content standard, but the student work does not address academic
content.
The instructional activity is aligned to a content standard; the
student work addresses academic content but at an access or entry level.
The instructional activity is aligned to a content
standard, all aspects of the element selected are
addressed, and the student work addresses academic content at or approaching
basic grade-level expectations.
1 2 3 4
Context(scored for each entry)
Materials are not grade-appropriate.
Materials are grade-appropriate, but the
student work does not reflect a purposeful
application.
Materials are grade-appropriate, and the
student work reflects a purposeful simulated
application.
Materials are grade-appropriate, and the
student work reflects a purposeful natural/real-
world application.
Achievement/ Progress(scored for each entry)
Student demonstrates little
achievement/progress in targeted instructional
activity.
Student demonstrates some
achievement/progress in targeted instructional
activity.
Student demonstrates reasonable
achievement/progress in targeted instructional
activity.
Student demonstrates exceptional
achievement/progress in targeted instructional activity.
Generalization(scored once across all
entries in portfolio)
Student performs tasks in one or more settings
with no evidence of interaction(s) beyond
those with the primary instructional provider.
Student performs tasks in one or more settings
with evidence of interaction (s) with other instructional providers and/or
disabled classmates.
Student performs tasks in two different settings with evidence of interaction(s) with non-disabled peers
and/or community members.
Student performs tasks in three or more different settings with evidence of interaction(s) with non-disabled peers and/or community members.
9
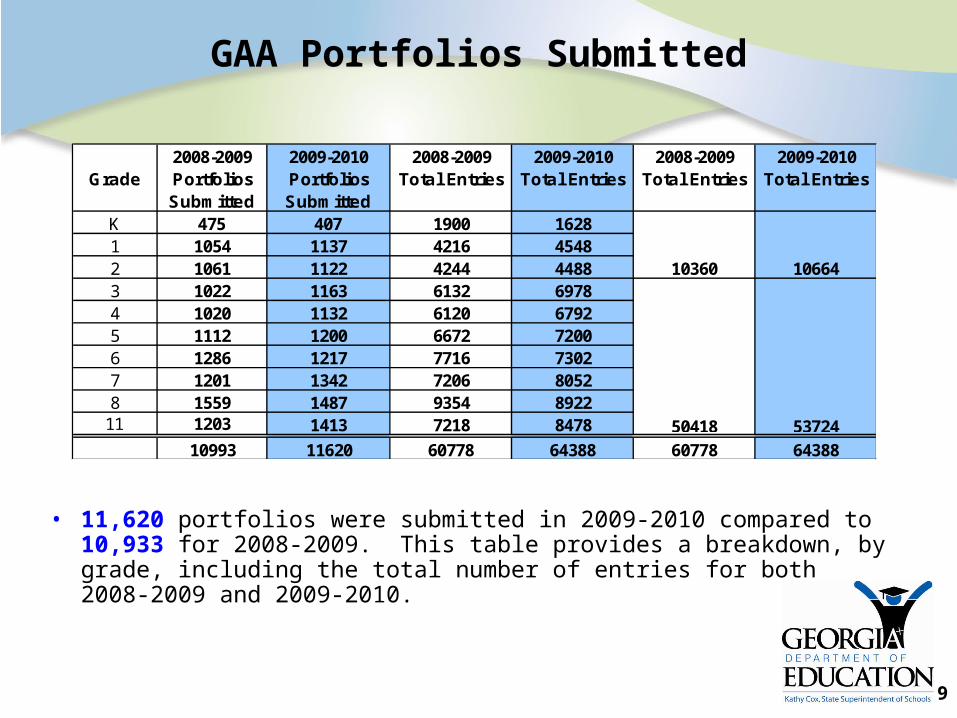
GAA Portfolios Submitted
• 11,620 portfolios were submitted in 2009-2010 compared to 10,933 for 2008-2009. This table provides a breakdown, by grade, including the total number of entries for both 2008-2009 and 2009-2010.
Grade2008-2009 Portfolios Submitted
2009-2010 Portfolios Submitted
2008-2009 Total Entries
2009-2010 Total Entries
2008-2009 Total Entries
2009-2010 Total Entries
K 475 407 1900 16281 1054 1137 4216 45482 1061 1122 4244 44883 1022 1163 6132 69784 1020 1132 6120 67925 1112 1200 6672 72006 1286 1217 7716 73027 1201 1342 7206 80528 1559 1487 9354 8922
11 1203 1413 7218 8478
10993 11620 60778 64388 60778 64388
10664
53724
10360
50418
10
What We Found• In general, the portfolios were complete and well
executed.• It was apparent that emphasis continues on training as
well as on utilizing the manual.• The portfolios provided valuable information as to areas
of focus for upcoming training. Training will continue to focus on alignment, documentation,
and evidence requirements.
• Across all grades and content areas, the vast majority of students met or exceeded expectations as demonstrated by their Performance Level Indicator.
• Number and percent of Nonscorables went down in all categories as compared to all previous administrations.

• E/LA– 89% of all students demonstrated Established or Extending Progress• Math– 93% of all students demonstrated Established or Extending Progress• Science–98% of all students demonstrated Established or Extending Progress• Social studies–99% of all students demonstrated Established or Extending Progress

What We Found
• Although Nonscorable entries decreased, invalidations due to falsified or fabricated evidence increased.This will be addressed further during the Fall GAA
training.Focus will be on support for teachers as well as on
portfolio review, validating the evidence, and ethics.New validation procedures will be put in place for
2010-2011 administration to address these issues.
13
Frequency of Nonscorables
• The majority of Nonscorables received a code of Not Aligned (NA).The vast majority of these were because one or more
of the instructional tasks (not all) were not aligned to the content standard and element and thus received the code of NA-B.
• The next highest number of nonscorable entries received the code of Insufficient Evidence (IE)A significant decrease was also found in this
category from the previous administrations.

14
2009-2010Nonscorable Code Chart
Should a student receive a Nonscorable Code for an entry, the code and it’s definition will be provided on side 2 of the Individual Student Report.
The Nonscorable Codes and Definitions are also provided on side 2 of the Student Roster so they can be used when interpreting the score reports.

15
Frequency of Nonscorablesby Number and Percent
2009-2010NS Code Frequency Percent of NS Percent of all entries
ME 204 4.30% 0.32%
ES 86 1.81% 0.13%
NA 2574 54.30% 4.00%
IE 1679 35.42% 2.61%
IT 196 4.14% 0.30%
OG 1 0.02% ≈ 0.00%
IS 0 0.00% 0.00%
Total 4740 100.00% 7.36%
4,740 of 64,388 entries received NS codes
16
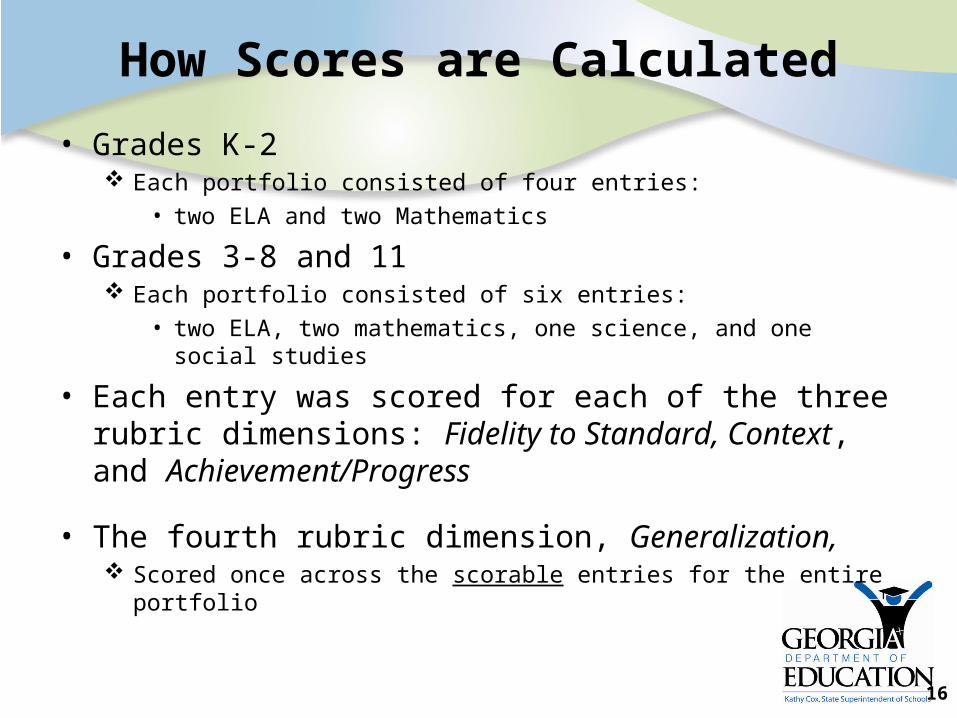
How Scores are Calculated
• Grades K-2 Each portfolio consisted of four entries:
• two ELA and two Mathematics
• Grades 3-8 and 11 Each portfolio consisted of six entries:
• two ELA, two mathematics, one science, and one social studies
• Each entry was scored for each of the three rubric dimensions: Fidelity to Standard, Context, and Achievement/Progress
• The fourth rubric dimension, Generalization, Scored once across the scorable entries for the entire portfolio

17
Score CalculationFidelity to Standard, Context, Achievement/Progress
ELA and Mathematics: A total score for each dimension within each content area is calculated as the average of the two entry scores rounded to the nearest whole point. If one entry is nonscorable, that entry is treated as having a score of zero for the purpose of calculating the average.
Dimension Score = Entry 1 Score + Entry 2 Score 2
(rounded up to the nearest point)
Examples:
Rubric Dimension: Fidelity to StandardELA Entry 1 score: 2ELA Entry 2 score: 3Total score = (2 + 3) / 2 = 2.5
2.5 rounds to 3
Total Fidelity to Standard Dimension score = 3
Rubric Dimension: ContextMath Entry 1 Score: 1Math Entry 2 score: IE-A (nonscorable = 0)Total score = (1 + 0) / 2 = 0.5
0.5 rounds to 1
Total Context Dimension score = 1
18
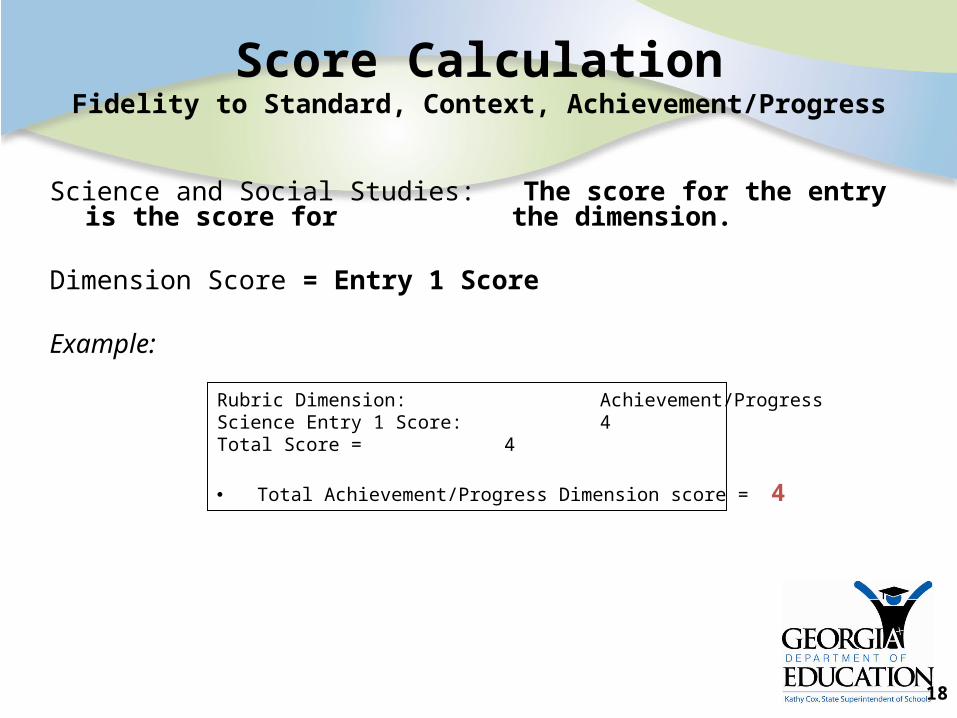
Score CalculationFidelity to Standard, Context, Achievement/Progress
Science and Social Studies: The score for the entry is the score for the dimension.
Dimension Score = Entry 1 Score
Example:
Rubric Dimension: Achievement/ProgressScience Entry 1 Score: 4Total Score = 4
Total Achievement/Progress Dimension score = 4
19
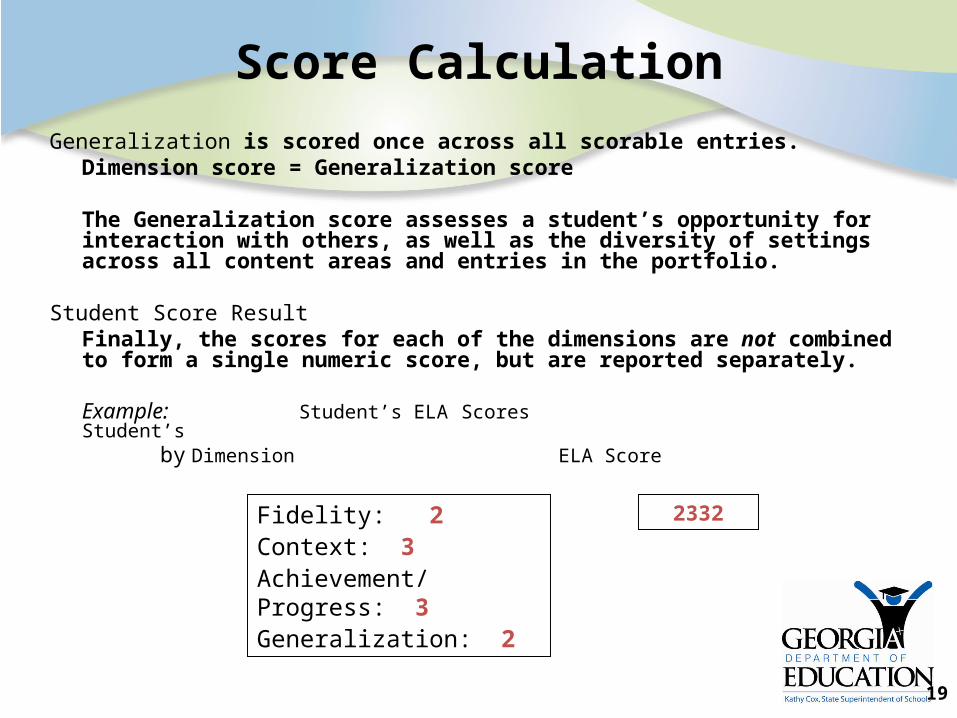
Score Calculation
Generalization is scored once across all scorable entries.Dimension score = Generalization score
The Generalization score assesses a student’s opportunity for interaction with others, as well as the diversity of settings across all content areas and entries in the portfolio.
Student Score ResultFinally, the scores for each of the dimensions are not combined to form a single numeric score, but are reported separately.
Example: Student’s ELA Scores Student’s by Dimension ELA Score
Fidelity: 2Context: 3Achievement/Progress: 3Generalization: 2
2332
20
GAA Score Reports
• GAA score reports provide information on the Stage of Progress achieved by each student in each content area, as well as the assigned score for each rubric dimension.
21
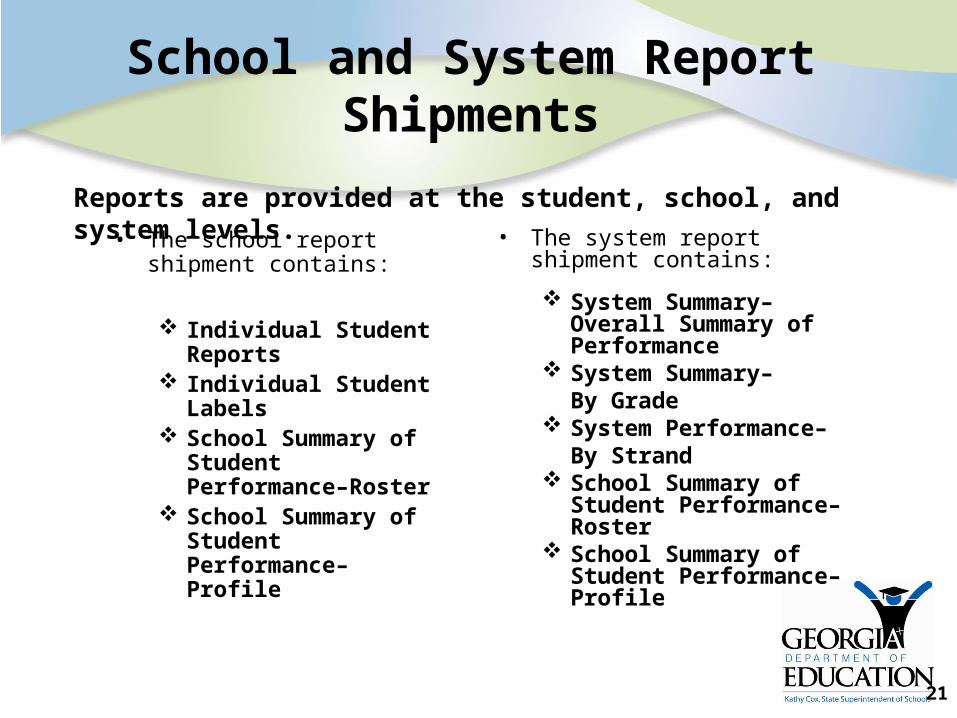
School and System Report Shipments
• The school report shipment contains:
Individual Student Reports
Individual Student Labels
School Summary of Student Performance–Roster
School Summary of Student Performance– Profile
• The system report shipment contains:
System Summary– Overall Summary of Performance
System Summary– By Grade
System Performance–By Strand
School Summary of Student Performance–Roster
School Summary of Student Performance– Profile
Reports are provided at the student, school, and system levels.
22
Secure Summary Reports
• Due to the small numbers of students participating in the GAA, all summary reports are marked as secure.
• Any report that identifies an individual student is a secure report and must be treated in a way to protect the privacy of the student.
• The following statement appears on each Summary report: “Secure Report— Not for public distribution due to
limited number of students; caution should be used when interpreting summary data.”

23
Individual Student Reports
The Student Score Report is designed for parents and provides feedback on how the student performed on the GAA.
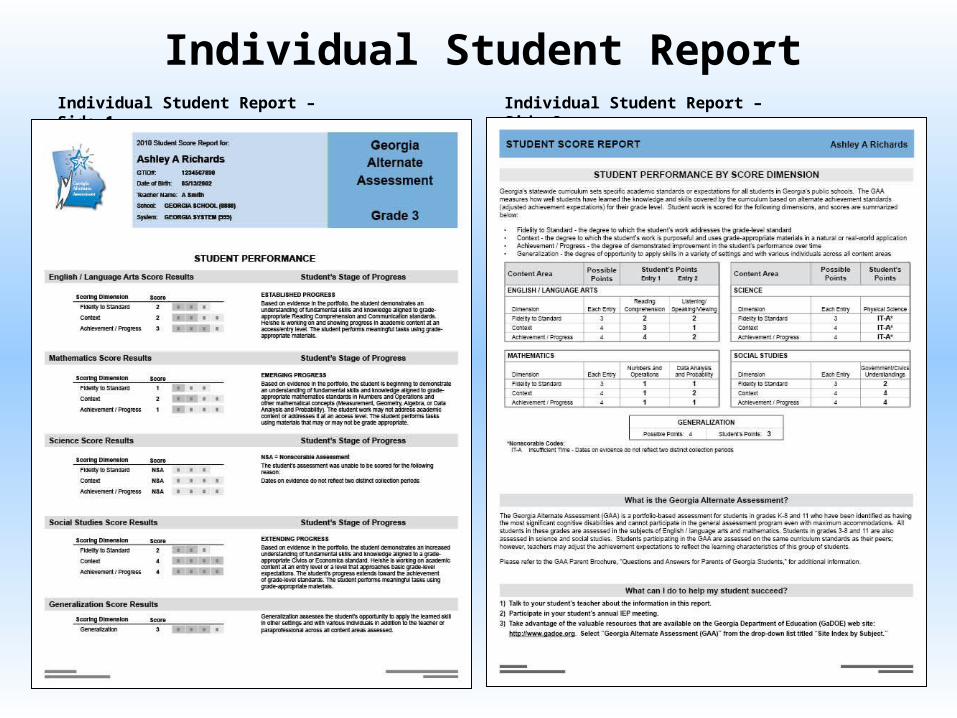
Individual Student ReportIndividual Student Report – Side 1 Individual Student Report – Side 2

25
Individual Student Report
Scores for each content area assessed by dimension
Fidelity to Standard Context Achievement/Progress
Description of the student's stage of Progress (performance level)
Extending Progress Established Progress Emerging Progress
Side One:

26
Individual Student ReportIndividual Student Report
The dimension score earned for Generalization
Side One:
27
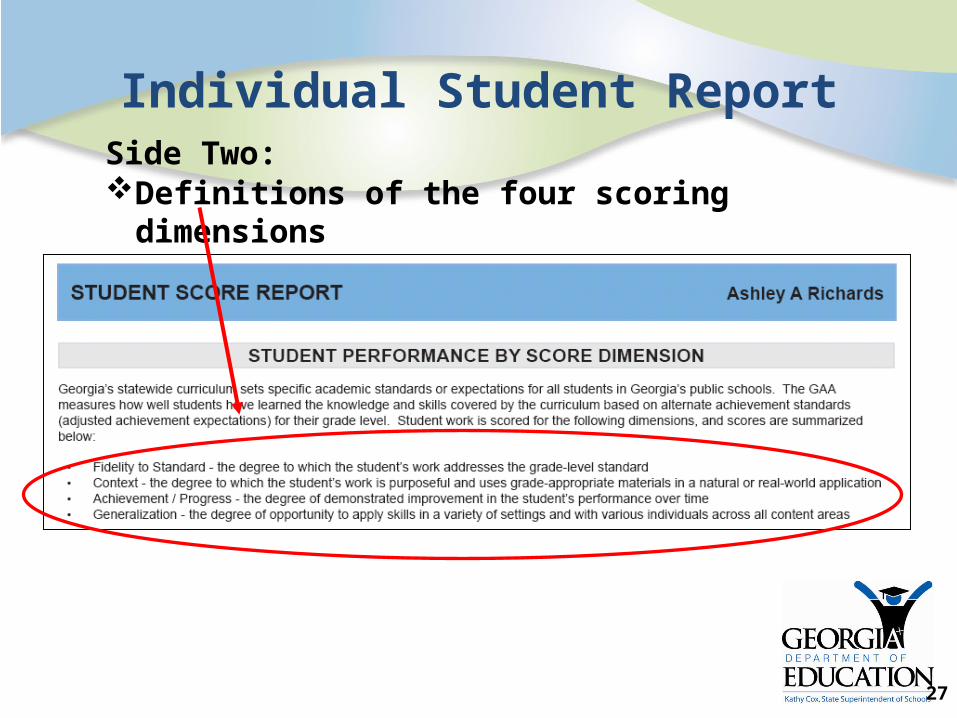
Individual Student Report
Definitions of the four scoring dimensionsSide Two:
28
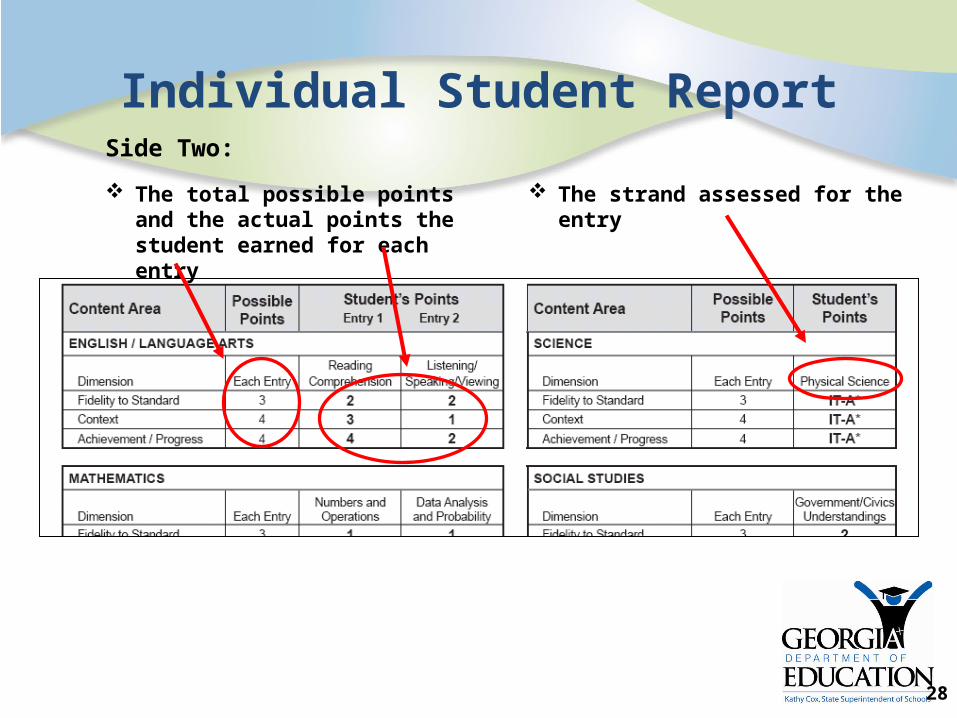
Individual Student Report
The total possible points and the actual points the student earned for each entry
The strand assessed for the entry
Side Two:
29
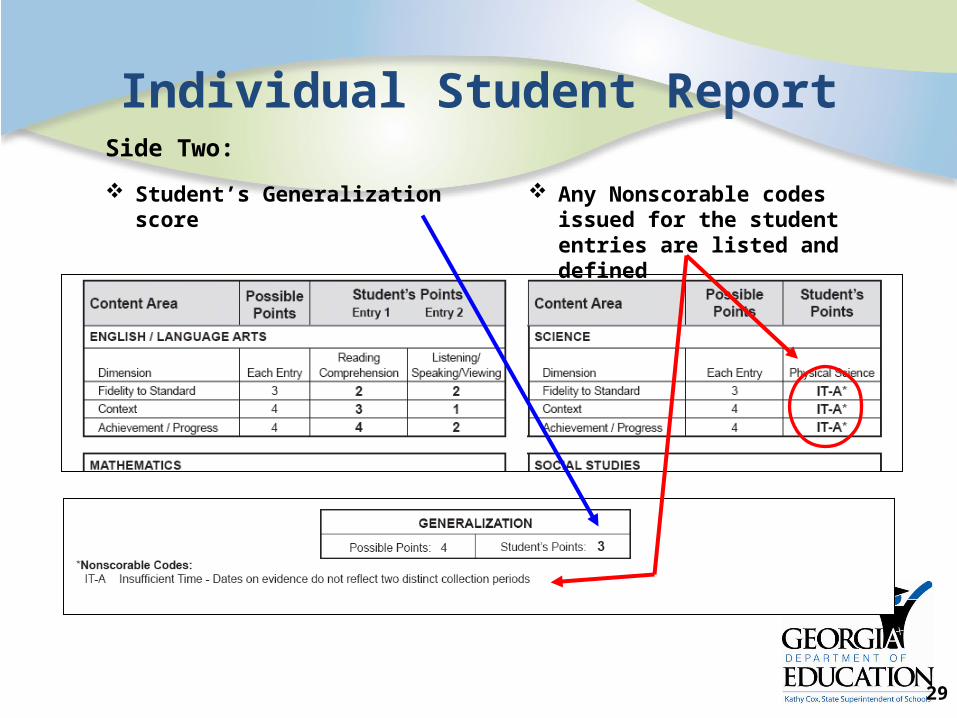
Individual Student Report
Student’s Generalization score Any Nonscorable codes issued for the student entries are listed and defined
Side Two:
30
Individual Student Labels
• The Individual Student Label presents summary information similar to that contained on the Student Score Report but on a small label appropriate for use in a student’s permanent record folder.

Individual Student LabelsSample Label for Grades K - 2
Sample Label for Grades 3-8 and 11

32
School Reports
• The School Summary of Student Performance, organized by grade, is made up of two parts:
School Summary of Student Performance– Roster
School Summary of Student Performance– Profile

School Summary of Student Performance– Roster Side 1
34
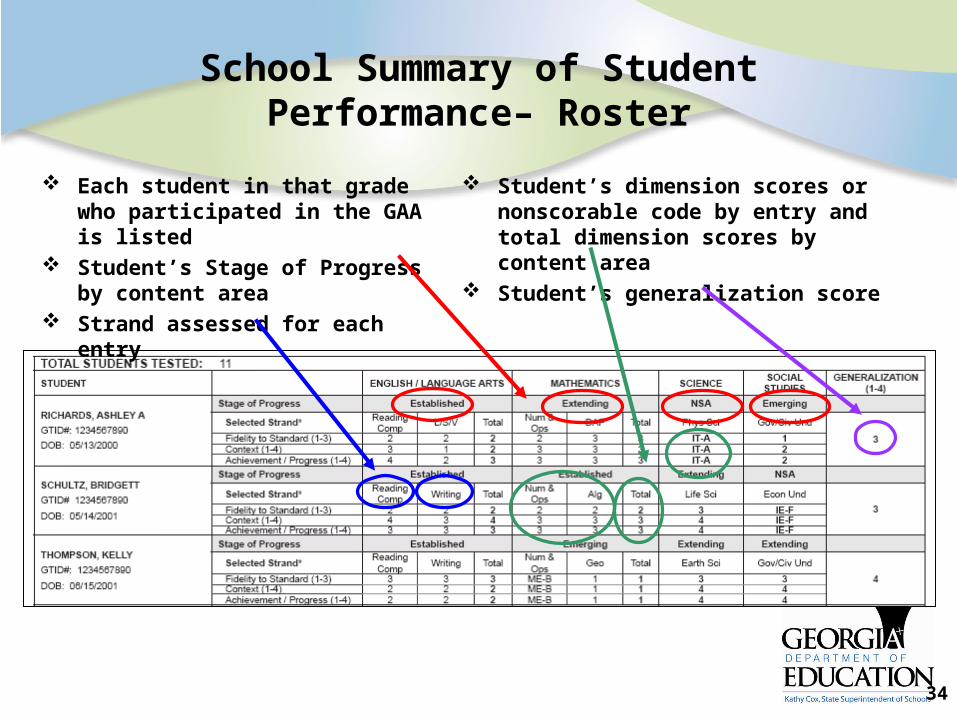
School Summary of Student Performance– Roster
Each student in that grade who participated in the GAA is listed
Student’s Stage of Progress by content area
Strand assessed for each entry
Student’s dimension scores or nonscorable code by entry and total dimension scores by content area
Student’s generalization score
35
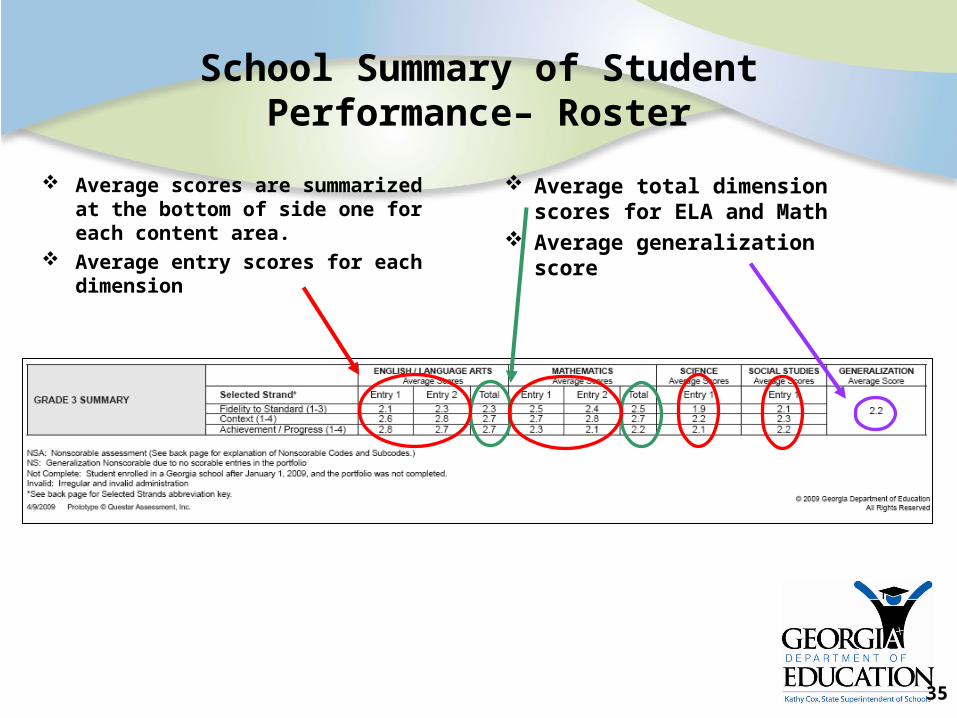
School Summary of Student Performance– Roster
Average scores are summarized at the bottom of side one for each content area.
Average entry scores for each dimension
Average total dimension scores for ELA and Math
Average generalization score

36
School Summary of Student Performance– Roster
Student Roster– side 2: provides a “Strand Abbreviation Key” and the
“Nonscorable Codes and Definitions”

School Summary of Student Performance– Roster
Side 2
38
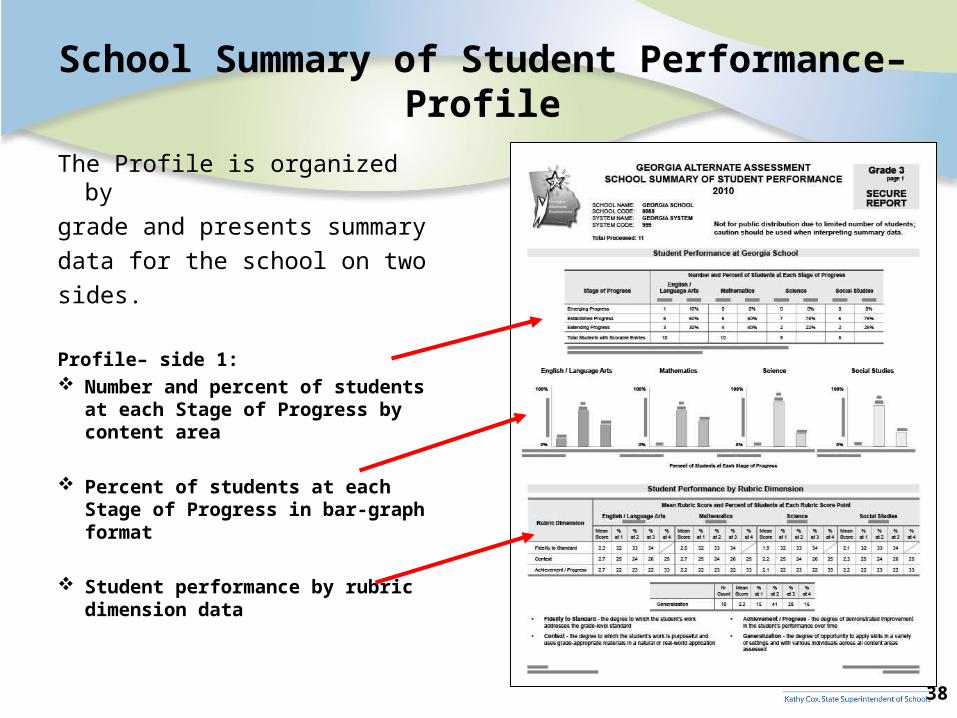
School Summary of Student Performance– Profile
The Profile is organized by
grade and presents summary
data for the school on two
sides.
Profile– side 1: Number and percent of students
at each Stage of Progress by content area
Percent of students at each Stage of Progress in bar-graph format
Student performance by rubric dimension data

39
School Summary of Student Performance– Profile
Profile– side 2: Student Performance by Population
Group for School N-counts Percent at each Stage of Progress
Detail for Portfolios and Entries Not Scored Not Complete Portfolios Invalidations Nonscorable Assessments and
breakdown by Nonscorable Code

40
System Reports
• The System Summary Report is made up of two parts:Overall Summary of PerformanceSystem Summary by Grade
• Data are presented for all students tested in the system and are also broken down by grade.
• Caution must be taken when interpreting summary data.

41
System Report–Overall Summary of Performance
• Overall Summary of Performance lists system-wide performance of students taking the GAA by content area.

System Summary– Overall Summary of Performance
43
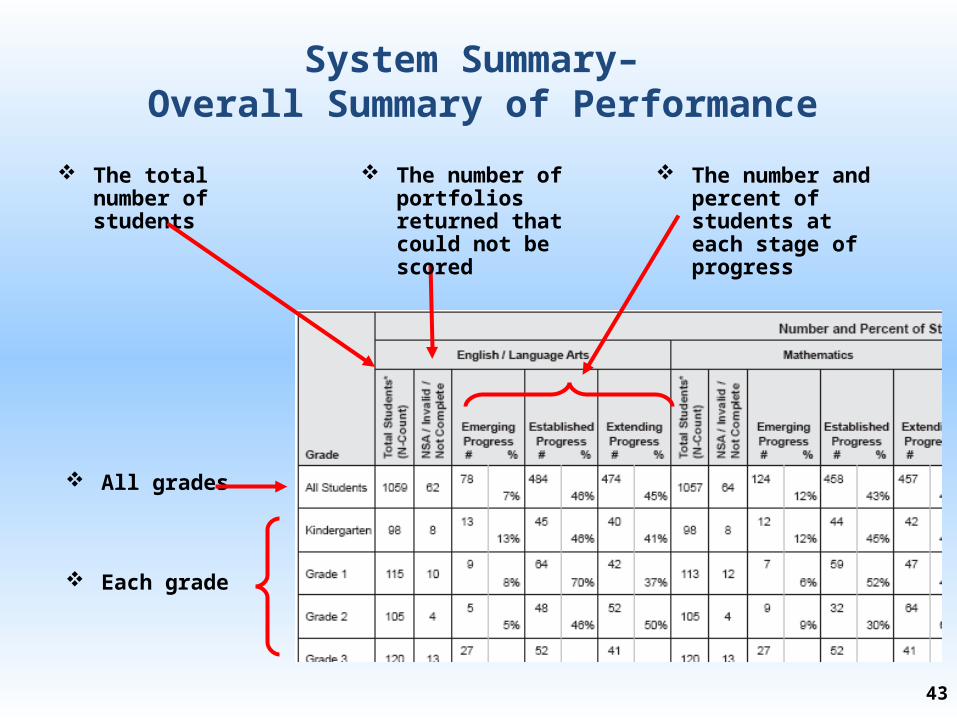
System Summary– Overall Summary of Performance
The total number of students
The number and percent of students at each stage of progress
The number of portfolios returned that could not be scored
All grades
Each grade
44
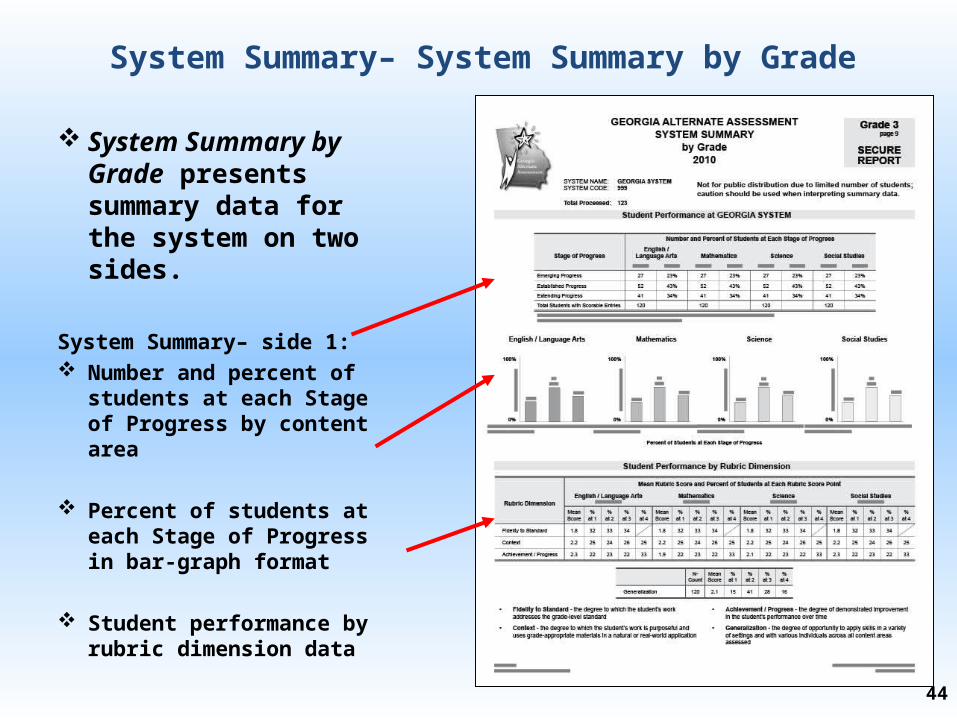
System Summary– System Summary by Grade
System Summary by Grade presents summary data for the system on two sides.
System Summary– side 1: Number and percent of
students at each Stage of Progress by content area
Percent of students at each Stage of Progress in bar-graph format
Student performance by rubric dimension data

45
System Summary– System Summary by Grade
System Summary – side 2: Student Performance by Population
Group for System N-counts Percent at each Stage of Progress
Detail for Portfolios and Entries Not Scored Not Complete Portfolios Invalidations Nonscorable Assessments and
breakdown by Nonscorable Code

46
System Reports–System Performance by Strand
System Performance by Strand provides a summary of student’s scores by content area and strand for each of the rubric dimensions.
Content area/strand data is collected from the Student Demographic Information Forms (SDIFs) that were completed at the school level and returned with each portfolio.
• The total number of students tested for each content area and strand indicated on the report may not equal the actual number of students tested if the SDIFs were not completed correctly.

System Performance by Strand
48
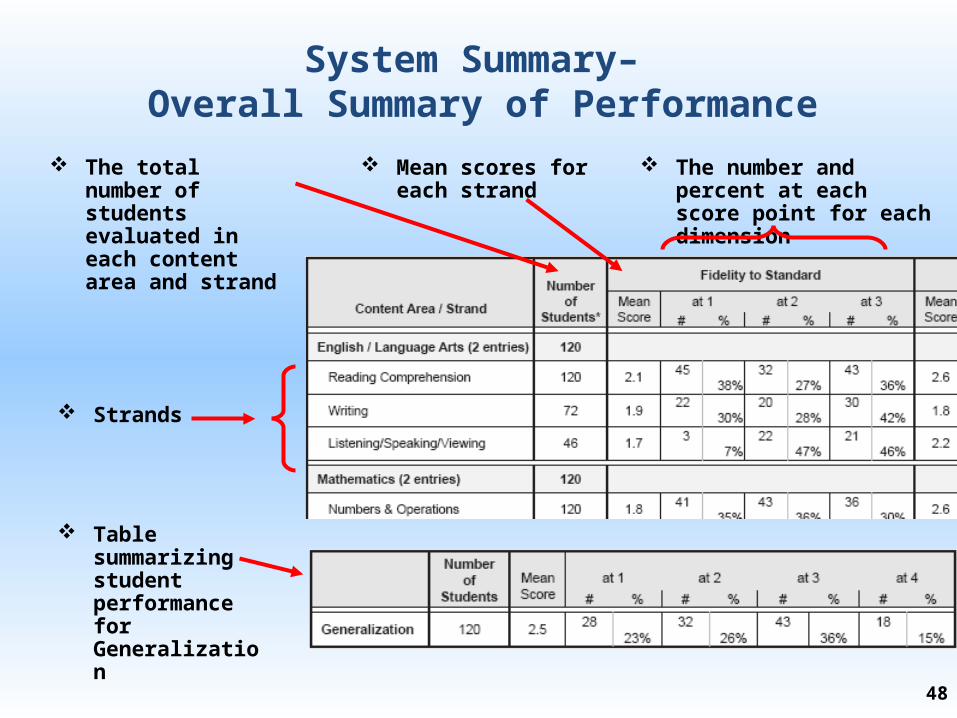
System Summary– Overall Summary of Performance
The total number of students evaluated in each content area and strand
The number and percent at each score point for each dimension
Mean scores for each strand
Strands
Table summarizing student performance for Generalization
Interpreting GAA Scores
Use the GAA Score Interpretation Guide as a Reference!
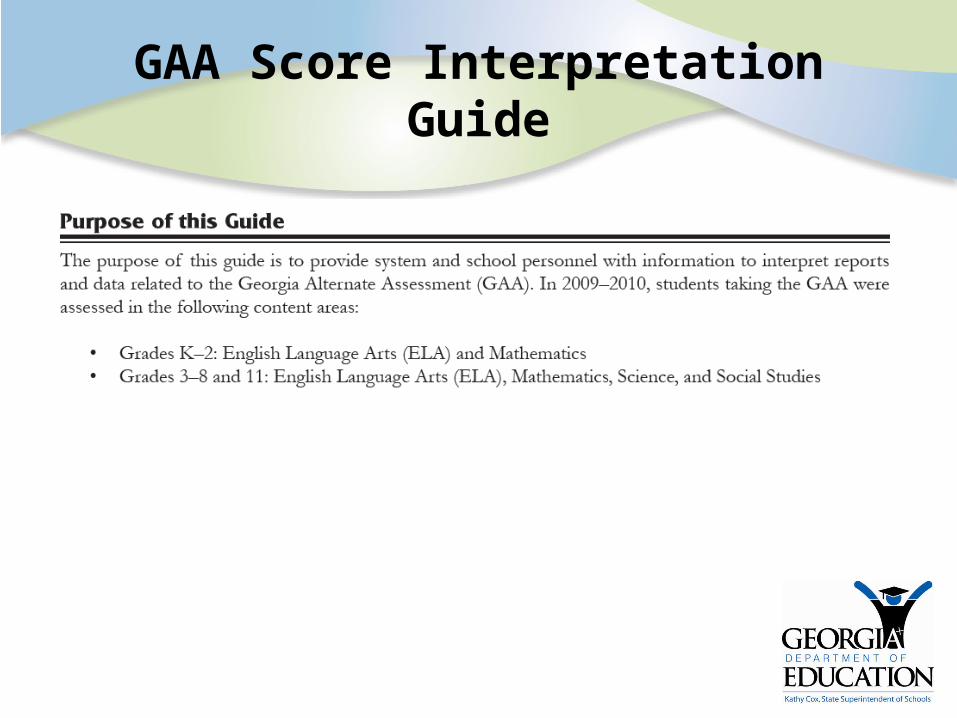
GAA Score Interpretation Guide
52
GAA Performance Level Classification
• Performance level standards were approved by the State Superintendent of Schools and adopted by the State Board of Education in May 2007. The same standards have been applied throughout all operational assessments.
• Standards were set by content area and grade band.
• Four grade bands were identified based on similarity of their content and skills inherent in the curriculum standards: Grades Kindergarten – 2 Grades 3 – 5 Grades 6 – 8 Grade 11
53
GAA Performance Level Classification
• To give meaning to the many different combinations of rubric scores, each was assigned a performance level determined during standard setting.
• Performance Levels for GAA are distinguished by 3 Stages of Progress.
• The three Stages of Progress are: Extending Progress (E3)Established Progress (E2)Emerging Progress (E1)

55
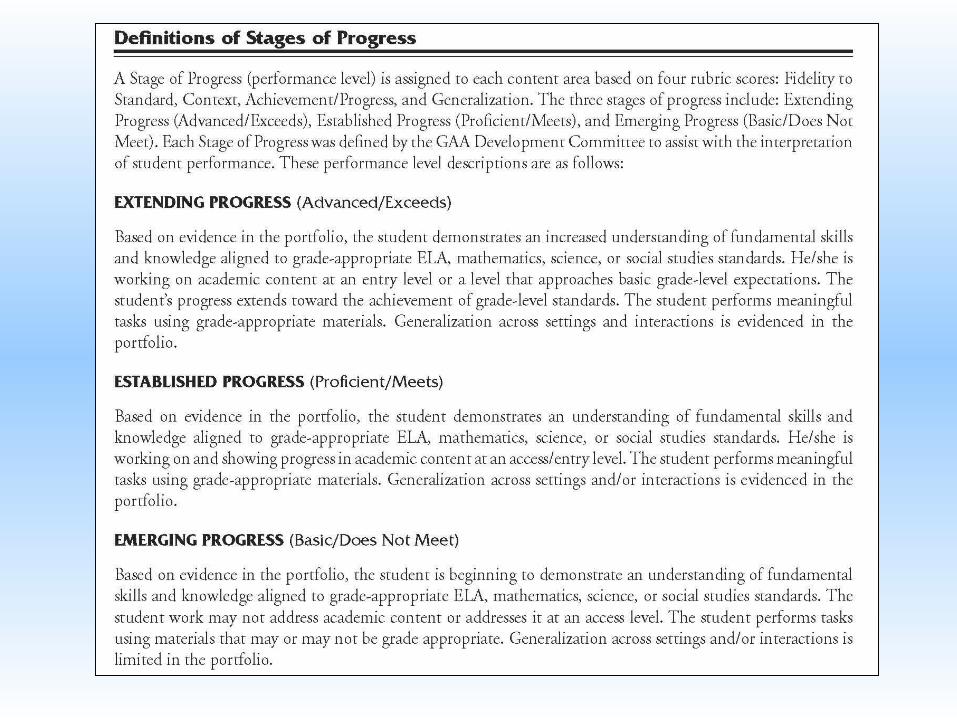
GAA Performance Level Classification
• Stages of Progress are indicated in a chart in the Score Interpretation Guide by an alphanumeric code:
E1 = Emerging Progress (Basic/Does Not Meet)E2 = Established Progress (Proficient/Meets)E3 = Extending Progress (Advanced/Exceeds)

56
GAA Performance Level Classification
• Refer to the chart on pages 25–29 of the Score Interpretation Guide to look up a student’s Stage of Progress.
• The chart displays:a row for each possible scorea column for each content area and grade band
combination.
57
Generalization
Achievement/Progress
Context
GAA Performance Level Classification
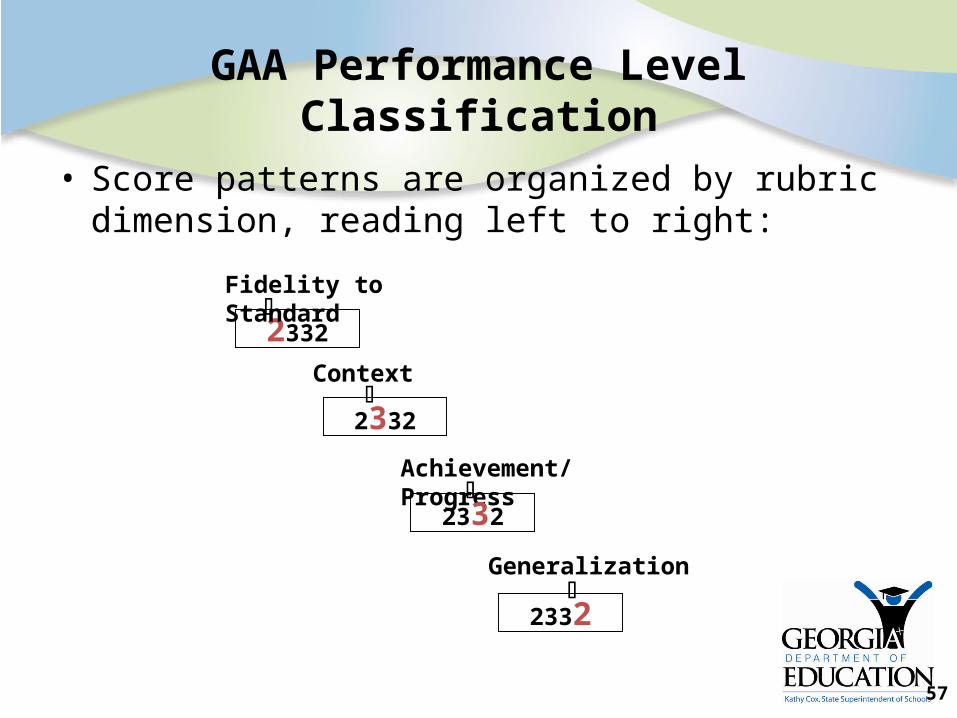
• Score patterns are organized by rubric dimension, reading left to right:
2332
Fidelity to Standard
2332
2332
2332
58
GAA Performance Level Classification
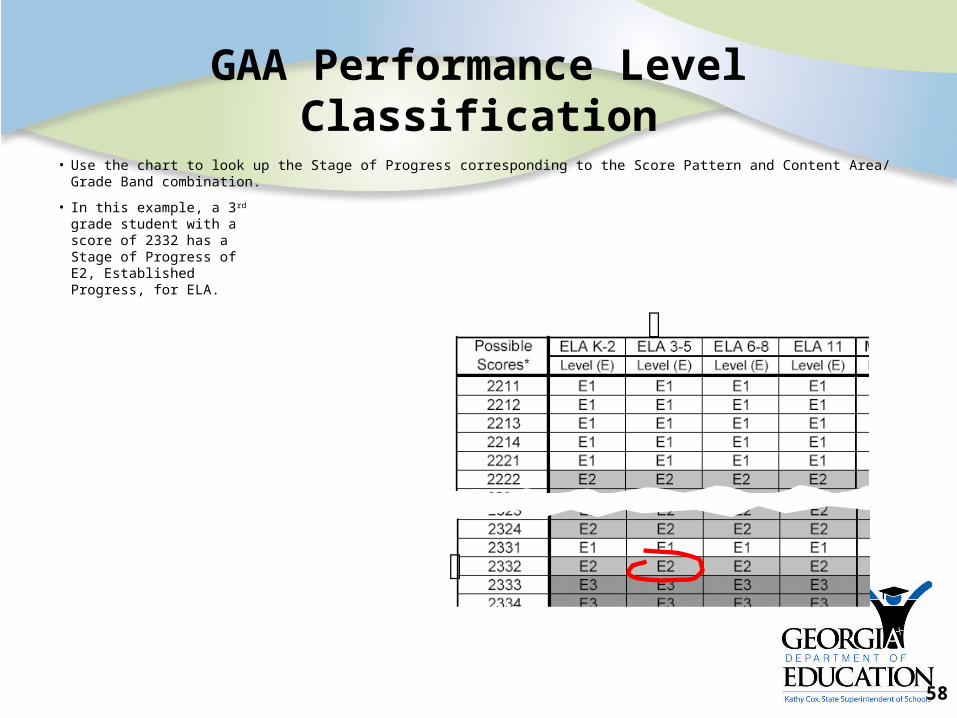
• Use the chart to look up the Stage of Progress corresponding to the Score Pattern and Content Area/ Grade Band combination.
• In this example, a 3rd grade student with a score of 2332 has a Stage of Progress of E2, Established Progress, for ELA.

Using the Score Reports to Improve Performance
• It is important that the score reports be provided to and reviewed with teachers to ensure that they understand how the overall scores and Performance Levels were arrived at and what they mean regarding student performance. Teachers are often called upon by parents to assist the parents in
interpreting the scores. Results can be used to inform and improve best instructional practice
as well as more effective test administration.• Information from the reports, especially regarding Emerging
(below basic/does not meet) performance levels or nonscorable entries, should be discussed to determine what supports either the student or the teacher need to improve performance.
• The primary focus should be on student progress and performance– not on AYP.

Reminders
• 2010 -2011 GAA Blueprint by Grade located in the GAA Resources Portlet, on the GaDOE
websitehttp://www.gadoe.org/ci_testing.aspx?PageReq=CI_TESTING_GAA
• Rescore requests must be submitted by July 30, 2010Rescore requests are submitted by the System Test
Coordinator using the Rescore Form on the MyGaDOE portal
Kathy Cox, State Superintendent of Schools“We will lead the nation in improving student achievement.” 60
61
Additional GAA Resources for Educators
The following resources, which include information on the GAA and the state-mandated curriculum, are available for local systems and educators.
The www.georgiastandards.org website hosts the state-mandated curriculum.
The GPS Resource Board is a forum for teachers to discuss the curriculum and access and post ideas. To enroll for the GPS Resource Board, contact the Division for Exceptional Students.
The www.gadoe.org/ci_testing.aspx?PageReq=CI_TESTING_GAA website contains a variety of general GAA administration information including electronic versions of manuals and forms.
62
Contact Information
Georgia Department of Education – Deborah Houston, Assessment Specialist GaDOE404-657-0251; [email protected]
Questar Assessment Inc. – Kelly Stevens, Performance Assessment Program Manager952-997-0784; [email protected]
Questar Assessment Inc. – Dennis Hood, Program Manager952-997-0685; [email protected]