geophysics: seismic reflection data - west virginia …pages.geo.wvu.edu/~jtoro/petroleum/20_seismic...
TRANSCRIPT
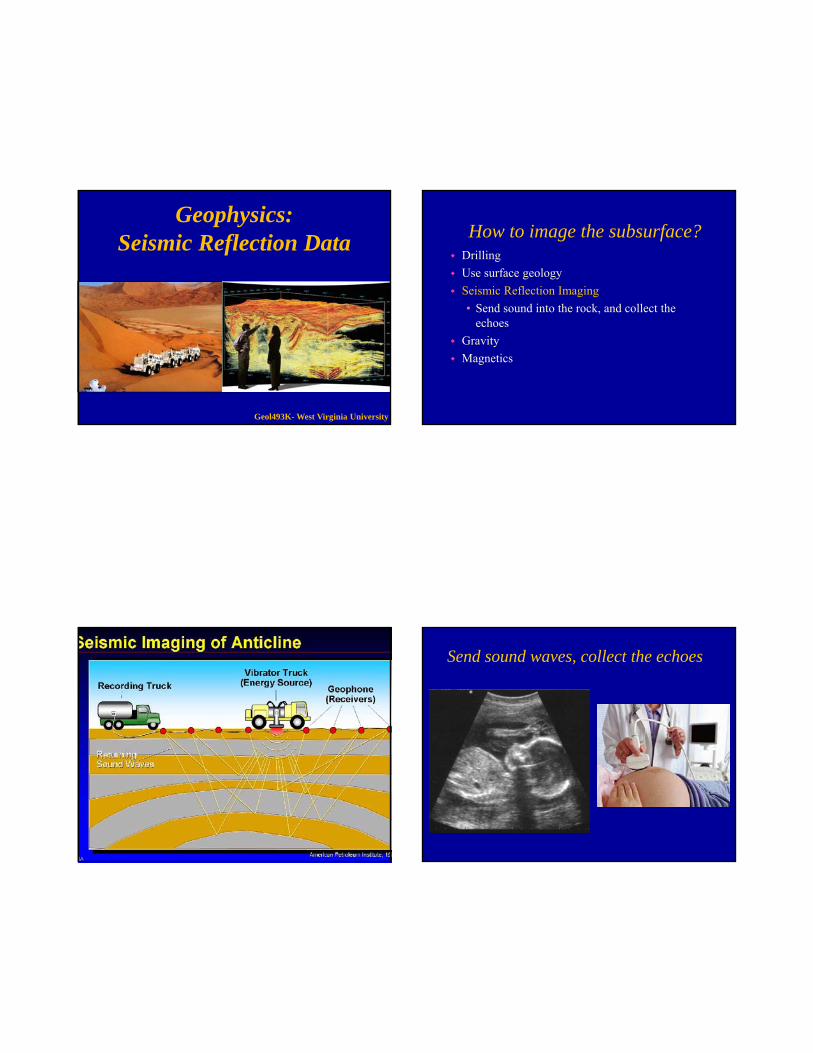
Geophysics:Seismic Reflection Data
Geol493K- West Virginia University
How to image the subsurface? Drilling
Use surface geology
Seismic Reflection Imaging
• Send sound into the rock, and collect the echoes
Gravity
Magnetics
Seismic AcquisitionSend sound waves, collect the echoes
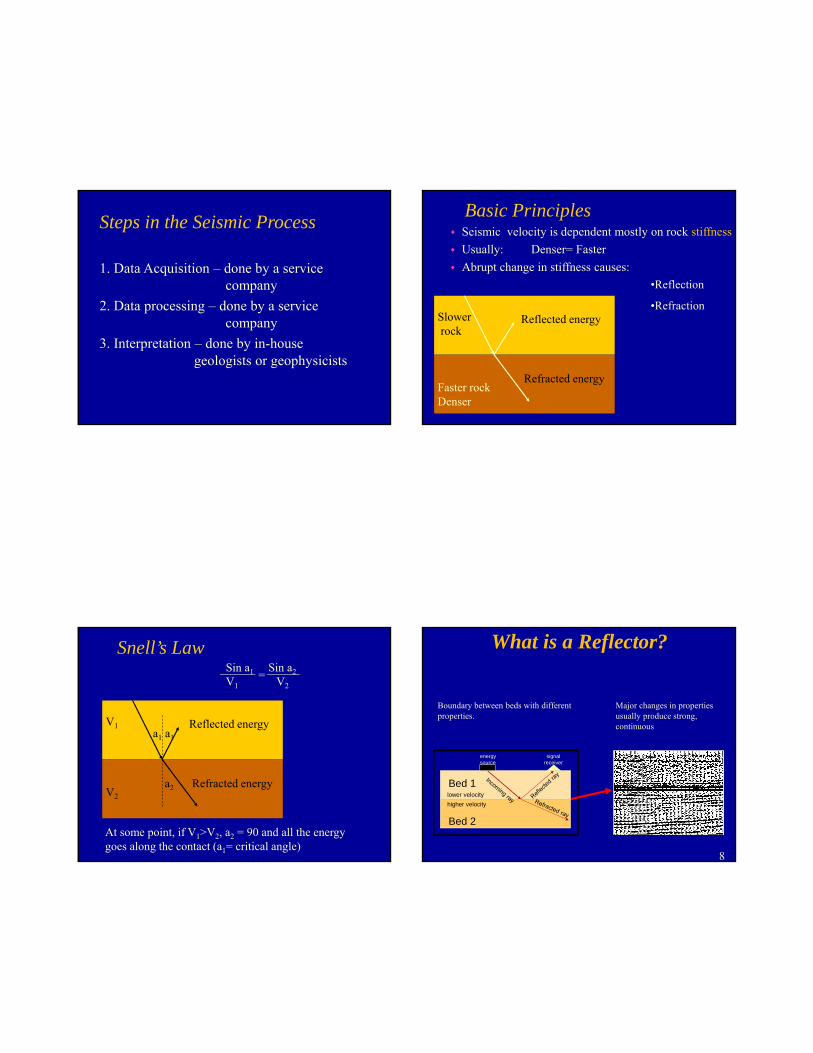
Steps in the Seismic Process
1. Data Acquisition – done by a service company
2. Data processing – done by a service company
3. Interpretation – done by in-house geologists or geophysicists
Basic Principles Seismic velocity is dependent mostly on rock stiffness
Usually: Denser= Faster
Abrupt change in stiffness causes:
Reflected energy
Refracted energyFaster rockDenser
Slowerrock
•Reflection
•Refraction
Snell’s Law
Reflected energy
Refracted energyV2
V1a1 a1
a2
Sin a1 Sin a2
V1 V2=
At some point, if V1>V2, a2 = 90 and all the energy goes along the contact (a1= critical angle)
What is a Reflector?
Major changes in properties usually produce strong, continuous
Boundary between beds with different properties.
Bed 1
Bed 2
lower velocity
higher velocity
energy source
signal receiver
8
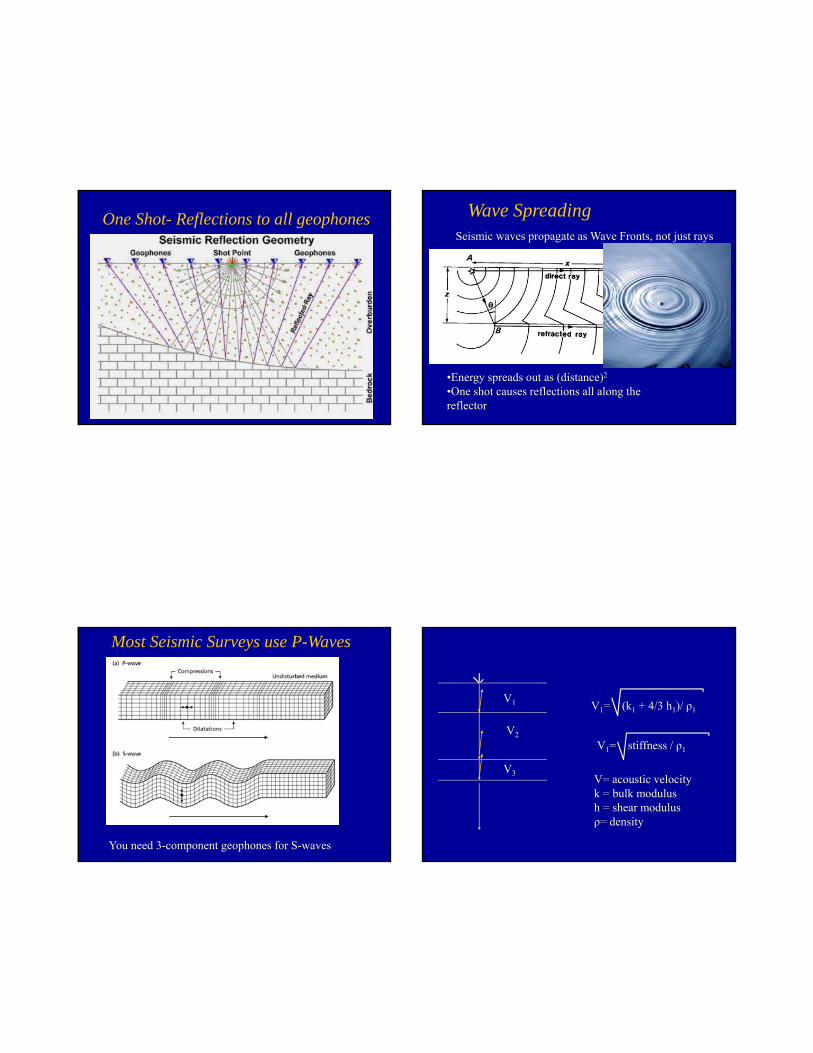
One Shot- Reflections to all geophones Wave SpreadingSeismic waves propagate as Wave Fronts, not just rays
•Energy spreads out as (distance)2
•One shot causes reflections all along the reflector
Most Seismic Surveys use P-Waves
You need 3-component geophones for S-waves
V1
V2
V3
V1= (k1 + 4/3 h1)/ ρ1
V1= stiffness / ρ1
V= acoustic velocityk = bulk modulush = shear modulusρ= density

Depth vs Time
V1
V2
V3
Dep
th
echo1
echo3
echo2T
ime
Reflection Coefficients
What is he magnitude of each reflection?
Acoustic impedance = Z1= v1ρ1
Reflection coefficient = (Z2- Z1 )/(Z2+ Z1)
Fraction of reflected energy
Typically -0.1 to 0.1
Shale
Sand
Velocity = 2000 m/sDensity = 1.7 gm/ccI = 2000 * 1.7 = 3400
Velocity = 2400 m/sDensity = 1.8 gm/ccI = 2400 * 1.8 = 4320
ReflectionCoefficient =
4320 - 3400
4300 + 3400=
I below – I above
I below + I above= 0.119
Of the incident energy, 12% is reflected, 88% is transmitted
Seismic Interface Example
15
Shale
Carbonate
Velocity = 2000 m/sDensity = 1.7 gm/ccI = 2000 * 1.7 = 3400
Velocity = 2600 m/sDensity = 2.1 gm/ccI = 2600 * 2.1 = 5460
ReflectionCoefficient =
5460 - 3400
5460 + 3400=
I below – I above
I below + I above= 0.232
Of the incident energy, 23% is reflected, 77% is transmitted
Seismic Interface Example
16

Reflection seismogram viewed as the convolved output of a reflectivity function with an input pulse
Marine Seismic Survey
Marine Swath Data for a 3D
Streamers
Diverter
Vibroseis trucks
Seismic Acquisition - Onshore
20

Drilling holes for dynamite source
80 kg shot for deep seismicRussia Laying out Geophones
Seismic Acquisition - Onshore
22
Seismic Acquisition - Onshore
Geophones
Seismic Acquisition - Onshore
Laying out Geophones in Mountainous Areas 24

Seismic Processing
25
Velocity model
ExxonMobil
Seismic Processing
Field Record(marine)
Data ProcessingStream
Subsurface ‘Image’
26
Common Depth Point
S are shots
D are receivers
Single-ended spread
12 channels
6-fold redundancy
Sort the shot-receiver pairs that collect data from the same point
Shot Gather
•All traces from a common mid point(redundant data)
•Hyperbolas get flatter with increasing V

Seismic Processing: Geometry of Seismic Acquisition
ΔT= normal moveout
t= travel time
t= (1/V)(x2 + 4z2)1/2
•A hyperbola
•t, x are known
•V unknown, but can be found graphically using the seismic data
•z calculated (V, t)
Time-distance plot
Geometry
Velocity Analysis: find the velocity function that will flatten the hyperbolas
Velocity function UncorrectedGather
Corrected
Stacking – Noise reductionGather After Stack
Sum these
Stacked, Unmigrated Line: has issues

Stacking Assumes Layer-Cake Structure
AB
Stacking assumes layer-cake structure
In a tight syncline, 3 reflections originating from different spotsmay focus at the receiver
ExxonMobil
Migration – Correcting for Location
Sweep Ellipse
S RUnmigrated energy on single trace...
...spread to all possible locations of origin
S R
Sweep Ellipse
S R
Sweep Ellipse
35
Migrated (corrected) line after processing

Fault Diffractions:
Seismic energy is scattered at sharp edges
Diffractions
Raw data Migrated data
L 5 – Seismic Method Courtesy of ExxonMobil
Seismic Migration
Unmigrated ImageUnmigrated Image
Migrated ImageMigrated Image
Positioning Problems ‘Blur’ the
Image
Migration ReducesPositioning
Problems, which Improves the Image
39
Seismic Multiples: Ghosts of the seabed
Ghost 2Ghost 1

Multiples in Marine Data
Butler et al. 2015
ExxonMobil
The Ideal Seismic Response
Increase in Impedance Decrease in Impedance
Able to resolve boundaries of beds a few meters thick
1 meter
43 ExxonMobil
Seismic - Units 10’s of Meters Thick
10 m
Predominantly
Shale
Predominantly
Shale
Predominantly
Sand
44

Vertical resolution of seismic is depends on frequency and velocity–
f= 30Hz , v= 6000 ft/sec
ExxonMobil
Scale for Seismic Data
Although seismic data can not image small-scale stratal units, it can image mid- to large-scale units
Parasequences
Bed Sets
Parasequence Sets
Sequences
Beds
Lamina Sets
Lamina
Sequence Sets
The big advantage of seismic data is areal coverage
46
Time versus Depth
0.58 sec
m
1865
926
288
926 m
Two way time (TWT) does not equate directly to depth
Depth of a specific reflector can be determined using wells
47 ExxonMobil
Seismic Shot
Borehole Geophone
De
pth
Check shots measure the
vertical one-way time
from surface to various
depths within the well
Used to calibrate well
depths and times from a
sonic log
Time to Depth - Check Shot Data
48

Check Shot survey example
Interval velocity
IntegratedSonic log
Acoustic impedancefrom Sonic log
SeismicReflectivity
Wavelet
SyntheticSeismic
Creating synthetic seismic data:
Convolution
• Use the sonic and density logs to compute an impedance ‘log’• Calculate the reflection coefficients• Convolve our pulse with the seismic reflectivity• Sum the individual wavelets to get the synthetic seismic trace
Seismic Ties
Compare well data to seismic data
Relate horizon tops in a well with specific reflections
ReferenceLog
Synthetic(+)
Synthetic(-) Tops Take Home Ideas
Seismic Data Requires CarefulAcquisitionProcessing
Power of Stacking and MigrationImproves Signal to Noise
A Seismic Reflector is Boundary Between Beds of Different PropertiesRelates to Lithology – Density and Velocity
52