geomagnetic probing of core geodynamics and earth’s ... · 4/6/2002 · transforms kinetic...
TRANSCRIPT

MEMORANDUM 12/12/03
TO:
FROM: Coerte V. Voorhies, Code 921 Geophysicist
SUBJECT: Paper Submitted to J. Geophys. Res. - Solid Earth
Herbert V. Frey, Head, Code 921, NASNGSFC
Pursuant to the most recent 900 Guidelines for Publications, pleased be advised that the paper “Narrow scale flow and a weak field by the top of Earth’s core: evidence from 0rsted, Magsat, and secular variation’’ by Coerte V. Voorhies is submitted for publication to the American Geophysical Union’s Journal of Geophysical Research - Solid Earth. Prospects for acceptance are considered somewhat better than average. A copy of the submitted paper is attached. The requisite Populs S u m q , blending both educational and PR styles, is longer than intended and is as follows:
Geomagnetic Probing of Core Geodynamics and Earth’s Magnetic Shield
As Earth’s main magnetic field weakens, our magnetic shield against the onslaught of the solar wind thins. And the field strength needed to fend off battering by solar coronal mass ejections is decreasing, just when the delicate complexity of modem, vulnerable, electro-technological systems is increasing at an unprecedented rate. Recently, a working group of distinguished scientist from across the nation has asked NASA’s Solid Earth and Natural Hazards program a key question: What are the dynamics of Earth’s magnetic field and its interactions with the Earth system?
Some answers to part of this question come from &verse studies of Earth’s core geodynamo, a dynamical system as complex as weather and climate, yet buried deep under 1800 miles of rocky mantle. Electric current flowing in Earth’s metallic core is the accepted main source of the main field, but it is weakening faster than expected from the small electrical resistivity of the metal. According to one theory, as Earth cools over geologic time, the solid iron inner core freezes from the molten outer core. This liberates latent heat and buoyant slag whch rise, stirring the outer core to motion at speeds of several miles per year. But whatever causes the motion, dynamo action in the core transforms kinetic energy of the motion into magnetic energy of the field. Some of this energy emerges as our largely dipolar magnetic shield. But sometimes the transformation might go the other way, with the core running like a motor instead of a generator. This may accelerate core motions, weaken our shield, and perhaps drive our main axial dipole field to zero and beyond - to a reversed polarity.
Paleomagnetic studies of crustal rocks magnetized in the geologic past reveal that polarity reversals have occurred many times during Earth’s history. Networked super-computer simulations of core field and flow, including effects of gravitational, pressure, rotational Coriolis, magnetic and viscous forces, suggest how t h s might happen in detail. And
https://ntrs.nasa.gov/search.jsp?R=20040021386 2020-04-04T07:44:01+00:00Z

..- . .
space-based measurements of the real, time-varying magnetic field help constrain estimates of the speed and direction of fluid iron flowing near the top of the core and enable tests of some hypotheses about such flow.
Many core flow estimates omit narrow scale features, less than about 600 miles across. This is in part because observed changes in the main field are broad scale, so narrow scale flow is not easily resolved. Some estimates also assume the magnetic forces near the top of the core are negligible compared with other forces. Of course, doubts abound concerning both the scale of the flow and the strength of magnetic forces in a liquid metal buried beneath 1800 miles of rock.
Now scientists at NASA’s Goddard Space Flight Center have developed and applied methods to test the hypotheses of narrow scale flow and of a dynamically weak magnetic field near the top of Earth’s core. Using two completely different methods, C. V. Voorhies has shown these hypotheses lead to specific theoretical forms for the “spectrum” of Earth’s main magnetic field and the spectrum of its rate of change. Much as solar physicists use a prism to separate sunlight into its spectrum, from long wavelength red to short wavelength blue light, geophysicists use a digital prism, spherical harmonic analysis, to separate the measured geomagnetic field into its spectrum, from long to short wavelength fields. They do this for the rate of change of the field as well.
To test a hypothesis, Voorhies fits a theoretical spectrum to an observational spectrum. This yields an estimate of the radius of Earth’s core and its uncertainty. If the estimate agrees with the well-established core radius, determined by independent seismological techniques, then the hypothesis passes the test. If not, it fails. The weak field and narrow scale flow hypotheses each pass key tests, both separately and together. Recent analysis of data from the Danish Geomagnetic Research Satellite, however, suggests the core flow may have gotten a bit broader in scale, or better organized, over the past 20 years.
For further information, including how compact eddies in a fluid conductor cause magnetic field changes over all scales, and how the magneto-geostrophic vorticity balance constrains kinetic-to-magnetic energy conversion atop the geodynamo, see ‘‘Narrow scale flow and a weak field by the top of Earth’s core: evidence from (arsted, Magsat, and secular variation” by Coerte V. Voorhies, submitted for publication in the American Geophysical Union’s Journal of Geophysical Research - Solid Earth.
Author Information: Dr. Coerte V. Voorhies, Geophysicist, Geodynamics Branch, Code 921, NASA’s Goddard Space Flight Center Greenbelt, MD 20771 USA Phone: 1-30 1-6 14-6456 FAX 1-30 1-6 14-6522 Coerte.V.Voorhies @nasa.gov

Narrow scale flow and a weak field by the top of Earth’s core: evidence from Orsted, Magsat and secular variation
C. V. Voorhies, Geodynamics Branch, Code 921, NASA Goddard Space Flight Center, Greenbelt, MD 20771 USA Coerte.V.Voorhies @nasa.gov Revision 12/11/03
Submitted to the Journal of Geophysical Research - Solid Earth.
Abstract: To test two hypotheses against seismology, the IZlrsted Irutial Field Model is used to estimate the radius of Earth’s core by spectral methods. The model coefficients are used to compute the mean square magnetic flux density in spherical harmonics of degree n on the reference sphere of radius a = 6371.2 km, which is an observational spectrum R,. The theoretical spectrum tested, {R:} = K(n+1/2)[(n(n+l)]-’(c/a) , is obtained from the hypotheses of narrow scale flow and a dynamically weak magnetic field near the top of Earth’s core; it describes a low degree, core-source magnetic energy range. Core radius c and amplitude K are estimated by fitting log-theoretical to ‘log-observational spectra at low degrees. Estimates of c from R, of degrees 1 through N vary between 3441 and 3542 km as N increases from 4 to 12. None of these estimates differ significantly from the seismologic core radius of 3480 km. Significant differences do occur if N exceeds 12, which is consistent with appreciable non-core, crustal source fields at degrees 13 and above, or if other spectral forms are assumed. Similar results are obtained from the 1980 epoch Magsat model CM3. One way to deduce {Rn‘} uses an expectation spectrum for low degree secular variation (SV) induced by narrow scale flow near the top of Earth’s core, (Fn‘} = Cn(n+l/2)(ntl)(~/a)~~+~. The value of c obtained by fitting this form to the mean observational SV spectrum from model GSFC 9/80 is 3470 91 km, also in accord with seismologic estimates. This test of the narrow scale flow hypothesis is independent of the weak field hypothesis. The agreement between SV, Magsat, QIrsted and seismologic estimates of core radius means the hypotheses pass these tests. Additional tests are described.
2n+4 .
1. Introduction
Among many physical hypotheses about Earth’s interior, let us develop and test two of
geomagnetic and geodynamic interest. The first is the hypothesis of narrow scale fluid flow by
the top of Earth’s core, which concerns core kinematics and geomagnetic secular variation (SV;
see, e.g., Roberts & Scott [1965], Backus [1968]). “Narrow scale” here includes horizontal
length scales less than about lo3 km, such as the 4.2 km scale of Benton [1992]. Many
inversions of global geomagnetic change for core surface flow estimate only a broad-scale flow
with features over lo3 km across (see, e.g., Voorhies [1986, 1993, 19951).
The second hypothesis
by the top of Earth’s core.
is that of a dynamically weak Lorentz force, or weak magnetic field,
This concerns core dynamics and the likelihood that the deep mantle
1
is too poor a conductor to allow much electric current across the core-mantle boundary (CMB;
see, e.g., LeMouel [1984], Gubbins & Roberts [1987], Voorhies [1991]). “Dynamically weak”
here includes force magnitudes much less than those of gravity, pressure and the Coriolis effect,
albeit not necessarily as weak as the net force driving broad-scale accelerations of about 2 ~ l O - l ~
m / s 2 [Voorhies, 19951. This surficially weak field hypothesis is, however, compatible with a
strong toroidal magnetic field deeper in the core (see, e.g., Backus [1986], Roberts & Gubbins
[1987], Benton [1992]). A test might confirm that the potential field on Earth’s surface mainly
represents a poloidal field from within the core, instead of from a strong toroidal core field
threading CMB topography - hence a slight bending of otherwise toroidal field and poloidal
coupling currents at a somewhat smaller jump in conductivity across the Ch4B.
There are alternative hypotheses which have been tested; yet close fits to geomagnetic change
obtained with broad-scale, non-geostrophic, core surface flows do not necessarily imply that
narrow scale flow andor weak field hypotheses are in error (see, ,e.g., Voorhies [1995]).
Similarly, presence of some narrow scale flow does not imply absence of all broad-scale flow:
Our hypotheses are embedded in a larger theory and a vast body of geomagnetic observations
which ease their conversion into quantitatively testable forms. To this end, let us establish
notation and a CMB layer model in sections 2 & 3; develop and test the narrow scale flow
hypothesis in sections 4 & 5; develop and test the weak field hypothesis in sections 6 & 7; and
offer a constraint on either the conductivity or the magnetic Reynolds number of Earth’s core.
2. Notation and Background
Let B(r, t) denote magnetic flux density at time t and position r in geocentric spherical polar
coordmates (r, 6, $) caused by electric current of density J and magnetization M within the earth.
Above Earth’s surface, solenoidal B equals the negative gradient of the zero-mean scalar internal
2

magnetic potential V. This potential satisfies Laplace’s equation and has a Schmidt-normalized
spherical harmonic expansion with Gauss coefficients of degree n and order m, denoted [g,”(t),
hnm(t)] on a reference sphere of radius a = 6371.2 km. Coefficients through finite degree NF can
be estimated by spherical harmonic analysis of the measured field, which also enables separation
of the internal-source field considered here from external-source fields (see, e.g., Langel [ 19871).
As is also well-known, the mean square field represented by harmonics of degree n, averaged
over a sphere of radius r containing the sources, is given by
n
m=O R,(r, t ) = (n + l)(a/r)2”*4 c [g,”(r)I2 + [hnrn(t)l2
(see, e.g., Lowes [1966], Luke [1957], Muuersberger [1956]; Meyer [1985]). The R, form a
discrete geomagnetic spectrum with units of T2. The integral of magnetic energy density over the
sphere has a related spectrum, 271r2Rn/~o in vacuum permeability p,,, with units of spatial power
or force (J/m). A spherical harmonic expansion is equivalent to a centered, 2n-pole moment
expansion, so each R, represents a multipole power.
The mean square rate of change of the magnetic field represented by harmonics of degree n,
averaged over the same sphere, is given by the SV spectrum
Note that F, is not a, R,; moreover, the time average of magnetic spectrum (l), denoted din>, is
not generally the spectrum of the time averaged field. Similarly, when SV itself varies in time,
the time average of SV spectrum (2), denoted e,>, is not the spectrum of net magnetic change.
Spectra computed from coefficients determined by weighted least squares fits to geomagnetic
measurements, with no assumptions about a core field, are here called “observational spectra”.
3

I The accuracy of an observational spectrum depends on geomagnetic field modeling procedure,
I such as the choice of NF, as well as data selection, distribution and accuracy. Spectra obtained
, from physical hypotheses about sources are here called “theoretical spectra” (see, e.g., McLeod
[ 19961; Voorhies [1998]; Voorhies, Sabaka & Purucker [2002]). Hypotheses about averages
over physical processes may yield a theoretical spectrum that is also a mean, or “expectation
spectrum”, denoted {Rn} for the main field or {Fn} for the SV.
l
I
I I
Observational spectra Rn determined by analyses of satellite magnetic data have been
interpreted in terms of a mainly core-source field for n e 14 and a dominantly crustal-source field
for n > 14 (see, e.g., Langel & Estes [1982], Cain et al. [1989], Voorhies, Sabaka & Purucker
[2002]). A review of publications bearing on a core-source interpretation for portions of R, and
Fn is omitted for brevity (see, e.g., Booker [1969]; Verosub & Cox [1971]; Lowes [1974];
McLeod & Coleman [1980]; Hide & Malin [1981]; Langel & Estes [1982]; Benton et al. [1982];
Shure, Parker & Backus [1982]; Voorhies & Benton [1982]; Gubbins [1983]; Stevenson [1983];
Voorhies [1984]; Gubbins & Bloxham [1985]; McLeod [1985, 19961; Meyer [1985]; Benton & I I I
Alldredge [1987]; Benton & Voorhies [1987]; Backus [1988]; Constable & Parker [1988]; Cain
et al. [1989]; Hulot, LeMouel & Wahr [1992]; Harrison [1994]; Hulot & LeMouel [1994];
Voorhies & Conrad [1996]; Walker & Backus [1997]; Voorhies et al. [2002]; De Santis,
Barraclough & Tozzi [2003]).
Clearly, an observational spectrum may be used to help test a theoretical spectrum, hence its
underlying physical hypotheses. There is, however, a third class of spectra, here called
“constrained spectra”, computed from coefficients constrained by one or more assumptions about
a core field (see, e.g., Shure, Parker & Backus [1982]; Gubbins [1983]; Backus [1988]). The
independence, hence utility, of a constrained spectrum can be compromised by constraints that
I force it to either agree or disagree with a theoretical spectrum. In special circumstances,
4

however, the statistical significance of increased misfit to measured data caused by a constraint
could provide a test of physical hypotheses underlying the constraint.
Theoretical spectra from sources in a roughly spherical core of radius c are here denoted R:.
For example, Gubbins' [1975] expression for the minimum value of the finite Ohmic dissipation
in the core implies that, for degrees in a magnetic dissipation range defined by n 2 ND,
R:(a; n >ND) 5 KG n-2-6 (c/a)2", (3 a)
where constant KG > 0 and 6 > 0. Though finite. ND may be much larger than 12. So there may
be a low degree magnetic energy range, defined by n 5 NE < ND, and perhaps an intermediate, if
not inertial, sub-range defined by NE < n < ND. This is the case for theoretical spectra of
Stevenson [1983] and McLeod [1985, 19961, as shown in Appendix A. A scale analysis
illustrates the physical plausibility of a generalized Stevenson - McLeod relation,
{ ~ : ( r > c; n 5 N E ) ) = K (n + ~)[n(n+l)] - ' ( ~ / r ) ~ " + ~ , (3b)
as an expectation spectrum for low degrees, as shown in Appendix B.
Both the scale analysis and the empirical approach in section 6 yield spectrum (3b) as an
expected consequence of narrow scale flow and a weak field by the top of the core. Neither
specify expected spectral variance, denoted {(R: - {Rn"})2}; therefore, tests of spectrum (3b) are
here limited to comparisons between magnetic estimates of c and independent estimates.
Seismologic estimates of c differ by but a few km and are here denoted cs = 3480 km (see, e.g.,
Dziewonski & Anderson [ 19811; Kennett, Engdahl & Bulland [1995]).
3. CMB Layer and Narrow Scale Flow
The transition from fluid conducting core to rigid resistive mantle has long been modeled
simply by a sharp, impenetrable interface: a fixed jump in material properties across the CMB.
Finite Lorentz and viscous forces are ensured by continuity of both magnetic and hydrodynamic
5

1
~
stress tensors across t h s interface. Then B is also continuous and the relative velocity u of a
Newtonian fluid that wets the mantle satisfies both lunematic and no-slip CMB conditions. ~
Fluid motion at depth indicates a boundary layer between the interface and a main stream.
Analyses of quasi-steady magnetic, mass, and momentum transport equations indicate a thin, ~
I I
weak, boundary layer that neither generates much electrical current nor absorbs appreciable
I normal fluid flow (see, e.g., Ball, Kahle & Vestine [1969], Hide & Stewartson [1972], Benton
[198l], Gubbinj. & Roberts [1987], Benton [1992]). This depends on a kinematic shear viscosity
v that is very small and a magnetic diffusivity r\ that is not too large, conditions met with v =
3 ~ 1 0 - ~ m2/s and q s (bo)-' = 1.6 m2/s for electric conductivity CJ = 5x10⁵ S/m [Poirier, 1988;
Lumb & Aldridge, 1991; Voorhies, 1999; Dobson et al., 20001. A thin viscous sub-layer is also
suggested by equating typical magnitudes of tangential viscous forces with Coriolis or Lorentz
forces and solving for Ekman or Hartmann scale depths, 6~ = 8 cm or 8~ = 15 cm, respectively.
The induction equation for uniform o, our non-conservative magnetic transport equation
& B = VX(UX B) + ~ V X V X B , (4)
shows core-source SV can be induced by mainly lateral motion at the base of a viscous sub-layer.
A feeble boundary current implies a small jump in B across the sub-layer, negligibly small for the
normal component. Though purely diffusive at the interface itself, the radial component of (4)
has thus been used to analyze SV in terms of broad-scale fluid flow, and occasionally flux
diffusion, at the top of a spherical main stream. Constrained inversions of geomagnetic secular
change indicate a typical flow speed U of about 7.5 Myr (see, e.g., Voorhies [1995]).
With the foregoing values for U, &, v and c,, the main stream Reynolds number Uc, /v of
about 3x10' is so much greater than the boundary number U&/v of about 60 as to indicate some
small scale motions near the top of the core, perhaps in a thicker, unsteady, second boundary
6

layer featuring eddy mixing and enhanced diffusion - if not entrainment of the overlying viscous
sub-layer. Instead of a typical width for fronts between broad regions of more uniform flow, the
4.2 km lateral length scale for fluid velocity obtained by Benton [1992], denoted lo, may describe
a seething mass of short-lived, rotationally polarized hydromagnetic eddies. By equation (4),
such narrow scale eddies could individually induce narrow scale field variations, yet could also
contribute collectively to observable, broad-scale SV.
A quantitative model of this contribution is needed to test the narrow scale flow hypothesis.
A model consisting of pseudo-random walks of magnetic field line foot points with a single eddy 5
diffusivity Ulo =: 1 m2/s seems too much like molecular magnetic diffusion to test; moreover, a
linear diffusion term with scale-invariant diffusivity cannot describe how narrow scale flow
induces broad-scale SV by mode-mixing. Deterministic inversions of (4) do not resolve narrow
eddies and might misattribute eddy mixing of magnetic modes to broad-scale flow or flux
diffusion. Deterministic forward models, notably numerical dynamo models that solve a system
of magnetic, mass, momentum and energy transport equations closed by an equation of state (see,
e.g., Glatzrnaier & Roberts [1995a,b]), can better resolve compact eddies and effects of mode
mixing.
For example, a dynamo simulation used to investigate the frozen-flux core approximation
included degrees as high as 239 [Roberts & Glatzmaier, 20001; yet observational field models
similarly used included degrees of at most 13 and often 10 or less [Hide & Malin, 1981; Voorhies
& Benton, 1982; Voorhies, 1984; Benton & Voorhies, 19871. With I = [8m,2/n(n+1)]”2, we find
Zsim 2 73 km = 1710 and lobs 2 1300 lun = 18Zsim; therefore, finer resolution is needed to simulate
eddies of scale lo. Additional assumptions about material properties, turbulent diffusivities,
boundary conditions, and initial conditions further complicate hypothesis testing via numerical
7

simulation (see, e.g., Glatzmaier [2002]). Both forward and inverse deterministic models of SV
induced by narrow scale flow are bypassed here via a statistical kinematic model of SV induced
by compact eddies.
4. An Equivalent SV Spectrum from Narrow Scale Flow
On the narrow scale flow hypothesis, magnetic changes at different locations at the top of the
core are induced by different eddies transporting different local fields in different directions at
different speeds. Such changes - may well appear uncorrelated on scales broader than the eddies.
Mathematically, the magnetic change induced by each narrow scale eddy can be approximated in
the far field, notably well outside the core, by an equivalent source of change at the base of a
viscous sub-layer. Following McLeod [ 19961, quasi-static lateral magnetic transport during
differential interval At causes differential exterior magnetic change AB equivalent to differential
dipole moment changes Adi scattered atop the main stream at radius c- (i = 1, 2, 3, . . . , I>.
To see this, recall that a single magnetic flux vector Bod4 at fixed position xo on the surface
A of the source region acts as the point source of a dipole field with moment proportional to
Bo&. The magnetostatic field at position x due to this equivalent source is well-known (see,
e.g., Jackson [ 1975, equation 5.641). Infinitesimal quasi-static lateral displacement Ax of this
single magnetic vector, with no change in orientation and magnitude, would cause a net change
in the exterior field equivalent to a differential quadrupole moment at xo + Ad2. More generally,
however, there is a magnetic flux vector at each position on the source surface; lateral transport
replaces the vector at xo with an adjacent vector of slightly different orientation and magnitude;
and the change in the exterior field is equivalent to that of a differential dipole moment Ado at XO.
Given many equivalent source changes Adi at xi on A (i = 1, 2, 3, . . ., I ) , the total change in the
exterior field AB at 1x1 > c’ follows by superposition. In the continuum, a differential change in

surface magnetic moment density at x’ on c- replaces discrete Adi as the equivalent source for
exterior secular change AB(x,t), which follows by integration over x’
Elements of the dyad formed by two differential dipole moment changes at two well
separated points, [Adl][Ad2IT, may be either positive or negative. The average over a
kinematically unbiased ensemble of such dyads gives zero cross-correlations, but non-zero auto-
correlations. The resulting expectation spectrum for broad-scale SV is equivalent to that from
laterally uncorrelated, rmdomly varying dipole moments on the source shell c‘, which is given by
{ ~ c ( r > c-)) = c n (n + 1/2)(n + 1)(c-/r)2n+4 . (5)
Equation ( 5 ) differs slightly from McLeod [1996, equation (1 l)] because changes in horizontal as
well as radial components of an equivalent source can contribute to { F:} : for example, consider
rotation about the vertical of a horizontal equivalent source at the equator. Positive amplitude C
is proportional to {Z(Adi/At)2}. Physically, C tends to increase with transport speed, field
gradients and intensity; yet the mathematical derivation of spectrum (5) in Appendix C does not
use equation (4). It uses steps analogous to those in Voorhies [1998, equations (6a)-(20b)].
Laterally uncorrelated dipole changes offer a rough model of SV rich in narrow features; yet
the sum of attenuated cubic SV spectrum (5 ) over n converges on all spheres of radius r > c > c-.
The cubic polynomial, whch modulates the exponential attenuation ( ~ - / r ) ~ ~ + ~ of a potential field,
increases with n faster than does the linear polynomial obtained from SV sources equivalent to
uncorrelated Dirac delta-functions in B,. The latter are sources for the famous “white noise”
spectrum, so SV spectrum ( 5 ) is said to be “blue” or “hard” - to borrow descriptors of spectra
rich in short wavelength components from optical or X-ray spectroscopy, respectively. Of
course, no single Ad represents perfectly the magnetic change induced by an extended eddy, so
spectrum ( 5 ) will not represent SV on scales as narrow as the eddies themselves - hence at high
9
~~ ~ ~~

degrees (e.g., n 2 4,200 for lo above). Moreover, even transient cross-correlations may result in
deviations from spectrum ( 5 ) at lower degrees. Indeed, a softer or less blue SV spectrum, such as
an attenuated quadratic, may indicate contributions from partially resolved eddies.
Each set of Adi implies one F:, so derivation of theoretical SV spectral variance {[F: -
{ F,C}I2} would require additional assumptions about the ensemble of equivalent SV sources -
hence additional physical hypotheses about the eddy transport they represent. Extra hypotheses
tend to complicate tests of the narrow scale flow hypothesis. Low degree physical deviations Fnc
- {F:} caused by core dynamic processes can, however, be represented via cross-correlated
equivalent SV sources. And cross-correlation of even a small fraction of the Ad; can cause
deviations with magnitudes similar to IFn'}. We thus anticipate a spectral variance of magnitude
similar to, or perhaps a few times larger than, {Fn } itself. Other aspects of SV spectral
covariance are noted in Appendix D. Spectrum ( 5 ) is arguably better tested against a time
averaged observational spectrum, not only to help average out effects of transient cross-
correlations, but to identify persistent deviations from it.
5. Tests of the SV Spectrum
c 2 .
Theoretical SV spectrum ( 5 ) has two parameters, amplitude C and source radius c-, to be
estimated by fitting observational SV spectra F,(a,t). For a thin sub-layer, an estimate of c-
amounts to an estimate of c, so the significance of its difference from seismologic core radius cs
provides a test of equation (5 ) , hence the underlying narrow scale flow hypothesis. Curiously,
the misfit between theoretical and observational spectra does not provide a sensitive test of the
hypothesis. This is because the theoretical spectral covariance needed to fully establish the
statistical significance of such misfit is not specified (see Appendix E). We therefore emphasize
comparison of estimated SV source radius c- with independently determined cs.
10
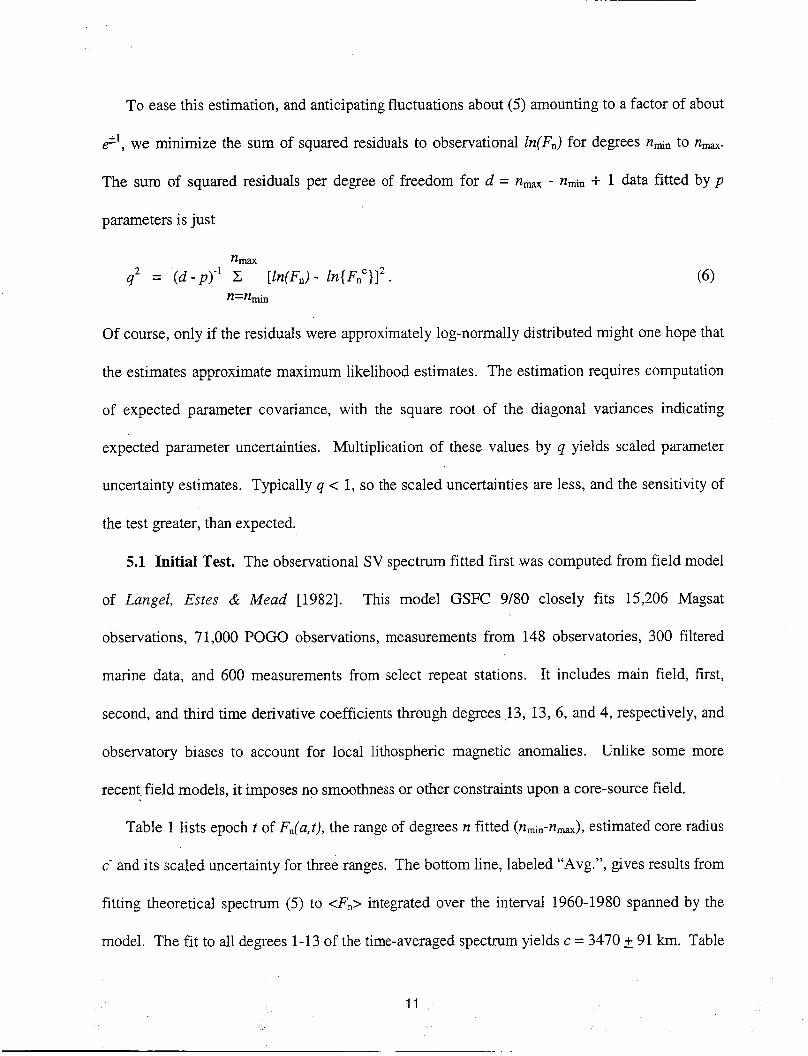
To ease this estimation, and anticipating fluctuations about (5) amounting to a factor of about
d', we minimize the sum of squared residuals to observational Zn(Fn) for degrees ndn to rima.
The sum of squared residuals per degree of freedom for d = nmax - nmin + 1 data fitted by p
parameters is just
%ax q2 = (d -p)- ' C [Zn(F,) - Zn{Fn")l2.
n=ndn
Of course, only if the residuals were approximately log-normally distributed might one hope that
the estimates approximate maximum likelihood estimates. The estimation requires computation
of expected parameter covariance, with the square root of the diagonal variances indicating
expected parameter uncertainties. Multiplication of these values by q yields scaled parameter
uncertainty estimates. Typically q c 1, so the scaled uncertainties are less, and the sensitivity of
the test greater, than expected.
5.1 Initial Test. The observational SV spectrum fitted first was computed from field model
of LangeZ, Estes & Mead [1982]. This model GSFC 9/80 closely fits 15,206 Magsat
observations, 7 1,000 POGO observations, measurements from 148 observatories, 300 filtered
marine data, and 600 measurements from select repeat stations. It includes main field, first,
second, and third time derivative coefficients through degrees 13, 13, 6, and 4, respectively, and
observatory biases to account for local lithospheric magnetic anomalies. Unlike some more
recent. field models, it imposes no smoothness or other constraints upon a core-source field.
Table 1 lists epoch t of F,(a,t), the range of degrees n fitted (nmin-nmax), estimated core radius
c- and its scaled uncertainty for three ranges. The bottom line, labeled "Avg.", gves results from
fitting theoretical spectrum (5) to <F,> integrated over the interval 1960-1980 spanned by the
model. The fit to all degrees 1-13 of the time-averaged spectrum yields c = 3470 91 km. Table
11

1 also shows results from fitting intermediate degrees 3-11 and, due to long-standing concerns
about SV coefficients above degree 10 [Voorhies, 19841, from degrees 3-10.
The agreement between geomagnetic SV spectral estimates of core radius in Table 1 and the
3480 km seismologic value is excellent. Indeed, only one value of 18 differs from c, by more
than twice its scaled uncertainty. The tabulated results are summarized as c- = 3.5 2 0.1 Mm = cs.
The hypothesis of narrow scale flow by the top of Earth's core, as represented by the broad-scale
SV spectrum (5) expected from an ensemble of compact eddies inducing laterally uncorrelated
SV, thus passes our initial test.
,
For ami,, = 1, however, closer study reveals a systematic increase in estimates of c' from
GSFC 9/80 with nmax. This is shown in Table 2a, which lists degree range, q2 from equation (6),
estimated core radius with scaled uncertainty estimate in km, and error relative to c, in km. The
latter are judged significant for nmax e 11 and so indicate a failure of theoretical spectrum (5 ) ;
moreover, if the larger misfits found for nmx > 10 are due to poorly determined SV coefficients,
then the smaller errors might be fortuitous. To check this, we set amin= 3; as shown in Table 2b,
so doing tightens the fit and eliminates errors in c- in excess of twice the scaled uncertainties.
Table 2b also shows increased misfit from degrees above 10. The tabulated results imply
theoretical spectrum (5) adequately describes this observational SV spectrum except for degrees
one and two. Downward continuation shows these exceptional terms contribute little to SV at
the CMB. They may be reconciled via degree-dependent process variances from an alternative,
non-log-normal, distribution. The exceptions can be understood in terms of fast decline of a
strong dipole and rapid quadrupole rebound as defined below.
Voorhies & Conrad [1996] found RI greater, and R2 less, than expected based on fits of
spectra (Ala) or (Alb) to observational spectra at epoch 1980 - albeit within the ranges we
12

expected 80% of the time. We also found R1 decreasing and R2 increasing; moreover, for all
orders m, we found (&gl" )/glm < 0 and (882" )/g2" > 0. The chances of such perfect (anti-)
correlations were put at 1/8 for the dipole, 1/32 for the quadrupole, and 1/256 jointly. This
otherwise remarkable coincidence was viewed merely as an efficient relaxation of the field
towards expectation values. The large value of Fz/R2 and the perfect correlation, and the large
value of dtR2/R2 itself, are called "rapid quadrupole rebound", as distinct from the quadrupole
diminution noted by Stevenson [ 19831.
5.2 A Softer SV Spectrum? To further investigate SV spectra, we use the attenuated
quadratic SV spectrum expected from uncorrelated, randomly varying dipoles scattered
throughout the interior of a ball of radius c, which is given by
{ ~ n c ( ~ > = c * ~ ( ~ + 1)(C/a)2n+4 . (7)
This softer SV spectrum is thought to be a proxy for contributions from some partially resolved
eddies. It is not thought to describe SV from small scale eddies scattered throughout the core, or
even a layer thicker than about 90 km, because equation (4) fixes the origin of core-source SV at
the top of the core. Surprisingly, spectrum (7) may also be a proxy for effects of laterally
heterogeneous mantle conductivity. Laterally homogeneous conductivity tends to harden a core-
source SV spectrum because physical attenuation decreases with harmonic degree [McDonald,
19571; however, mode coupling by lateral heterogeneity in deep mantle conductivity may in
effect scatter some intense, narrow scale, core-source SV into broader scales, thereby softening a
core-source SV spectrum before it emerges through Earth's surface.
Tables 3a and 3b are analogous to Tables 2a and 2b, but show results of fitting proxy
spectrum (7) to the 20 year average from model GSFC 9/80. Table 3a, with n,, = 1, shows
small and insignificant errors in c for nmx < 11. Table 3b, with nmin = 3, shows large positive
13

errors in c that exceed twice the scaled uncertainty for nmx > 8. Evidently, spectrum (7)
accommodates rapid &pole decline and quadrupole rebound, but is too soft for higher degrees.
Further tests against other observational spectra might better distinguish between spectra (5), (7),
and promising intermediate modulation factors such as [n(n+l)]5’4, particularly if the maximum
degree of reliable F,(t) can be established.
5.3 More Tests. Model CM3 [Sabaka, Olsen & Langel, 20021, fitted to Magsat, POGO and
observatory data from 1960 to 1985, features a more comprehensive representation of external
source fields than earlier models, an internal static field through degree 65, and a temporal spline
parameterization of SV. The SV model was, however, constrained to reduce the amplitude of
narrow scale SV that is poorly determined by geographically sparse data before POGO and after
Magsat satellite surveys. Two constraints were used. The first conflicts with spectrum (5) by
forcing the mean square value of the surface Laplacian of dBJdt, averaged over the sphere of
radius cs and time, to be small - as if the SV spectral modulation factor were n-4 or less instead of
nf3. This first constraint was not as strongly imposed as the second, which forces the mean
square second time derivative of B,, also averaged over the sphere of radius over cs and time, to
be small. f i s reduces temporal variability in F, from model CM3, notably at high degrees;
indeed, it helps makes the F, steady to withln 18% for n > 5, and to within 5% for n > 10.
Comparison of mean SV spectra from models CM3 and GSFC 9/80, both averaged from
1960-1980, shows the two sets of <F,> agree to within 25% for n e 11, with CM3 giving smaller
values - typically 12% smaller. For degrees 11, 12, and 13, however, values from GSFC 9/80
exceed those from CM3 by factors of 2.6, 1.8, and 34.5, respectively. The latter exceeds the
factor of e anticipated from process variance. Evidently, &I3> is not reliably determined and so
is not considered further.
14
Tables 4a and 4b show results of fitting theoretical SV spectrum (5) to the mean SV spectrum
from CM3, averaged from 1960 to 1980. Low values for c- in Table 4a might again suggest
spectrum (5) is too hard; yet the increase in estimated c‘ with nmax is evident. Table 4b confirms
this to be largely due to d ; l > and &2>. The fits listed in Table 4b are quite tight; indeed, for the
minimum q2 of 0.0321, deviations from { Fn} are typically a factor of (1 .2)L1 instead of e“.
Tables 5a and 5b show fits of proxy SV spectrum (7) to CM3. They confirm that the
attenuated quadratic form does fairly well considering degrees 1 through nmax c 13, but yields
errors in c that are judged significant for higher degrees 3 though nmax > 7. Downward
continuation shows the higher degrees contribute far more to SV by the CMB than do F1 and 272.
Although extended study suggests proxy spectrum (7) might be more suitable during another,
shorter epoch (see Appendix F), it is bypassed for now in favor of expectation SV spectrum (5).
6. Core Magnetic Spectrum from Narrow Scale Flow and a Weak Field
Though (Fn/RJ1’* was studied empirically as a kind of summary dispersion relation for the
core field, M. G. McLeod (1985, pers. comm.) pointed out other reasons to consider spectral ratio
RnC/FnC. As it turns out, some hypotheses indirectly constrain this ratio in ways that allow a
theoretical core-source spectrum R: to be obtained from a theoretical SV spectrum F:. One
such hypothesis specifies the form of the temporal power spectrum [McLeod, 19961. Another is
the hypothesis of “constant aspect ratio”, which asserts a single direct proportionality between
horizontal wave-numbers and effective radial wave-numbers in the non-potential portion of the
poloidal field near a spherical CMB. Such radial wave-numbers arise from analysis of the radial
component of induction equation (4) at the top of a viscous sub-layer. A third also considers the
radial component of (4), but at the top of a free-stream where narrow scale eddies mix and remix
modes of a dynamically weak magnetic field. Yet another reorders arguments in Appendix B.3
to obtain a relation proportional to (B17), hence (B21b), from relations (Bllb), (B18) and (4).
15

All these hypotheses lead from attenuated cubic SV spectrum (5 ) to attenuated l / n core field
spectra like (3b) and all seem compatible with the weak field hypothesis. For brevity, it is here
argued on dimensional grounds that the available diffusivities, the weak field hypothesis, and SV
spectrum (5 ) lead to this form for {R:}.
Recall our narrow eddies at the base of a viscous sub-layer. Each eddy (i = 1, 2, 3, ... I ) has a
characteristic Iateral speed U(i), a characteristic lateral length scale L(i) <c c, hence a lateral eddy
diffusivity U(i)L(i). The ratios of lateral eddy diffusivities to molecular magnetic dffusivity q
define eddy magnetic Reynolds numbers U(i)L(i)/q A(i). By continuity, the normal component
of eddy-induced and other SV crosses a thin, weak viscous sub-layer largely unaltered and
specifies the SV signal emerging from a spherical core into a source-free exterior. At the top of
the sub-layer, however, u vanishes and even the eddy-induced portion of the signal is transmitted
via molecular diffusion. Owing to its importance in such radial magnetic transport, the
molecular diffusivity may be considered a radial diffusivity. The A(i) may then be considered
indices of dffusive anisotropy - ratios of lateral eddy to radial molecular diffusivities.
Neither q nor eddy diffusivities are directly measured; however, observation and analysis can
reveal empirical diffusivities. In particular, for a sufficiently time-varying field, time-averaged
observational spectra an> and <Fn> together define regular empirical time constants
Tn [~&>/d;,>]"~ . (8)
When combined with horizontal wave-numbers, defined via the surface Laplacian operator to be
knh [n(n+1)/c2]'", these Tn further define lateral empirical diffusivities
Dn E (k,h)-2 T;' = [C2/n(n+l)~[d;n>/~,>~1/2 . (9a)
- The theoretical counterpart to definition (9a) is written
c n (k: ) - 2 ~ - 1 [ ~ ~ / a ( n + l ) ] [ { ~ ~ } / { ~ n C ) 1 " ~ . (9b)
16

For a core-source field governed by induction equation (4), the only physical diffusivities that cn
can depend on are q .and the eddy diffusivities, though the latter may depend on other quantities.
On dimensional grounds, any dependence of cn on degree n should, and arguably must, be
determined from that of these diffusivities.
The magnetic field and Ohmic heating of interest are far too weak to cause either appreciable
anisotropy or heterogeneity in core electnc conductivity; therefore, q is effectively independent
of the field, its SV and the harmonic degrees thereof. Eddy speeds and length scales, hence eddy
diffusivities, do not depend directly on SV. They depend only on the fluid velocity, which can
depend on the field via the Lorentz force, JxB, in the usual momentum transport equation.
If the Lorentz force is weak compared with other forces near the core surface, as for
tangentially geostrophic flow [LeMoueZ, 19841, then the fluid velocity and the eddy diffusivities
depend but weakly on the magnetic field. If this dependence is negligible, then the eddy
diffusivities must be effectively independent of the magnetic field, hence the harmonic degrees of
the field. On this weak field hypothesis, neither molecular nor eddy diffusivities near the top of
the core depend on the harmonic degrees n of either the core field or its SV. Yet these are the
physical diffusivities from which the dependence of c n on degree n must be determined. With no
basis on which to construct a degree-dependent theory of cn, we deduce that the cn in (9b) must
reduce to a single constant, independent of n,
cn = [c2/n(n+l)][{Fn"}/{R,C}]*'2 = 5 ,
or
{F,C}I{R,C} = L2c4[n(n+1)l2 = G-2. ( 1 Ob)
By (lob), the core field spectrum is expected to be much softer than that of core-source SV.
17

To check (lob), Voorhies & Conrad [1996] fitted the function PoZn[n(n+l)] - 2 Z n ~ to
observational values of In[F,/R,] from degrees 3-12 of model GSFC 9/80 at epochs 1960, 1970,
and 1980. The three resulting values for PO average to 1.957 & 0.156. This agrees with the
expectation value PO = 2 in (lob). The check is independent of the radius of Earth’s core. The
three values for ~6 are within a factor of 1.94 of 2,640 years (not the “26,400” years misprinted in
Voorhies & Conrad [ 19961). The implications for 5, Rm, and CJ are discussed in Appendix G.
Substitution of expectation SV spectrum (5) , from the iiarrow scale flow hypothesis, into
equation (lob), from the weak field hypothesis, yields our expectation core field spectrum
Though obtained in different ways, quantitative distinctions between spectrum (1 lb) and earlier
forms (A.la), (A.lb), and (A.lc) are largely confined to degrees 1 and 2.
7. Tests of the Core Field Spectrum
Expectation spectrum ( l lb) has two parameters, amplitude K and source radius c-, to be
estimated by fitting observational spectra R,(a,t). An estimate of c- again amounts to an estimate
of c, so the significance of its dlfference from cs provides a test of ( l lb), hence the underlying
hypotheses of narrow scale flow and a dynamically weak field by the top of Earth’s core. The
hypotheses do not specify process variance { [R: - {R;}l2}, so the misfit between theoretical and
observational spectra does not provide a sensitive test of the hypotheses. This process variance
might be large; therefore, we again emphasize comparison of magneto-spectral estimates of c
with the seismologic value cs.
18

To ease this estimation, and anticipating fluctuations about ( l lb) amounting to a factor of
about $', we minimize the sum of squared residuals to observational ln(Rn) for degrees nmin to
n-. The sum of squared residuals per degree of freedom for n, - nhn + 1 data fitted by 2
parameters is just
The estimation requires computation of expected parameter covariance; the square root of the
variances give expected parameter uncertainties. Multiplication of these values by s yields scaled
parameter uncertainty estimates. Typically, s < 1 and the test is more sensitive than expected.
Voorhies et al. [2002] describe a test of spectrum ( l lb ) at Magsat epoch 1980. Here
spectrum (1 lb) is tested against the independent observational spectrum from the grsted Initial
Field Model ( O m ) [Olsen, et al., 20001. The epoch 2000 OIFM features a weighted least
squares fit of main field coefficients through degree 19, and external field coefficients of degrees
1 and 2, to 13,859 select data acquired by the Danish Geomagnetic Research Satellite Qlrsted.
Table 6 lists the range of degrees fitted (nmin = 1 though n,), s2, the estimate of c with scaled
uncertainty, and the error of the estimate relative to cs = 3480 km. Selection of the minimum s2
solution at nmax = 12 fixes a third parameter and yields c = 3542 & 61 km as the core radius
estimated from 0rsted. No significant errors in c are found for degree ranges 1 to nmn < 13, so
(1 lb) passes this test. Estimates from these degree ranges all agree and average to 3489 & 39 km.
The increased misfit and significant errors introduced with degrees above 12 are attributed to
non-core, likely crustal, source fields.
To refine the test by Voorhies et al. [2002], we use Rn from model CM3 of Sabaka, Olsen
and Langel [2002] at Magsat epoch 1980. Table 7 lists the range of degrees fitted, s2, the
19

estimate of c with scaled uncertainty, and the error of estimate relative to c,. Again, no
significant errors in estimates of c are found for degree ranges 1 to n,, < 13. Radii from this
I degree range all agree and average to 3495 2 28 km. This average more heavily weights lower
degree Rn, unlike the process variance for the R: distribution of Voorhies & Conrad [ 19961.
Table 8 is analogous to Table 7, but with nmin = 3. It confirms that much of the scatter, as
measured by the larger values for s2 in Table 7, comes from strong R1 and weak Rl. Table 8 also
shows the effect on estimates of c associated with R8 being lower, and Rg higher, than expected
based on the fit of (llb). The larger residuals at degrees 1, 2, 8, and 9 may help provide some
indication of geomagnetic variability about (1 lb), hence process variance.
A reviewer asks why analysis of magnetic spectra is any better at determining core radius
than the frozen-flux method of Hide. I did not claim it is; however, estimates obtained using
spectrum ( l lb) and the main field models are typically more accurate and precise than those
obtained using the frozen-flux approximation [Hide & Malin, 1981; Voorhies & Benton, 1982;
Voorhies, 19841. In particular, some 44 frozen-flux core locations obtained from a few field
models at various truncation levels average to 3506.2 & 300.9 [Voorhies, 1984, equation (3.21)].
The first 9 estimates in Table 6 average to 3489 39 km; the first 9 in Table 7 average to 3495 2
28 km. Frozen-flux methods rely heavily upon uncertain phase information in harmonic orders m
and upon uncertain secular change information from either SV models or main field models at
different epochs. Analysis of F, also relies on SV. In contrast, the main field spectral method
relies on comparatively well-determined R, alone; moreover, it does not require the frozen-flux
approximation - either in section 6, in the scale analysis of Appendix B.3 and B.4 that requires
finite (r to obtain spectrum (3b), or in the analysis of flux diffusion that returns a similar
spectrum on the constant aspect ratio hypothesis. Evidently, these advantages reduce scatter.

8. Summary and Conclusions
A theoretical form for the low degree, core-source geomagnetic spectrum { R:} is deduced
from the hypotheses of narrow scale flow and a dynamically weak magnetic field by the top of
Earth’s core. This form ( l lb) differs but slightly from those advanced by Stevenson [1983] and
McLeod [1985, 19961. To test these hypotheses, this theoretical spectrum is fitted to two
observational spectra, one determined by analysis of data from the QIrsted satellite and the other
by analysis of independent data from Magsat and POGO satellites and surface observatories.
These fits yield estimates of the radius of Earth’s core. These estimates differ insignificantly
from the seismologically established radius, as judged by the scaled uncertainty estimates, for
degree ranges 1 to nmx < 13. Because these errors of estimate are not significant, the hypotheses
taken together pass these tests.
Significant errors introduced with higher degree multipole powers are attributed to non-core,
likely crustal source fields. Very small errors, less than 10 km, are found by excluding the
strong, rapidly declining dipole power and the weak, rapidly rebounding, quadrupole power.
To deduce the expectation spectrum (llb), we can use the theoretical low degree SV
spectrum (9, which follows from the narrow scale flow hypothesis alone. There are other ways
to obtain both spectra ( l lb ) and (5) , as illustrated in Appendix B; however, the geophysical
foundation of all such methods known to date appears to rest on the narrow scale flow and weak
field hypotheses - provided the temporal power spectrum of McLeod [ 19961 can be inferred from
the approximate spatial spectra. Initial tests of SV spectrum ( 5 ) gave estimates of the radius of
Earth’s core that differ insignificantly from the seismologic value. This shows that the narrow
scale flow hypothesis can pass a test against seismology that is independent of the surficially
weak field hypothesis. Attempts to test (5 ) with the same rigor as (l lb), however, reveal errors
21

arising from rapid dipole decline and quadrupole rebound. Though F1 and F2 contribute little to
SV at the CMB, such exceptional behavior of may cast doubt on (5 ) ; yet it may instead indicate a
need to use degree-dependent process variances and a different distribution for residuals about
SV spectrum (5).
Clearly, physical hypotheses are not proved true simply by passing a few tests, nor does
falsification preclude their use in successive approximation. And there might be different
physical hypotheses that yield theoretical spectra like those presented here. The hypotheses of
narrow scale flow by the top of the core, as described by expectation SV spectrum (3, and of a
dynamically weak core surface field, described via magnetic spectrum (1 lb), have nonetheless
demonstrated considerable merit. By enabling magneto-locations of Earth’s core, these spectra
demonstrate greater utility and accuracy than far softer spectra. Evidently, far softer spectra do
not provide reliable prior information on either the broad scale field or its secular variation. It is
hoped these geophysical hypotheses and geomagnetic spectral forms will be further tested, and
provide some basis for comparison with alternatives that may emerge, in the future.
Appendix A: Magnetic Spectral Ranges
To compare a core-source field spectrum with low degree energy, intermediate, and high
degree dissipation ranges with theory, recall the magnetic energy spectrum M(k) as a function of
Cartesian-Fourier wave-number k (see, e.g., Moffat [1978], Krause & Rudler [1980]). The
proportionality M(k) a k-3’2 is indicated for the inertial sub-range of three-dimensional,
homogeneous, isotropic, incompressible hydromagnetic turbulence; however, kinetic helicity
injection at large k leads to an inverse cascade of magnetic helicity and M(k) a k-’ at low k
[Pouquet, Frisch & Leorat, 1976; Stevenson, 19831. The latter shows similarity between an n-’
spectrum and a downwardly continued observational spectrum Rn(0.55a, 1965) for n 5 8.
22

2 112 Next define horizontal wave-number khn = [n(n+l)/c ] via the surface Laplacian. Granting
M(k) = k-’ at low k, if M(k) = {R;(c))and if k2 0~ kh2, then {R;(c)} = [n(n+l)]-’n at low n and
{R;(a)} = K1 [n(n+1)]-”2 (c/a)2nd (Ala)
z KM (n+1/2)-’I2 (c/a)2n+4 (Alb)
z KS n-l (c/al2OA . (A 1 c)
Here K1, KM and KS denote constants, c core radius, and a Earth’s radius. By inequality (3a) for
n 2 ND, if either Stevenson’s [1983] relaticn (Alc), Il4cLeod’s 119961 rule (Alb), or equation
(Ala) holds at low degrees n NE, then NE 5 ND, then there may indeed be an intermediate, if not
inertial, sub-range between NE and ND.
Of course, the “ifs” strain a comparison already made difficult by possible effects of mantle
heterogeneity near the CMB; anisotropy imposed by rotation at planetary angular velocity 51, the
CMB, and the field itself; compression; suppression of turbulence by rotation or a strong field;
and sources in the mantle and crust. Yet as argued in Appendix B, the net effect might amount to
a time-averaged spectrum similar to (Ala), perhaps with power distributed unevenly among the
various orders within each R,, notably R1, due to anisotropy and lateral heterogeneity. There is
evidence that spectra like (Ala) describe both modem observational spectra and time-averaged
paleo-field behavior [Voorhies & Conrad, 19961. Moreover, agreement between such spectra
and observation [Voorhies et al., 20021 offers some support for the temporal magnetic power
spectrum used by McLeod [1996] to obtain (Alb) for n 2 2.
Appendix B: Spectra from Scale AnaIyses
A reviewer asks if the spectrum of a magnetic field in a turbulent fluid has physical
plausibility analogous to the famous Kolmogorov k-5‘3 scaling for the Iunetic energy density
spectrum E(k) in the inertial sub-range of a turbulent flow (see, e.g., Tennekes & Lumley [1972])
23

and requests mathematical illustration. Here we show the answer is yes and offer an illustration
that yields both expected spectrum (3b) and SV spectrum (5). As noted by Pouquet et al. [1976],
however, care is needed to obtain a magnetic spectrum excited by small scale flow, instead of an
Alfven-wave spectrum excited in an inertial sub-range maintained by large scale flow (see B.l
below). Additional care is needed to obtain a spectrum for a self-governing dynamo, rather than
one driven by assumed rates of kinetic energy injection (see B.2). Finally, to deduce theoretical
spectra comparable with observational spectra, extra care is needed to account for sphericity and
the anisotropic dynamical effects of rotation, Lorentz forces, and the CMB (see B.3 and B.4).
Consider flow of a magnetized Newtonian fluid with scalar mass density p, kinematic shear
viscosity v, magnetic permeability p, electric conductivity o and magnetic diffusivity l/po q.
Quasi-steady changes in macroscopic B due to fluid velocity u and magnetic diffusion are
described by the induction equation (4). For a characteristic length scale L and flow speed U, the
ratio of motional to diffusive terms scales as the magnetic Reynolds number
Rrn UL/q = IVx(uxB)I IqVxVxBI-' .
This is also the ratio of the characteristic eddy diffusivity to the magnetic diffusivity.
Much as the kinetic energy transport equation is obtained from the inner product of u with
the momentum equation, the magnetic energy transport equation is obtained via the inner product
of B with the induction equation (see, e.g., Chandrasekhar [1981]; Gubbins & Roberts [1987]).
The Ohmic dissipation of magnetic energy per unit volume, -J2/o, scales as qB2/2pL2. The
viscous dissipation of lunetic energy per unit volume, -pvu.VXVXu for solenoidal flow, scales
as vpU2/2L2. The ratio of magnetic to viscous djlssipation scales as ( v / q ) - ' ( B 2 / ~ U 2 ) , where v/q
is the magnetic Prandtl number. In the flow of a fluid metal with v/q c< 1, if magnetic energy
density B2/2p is at least as great as kinetic energy density pu2/2, then magnetic dissipation will be
24

very much greater than viscous dissipation, So we focus on magnetic dissipation and dynamo
action, whereby motion of the fluid conductor across the field does work against the Lorentz
force, converting kinetic into magnetic energy. The latter may accumulate, dissipate into heat, or
radiate away. The rate of work done against the Lorentz force per unit volume, -u.(JXB), scales
as UB212pL.
More generally, u and B may vary on all possible length scales I and may be represented
mathematicd!y via superposition of orthogonal modes, such as Fourier transforms with wave-
vector k and wave-number I k I = k =: l-’. Work done by flow at one scale against the non-linear
Lorentz force can energize the field over a range of scales. And magnetic energy at one scale is
influenced by the flow over a range of scales. Because of this mode mixing, magnetic energy
dissipated at any single scale may come from lunetic energy distributed over a range of scales.
Mode mixing is governed by the usual selection rules. We shall, however, only consider
states of a hydromagnetic system with a standard spectral deviation <[M(k) - ~kf(k)>]~>”~ that
does not vastly exceed the mean dM(k)>. In such a state, a theoretical expectation spectrum
{ M ( k ) } =: dM(k)> could be of some use; moreover, there is a fair chance that a sample spectrum
at a single time is within a factor of two or three of the mean. In or near such a statistically
steady state, energy mixed from one mode ka to other modes ki at one rate is re-mixed to still
other modes kj and, on average, returns to mode k, at about the same rate. This implies the
transformed magnetic and velocity fields are so thoroughly intertwined that fields of like wave-
number are physically related, as can be seen by repeated or multiple applications of the selection
rules. We focus on the physical relations, with the understanding that they result from mode
mixing rather than a single application of the selection rules.
25

Suppose u and B can be considered smooth on very small spatial scales, with scale lengths e
ho. At length scale ho, let Rm attain unity at characteristic speed u = vo:
vohdq = 1 . cB2)
At this scale and speed, eddy diffusivity ul = voho will equal magnetic diffusivity q and advective
time-scale ‘ca = l/u will equal diffusive time-scale 74 = 12/‘q. At larger scales, or at greater speeds,
fluid motion may curl the field faster than it diffuses away via electrical resistance to its source
current of density J (VXB = ClJ, VXVXB = -V2B).
Let b(Z) denote the magnetic field of length scale Z and let bo denote b(h0). At 1 = ho and
speed vo, the magnetic dissipation scales as Do(h0) = qb2/2@2. By equation @2), this also
scales as the rate of work against the Lorentz force: Do = qb2/2$~$ = vob2/2@o. So ho is the
magnetic dissipation scale, ho = (qb;/2@0)~’~, and vo is about [2Ddobo 3 .
B. 1 Kolmogorov-Alfven Scaling
2 112
Denote by E the total magnetic dissipation per unit volume in a hydromagnetic flow. Suppose
this occurs mainly over a range of length scales less than or approximately equal to ho. Further
suppose the magnetic energy dissipated comes from the kinetic energy pU2/2 of a flow with
speed U and large geometric length scale L >> ho. The energy is supplied by work done against
the field B of length scale L. If this energy conversion occurs in advective time-scale W U , then
E -- UB2/2pL = p U 3 / 2 L . 033)
. More generally, the energy dissipated may come though a range of scales. Consider a sub-
range ho < l < L and VO 5 u 5 U through which magnetic energy cascades from the field of scale L
toward the dssipation range at rate
E -- ub2/2pl = pu3/21. @4a) -
26

This assumes the time-scale for kinetic energy density pu2/2 in motions u(Z) of scale Z to be
transferred to the field b(Z) is 78. Granting (B4a) for now and solving for u gives:
u = (2pZdb2) = (2Zdp)’”. (B4b)
The implied kinetic energy per unit volume at wave-number k = I‘’ is pu2/2 = ( p / 2 ) ’ ” ( ~ / k ) ~ ~ ;
therefore, the kinetic energy density per wave-number is
Em(k) = pu2/2k = ( p ~ ~ / 2 ) ” ~ k - ~ ’ ~ . (B5)
This is proportional to the Kolmogorov form for an inertial sub-range. Also by relation (B4b),
the magnetic energy per unit volume at k is b2/2p = (p/2)1’3(~/k)u3; therefore, in this case the
magnetic energy density per wave-number is
036) 113 -513 M m ( k ) = b2/2M = ( P E ~ / ~ ) k .
As appropriate to a field of Alfven waves excited by motions in an inertial sub-range, Em(k) and
M a @ ) are approximately equal. Of course, relations (B4a) though ( 3 6 ) fail when dynamical
constraints render advective time-scales za irrelevant to the transfer of kinetic energy.
B.2 Large Scale Flow
By presuming the rate of work done against the field equals the kinetic energy density per
advective time-scale Ta, case B.l compels magnetic and kinetic energies to be in approximate
balance, as in an Alfven wave field. For dynamo action, however, magnetic energy density
b2(Z)/2p need only be replenished over free decay time 7d. The rate of work done against the
Lorentz force still scales as ub2/2pZ, but the kinetic energy transfer only needs to occur over time
Z2/‘q. In this case, relation (B4a) would be replaced with
E = ub2/2pl = pu2~/2Z2.
Granting this for now and solving for u yields
u = (2Z2~pq)1’2 = (2@E/b2) = (Zb2/pqp).
27

This relation implies
b2/2p =: ( p q ~ / 2 ) ’ ’ ~ . (B 8)
By relation @8), the magnetic energy density at k = I -’ is also about (pq~/2)”~; therefore, in this
second case, the magnetic energy density per wave-number is
039) 112 -1 MuF(k) = b2/2# = ( p ~ d 2 )
Also from relation (B7b), the kinetic energy density at k is pu2/2 = (dq)k- ’ ; therefore, in this
k .
case the kinetic energy per unit mass per wave-number is
EuF(k) = pu2/2k = (&/q)k-3. (B 10)
This k-3 form describes a predominantly large scale flow. It illustrates how a strong field may
suppress small scale flow. Indeed, E(k)/M(k) from relations (B10) and (B9) is (2dpq ) k ,
which falls off as k-2 and increases with o3I2 and &’I2. The spectrum of magnetic change, obtained
using relations (B9) and (B lo), the motional term in equation (4), and implicit treatment of mode
mixing, is proportional to that of the field itself: F u ~ ( k ) = (a,b)2/k = (kub)2/k = ( 2 ~ p ) ~ ’ ’ ( o / p ) k .
Evidently, this is not the case. near the top of Earth’s core.
3 112 -2
112 -1
Case B.2 might seem to describe a more efficient dynamo than case B.l because, presuming
Td >> T ~ , the kinetic energy required to maintain a large scale field would be extracted over a
longer time. In fact, case B.2 still presumes: (i) Ohmic dissipation is confined to small scales 5
ho on which z d 5 T ~ ; (ii) an energy cascade from large to small scales; and (iii) a time-scale for
kinetic energy transfer devoid of dynamical justification.
B.3 Small Scale Flow
Now suppose most of the kinetic energy is injected at fairly small scales near Z*, albeit with
I* 2 ho. This motion may set up a cascade of magnetic energy to smaller scales, but may also
drive a mode-mixed reverse cascade to larger scales. Let E indicate the overall magnetic
28
~- __

dissipation in the flow, which realistically occurs over the full range of length scales. At larger
scales I > I*, and near a statistically steady state, the rate of work done against the Lorentz force
approximately balances Ohrmc Issipation, so
Iu.(JxB)I = a-'u(l> I * ) [ ~ ( z > Z * ) I ~ / ~ I
( B 1 w 2 2 2 - =: [b(Z > I*)] //L OZ - I J2/o1.
Here a is a constant representing typical geometric factors; it is large if the field tends to be
nearly Lorentz force-free, or if u tends to be parallel to either J or B. We solve (B 1 la) for
u(Z>Z*) -- aqz , (B1 lb)
and see a as a pseudo-scale invariant magnetic Reynolds number. By (B1 lb), we expect
{E(k c k*) } = { p[u(k < k*)I2/2k} = a2pq2W2 . (B 12)
This is consistent with a predominantly small scale flow.
We cannot assume the time-scale on which work is done at the expense of kinetic energy at
length scale I because it depends on dynamical constraints near the top of a self-excited, self-
regulating core geodynamo. Following Voorhies [ 1991, equation (BS)] and Benton [ 1992,
equation (32)], the dynamical constraints are here summarized by the magneto-geostrophic radial
vorticity balance near the top of the core,
~ V S . ( ~ S Z , U ~ ) - Vs.(BJ,) 0313)
where Vs. denotes the surface divergence operator, Qr the radial component of planetary angular
velocity (!2R,cose), B r the radial component of B, and us and J, the horizontal components of u
and J, respectively, Anisotropies imposed by rotation and by the field are explicit in equation
(B13). The published derivations explicitly account for anisotropy imposed by the CMB by
omitting small terms with ur and J, , terms which would be zero at the spherical boundary with a
rigid, insulating mantle. The condition J, = 0 implies any poloidal current, hence toroidal
29

magnetic field, is zero at the boundary; therefore, a magnetic spectrum deduced using (B13)
should only be applied to the poloidal field at the top of the core and, upon upward continuation,
to the potential field of core origin.
If the simpIe scaling of (B13) were multiplied by 1, it would suggest Lorentz and Coriolis
forces are of similar magnitude. Yet (B13) concerns vertical vorticity, not forces, and can hold
when the Lorentz force is weak. Moreover, such scaling overlooks some geometric effects. For
example, axisymmetric zonal flows contribute nothing to the left side of (B13), yet may be
important in the force balance; similarly, a class of currents tangent to contours of B, may help
generate the main field, yet contribute nothing to the right side of (B13) [Voorhies, 19911. To
avoid any misimpression, equation (B13) is here scaled as
2PpSzu(Z > Z*)/l = [b(Z > Z*)I2/pl 2,
where p is a constant representing typical geometric factors. On the hypothesis of a very weak
Lorentz force near the top of the core, p << 1.
From relation (B 14), we find
[b(Z > Z*)I2/p = 2ppQzu(z > Z*) .
We use relation (B1 lb) to eliminate u from (€315) and obtain
[b(Z > Z*)I2/p =: 2ClPpQy .
From this relation, the expected magnetic energy density per wave-number is
{ M ( k < k * ) } f { [b(k < k*)I2/2pk} = appQqk-'. (I3171
Lf relation (Blla) between Ohmic dissipation and the rate of work done against Lorentz
forces can be extended to a rate of change of kinetic energy, so that qb2/pZ2 = ub2/pZ =: pu2/z, we
can solve for the transfer time-scale z = (pu2p/b2)Z2/q. By relations (Bllb) and (B16), this
30
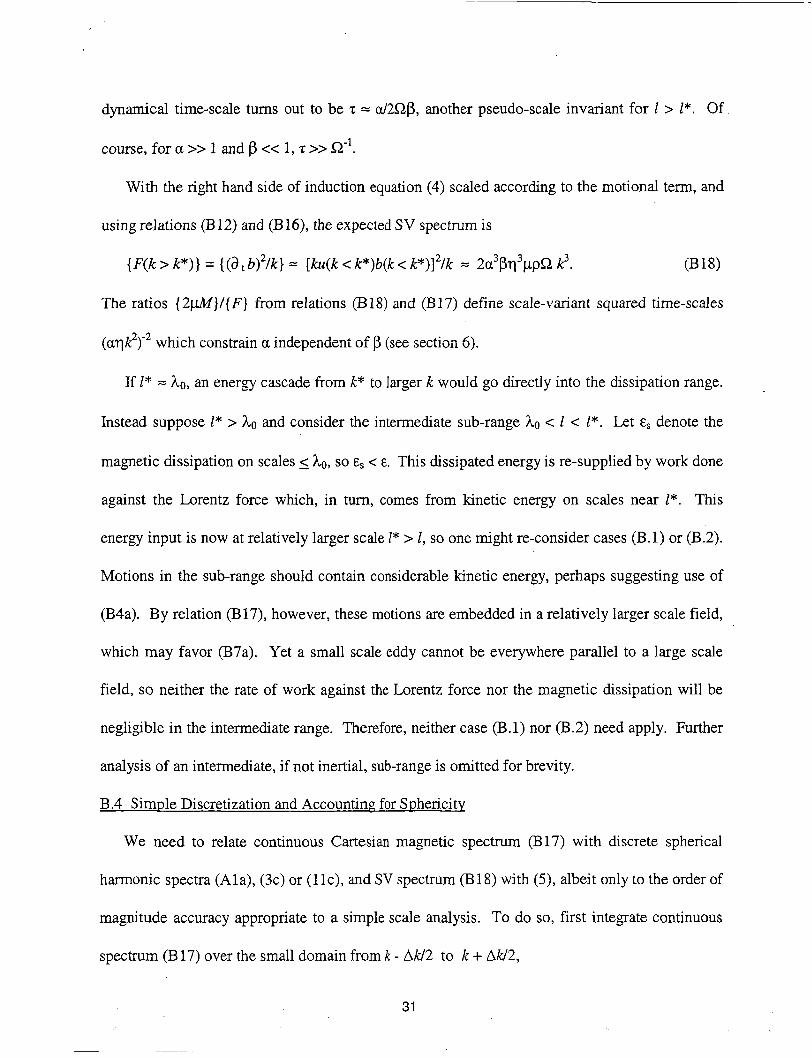
d y n d c a l time-scale turns out to be z = a/2sZp, another pseudo-scale invariant for I > I*. Of
course, for Q >> 1 and p << 1, z >> Q-’.
With the right hand side of induction equation (4) scaled according to the motional term, and
using relations (B 12) and (B 16), the expected SV spectrum is
{ ~ ( k > k*) 1 = {(a b12/k) = [ku(k k*)b(k < ~ 1 1 2 ~ = 2a3pr13pp~ P . 0318)
The ratios { 2pM}/{F} from relations (B18) and (B17) define scale-variant squared time-scales
( a ~ k ~ ) - ~ which constrain a independent of p (see section 6).
If I* = ho, an energy cascade from k* to larger k would go directly into the dissipation range.
Instead suppose I* > ho and consider the intermediate sub-range ho c I c I*. Let E~ denote the
magnetic dissipation on scales 5 ho, so E~ < E. This dissipated energy is re-supplied by work done
against the Lorentz force which, in turn, comes from kinetic energy on scales near I*. This
energy input is now at relatively larger scale I* > I, so one might re-consider cases (B.l) or (B.2).
Motions in the sub-range should contain considerable kinetic energy, perhaps suggesting use of
(B4a). By relation (B17), however, these motions are embedded in a relatively larger scale field,
which may favor (B7a). Yet a small scale eddy cannot be everywhere parallel to a large scale
field, so neither the rate of work against the Lorentz force nor the magnetic dissipation will be
negligible in the intermediate range. Therefore, neither case (B.l) nor (B.2) need apply. Further
analysis of an intermediate, if not inertial, sub-range is omitted for brevity.
B.4 Simple Discretization and Accounting for Sphericity
We need to relate continuous Cartesian magnetic spectrum (B 17) with discrete spherical
harmonic spectra (Ala), (3c) or (1 IC), and SV spectrum 0318) with ( 5 ) , albeit only to the order of
magnitude accuracy appropriate to a simple scale analysis. To do so, first integrate continuous
spectrum (B 17) over the small domain from k - AW2 to k + AW2,
31

k + AW2 k + AU2
(B 19a)
C$@Q~ h[(l + AW2k)/(l - AW2k)I (B 19b)
= a & d 2 q ( A W k ) . (B 19c)
where the logarithm has been expanded and approximated in terms of 4W2k <c 1.
Next, guided by the surface Laplacian operators in the transfonn domains, set k2 = n(n+l)/c2.
This ixnplies hk = (n +1/2)[n(n + 1)]- c 4n, and we set An = 1 to express the magnetic energy 112 -1
density in harmonics of integer degree n. With these identities we obtain
k + AU2
k-M2 5 {M(k < b)}dk = appQq (n +1/2)[n(n + 1)l-I .
Note k has been treated as a horizontal wave-number kh. Distinctions between radial wave-
vector component kr and kh are omitted for three reasons. First, we are concerned with the
spectrum of the field on a thin shell by the top of the core. Second, apart from the tiny jump in
horizontal components across a viscous sub-layer, this field should match a core-source potential
field (solenoidal B = -VV, so -V2V = 0, h2 + k: = 0, and kr = +ikh). Third, the vertical vs.
horizontal anisotropy implied by CMB conditions was already used to derive equation (B13),
hence is implicit in relation (B 17). This omission of distinctions between h2 and k: is consistent
with the constant aspect ratio hypothesis (see section 6).
Relation (B20) gives the magnetic energy density per harmonic degree. The expected
squared magnetic field per harmonic degree at the top of the core is 2p times this quantity, so
{Rn(C-)) =: (2dNPQVl ) (n +1/2)[n(n f 1 ) I - l (B21a)
at low degrees. On upward continuation to radius r > c, this yields
{R,C(r)} = K(n + %)[n(n+l)]-' ( c - / T - ) ~ ~ + ~ ,
32
' (B2lb)

which is relation (3b). Though obtained in a very different way, it is indistinguishable from
equation ( l lb) and differs but slightly from equations (Ala), (Alb), and (Alc). We have,
however, identified K = 2apppqIs1. Granting p = M, p = lo4 kg/m”, SZ = 7.29~10- s , and q =
1.6 m2/s, the estimate K = 4 . 5 ~ 1 0 ’ ~ nT2 [Voorhies et al., 20021 implies aP is roughly 1.5~10-*.
5 -1
With a = R, = 92 from Appendix G, we find p = 1 . 7 ~ 1 0 - ~ << 1. This is consistent with, and
arguably requires, a dynamically weak field near the top of the core. These values further yield a
dynamicid time scale d 2 Q p of order 120 years.
Similar operations on relation (B lS), albeit with no multiplication by 2p, yields
{Fn(c-)} 4a3Pq3ppi2 c - ~ (n + 1/2)[n(n + I)] (B22a)
for low degrees, or, on upward continuation to r > c,
{Fn(r)} = 4a3pq3ppS2 c%(n + 1/2)[n + 11 (c-lr)2n+4 .
This is indistinguishable from equation (5). The ways in which these relations are obtained could
hardly be more different, but both suppose narrow scale flow and so give the same result.
Appendix C: Derivation of an Expectation SV Spectrum
The magnetic change induced by each narrow-scale eddy can be approximated in the far field
by an equivalent source of change atop a mainstream of radius c-. Though a single magnetic flux
vector on c- acts as the point source of an offset dipole field, lateral advection replaces it with an
adjacent vector of slightly different orientation and magnitude in time At; therefore, the net
change in the exterior field is equivalent to that from a differential change in magnetic dipole
moment Ad. Here we derive the secular variation (SV) spectrum from one such equivalent SV
source, then the SV spectrum (5) expected from I random, uncorrelated equivalent SV sources.
Denote by AVi(r) the change in scalar magnetic potential at observation point r due to the
equivalent magnetic dipole moment change Adi at position ri corresponding to the ith eddy. Note
33

I r I > I ri I = c- and index i = 1 , 2, 3, . . . , I. Further denote by D' the normalized rate of change
AdilkAt, The superposition of all I such changes gives the total change in potential at r,
I I D' 1
i= 1 i=l 4n: Ir - ril AV(r) = C AVi(r) = - C - 0 V--- At
I
i= 1 = C (Di/4n) V*lr - Gl-'At
wnere 0" denotes the gradient operator in ienns of, and acting on, ri coordinztes (radius r;, co-
latitude Oi, east longitude Q,). With the Schmidt normalized associated Legendre function of
degree n and order m denoted P,"(cose), the spherical harmonic expansions of the AVi are used
to rewrite (Clb) as
I 00 n
i=l n = l m=O AV(r) = C aAt C ( a / ~ ) ~ + ' C [Anmi COS^@ + Bn"i sinrn@] P,"(cose).
To determine coefficients (Anmi, Bnmi) in expansion (Clc) from moment changes Di, recall
where Cum = cosmQP,"(cose) and S," = sinm$P,"(cose) (see, e.g., Jackson [1975, eqn. (3.70) or
Langel [1987, eqn. (195)l). With the components of Di denoted (Ori, Do', DQi), we use (C2) to
evaluate the gradient in (Clb), equate the result with (Clc), and obtain
34
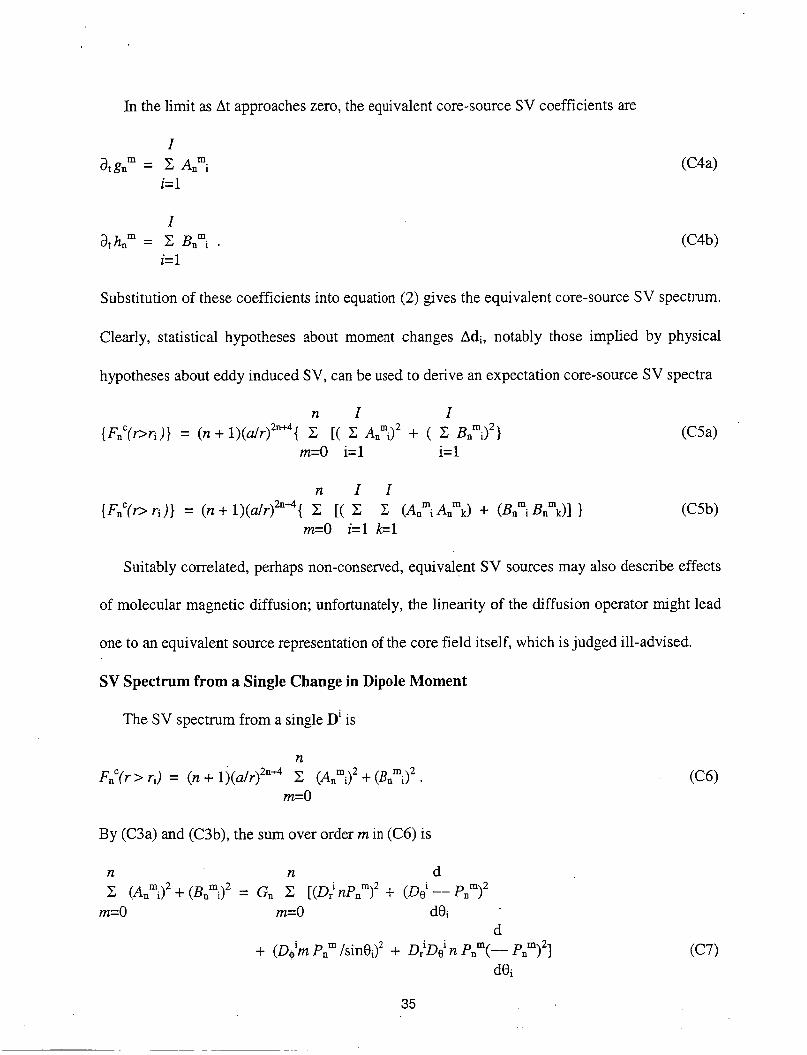
In the limit as At approaches zero, the equivalent core-source SV coefficients are
Substitution of these coefficients into equation (2) gives the equivalent core-source SV spectrum.
Clearly, stztistical hypotheses about moment changes Adi, notably those implied by physical
hypotheses about eddy induced SV, can be used to derive an expectation core-source SV spectra
n I I
m=O i=l i= 1 {FC(r>ri)} = (n + l ) ( ~ / r ) ~ " ~ { C [( + ( Bn"J2}
n I I C
m=O i=l k=l {F,"(D c)} = (n + l)(a/r)2"A{ C [( C (Anmi Anmk) + (Bnmi Bnmk)] } (C5b)
Suitably correlated, perhaps non-conserved, equivalent SV sources may also describe effects
of molecular magnetic diffusion; unfortunately, the linearity of the diffusion operator might lead
one to an equivalent source representation of the core field itself, which is judged ill-advised.
SV Spectrum from a Single Change in Dipole Moment
The SV spectrum from a single Di is
n
m=O F,"(r > Ti) = (n + l)(dr)2nd C (Anmi)2 + .
By (C3a) and (C3b), the sum over order m in (C6) is
35

where G,(Q) = ( 4 7 ~ ~ ) - ~ ( ~ /a)2n-2 and both Pnm and its derivative are evaluated at cosei.
To cast (C7) into a more illuminating form, we use spherical harmonic identities to reduce
the four terms on the right, each a sum over m. For arbitrary (e,$), the sum rule for Schmidt
normalized harmonics (see, e.g., Jackson [1975, eqn (3.62) with y = 01, LangeZ[1987]),
n n
m=O m=O
is differentiated repeatedly with respect to 8 to obtain
x [cnm(e,$)i2 t [sUm(e,+)l2 = c [ P , ~ ( c o s ~ ) I ~ = 1 ,
n d c
m=O de 2Pn" --Pn" = 0 ; ( C W
n d2 d
m=O d28 de
The first term on the right of (C7), the radial term, sums to (D,'n)2 by (C8a); the fourth term, the
cross term, sums to zero by (C8c).
c 2P,"--Pnrn + 2[-Pn"]2 = 0 . (C8C)
To reduce the second, co-latitudinal term on the right of (C7), recall that r2 times the surface
Laplacian of Sn" gives
By adding this to the corresponding relation for Cum, we find
therefore,
n d 11 case d
m=O de m=O sine de c pDrn --P," = c [(rn/sineI2 - n(n + I)][P," l2 - -- P," --P," . (C9C)
The last term on the right sums to zero by (C8b); substitution of the remainder into (C8c) yields
36

To reduce the third term on the right of (C7) and complete reduction of the second, we need
the sum over m of - [ m ~ n r n ( ~ ~ ~ e i ) / ~ i n e i ] 2 . In terms of the angle y between the r and ri , x cosy,
and Legendre polynomials P,(x), it has been shown that this sum reduces to
n fln(x) 2 c -[m~,~(cose~)/sine~l = - ----- I x = .
m=O dx
Evaluation of Legendre's equation at x =1 and the normalization Pn(1) = 1 then imply
(Clla)
(Cllb)
The proof of (Cllb) by Whaler & Gubbins [1981, Appendix B], which they attribute to P. H.
Roberts, is more elegant than that by Voorhies [1998].
By (Cllb), (C10) is equal to n(n+1)/2; therefore, the second term on the right of (C7) sums to
Similarly, the third term on the right of (C7) sums to n(n + 1)(D4i)2/2. n(n + 1)@2)2/2.
Substitution of (C7), as simplified by identities (C8b,c), (C10) and (Cllb), into (C6) yields
This is the SV spectrum from a single changing moment Adi/At = k D i at ri < r.
Expected SV Spectrum from Uncorrelated, Randomly Oriented Changes in Moment
At an instant in geologic time, the I equivalent SV sources D' representing eddy induced SV
are treated as a sample population with mean square moment change {D2}. The coefficients in
(CSa,b) are given in terms of the D' by (C3a,b). The source positions (0i,@i) on c- are taken to be
37

random samples from a laterally uniform spatial distribution. Such positions are expected to be
uncorrelated in that { r i * r k } = &{ (ri)2}, where the Krgnecker 8ik is 1 if i = k and is 0 if i # k.
For randomly oriented moment changes corresponding to a kinematically unbiased ensemble
of eddes, any particular orientation is as likely as its opposite,
{Ori) = = =o, (C13a)
there is no reason to expect cross-correlated components for an individual moment change,
{DlDa’} = {D:un;} = {DiDg’} = 0,
there is no reason to expect cross-correlated moments
{ D,‘D,k} = { D2Dek} = { Dg’D;} = 0 for i f k
{DriD>} = {DriD:} = {DiDlpk} = 0 for i # k,
but the auto-correlations remain perfect
{Drill:} = { DeiDei} = { DQiDoi} = { D 2 } / 3 , (C13e)
Equations (C13a-e), summarized by ID:} = 0 and {DjD:} = {D2/3}&k6j l , provide a
mathematical statement of “random equivalent SV sources” associated with a kinematically
(C13b)
(C13c)
(C13d)
unbiased ensemble of eddies. Polarizing dynamical effects, whereby eddies might tend to align
with the planetary rotation axis andor the field, are outside the focus of this appendix.
Though D‘ depends on position (€Ii,@), position is independent of D’; therefore, when
evaluating {Anmi} and {Bnmi} via (C3a,b), the expectation operator passes through the harmonic
functions of (@,A). These expectation values are zero by (C13a), as are expected or mean SV
coefficients by {(C4a,b)}, hence the expected components of SV itself. Though the expected SV
vector from random equivalent sources is zero, the expected spectrum is not.
Equations (C13a-e) and (C3a,b) imply contributing coefficients are not cross-correlated
{Anm,Anmk} = Bnmk} = O for i # k . (C14)
38

Again, the auto-correlations remain. Substitution of (C14) into (C5b) yields
n I
m=O i=l {F:(r > ri ) } = (n -I- l)(a/r)2"+4{ C [ C (A,mi)2 + } (C15)
The order of sums in (C15) is reversible, so the expected spectrum from I uncorrelated SV
sources is the sum of expected spectra from each source. With ri = c-, (C15) and (C12) imply
{ ~ ~ ~ ( r > c-)} = (4.nr3>-2 I ( c - / ~ ) ~ " - ~ n(n + l > [ n { ~ , 2
By (C13c), this simplifies to
{ F:(r > cy} = (471r3)-2(1{ D2}/3) (C-/r)2n-2 [n(n t
With C = ( 4 n ~ - ~ ) - ~ ( 2 1 ( D ~ } / 3 ) , (C17) becomes
{ ~ : ( r > c-)} = c n (n + '/z)(n + 1)(c-/r)2n+4,
which is just equation (5).
Appendix D: SV Spectral Variance
For steady c-, equation (5) also gives the time-averaged spectrum expected from a temporal
sequence of kinematically unbiased ensembles of equivalent SV sources, denoted <{ F:(t)}>,
albeit with amplitude C replaced by <C(t)>. The associated sequence variance <[{F:(t)} -
<{F;(t)}>l2> is proportional to <[C(t) - <C(t)>I2>, but has the same functional dependence on n
as the square of spectrum (5). The root mean square sequence deviation is therefore proportional
to the expected SV spectrum itself. This is a strong restriction on the kinds of long term
magnetic variations that could be adequately described by the narrow scale transport model. For
example, if eddies and eddy transport change in response to a change in a driving function (e.g.,
heat flux across a CMB, heat and buoyant component fluxes across an inner core boundary, etc.),
then this sequence of kinematically unbiased ensembles could describe a corresponding change
in the amplitude, but not the shape, of the expected low degree SV spectrum.
39

Different sets of Mi can represent broad-scale SV induced by different numbers of eddies
transporting different fields at different speeds; however, a single ensemble from this temporal
sequence of ensembles will give but one ensemble-mean low degree SV spectrum. Each such
ensemble represents lateral magnetic transport by an ensemble of eddies with a corresponding
mean number of edles, mean speed and, arguably, a mean pattern and intensity for the field
being transported. If the mean number of eddies, mean speed, and mean field properties can and
do change by their own magnitude from one ensemble to the next in the sequence, say from one
epoch to another, then the sequence variance will not only be proportional to, but will arguably
have amplitude similar to, or perhaps somewhat greater than, c {F ,"}>~ itself.
Physical deviations F,(t) - { F:} may also arise from dynamic processes that cause serial, as
well as lateral, correlation between SV induced by eddies which grow, vacillate and decay. Such
deviations are arguably of a magnitude similar to {Fnc) itself and may persist for a long time,
perhaps as long as dynamic JxB conditions associated with a polarity chron, a particular pattern
of heterogeneous electrical or thermal boundary conditions, etc.. If so, and if spectrum ( 5 ) still
described a geologically longer time average of F:(t), then natural fluctuations F:(t) - {F:}
would again have variance similar to, if not somewhat greater than, { F:}2.
Appendix E: Effects of Uncertain Process Variance
The statistical sipficance of residuals depends on both data covariance and process
covariance. Here, data covariance represents uncertainties in an observational SV spectrum
Fn(a, t), hence the sparse distribution of uncertain geomagnetic measurements used to determine
SV coefficients. Process covariance represents fluctuations of a theoretical core-source SV
spectrum Fnc(a,t) about its expectation value, plus omitted non-core contributions to the
observations. For F,(a,t) determined by careful analyses of satellite and surface observatory
40
_ _ _ _ _ _ ~

measurements, and anticipating process variance of magnitude similar to { F,"(a))' itself, process
variance should exceed data variance at low degrees.
The narrow scale flow hypothesis specifies neither a probability distribution function for SV
spectrum fluctuations nor a process variance, so one can but estimate the latter from residuals. I
doubt this distribution can be determined from 10 or 12 sample residuals. Fluctuations F,"(t) -
{ F:} cannot be normally distributed because F:(t) is positive, but many other distributions are
eligible (truncated Gaussian, log-normal, chi-squared, etc.). Whatever the trial distribution, when
process variance is estimated from but a single set of residuals, here by scaling weights so the
sum of square weighted residuals per degree of freedom becomes unity, then the (in)significance
of the residuals does not test the hypothesis. The test is in the comparison of estimated
parameters with values determined by independent analyses of independent data. We therefore
emphasize comparison of magneto-spectral estimates of source radius c with independent cs.
Appendix F: A Softer SV Spectrum for 2000?
On orbit magnetic calibration and magneto-optical alignment checks enabled the fitting of
high quality main field and SV coefficients to high precision scalar and oriented vector data
acquired by grsted. Here we consider Fn(2000) from model OSVM [Olsen, 20021, which fitted
24,585 two-component vector and 68,448 scalar and field aligned (arsted data from a 2.5 year
interval and data from about 100 observatories for 1998-2000. Compared with en> for 1960-
80, there are decreases in F2 and perhaps F6, increases in F3, F4, and Fs, but rather small changes
for F7, F8, and Fg. The decrease in F2 suggests less rapid quadrupole rebound.
Estimates of c- using OSVM and spectrum (5) are typically well below cs. Estimates using
' proxy spectrum (7) and n ~ n = 1, shown in Tables Fla, agree fairly well with cs and have less
misfit than shown in Tables 3a and 5a; moreover, for nmin = 3, the errors shown in Table Flb are
rather less than found in Tables 3b and 5b. We therefore suggest spectrum (7) might be more
41

suitable than (5) at some epochs, perhaps due to changes in lateral length scales of core surface
flow, hence in the lateral correlation length scales of SV at the top of the core. Whether or not
this is substantiated by other epoch 2000 models with non-steady SV, different filters of
observatory data, normal weights, or different treatments of external fields remains to be seen.
A broadening in scale of core surface flow between the interval 1960-1980 and the QIrsted
epoch 2000 may explain a softer SV spectrum, though other explanations are possible. If
spectrum ( 5 ) were be shown to be wholly inadequate outside the 1960-1980 interval, yet ( l lb)
remained adequate, then arguments leading to ( l lb) might have to be revised - possibly by
including effects of Lorentz forces on eddy diffusivities. In this way it might be possible to
discern deviations from tangential geostrophy by spectral methods.
Appendix G: A Bound on Core Conductivity
Until a few years ago, observational SV spectra were not thought to be well enough
determined to high enough degrees to test spectrum ( 5 ) against seismology; it was only checked
via (lob) in the context of ( l lb) [Voorhies & Conrad, 19961. From the check of (lob), we infer
there is but a single important lateral empirical diffusivity, independent of degree n. Moreover,
from the value of a, this lateral empirical diffusivity is = c2/c(o = 147 m2/s with an uncertainty
factor or divisor of two. If this is equal to a single ensemble mean lateral eddy diffusivity UL,
then there is but one important eddy magnetic Reynolds number R , = poUL. If one assumes CJ =
5 X 1 0 5 S/m and vacuum permeability, then this magnetic Reynolds number is R, = 92 with an
uncertainty factor of two. Another interpretation, which does not assume o and allows forced
dipole decay, uses ~6 to bound core magnetic diffusivity q c ~(C/~T)~ /CQ, = 30 m2/s, and, for
vacuum permeability, core electric conductivity o 2 2.7 x lo4 S/m, both with an uncertainty
42

factor of two. This is consistent with a fluid metallic core and, in turn, provides a check on the
larger theory.
Acknowledgements: My thanks to T. Sabaka, N. Olsen, B. Langlais, R. Holme, G. Hulot, J.
Cain and J. Love for coefficients and helpful comments, and to the people of the United States of
America who supported this work via National Aeronautics and Space Administration RTOPs
579-31-07,579-31-08 and 622-72-03.
References
Backus, G. E., Kinematics of the geomagnetic secular variation in a perfectly conducting core,
Backus, G. E., Poloidal and toroidal field in geomagnetic modeling, Rev. Geophys., 24, 75-109,
Backus, G. E., Bayesian inference in geomagnetism, Geophys. J., 92, 125-142, 1988. Ball, R. H., A. B. Kahle and E. H. Vestine, Determination of the surface motion of the earth’s
core, J. Geophys. Res., 74,3659-3680,1969. Benton, E. R., Inviscid, frozen-flux velocity component at the top of Earth’s core from magnetic
observations: Part 1. A new methodology, Geophys. Astrophys. Fluid Dyn., 18, 157-174, 1981.
Benton, E. R., Hydromagnetic scale analysis at Earth’s core-mantle boundary, Geophys. Astrophys. Fluid e n . , 67,259-272, 1992
Benton, E. R., R. H. Estes, R. A. Langel, and L. A. Muth, On the sensitivity of selected geomagnetic field properties to truncation level of spherical harmonic expansions, Geophys. Res. Lett., 9, 254-257, 1982.
Benton, E. R., and C. V. Voorhies, Testing recent geomagnetic field models via magnetic flux conservation at the core-mantle boundary, Phys. Earth Planet. Inter., 48,350-357, 1987.
Benton, E. R., and L. R. Alldredge, On- the interpretation of the geomagnetic energy spectrum, Phys. Earth Planet. Inter., 48, 265-278,1987.
Booker, J. R., Geomagnetic data and core motions, Proc. Roy. SOC. London, A309, 27-40, 1969. Cain, J. C., Z. Wang, D. R. Schmitz, and J. Meyer, The geomagnetic spectrum for 1980 and core-
Chandrasekhar, S., Hydrodynamic and Hydromagnetic Stability, 652pp, Dover Pub. Inc., New
Constable, C. G., and R. L. Parker, Statistics of the geomagnetic secular variation for the past 5
De Santis, A., D. R. Barraclough, and R. Tozzi, Spatial and temporal spectra of the geomagnetic
Dobson, D. P., et al., In situ measurement of the viscosity of liquids in the Fe-FeS system at high
Phil. Trans. Roy. SOC. London, A263,239-266, 1968
1986.
crustal separation, Geophys. J., 97,443-447, 1989.
York, 1981.
M.Y., J. Geophys. Res., 93, 11,569-11,581, 1988.
field and their scaling properties, Phys. Earth Planet. Inter., 135, 125-134,2003.
pressures and temperatures, American. Mineralogist, 85, 1838-1 842, 2000.
43

Dziewonski, A. M., and D. L. Anderson, Preliminary reference Earth model, Phys. Earth Planet. Inter., 25, 297-356, 1981.
Glatzmaier, G. A., Geodynamo simulations - how realistic are they?, Ann. Rev. Earth Planet. Sci., 30,237-257,2002.
Glatzmaier, G. A., and P. H. Roberts, A three-dimensional self-consistent computer simulation of a geomagnetic field reversal, Nature, 377,203-209, 1995a.
Glatzmaier, G. A., and P. H. Roberts, A three-dimensional convective dynamo solution with rotating and finitely conducting inner core and mantle, Phys. Earth Planet. Inter., 91, 63-95, 1995b.
Gubbins, D., Can the earth’s magnetic field be sustained by core oscillations?, Geophys. Res. Lett., 2,409-412, 1975.
Gubbins, D., Geomagnetic field analysis - I. Stochastic inversion, Geophys., J. R. astr. SOC., 73,
Gubbins, D., and J. Bloxham, Geomagnetic field analysis III, magnetic field on the core-mantle
Gubbins, D., and P. H. Roberts, Magnetohydrodynamics of the Earth’s Core, in Geomagnetism,
Harrison, C. G. A. An alternative picture of the geomagnetic field, J. Geomagn. Geoelectr., 46,
Hide, R., and K. Stewartson, Hydromagnetic oscillations of Earth’s core, Rev. Geophys. Space
Hide, R., and S. R. C. Malin, On the determination of the size of Earth’s core from observations
Hulot, G., and J.-L. LeMouel, A statistical approach to the earth’s main magnetic field, Geophys.
Jackson, J. D., Classical Electrodynamics, 848 pp., John Wiley & Sons, New York, 1975. Kennett, B.L.N., E. R. Engdahl, and R. Bulland, Constraints on seismic velocities in the earth
Krause, F., and K.-H. Radler, Mean-Field Magnetohydrodynamics and Dynamo Theory, 27 1 pp.,
Langel, R. A., The Main Field, in Geomagnetism, vol. l., edited by J.A. Jacobs, 627 pp.,
Langel, R. A., and R. H. Estes, A geomagnetic field spectrum, Geophys. Res. Lett., 9, 250-253,
Langel, R. A., R. H. Estes, and G. D. Mead, Some new methods in geomagnetic field modeling
LeMouel, J.-L., Outer core geostrophic flow and secular variation of Earth’s magnetic field,
Lowes, F. J., Mean square values on the sphere of spherical harmonic vector fields, J. Geophys.
Lowes, F. J., Spatial power spectrum of the main geomagnetic field and extrapolation to the core,
Lucke, O., Uber Mttelwerte von Energiedichten der Kraftfelder, Wiss. Zeit. Ptid. Hochschule
Lumb, I., and K. D. Aldridge, On viscosity estimates for the earth’s fluid outer core and core-
641-652, 1983.
boundary, Geophys. J. R. astr., SOC., 80, 696-713, 1985.
vol. 2, edited by J. A. Jacobs, 579 pp., Academic, Orlando, Florida, 1987.
127-142, 1994.
Phys., IO, 579-598, 1972.
of the geomagnetic secular variation, Proc. Roy. SOC. London, A374, 15-33, 1981.
J. Int., 108, 224-246, 1992.
from travel times, Geophys. J. Int., 122, 108-124, 1995.
Pergamon, New York, 1980.
Academic, Orlando, Florida, 1987.
1982.
applied to the 1960-1980 epoch, J. Geomagn. Geoelectr., 34, 327-349, 1982.
Nature, 311,734-735, 1984.
Res., 71,2179, 1966.
Geophys, J. Roy. astr. SOC., 36, 717-730, 1974.
Potsdam, Math. -Naturw. Reihe, 3, 39-46, 1957.
mantle coupling, J. Geomagn. Geoelectr., 43, 93-1 10, 1991.
44
Mauersberger, P., 1956, Das Mittel der Energiedxhte des geomagnetischen Hauptfeldes and der Erdoberflache und seine sakulare Anderung, Gerlands Beitr. Geophys., 65, 207-215, 1956.
McDonald, K. L., Penetration of the geomagnetic secular variation through a mantle with variable conductivity, J. Geophys. Res., 62, 117-141, 1957.
McLeod, M. G., and P. J. Coleman, Spatial power spectra of the crustal geomagnetic field and the core geomagnetic field, Phys. Earth Planet. Inter., 23, 5-19, 1980.
McLeod, M. G., Statistical theory of the geomagnetic field and its secular variation, Eos Trans. AGU, 66(46), 878, 1985.
McLeod, M.G., Spatial and temporal power spectra of the geomagnetic field, J. Geophys. Res.,
Meyer, J., Secular variation of magnetic mean energy density at the source-layer depth, Phys.
Moffat, H. K., Magnetic Field Generation in Electrically Conducting Fluids, 343 pp, Cambridge
Olsen, N., A model of the geomagnetic field and its secular variation for epoch 2000 estimated
Olsen, N., et al., QIrsted Initial Field Model, Geophys. Res. Lett., 27, 3607-3610, 2000. Poirier, J. P., Transport properties of liquid metals and the viscosity of Earth's core, Geophys. J.,
Pouquet A., U. Frisch and J. Leorat, Strong MHD helical turbulence and the nonlinear dynamo
Roberts, P. H., and S . Scott, On analysis of secular variation 1. A hydromagnetic constraint, J.
Roberts, P. H. and D. Gubbins, Origin of the Main Field: Kinematics, in Geomagnetism, vol. 2,
Roberts, P. H., and G. A. Glatzmaier, A test of the frozen-flux approximation using a new
Sabaka, T. J., N. Olsen, and R. A. Langel, A comprehensive model of the quiet time, near-Earth
Shure, L., R. L. Parker, and G. E. Backus, Harmonic splines for geomagnetic modeling, Phys.
Stevenson D.J., Planetary magnetic fields, Rep. Prog. Phys., 46,555-620, 1983. Tennekes, H., and J. L. Lumley, A First Course in Turbulence, 300 pp. MXT Press, Cambridge,
Verosub, K. L., and A. Cox, Changes in the total geomagnetic energy external to Earth's core, J Geomagn. Geoelectr., 23, 235-242, 1971.
Voorhies, C. V., Magnetic Location of Earth's Core-Mantle Boundary and Estimates of the Adjacent Fluid Motion, Ph.D. thesis, 348 pp., University of Colorado, Boulder, 1984.
Voorhies, C. V., Steady flows at the top of Earth's core derived from geomagnetic field models, J. Geophys. Res., 91, 12,444-12,466, 1986.
Voorhies, C. V., Coupling an inviscid core to an electrically insulating mantle, J. Geomagn. Geoelectr., 43, 131-156, 1991.
Voorhies, C. V., Geomagnetic estimates of steady surficial core flow and flux diffusion: unexpected geodynamo experiments, in Dynamics of Earth's Deep Interior and Earth Rotation, Geophys. Monogr. Ser., 72, edited by J.-L. LeMouel, D. E. Smylie, and T. Herring, pp. 113- 125, AGU, Washington, D. C., 1993.
101,2745-2763, 1996.
Earth Planet. Inter., 39, 288-292, 1985.
Univ. Press, 1978,
from CZIrsted data, Geophys. J, Int., 149,454-462, 2002.
92, 99-105,1988.
effect, J. Fluid Mech., 77, 321-354, 1976.
Geomagn. Geoelectr., 17, 137-151, 1965.
edited by J. A. Jacobs, 579 pp., Academic, Orlando, Florida, 1987.
geodynamo model, Phil. Trans. R. SOC. London, A358, 1109-1121,2000.
magnetic field: phase 3, Geophys. J. Int., 151,32-68,2002.
Earth Planet. Inter., 28, 215-229, 1982.
1972.
45

Voorhies, C. V., Time-varying fluid flow at the top of Earth’s core derived from Definitive Geomagnetic Reference Field models, J. Geophys. Res., 100, 10,029-10,039, 1995.
Voorhies, C., Elementary Theoretical Forms for the Spatial Power Spectrum of Earth’s Crustal Magnetic Field, NASA Tech. Paper 1998-208608,38 pp, Dec. 1998.
Voorhies, C.V., Inner core rotation form geomagnetic westwards drift and a stationary spherical vortex in Earth’s core, Phys. Earth Planet. Inter., 112, 111-123, 1999.
Voorhies, C. V., and E. R. Benton, Pole strength of the earth from Magsat and magnetic determination of the core radius, Geophys. Res. Lett., 9, 258-261, 1982.
Voorhles, C. V., and J. Conrad, Accurate Predictions of Mean Geomagnetic Dipole Excursion and Reversal Frequencies, Mean Paleomagnetic Field Intensity, and the Radius of Earth’s Core Using McLeod’s Rule, NASA Tech. Memo. 104634,35 pp, April 1996.
Voorhies, C. V., T. J. Sabaka, and M. Purucker, On magnetic spectra of Earth and Mars, J. Geophys. Res., 10.1029/2001/JE001534,04 June 2002.
Walker, A. D., and G. E. Backus, A six parameter statistical model of the Earth’s magnetic field, Geophys. J. Int., 130, 693-700, 1997.
Whaler, K. A., and D. Gubbins, Spherical harmonic analysis of the geomagnetic field: an example of a linear inverse problem, Geophys. J. R. astr. Soc., 65, 645-693, 1981.
46
~ ~

Table 1. Core ra&us estimated by fitting log-theoretical SV spectrwn (5) to log-observational spectrum GSFC 9/80 for various epochs and degree ranges.
1980 1-13 3441+96 3-11 34292135 3-10 3280+ 127 1975 1-13 3472295 3-11 35392106 3-10 3396+ 79 1970 1-13 3475299 3-11 35402115 3-10 33872 89 1965 1-13 3490297 3-11 3547+115 3-10 33972 90 1960 1-13 3488287 3-11 3484+ 99 3-10 33342 55
Avg. 1-13 3470291 3-11 3511+101 3-10 33602 61
Table 2a: Core radius and scaled uncertainty from equation (5) and the time-averaged observational SV spectrum GSFC 9/80.
Degrees 42 C- Error Fitted lull km
1-6 1-7 1-8 1-9 1-10 1-1 1 1-12
1-13
0.23 16 0.1868 0.1982 0.1938 0.17 10 0.3591 0.4138
0.5041
3026 2 174 - 454 3045 124 - 435 3130 2 108 - 350 31842 90 -296 31962 73 -284 33182 95 - 162 33912 91 - 89
3470+ 91 - 10
Table 2b: As Table 2a, but nhn = 3.
Degrees q2 C* Error Fitted km km
3 -6 3-7 3-8 3-9 3-10 3-1 1 3-12
3-13
0.0921 0.0833 0.0709 0.0579 0.0551 0.2005 0.2168
0.2612
34522234 - 28 3315 & 151 - 165 3378 2 108 - 102 33982 77 - 82 33602 61 - 120 3511+101 + 31 35792 92 + 99
3658+ 89 +178
47

Table 3a: Core radius and scaled uncertainty from equation (7) and the time-averaged observational SV spectrum GSFC 9/80.
Degrees q2 CoreRadius Error Fitted km km
1-6 0.2040 34882188 + 8
1-8 0.1526 35192106 + 39 1-9 0.1359 35472 84 + 67
1-11 0.2466 36422 86 + 162 1-12 0.2701 3701+ 80 +221
1-13 0.3223 37672 79 +287
1-7 0.1652 34622133 - 18
1-10 0.1210 35322 68 + 52
Table 3b: As Table 3a, but nfin = 3.
Degrees q2 CoreRadius Error Fitted km km
3-6 3-7 3-8 3-9 3-10 3-1 1 3-12 3-13
0.079 1 0.0846 0.0668 0.0534 0.059 1 0.1743 0.1788 0.2070
3826 2240 + 346 36442168 + 164 3688 2 114 + 208 36872 81 +207 36282 68 +148 3774 2 102 + 294 38322 89 +352 39022 85 +422
Table 4a: Core radius and scaled uncertainty from equation (5) and the time-averaged constrained SV spectrum CM3.
Degrees q2 CoreRadius Error Fitted km km
1-6 0.2305 29942172 -486 1-7 0.1950 30452127 -435 1-8 0.2017 31272108 -353 1-9 0.2064 31922 94 -288 1-10 0.1848 32112 78 -269 1-11 0.1778 32422 65 -238 1-12 0.1836 32792 59 -201
1-13 0.3096 32002 66 -280
48

Table 4b: As Table 4a, but nmin = 3.
Degrees q2 CoreRadius Error Fitted km km
3-6 0.0743 3-7 0.0546 3-8 0.0458 3-9 0.0401 3-10 0.0373 3-11 0.0321 3-12 0.0322
3-13 0.2786
34082208 - 72 33422 124 - 138 33902 87 - 90 34232 65 - 57 33942 51 - 86 34002 39 - 80 3420+ 34 - 60
32825 83 - 198
Table 5a: Core radius and scaled uncertainty from equation (7) and the time-averaged constrained SV spectrum CM3.
Degrees q2 CoreRadius Error Fitted km km
1-6 1-7 1-8 1-9 1-10 1-11 1-12
1-13
0.2076 0.1664 0.1517 0.1400 0.1228 0.1103 0.1045
0.3050
34522 188 - 28 3462+ 133 - 18 35165106 + 36 35552 86 + 75 35492 69 + 69 3559+ 56 + 79 35782 48 + 98
34742 71 - 6
Table 5b: As Table 5a, but nmin = 3.
Degrees q2 CoreRadius Error Fitted km km
3-6 3-7 3-8 3-9 3-10 3-1 1 3-12
3-13
0.0615 0.05 14 0.0398 0.0323 0.0371 0.0324 0.0289
0.3198
3777 & 209 + 297 3673 & 132 + 193 37012 88 +221 3714+ 63 +234 3665+ 54 + 185 3654& 42 + 174 36622 34 + 182
35022 94 + 22
49

Table 6: Core radius and scaled uncertainty from equation (1 lb) and observational main field spectrum OIFM
Degrees s2 Fitted
1-4 0.5588 1-5 0.3730 1-6 0.2803 1-7 0.2326 1-8 0.2021 1-9 0.2054 1-10 0.1797 1-11 0.1602 1-12 0.1539
Core Radius
3441 & 575 3461 2334 3444 2 218 3496 5 159 3454 2 120 3524 103 35222 82 3516+ 67 35422 58
km Error km
- 39 - 19 - 36 + 16 - 26 + 4 4 + 42 + 36 + 61
1-13 0.1826 35892 57 +lo9 1-14 0.1782 36105 51 +130 1-15 0.3056 36812 61 +201 1-16 0.4436 37515 68 +271 1-17 0.8074 3853+ 86 +373 1-18 1.2241 3958+ 99 +478
Table 7: Core radius and scaled uncertainty from equation (1 lb) and observational main field spectrum CM3.
Degrees s2 Fitted
1-4 0.7210 1-5 0.4817 1-6 0.3613
1-8 0.2773
1-10 0.2466
1-7 0.2900
1-9 0.2810
1-11 0.2194 1-12 0.1975
1-13 0.1996 1-14 0.1956 1-15 0.2546 1-16 0.4281 1-17 0.6684 1-18 0.9795
Core Radius km
3467 5 658 3498 5 384 3503 5252 3520 5 179 3432 5 140 3513 2 120 35042 96 35082 78 3507+ 65
3.5622 52 36125 54 3687+ 65 3770k 76 3859-t. 87
3539+ 59
Error km
- 13 + 18 + 23 + 40 - 48 + 33 + 24 + 28 + 27
+ 59 + 82 +132 +207 +290 +379
50

Table 8: As Table 7, but with nmin = 3.
Degrees s2 CoreRadius Error Fitted km km
3-6 0.0175 34525102 - 28 3-7 0.0126 34825 62 + 2
3-9 0.1144 3484+lll + 4
3-11 0.0828 3486+ 65 + 6 3-12 0.0725 3487+ 52 + 7
3-8 0.0521 3336+ 91 -144
3-10 0.0958 34762 83 - 4
Table F1 a: Core radius and scaled uncertainty estimate from equation (7) and observational SV spectrum OSVM.
Degrees q2 CoreRadius Error Fitted km km
1-6 0.0731 34585112 - 22 1-7 0.0617 3426+ 80 - 54 1-8 0.0665 34835 69 + 3 1-9 0.0765 35385 63 + 57
1-11 0.0763 3548+ 47 + 68 1-12 0.2162 3648t 71 +168 1-13 0.4410 37662 93 +286
1-10 0.0778 3573+ 55 + 93
Table Flb: As Table Fla, but n- = 3.
Degrees q2 CoreRadius Error Fitted km km
3-6 0.0561 34605 183 - 20 3-7 0.0404 3408+108 - 72 3-8 0.0530 3.5162 97 + 36 3-9 0.0620 3598+ 87 +118 3-10 0.0586 3638+ 68 +158 3-11 0.0664 3587+ 60 +lo7
3-12 0.2116 37235 94 +243 3-13 0.4230 38752 33 +395
51