geology and geothermal system in rajabasa volcano south
TRANSCRIPT
Proceedings World Geothermal Congress 2015
Melbourne, Australia, 19-25 April 2015
1
Geology and Geothermal System in Rajabasa Volcano South Lampung Regency, Indonesia
(Approach to Field Observations, Water Geochemistry and Magnetic Methods)
I Gede Boy Darmawan, Lucas Donny Setijadji, Djoko Wintolo
Department of Geological Engineering, Gadjah Mada University, Grafika Street No. 2 Yogyakarta, Indonesia
Keywords: Rajabasa volcano, geothermal, water geochemistry, reservoir, magnetic methods
ABSTRACT
The existence of geothermal manifestations in Rajabasa Volcano indicate the potential of geothermal energy in this area. Some
geothermal manifestations are found in the north and south foothills of Rajabasa, such as hot springs and fumaroles. This research
conducted to determine the geology and geothermal system in Rajabasa volcano based on interpretation of geological field
observations, water geochemistry and magnetic methods. Geological observations conducted to determine the geological and
structural conditions that affect the existence of geothermal manifestations in Rajabasa volcano. The result of petrographic analysis
of fresh rock samples show that Rajabasa Volcano dominated by andesitic lava with the main composition of plagioclase and
clinopyroxene. While the XRD analysis of altered rock samples show the existence of minerals such as crystobalite, alunite,
smectite, kaolinite, albite, zeolite and chloride. Water sampling conducted in the area of geothermal manifestations such as Way
Belerang, Way Merak, Kecapi Simpur, Rajabasa and Mount Botak. Surface temperature are varied, Rajabasa hot spring around
30°C, Kecapi Simpur hot spring around 56°C, Way Belerang and Way Merak around 90°-95°C, while in Mount Botak around
102°-105°C. Water type analysis show the Kecapi Simpur dan Rajabasa hot spring manifestation is chloride-sulphate, Sulphate
water for Way Belerang and Chloride water for Mount Botak manifestation. Three dimentional modeling of magnetic data has
resulting an areas that have very low magnetic susceptibility start at a depth of 1000 m. This result was also confirmed by the
results of water chemical analysis with geothermometer method that estimates of reservoir temperatures around 216-220°C and
statistical reservoir temperature methods of geothermal drilling in several locations in Indonesia were estimated reservoir depth of
about 1000 m.
1. INTRODUCTION
Sumatra lies along the southwestern edge of Southeast Asia (Sundaland) are experiencing subduction by the Indian Ocean Plate on
the Sunda Trench. The edge of Southeast Asia Continent is Andes type, with Quaternary volcanic exposed to the west coast of
Sumatra island in Bukit Barisan Mountains (Barber et al., 2005). Pressure caused by the subduction, has periodically released
through the faults which parallel to the edge of the plate (Mangga et al, 1993). Subduction is marked by a row of volcanoes,
including Rajabasa Volcano is located at the southern tip of Sumatra Island, precisely in Kalianda, South Lampung regency.
Rajabasa mountains formed by volcanic cone reconstruction of pre-Rajabasa (Bronto et al, 2012). Some geothermal manifestations
are found in the foothills of the north and south, such as hot springs and fumarole. The existence of geothermal manifestations in
Rajabasa Volcano indicate a potential for geothermal energy in this area. Therefore, it necessary to do research about geological
and geothermal conditions in this area.
Several research has been done in Rajabasa Volcano related to exploration of geothermal resources. Geophysical research using
magnetic method has began by Geological Agency of Indonesia in 1991 in term of preliminary study for geothermal prospecting in
Rajabasa Volcano (Haerudin, 2012). Magnetic method are able to measure magnetic field variations in the earth’s surface due to
the Earth's magnetic field and rocks in the earth's crust induced. Magnetic response of the rocks and minerals are determined by the
number and magnitude of the magnetic susceptibility of each rock and mineral (Telford et al., 1990). Area of low magnetic
anomalies could be interpreted as a geothermal prospect area. Magnetic response which low compared to the surrounding area
indicate demagnetization that occur due to the fluid and rock interactions in hydrothermal processes (Yorinaldi et al, 2000).
This study conducted to analyze the geology and geothermal system in Rajabasa Volcano based on field observation, water
geochemistry and magnetic method. For this purpose, some of fresh and altered rock sample was taken from the field and
petrographic analyzed to classified type of rock, and it was also XRD analyzed to obtain alteration mineral of geothermal
manifestation in Rajabasa Volcano. The water geochemistry data obtained from previous study conducted by Kusumasari (2012)
who conduct chemical tests on the water type of manifestations. There are four water sample was taken from Way Belerang, Botak,
Kecapi Simpur and Rajabasa hot springs to analyze water type, geothermometer and stable isotop.
2. REGIONAL GEOLOGY
The area of this study is located in the Rajabasa volcano, South Lampung Regency, Lampung Province in the southern tip of
Sumatra island. Rajabasa volcano located in the northeast from mount Krakatau (Krakatoa). Based on the regional geology map
(Mangga et al, 1993), Rajabasa volcano located in young volcanic rock formation composed by andesite-basalt lava, breccias and
tuff. Lampung tuff and tertiary andesite formation in the southeast Rajabasa volcano (Figure 1). The Andesite Unit is composed of
andesitic lava as the product of Tertiary volcanism spreading out in the western to the southeastern parts of Rajabasa Volcano.
Based on the lava flow characteristics occurring on the current active volcano, this Andesite Unit are predicted to be developed not
far from the eruption source (Bronto et al, 2012). There is no eruption history was recorded in Rajabasa volcano, but Van Padang
(1951) in (Budiarjo et al, 1995) said in 1863 and 1892 there was an increase volcanic activity but it has not happened eruption.
Darmawan et al.
2
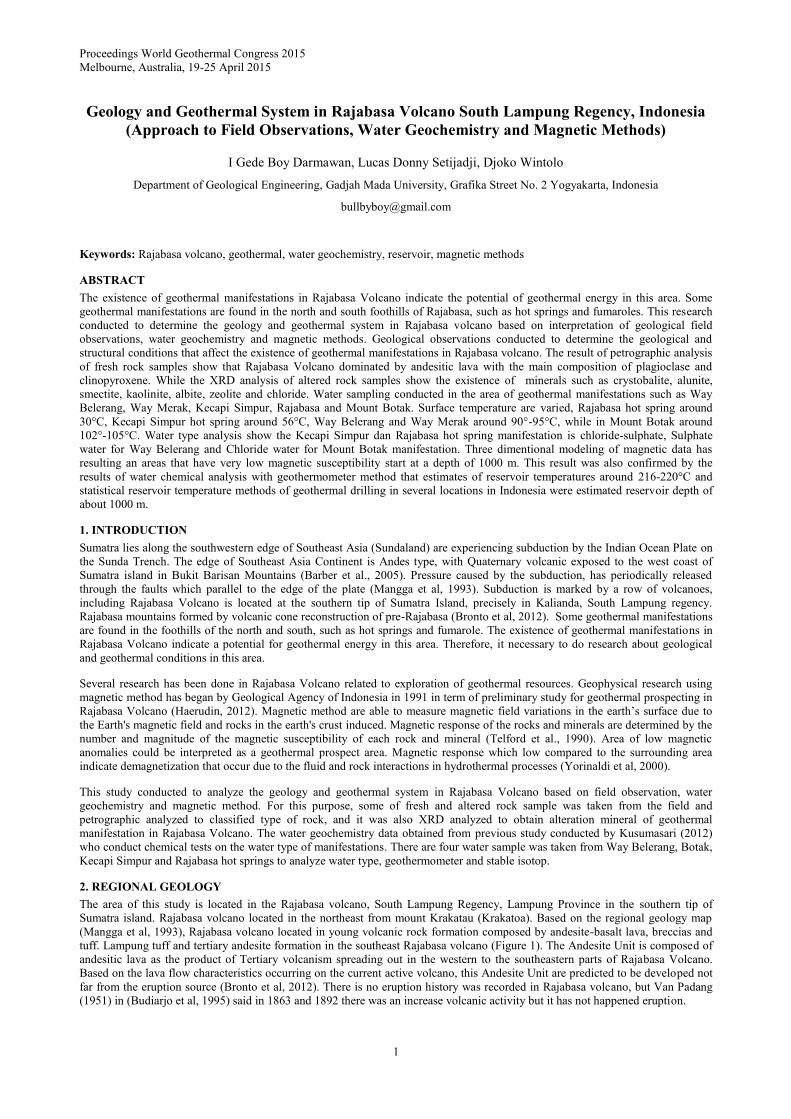
Figure 1: Regional Geological Map of Rajabasa shows the rock formations in the study area are in the red box located on
Quaternary volcanic rocks consisting of andesite (Modified from Mangga et al, 1993).
Quaternary volcanoes along the Sunda and Banda arc of Indonesia is a famous example of subduction-related volcanism. Sunda
Strait marks the transition from the front to the oblique subduction, and interpreted as resulting from the expansion of the area
northwest of the motion arc incision lies between the trench and the Sumatran Fault System (Barber et al., 2005). This area is very
complex tectonics and topography, and according to Ninkovich (1976) in Barber et al. (2005) the opening of the strait is the result
of a clockwise rotation of Sumatra around 20° around the axis which lies near the Sunda Strait since the Late Miocene.
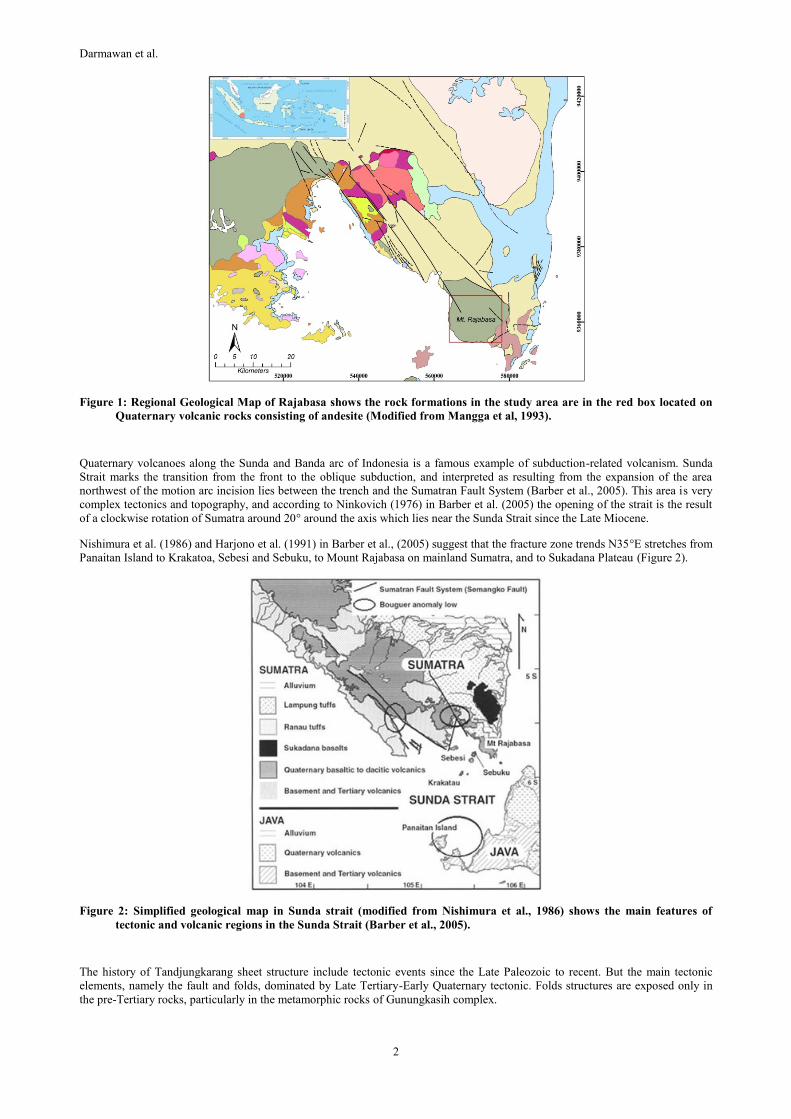
Nishimura et al. (1986) and Harjono et al. (1991) in Barber et al., (2005) suggest that the fracture zone trends N35°E stretches from
Panaitan Island to Krakatoa, Sebesi and Sebuku, to Mount Rajabasa on mainland Sumatra, and to Sukadana Plateau (Figure 2).
Figure 2: Simplified geological map in Sunda strait (modified from Nishimura et al., 1986) shows the main features of
tectonic and volcanic regions in the Sunda Strait (Barber et al., 2005).
The history of Tandjungkarang sheet structure include tectonic events since the Late Paleozoic to recent. But the main tectonic
elements, namely the fault and folds, dominated by Late Tertiary-Early Quaternary tectonic. Folds structures are exposed only in
the pre-Tertiary rocks, particularly in the metamorphic rocks of Gunungkasih complex.
Darmawan et al.
3
3. MATERIAL AND METHOD
The primary data used in this study is the result of field observations and taking some fresh and altered rock samples. The samples
were analyzed using petrographic and XRD to get the distribution of rocks and alteration at Mount Rajabasa. Secondary data in the
form of water geochemistry and magnetic data are used to analyze the geothermal system in the study area.
3.1 Field Observation
The field work was carried out to collect primary data include geological mapping and sample collection. At this stage, the
geological observations in certain areas with the target to confirm the geological conditions in the study area is mainly the type and
distribution of rock. Sampling aimed to obtain better results (a representative sample). Sampling is not conducted under the surface
or drilling, but performed only on the surface by taking samples of rock that is still fresh and altered. The results of petrographic
analysis of fresh rock samples indicates that there are two types of andesitic rocks in the study area is andesite pyroxene and
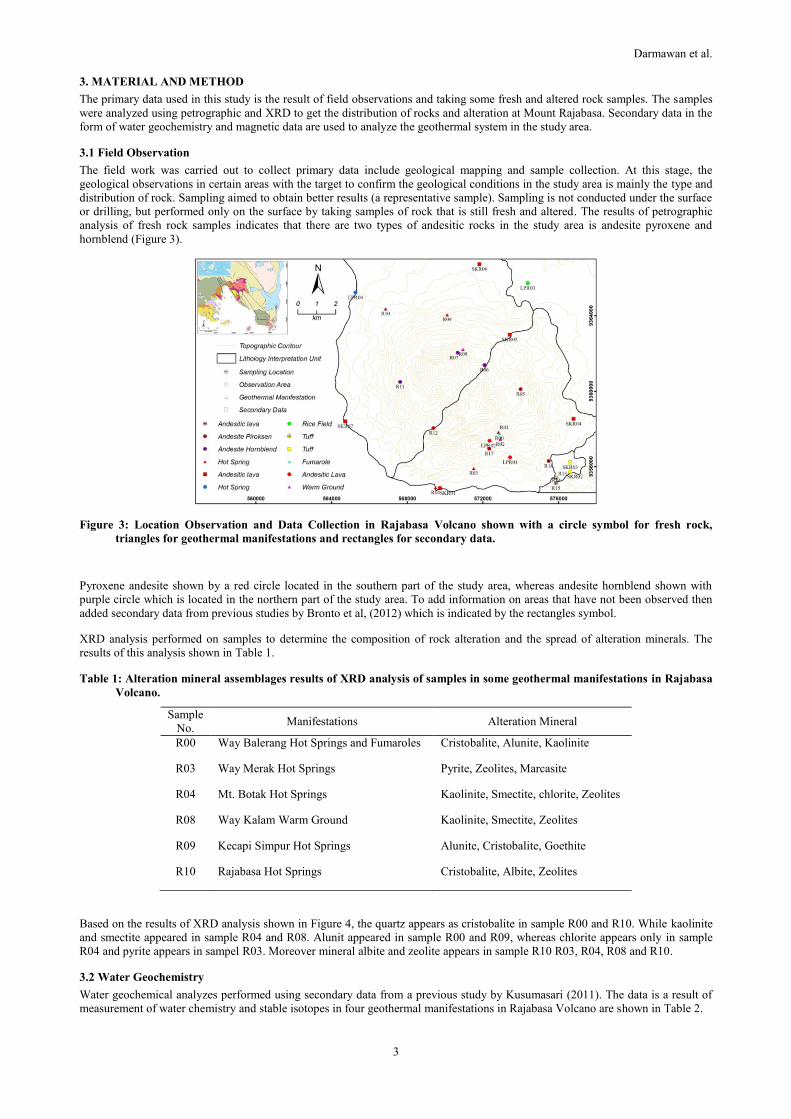
hornblend (Figure 3).
Figure 3: Location Observation and Data Collection in Rajabasa Volcano shown with a circle symbol for fresh rock,
triangles for geothermal manifestations and rectangles for secondary data.
Pyroxene andesite shown by a red circle located in the southern part of the study area, whereas andesite hornblend shown with
purple circle which is located in the northern part of the study area. To add information on areas that have not been observed then
added secondary data from previous studies by Bronto et al, (2012) which is indicated by the rectangles symbol.
XRD analysis performed on samples to determine the composition of rock alteration and the spread of alteration minerals. The
results of this analysis shown in Table 1.
Table 1: Alteration mineral assemblages results of XRD analysis of samples in some geothermal manifestations in Rajabasa
Volcano.
Sample
No. Manifestations Alteration Mineral
R00
R03
R04
R08
R09
R10
Way Balerang Hot Springs and Fumaroles
Way Merak Hot Springs
Mt. Botak Hot Springs
Way Kalam Warm Ground
Kecapi Simpur Hot Springs
Rajabasa Hot Springs
Cristobalite, Alunite, Kaolinite
Pyrite, Zeolites, Marcasite
Kaolinite, Smectite, chlorite, Zeolites
Kaolinite, Smectite, Zeolites
Alunite, Cristobalite, Goethite
Cristobalite, Albite, Zeolites
Based on the results of XRD analysis shown in Figure 4, the quartz appears as cristobalite in sample R00 and R10. While kaolinite
and smectite appeared in sample R04 and R08. Alunit appeared in sample R00 and R09, whereas chlorite appears only in sample
R04 and pyrite appears in sampel R03. Moreover mineral albite and zeolite appears in sample R10 R03, R04, R08 and R10.
3.2 Water Geochemistry
Water geochemical analyzes performed using secondary data from a previous study by Kusumasari (2011). The data is a result of
measurement of water chemistry and stable isotopes in four geothermal manifestations in Rajabasa Volcano are shown in Table 2.
Darmawan et al.
4
Table 2: Measurement data of water chemistry and stable isotopes in geothermal manifestations Rajabasa Volcano
(Kusumasari, 2011).
Sample
(mg/kg)
Way Belerang
(R00)
Mt. Botak (R04) Kecapi Simpur
(R09)
Rajabasa (R10)
Li+
Na+
K+
Ca2+
Mg2+
SiO2
B
Cl-
SO42-
HCO3-
CO2
NH3
pH
Cation
Anion
Ion (%)
δD (‰)
δ18O (‰)
0,3
95,4
18,91
141,2
54,3
360,21
3,86
223,7
2643,68
0
2514,07
66,67
2,35
9,95
61,39
57,63
-5,70 ± 0,70
-0,79 ± 0,09
2,24
4948
402,43
401,7
267
123,93
7,34
7986,58
795,06
66,96
-
12
6,59
267,85
242,76
4,91
-27,6 ± 0,6
-4,660 ± 0,31
0
63
23,93
97
13,7
104,43
0,69
82,67
365,52
0
139,67
13,13
2,91
9,32
9,95
3,26
-42,8 ± 0,4
-6,880 ± 0,22
0
14,85
15,15
24,73
4,86
102,5
1,07
50,1
88,51
13,82
-
13,33
4,66
2,67
3,44
12,71
-42,8 ± 1,7
-6,770 ± 0,23
Measurement data of water chemistry and stable isotopes are shown in Table 2 were used to analyze the type and source of water,
geotermometer to measure the temperature of the reservoir which is then used to estimate the depth of the geothermal reservoir in
Rajabasa Volcano.
3.3 Magnetic Method
Magnetic fields Anomalies generated by magnetic objects that have been induced by the Earth's magnetic field, so as the object has
its own magnetic field and influence the magnitude of the total magnetic field measurements. Anomalous object is usually derived
from rocks that have a considerable susceptibility. In magnetic surveys, magnetic field measured is the total magnetic field consists
of the Earth's main magnetic field, the external magnetic field and the magnetic field anomalies (Telford et al., 1990).
In this stage, the interpretation of the magnetic data through several treatment processes which include: IGRF Correction, At this
stage, IGRF correction to get the value of the total magnetic field Anomalies from magnetic data. This correction is done separately
from the two magnetic data because of differences in the acquisition of the IGRF 1990 for data years 1991 and IGRF 2010 for the
data in 2011, so that the data will be combined. Diurnal correction was not carried out because the data used has been diurnal
corrected. Reduction to the pole process carried out by reducing the magnetic data to the pole with the angle of inclination 90° and
declination 0°. It is conducted in order to causes target anomalies just below anomalies.
Separation of local and regional anomalies carried out to get local anomalies that are not influenced by regional anomalies with
Butterworth filter method. This filter is preferably used in the present study rather than the band-pass or high-low pass filters to
Overcome the ringing effects (Pawlowski and Hansen, 1990 in Ibrahim et al, 2012). Upward continuation process conducted to
reduce the effects of shallow so that the appearance of anomalies more obvious and easier for interpretation.
4. RESULT AND DISCUSSION
Integration between ASTER and DEM image interpretation has been done in previous studies and regional geological maps
produced 5 (five) groups of rocks that are interpreted as a lithological unit. This unit was later confirmed by microscopic
observation and megaskopis of several samples taken in the field observations to determine the physical appearance of the rock.
Naming of igneous rocks microscopically determined based on the classification of igneous rocks microscopically by Williams et
al, (1982).
4.1 Geological Setting of Rajabasa Volcano
Based on the results of geological interpretation that have been conducted, obtained Geology Map of Rajabasa Volcano which is
the result of interpretation and field observations as well as some secondary data were confirmed by thin section analysis on some
rock samples. The map as results of interpretation is shown in Figure 5. Ages used a relative age based on Geological Map Sheet
Tandjungkarang by Mangga et al, (1993).
In the study area, the eruption center are Mount Rajabasa and Mount Balerang. The naming of eruption center as the source of
volcanic material carried by geographically arranged relative of the older to the younger age. Absolute age of any rock units can not
be determined because no age data obtained. Thus, the age of each unit are relative age of rocks based on erosion rates, topographic
height, products spreading and equalization with Regional Geology Map by Mangga et al, (1993).
Based on Figure 4, the oldest rock units are Tangkil Andesite Unit located in the southeastern part. The unit overlain by tuffs of
Way Andeng pyroclastic rocks unit. Balerang Andesite Lava unit that was in the middle to eastern and southern areas of research
rest on tuffs of Way Andeng pyroclastic rocks unit and Young Rajabasa Andesite that located in the northeastern part of the study
area. While the youngest unit is Rajabasa Andesite Lava unit which occupies the center to the north and west of the study area.

Darmawan et al.
5
Figure 4: Geological map interpretation of Rajabasa Volcano were confirmed by thin section analysis on some rock samples
which indicates the presence of five lithological units.
Geological structures that appear in a field that is joints on Mt Botak hot springs manifestation trending Northeast-Southwest and
Northwest-Southeast. Joint direction of Northeast-Southwest (NE-SW) appears quite clearly in the hot springs manifestation of Mt
Botak. Hot springs manifestations in the area is right in this joint. Besides joint with Northeast-Southwest direction there are joint
with the Northwest-Southeast (NW-SE). Northwest-Southeast joint direction (NW-SE) also seems quite clear and the hot springs
manifestation is precise in the structure. Structure with a Northwest-Southeast direction appears truncated by structures trending
Northeast-Southwest. This suggests that structure the Northwest-Southeast direction are formed early.
Figure 5: Joint with Northwest-Southeast trending (NW-SE) and Northeast-Southwest (NE-SW) that appears in Mt Botak
hot springs manifestation.
The existence of structure with the direction Northeast-Southwest (NE-SW) and Northwest-Southeast (NW-SE) provides a clue as
to the source of hot water at Mount Botak. These instructions will be useful when analyzing the relationship between the surface
manifestations of geothermal reservoir location. Are manifestation on Mt Botak derived from the same reservoir with other
manifestations or not. This analysis will be discussed after knowing the location of the reservoir based on magnetic data modeling
and geochemical analysis of water in geothermal manifestations.
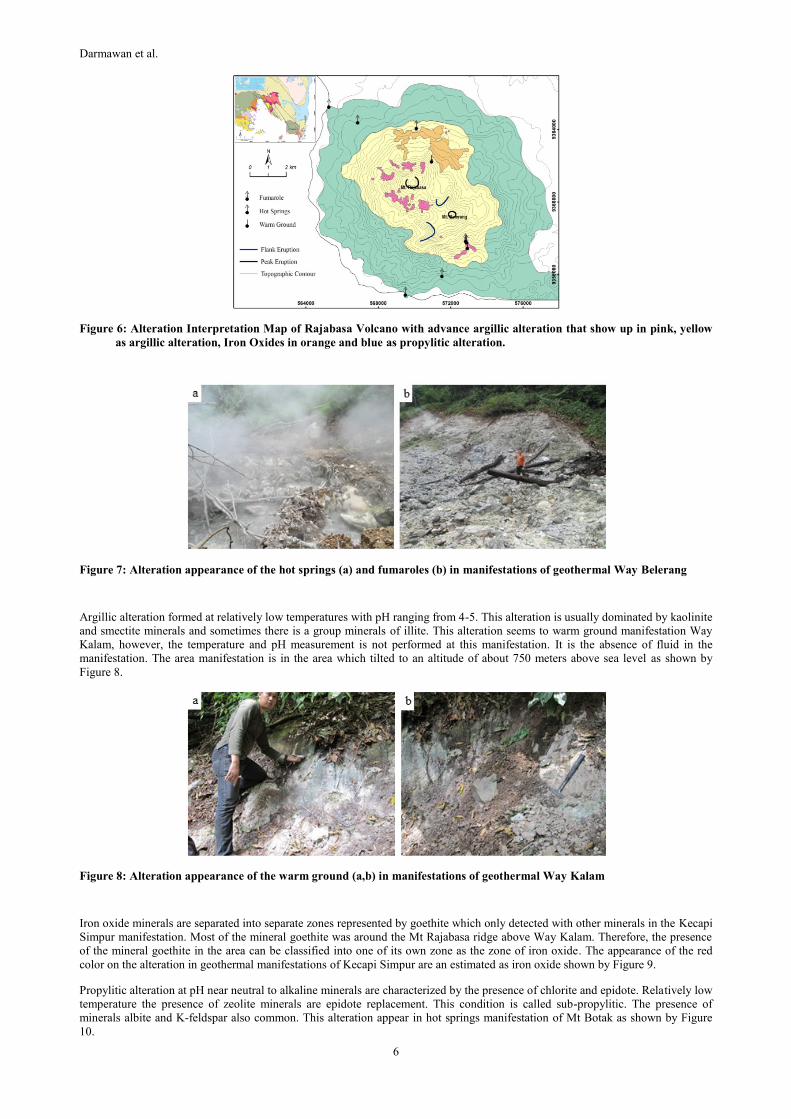
4.2 Alteration
Alteration minerals from XRD analysis results were then grouped based on the classification of mineral alteration according to
Corbett and Leach, (1997). Base on it classification derived alteration minerals groups such as alunite group consisting of mineral
alunit, kaolinite and quartz. Kaolinite group consisting of mineral kaolinite, smectite and quartz. While Illit group consisting of
quartz and smectite minerals, Iron Oxide Group consists of the mineral goethite. Chlorite group of minerals composed of chlorite,
smectite and quartz, while the Kalk-Silica group consisting of quartz, smectite, goethite, zeolite and albite. Areas that show a
combination of group minerals are then grouped and color-coded according to the group as shown by Figure 6.
The alteration zone is confirmed from several field observations in Rajabasa Volcano. Advanced argillic alteration formed at a pH
of less than four (<4) and are usually composed of a group minerals such as Alunite, kaolinite and quartz. This alteration zone is
quite evident in the geothermal manifestations in the Way Balerang and Kecapi Simpur as shown by Figure 7. The results of
temperature measurements in the Way Belerang manifestations indicate surface water temperatures between 90°-95° C and pH
about 2. Color of alteration which dominated by white color is characteristic of the presence of the mineral alunite in the area of
manifestation. The results of measurements of surface temperatures in the Kecapi Simpur shows the temperature between 55°-60°
C and pH about 2.9.
Darmawan et al.
6
Figure 6: Alteration Interpretation Map of Rajabasa Volcano with advance argillic alteration that show up in pink, yellow
as argillic alteration, Iron Oxides in orange and blue as propylitic alteration.
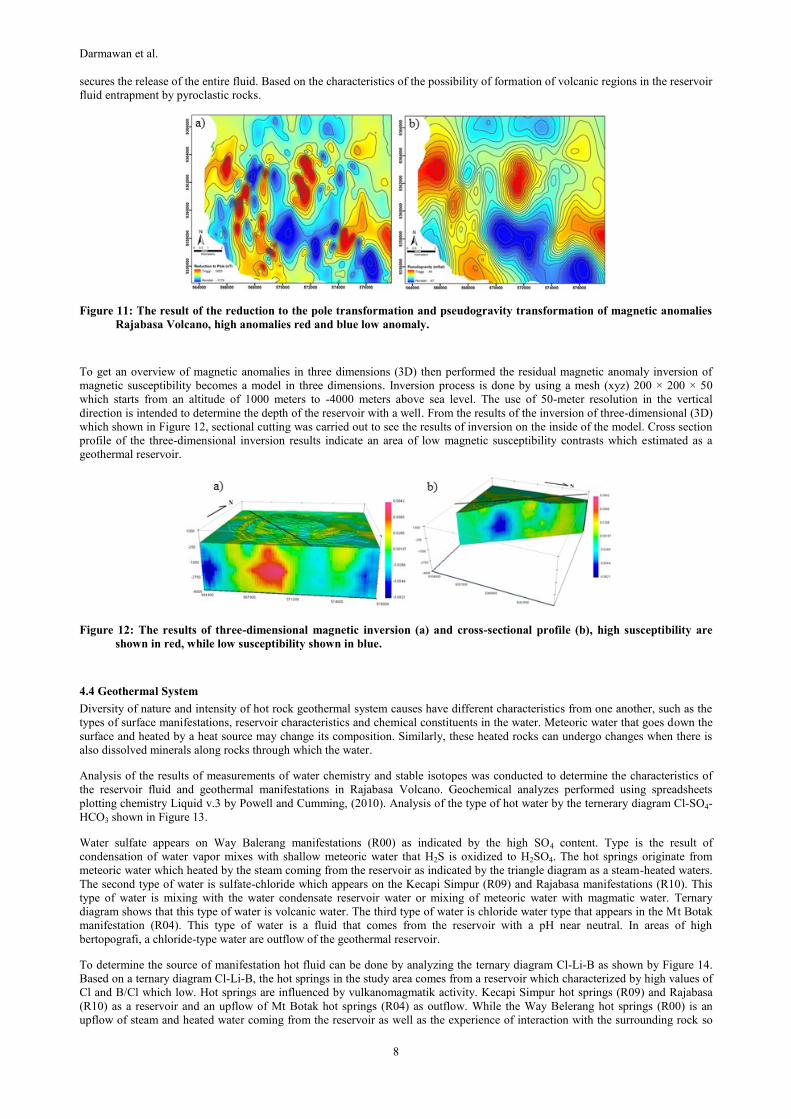
Figure 7: Alteration appearance of the hot springs (a) and fumaroles (b) in manifestations of geothermal Way Belerang
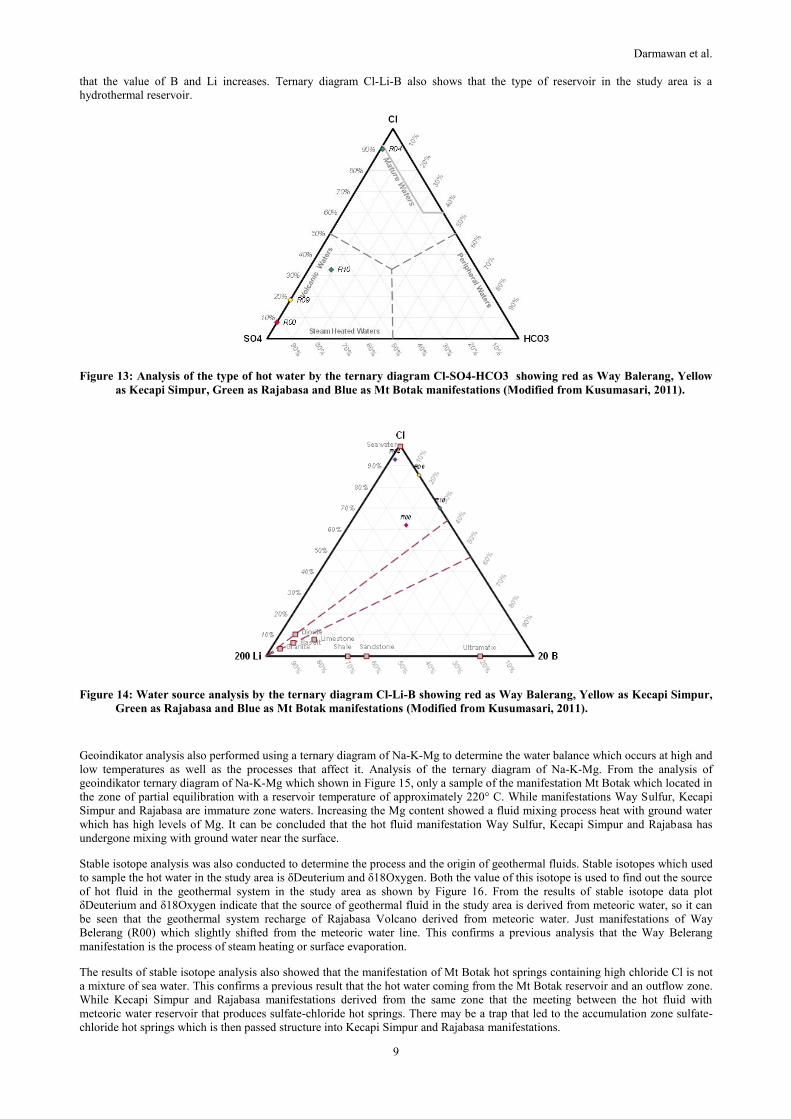
Argillic alteration formed at relatively low temperatures with pH ranging from 4-5. This alteration is usually dominated by kaolinite
and smectite minerals and sometimes there is a group minerals of illite. This alteration seems to warm ground manifestation Way
Kalam, however, the temperature and pH measurement is not performed at this manifestation. It is the absence of fluid in the
manifestation. The area manifestation is in the area which tilted to an altitude of about 750 meters above sea level as shown by
Figure 8.
Figure 8: Alteration appearance of the warm ground (a,b) in manifestations of geothermal Way Kalam
Iron oxide minerals are separated into separate zones represented by goethite which only detected with other minerals in the Kecapi
Simpur manifestation. Most of the mineral goethite was around the Mt Rajabasa ridge above Way Kalam. Therefore, the presence
of the mineral goethite in the area can be classified into one of its own zone as the zone of iron oxide. The appearance of the red
color on the alteration in geothermal manifestations of Kecapi Simpur are an estimated as iron oxide shown by Figure 9.
Propylitic alteration at pH near neutral to alkaline minerals are characterized by the presence of chlorite and epidote. Relatively low
temperature the presence of zeolite minerals are epidote replacement. This condition is called sub-propylitic. The presence of
minerals albite and K-feldspar also common. This alteration appear in hot springs manifestation of Mt Botak as shown by Figure
10.

Darmawan et al.
7
Figure 9: Alteration appearance of the iron oxide (a,b) in manifestations of geothermal Kecapi Simpur
Figure 10: Alteration appearance of the hot springs (a,b) in manifestations of geothermal Mt Botak
The results of temperature measurements in the hot springs Mt Botak manifestations indicate a temperature between 102 ° -105 ° C
with a pH about 6.7.
4.3 Magnetic Interpretation
Magnetic Analysis in two dimensions (2D) is done to get an idea of the magnetic response of the visible surface. Total magnetic
anomalies in the study area showed a high anomalous values with the highest value of about 715 nT, while the blue areas indicate
anomalous values which lower with the lowest value of about -868 nT. The focus in the search for the location of the geothermal
reservoir is low anomaly area. Low value anomaly thought to be caused by which demagnetization process occurs in rocks
containing steam and hot water. Although not all low anomaly caused by the process. Therefore, it is necessary to clarify further
processing indication of the presence of geothermal reservoir at Rajabasa Volcano.
In total magnetic anomalies in the study area was affected regional effects, so as to focus on geothermal reservoir needs to separate
the regional anomalies. In this study, regional anomalies obtained by applying the upward continuation of the magnetic anomalies
in total. Upward continuation of the process would eliminate the local effects that are left are regional influence. Upward
continuation process is done until a form of regional anomalies which tend to be stable and has not changed much. Continuation
process a few times to a height of 4000 meters.
Regional magnetic anomalies in the study area is used to obtain the residual anomaly. By doing the math grid on the total magnetic
anomaly reduced regional magnetic anomalies of the obtained residual magnetic anomalies in the study area. Residual magnetic
anomalies in the study area showed a low anomaly in the middle of the study area which estimated as the response of the
geothermal reservoir area.
Magnetic response has two poles is called a dipole and is influenced by the angle of inclination and declination in the study area, so
the location of the target anomaly is not positioned in an area which expected. To get the response of geothermal reservoir located
just below the low magnetic anomaly it is necessary to transform the reduction to the pole. This method is done because the
inclination angle of 90 ° (pole) magnetic response of the target is located just below the anomaly. The results of the reduction to the
pole as shown in Figure 11.
The results showed that the area of transformation pseudogravity magnetic anomaly indicates a geothermal reservoir area also
showed a low response to gravity. The analysis indicates that the geothermal reservoir area has a lower density than the surrounding
fluid because it contains. Areas with magnetic and gravity responses were equally low becomes interesting to observe as the
reservoir zone. To analyze the relationship between reservoir zones with geothermal manifestations occurrences can be done by
looking at the patterns of magnetic alignment and structure of the geothermal manifestations.
The area of geothermal reservoir is thought to be an cracks area caused by the meeting which there is some fault in the study area.
Due to fracture of the fault causing the high permeability so easily filled by the fluid. However, as the required reservoir trap that
Darmawan et al.
8
secures the release of the entire fluid. Based on the characteristics of the possibility of formation of volcanic regions in the reservoir
fluid entrapment by pyroclastic rocks.
Figure 11: The result of the reduction to the pole transformation and pseudogravity transformation of magnetic anomalies
Rajabasa Volcano, high anomalies red and blue low anomaly.
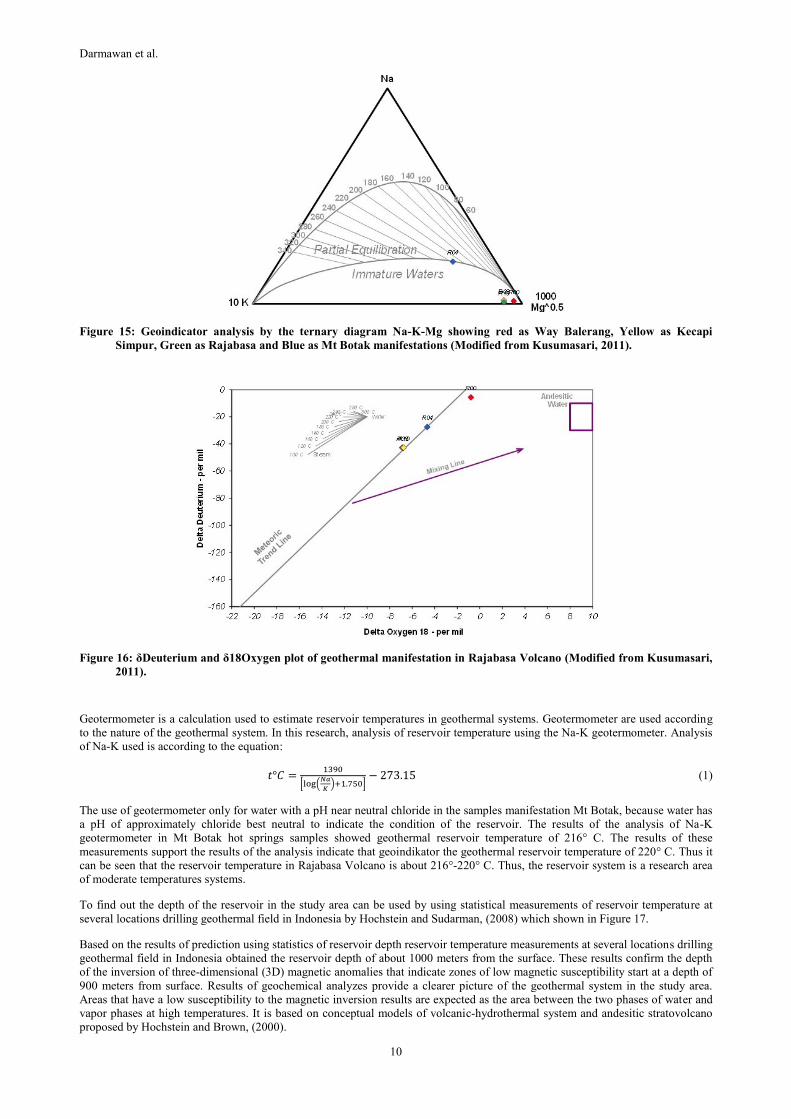
To get an overview of magnetic anomalies in three dimensions (3D) then performed the residual magnetic anomaly inversion of
magnetic susceptibility becomes a model in three dimensions. Inversion process is done by using a mesh (xyz) 200 × 200 × 50
which starts from an altitude of 1000 meters to -4000 meters above sea level. The use of 50-meter resolution in the vertical
direction is intended to determine the depth of the reservoir with a well. From the results of the inversion of three-dimensional (3D)
which shown in Figure 12, sectional cutting was carried out to see the results of inversion on the inside of the model. Cross section
profile of the three-dimensional inversion results indicate an area of low magnetic susceptibility contrasts which estimated as a
geothermal reservoir.
Figure 12: The results of three-dimensional magnetic inversion (a) and cross-sectional profile (b), high susceptibility are
shown in red, while low susceptibility shown in blue.
4.4 Geothermal System
Diversity of nature and intensity of hot rock geothermal system causes have different characteristics from one another, such as the
types of surface manifestations, reservoir characteristics and chemical constituents in the water. Meteoric water that goes down the
surface and heated by a heat source may change its composition. Similarly, these heated rocks can undergo changes when there is
also dissolved minerals along rocks through which the water.
Analysis of the results of measurements of water chemistry and stable isotopes was conducted to determine the characteristics of
the reservoir fluid and geothermal manifestations in Rajabasa Volcano. Geochemical analyzes performed using spreadsheets
plotting chemistry Liquid v.3 by Powell and Cumming, (2010). Analysis of the type of hot water by the ternerary diagram Cl-SO4-
HCO3 shown in Figure 13.
Water sulfate appears on Way Balerang manifestations (R00) as indicated by the high SO4 content. Type is the result of
condensation of water vapor mixes with shallow meteoric water that H2S is oxidized to H2SO4. The hot springs originate from
meteoric water which heated by the steam coming from the reservoir as indicated by the triangle diagram as a steam-heated waters.
The second type of water is sulfate-chloride which appears on the Kecapi Simpur (R09) and Rajabasa manifestations (R10). This
type of water is mixing with the water condensate reservoir water or mixing of meteoric water with magmatic water. Ternary
diagram shows that this type of water is volcanic water. The third type of water is chloride water type that appears in the Mt Botak
manifestation (R04). This type of water is a fluid that comes from the reservoir with a pH near neutral. In areas of high
bertopografi, a chloride-type water are outflow of the geothermal reservoir.
To determine the source of manifestation hot fluid can be done by analyzing the ternary diagram Cl-Li-B as shown by Figure 14.
Based on a ternary diagram Cl-Li-B, the hot springs in the study area comes from a reservoir which characterized by high values of
Cl and B/Cl which low. Hot springs are influenced by vulkanomagmatik activity. Kecapi Simpur hot springs (R09) and Rajabasa
(R10) as a reservoir and an upflow of Mt Botak hot springs (R04) as outflow. While the Way Belerang hot springs (R00) is an
upflow of steam and heated water coming from the reservoir as well as the experience of interaction with the surrounding rock so
Darmawan et al.
9
that the value of B and Li increases. Ternary diagram Cl-Li-B also shows that the type of reservoir in the study area is a
hydrothermal reservoir.
Figure 13: Analysis of the type of hot water by the ternary diagram Cl-SO4-HCO3 showing red as Way Balerang, Yellow
as Kecapi Simpur, Green as Rajabasa and Blue as Mt Botak manifestations (Modified from Kusumasari, 2011).
Figure 14: Water source analysis by the ternary diagram Cl-Li-B showing red as Way Balerang, Yellow as Kecapi Simpur,
Green as Rajabasa and Blue as Mt Botak manifestations (Modified from Kusumasari, 2011).
Geoindikator analysis also performed using a ternary diagram of Na-K-Mg to determine the water balance which occurs at high and
low temperatures as well as the processes that affect it. Analysis of the ternary diagram of Na-K-Mg. From the analysis of
geoindikator ternary diagram of Na-K-Mg which shown in Figure 15, only a sample of the manifestation Mt Botak which located in
the zone of partial equilibration with a reservoir temperature of approximately 220° C. While manifestations Way Sulfur, Kecapi
Simpur and Rajabasa are immature zone waters. Increasing the Mg content showed a fluid mixing process heat with ground water
which has high levels of Mg. It can be concluded that the hot fluid manifestation Way Sulfur, Kecapi Simpur and Rajabasa has
undergone mixing with ground water near the surface.
Stable isotope analysis was also conducted to determine the process and the origin of geothermal fluids. Stable isotopes which used
to sample the hot water in the study area is δDeuterium and δ18Oxygen. Both the value of this isotope is used to find out the source
of hot fluid in the geothermal system in the study area as shown by Figure 16. From the results of stable isotope data plot
δDeuterium and δ18Oxygen indicate that the source of geothermal fluid in the study area is derived from meteoric water, so it can
be seen that the geothermal system recharge of Rajabasa Volcano derived from meteoric water. Just manifestations of Way
Belerang (R00) which slightly shifted from the meteoric water line. This confirms a previous analysis that the Way Belerang
manifestation is the process of steam heating or surface evaporation.
The results of stable isotope analysis also showed that the manifestation of Mt Botak hot springs containing high chloride Cl is not
a mixture of sea water. This confirms a previous result that the hot water coming from the Mt Botak reservoir and an outflow zone.
While Kecapi Simpur and Rajabasa manifestations derived from the same zone that the meeting between the hot fluid with
meteoric water reservoir that produces sulfate-chloride hot springs. There may be a trap that led to the accumulation zone sulfate-
chloride hot springs which is then passed structure into Kecapi Simpur and Rajabasa manifestations.
Darmawan et al.
10
Figure 15: Geoindicator analysis by the ternary diagram Na-K-Mg showing red as Way Balerang, Yellow as Kecapi
Simpur, Green as Rajabasa and Blue as Mt Botak manifestations (Modified from Kusumasari, 2011).
Figure 16: δDeuterium and δ18Oxygen plot of geothermal manifestation in Rajabasa Volcano (Modified from Kusumasari,
2011).
Geotermometer is a calculation used to estimate reservoir temperatures in geothermal systems. Geotermometer are used according
to the nature of the geothermal system. In this research, analysis of reservoir temperature using the Na-K geotermometer. Analysis
of Na-K used is according to the equation:
𝑡°𝐶 =1390
[log(𝑁𝑎
𝐾)+1.750]
− 273.15 (1)
The use of geotermometer only for water with a pH near neutral chloride in the samples manifestation Mt Botak, because water has
a pH of approximately chloride best neutral to indicate the condition of the reservoir. The results of the analysis of Na-K
geotermometer in Mt Botak hot springs samples showed geothermal reservoir temperature of 216° C. The results of these
measurements support the results of the analysis indicate that geoindikator the geothermal reservoir temperature of 220° C. Thus it
can be seen that the reservoir temperature in Rajabasa Volcano is about 216°-220° C. Thus, the reservoir system is a research area
of moderate temperatures systems.
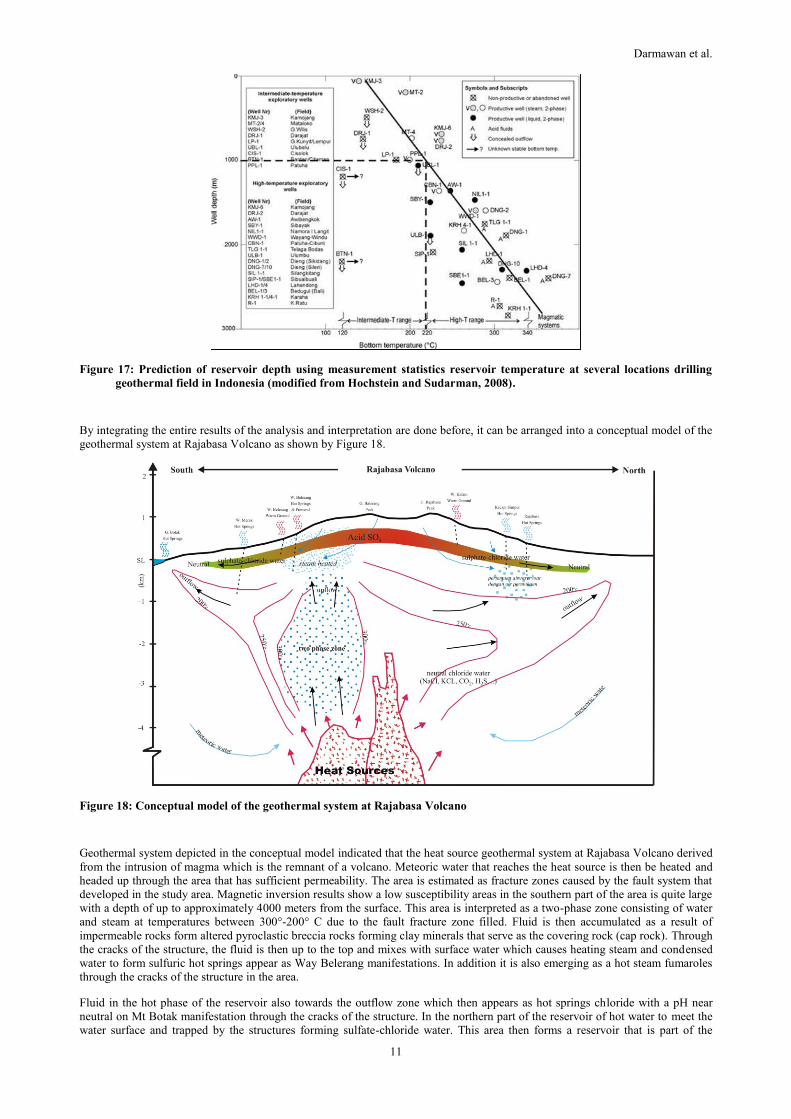
To find out the depth of the reservoir in the study area can be used by using statistical measurements of reservoir temperature at
several locations drilling geothermal field in Indonesia by Hochstein and Sudarman, (2008) which shown in Figure 17.
Based on the results of prediction using statistics of reservoir depth reservoir temperature measurements at several locations drilling
geothermal field in Indonesia obtained the reservoir depth of about 1000 meters from the surface. These results confirm the depth
of the inversion of three-dimensional (3D) magnetic anomalies that indicate zones of low magnetic susceptibility start at a depth of
900 meters from surface. Results of geochemical analyzes provide a clearer picture of the geothermal system in the study area.
Areas that have a low susceptibility to the magnetic inversion results are expected as the area between the two phases of water and
vapor phases at high temperatures. It is based on conceptual models of volcanic-hydrothermal system and andesitic stratovolcano
proposed by Hochstein and Brown, (2000).
Darmawan et al.
11
Figure 17: Prediction of reservoir depth using measurement statistics reservoir temperature at several locations drilling
geothermal field in Indonesia (modified from Hochstein and Sudarman, 2008).
By integrating the entire results of the analysis and interpretation are done before, it can be arranged into a conceptual model of the
geothermal system at Rajabasa Volcano as shown by Figure 18.
Figure 18: Conceptual model of the geothermal system at Rajabasa Volcano
Geothermal system depicted in the conceptual model indicated that the heat source geothermal system at Rajabasa Volcano derived
from the intrusion of magma which is the remnant of a volcano. Meteoric water that reaches the heat source is then be heated and
headed up through the area that has sufficient permeability. The area is estimated as fracture zones caused by the fault system that
developed in the study area. Magnetic inversion results show a low susceptibility areas in the southern part of the area is quite large
with a depth of up to approximately 4000 meters from the surface. This area is interpreted as a two-phase zone consisting of water
and steam at temperatures between 300°-200° C due to the fault fracture zone filled. Fluid is then accumulated as a result of
impermeable rocks form altered pyroclastic breccia rocks forming clay minerals that serve as the covering rock (cap rock). Through
the cracks of the structure, the fluid is then up to the top and mixes with surface water which causes heating steam and condensed
water to form sulfuric hot springs appear as Way Belerang manifestations. In addition it is also emerging as a hot steam fumaroles
through the cracks of the structure in the area.
Fluid in the hot phase of the reservoir also towards the outflow zone which then appears as hot springs chloride with a pH near
neutral on Mt Botak manifestation through the cracks of the structure. In the northern part of the reservoir of hot water to meet the
water surface and trapped by the structures forming sulfate-chloride water. This area then forms a reservoir that is part of the
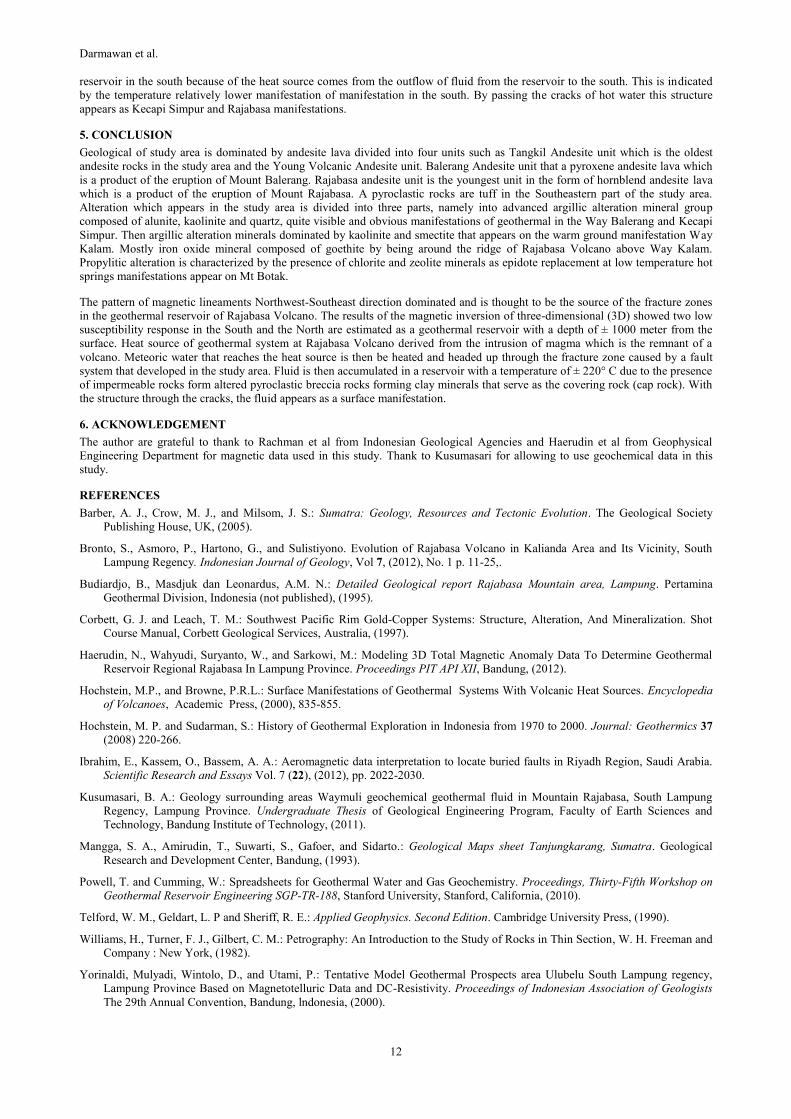
Darmawan et al.
12
reservoir in the south because of the heat source comes from the outflow of fluid from the reservoir to the south. This is indicated
by the temperature relatively lower manifestation of manifestation in the south. By passing the cracks of hot water this structure
appears as Kecapi Simpur and Rajabasa manifestations.
5. CONCLUSION
Geological of study area is dominated by andesite lava divided into four units such as Tangkil Andesite unit which is the oldest
andesite rocks in the study area and the Young Volcanic Andesite unit. Balerang Andesite unit that a pyroxene andesite lava which
is a product of the eruption of Mount Balerang. Rajabasa andesite unit is the youngest unit in the form of hornblend andesite lava
which is a product of the eruption of Mount Rajabasa. A pyroclastic rocks are tuff in the Southeastern part of the study area.
Alteration which appears in the study area is divided into three parts, namely into advanced argillic alteration mineral group
composed of alunite, kaolinite and quartz, quite visible and obvious manifestations of geothermal in the Way Balerang and Kecapi
Simpur. Then argillic alteration minerals dominated by kaolinite and smectite that appears on the warm ground manifestation Way
Kalam. Mostly iron oxide mineral composed of goethite by being around the ridge of Rajabasa Volcano above Way Kalam.
Propylitic alteration is characterized by the presence of chlorite and zeolite minerals as epidote replacement at low temperature hot
springs manifestations appear on Mt Botak.
The pattern of magnetic lineaments Northwest-Southeast direction dominated and is thought to be the source of the fracture zones
in the geothermal reservoir of Rajabasa Volcano. The results of the magnetic inversion of three-dimensional (3D) showed two low
susceptibility response in the South and the North are estimated as a geothermal reservoir with a depth of ± 1000 meter from the
surface. Heat source of geothermal system at Rajabasa Volcano derived from the intrusion of magma which is the remnant of a
volcano. Meteoric water that reaches the heat source is then be heated and headed up through the fracture zone caused by a fault
system that developed in the study area. Fluid is then accumulated in a reservoir with a temperature of ± 220° C due to the presence
of impermeable rocks form altered pyroclastic breccia rocks forming clay minerals that serve as the covering rock (cap rock). With
the structure through the cracks, the fluid appears as a surface manifestation.
6. ACKNOWLEDGEMENT
The author are grateful to thank to Rachman et al from Indonesian Geological Agencies and Haerudin et al from Geophysical
Engineering Department for magnetic data used in this study. Thank to Kusumasari for allowing to use geochemical data in this
study.
REFERENCES
Barber, A. J., Crow, M. J., and Milsom, J. S.: Sumatra: Geology, Resources and Tectonic Evolution. The Geological Society
Publishing House, UK, (2005).
Bronto, S., Asmoro, P., Hartono, G., and Sulistiyono. Evolution of Rajabasa Volcano in Kalianda Area and Its Vicinity, South
Lampung Regency. Indonesian Journal of Geology, Vol 7, (2012), No. 1 p. 11-25,.
Budiardjo, B., Masdjuk dan Leonardus, A.M. N.: Detailed Geological report Rajabasa Mountain area, Lampung. Pertamina
Geothermal Division, Indonesia (not published), (1995).
Corbett, G. J. and Leach, T. M.: Southwest Pacific Rim Gold-Copper Systems: Structure, Alteration, And Mineralization. Shot
Course Manual, Corbett Geological Services, Australia, (1997).
Haerudin, N., Wahyudi, Suryanto, W., and Sarkowi, M.: Modeling 3D Total Magnetic Anomaly Data To Determine Geothermal
Reservoir Regional Rajabasa In Lampung Province. Proceedings PIT API XII, Bandung, (2012).
Hochstein, M.P., and Browne, P.R.L.: Surface Manifestations of Geothermal Systems With Volcanic Heat Sources. Encyclopedia
of Volcanoes, Academic Press, (2000), 835-855.
Hochstein, M. P. and Sudarman, S.: History of Geothermal Exploration in Indonesia from 1970 to 2000. Journal: Geothermics 37
(2008) 220-266.
Ibrahim, E., Kassem, O., Bassem, A. A.: Aeromagnetic data interpretation to locate buried faults in Riyadh Region, Saudi Arabia.
Scientific Research and Essays Vol. 7 (22), (2012), pp. 2022-2030.
Kusumasari, B. A.: Geology surrounding areas Waymuli geochemical geothermal fluid in Mountain Rajabasa, South Lampung
Regency, Lampung Province. Undergraduate Thesis of Geological Engineering Program, Faculty of Earth Sciences and
Technology, Bandung Institute of Technology, (2011).
Mangga, S. A., Amirudin, T., Suwarti, S., Gafoer, and Sidarto.: Geological Maps sheet Tanjungkarang, Sumatra. Geological
Research and Development Center, Bandung, (1993).
Powell, T. and Cumming, W.: Spreadsheets for Geothermal Water and Gas Geochemistry. Proceedings, Thirty-Fifth Workshop on
Geothermal Reservoir Engineering SGP-TR-188, Stanford University, Stanford, California, (2010).
Telford, W. M., Geldart, L. P and Sheriff, R. E.: Applied Geophysics. Second Edition. Cambridge University Press, (1990).
Williams, H., Turner, F. J., Gilbert, C. M.: Petrography: An Introduction to the Study of Rocks in Thin Section, W. H. Freeman and
Company : New York, (1982).
Yorinaldi, Mulyadi, Wintolo, D., and Utami, P.: Tentative Model Geothermal Prospects area Ulubelu South Lampung regency,
Lampung Province Based on Magnetotelluric Data and DC-Resistivity. Proceedings of Indonesian Association of Geologists
The 29th Annual Convention, Bandung, lndonesia, (2000).