geofizka wiertnicza w zlozach typu shalegas. log model (shalelog) brittleness mud log gas mineralogy...
TRANSCRIPT

Geofizka wiertnicza w zlozach typu ShaleGas.
Maciej KozłowskiKrzysztof Drop
Rola geofizyki wiertniczej w okre śleniu zasobów gazu ziemnego w łupkach.

O czym powiemy:
1. Charakterystyka ShaleGas’u.
2. Interpretacja geofizyki wiertniczej – metoda Passeya.
3. Interpretacja geofizyki wiertniczej – metodą normalizacji.normalizacji.
4. Zasoby. Główny kryteria ekonomiczne projektu
5. Podejmowanie decyzji. Jak pomóc Szefowi.
Zielona Góra, 24.04.2009 2
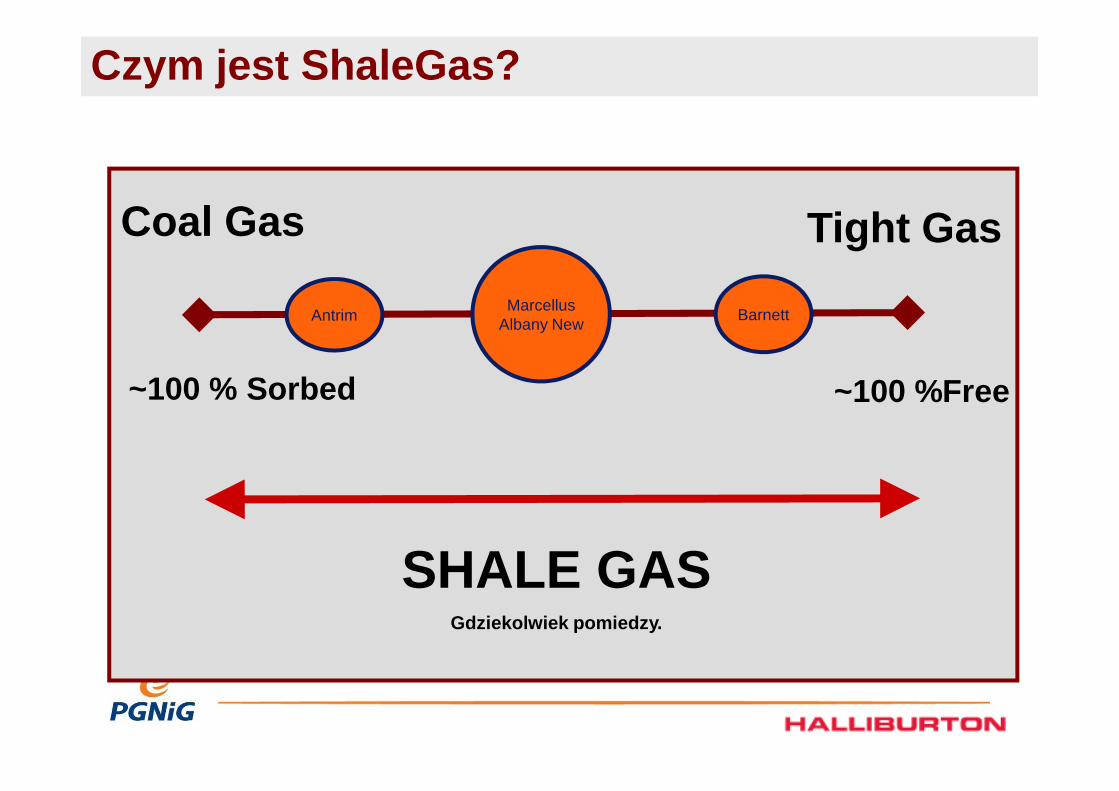
Coal Gas Tight Gas
~100 %Free~100 % Sorbed
Czym jest ShaleGas?
AntrimMarcellus
Albany NewBarnett
~100 %Free~100 % Sorbed
SHALE GASGdziekolwiek pomiedzy.

Conventional Reservoirs and Shale Gas ComparedConventional Reservoirs
1. Gas Storage in Macropores; real gas law.
2. Production Schedule Darcy Flow of gas to the wellbore
3. Gas Content as 1-SW from Logs
4. Gas To Water Increases in latter Stages
Shale Gas Reservoirs
1. Gas Storage by Adsorption on micropore surfaces and/or free gas.
2. Diffusion through micropores according to Fick’s Law• Darcy Flow through Fractures or
macropores
3. Best Gas Content from cores.
4. Gas to Water Increase or decreases with Production time
4. Gas To Water Increases in latter Stages
5. Inorganic Reservoir Rock
6. Hydraulic Fracturing may be needed to enhance flow
7. Permeability not pressure dependent
8. Macropore size: 1µ to 1mm
4. Gas to Water Increase or decreases with Production time
5. Source rock + Reservoir
6. Hydraulic fracturing required; permeability dependent on fractures
7. Permeability highly pressuredependent.
8. Micropore size: <5Ǻ to 50Ǻ

120
160
200G
as C
onte
nt (
scf/t
on)
Antrim Shale
New Albany Shale
Caney Shale
ShaleEval Service - Gas Capacity vs TOC
Ro ↑3 m3
4 m3
5 m3
0
40
80
0 2 4 6 8 10 12 14 16 18 20
TOC (Wt. %)
Gas
Con
tent
(sc
f/ton
)
Ro ↑
1m3
2 m3

2400 m
600 m
1m3/T
8m3/T
3Mm3/day
30Mm3/day
15
100
8m3
50m3
Conventional 30m3/T

Co potrafimy?• właściwości zbiornikowe
• nasycenia gazem
• własności mechaniczne
• średnie TOC
• szczelinowatość• kruchość skały (stosunek
ilość kwarcu do matrycy skalenej)
Po co?Po co?• określanie TOC
• określanie stref do rdzeniowania
• obliczenie zasobów
• określanie stref do szczelinowania
• obliczenia gradientu szczelinowania
SPE 123586

Petrophysical Log Model (ShaleLog)
Brittleness
Mud Log G
as
Mineralogy
Free G
as
Shale P
orosity
Rock P
roperties
Kerogen/O
rganic
Recorded Data Calculated Information
Perforations
Perforations
Perforations
Perforations
Perforations


Metoda Q.R.Passey (1989). Podstawą metody jest szukanie anomalii pomiędzy krzywą DT a krzywą oporności, świadczącej o zwiększonej
Zielona Góra, 24.04.2009 10
zwiększonej zawartości substancji organicznej w skale. Wartości anomalii są przeliczane na TOC.

Porównanie anomalii z literatury z anomali ą z przykładowego odwiertu. Anomalia występuje w utworach dolnego syluru i ordowiku
Zielona Góra, 24.04.2009 11

DlogR = log (Rt/Rt basel) + 0.02 x (Dt – Dt base)
TOC = DLogR x 10^(2.297 – 0.1688 x LOM)
Zielona Góra, 24.04.2009 12
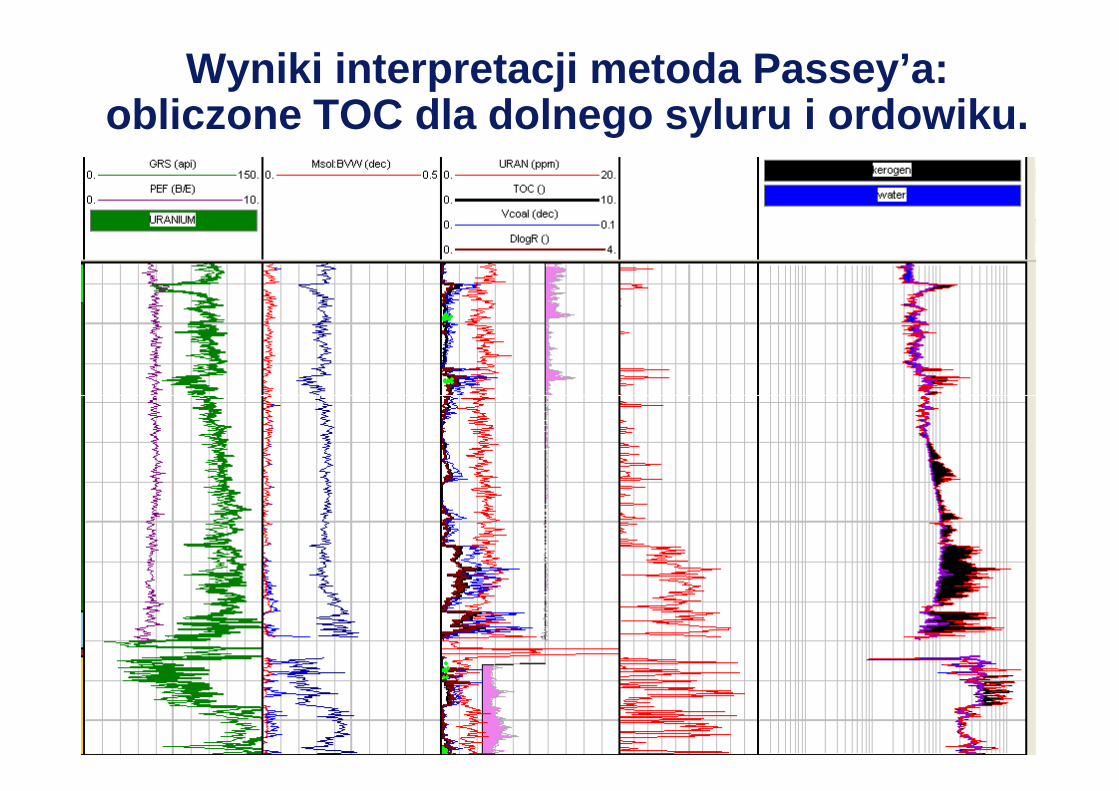
Wyniki interpretacji metoda Passey’a: obliczone TOC dla dolnego syluru i ordowiku.
Zielona Góra, 24.04.2009 13

Określania TOC metod ą normalizacji.
Ilość odwiertów w Polsce, gdzie moŜna zastosować metodą Passey’a wynosi 4-5. W pozostałych dane nie pozwalają na ten rodzaj interpretacji. Jednak dzięki ułańskiej fantazji jesteśmy w stanie policzyć TOC indywidualnie na kaŜdym odwiercie składając krzywe, na których moŜna odnaleźć anomalię TOC:
• Gamma Naturalne - (anomalia składowej uranu) – składamy z Neutronem, SP, opornością
• Neutron (gazowe obniŜenie na neutronie ) – składamy z gammą i • Neutron (gazowe obniŜenie na neutronie ) – składamy z gammą i opornością
• Oporność (anomalia wysokoopornościowa) – składamy z kaŜdą dostępną krzywą porowatościową (sonic, gęstość, neutron), gammą
W praktyce brak jest pomiarów DT, RHOB. Pomiar oporności realizowany sondami gradientowymi. Dostępne równieŜ Gamma Naturalne i Neutron-Gamma.
Zielona Góra, 24.04.2009 14

Baltic Depression Well Courtesy of

Podlasie well
Courtesy of Realm EnergyCourtesy of
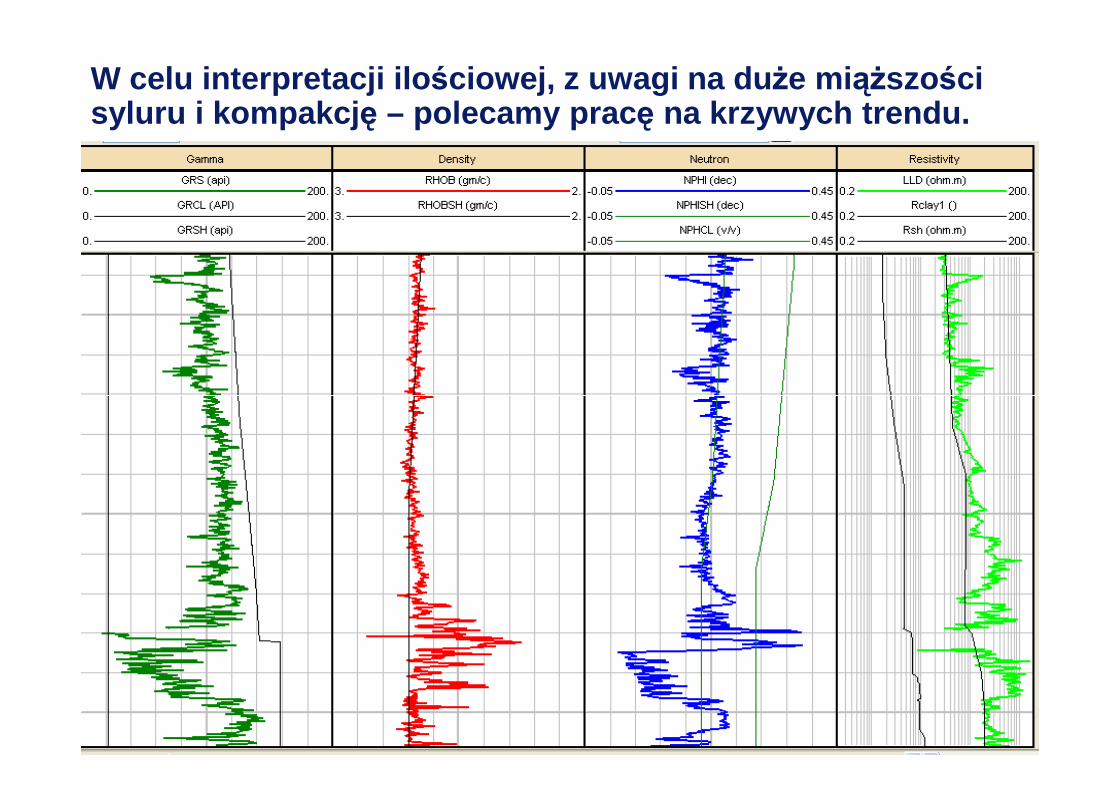
W celu interpretacji ilo ściowej, z uwagi na du Ŝe miąŜszości syluru i kompakcj ę – polecamy prac ę na krzywych trendu.
Zielona Góra, 24.04.2009 17

Po właściwym okre śleniu TOC, nale Ŝy przyst ąpić do rozwi ązania modelu petrofizycznego, u Ŝywaj ąc krzywej TOC jako wej ściowej.
Zielona Góra, 24.04.2009 18

Shale Gas vs. Conventional Gas in Place
GIP = Area x Height x Storage Capacity x Gas Saturation
Log Analysis using cutoff appropriate for
area
(h)Conventional
Area of Interest
(A)
Porosity Log
Analysis
(Ø)
Water Saturation via log analysis
(1-Sw)Bg
GIP = Area x Height x Storage Capacity x Gas Saturation
(h)
Analyze logs usingcutoff
Shale Gas (A)
Area of Interest
(RhoB)
Density from log
(Gc)=f(TOC)
Gas ContentFrom lab analysis of
cores
Not every well has
core analysis!

What we don’t know now?• Old TOC method were carried out without core preservation procedure. Then how much TOC were lost by weathering and degasation during pulling up?
• How much free gas / how much sorpted is in the rocks (Langmuir Isotherm)?rocks (Langmuir Isotherm)?
• What is Gas Content versus TOC?
Appropriate coring and lab measurement are substantial for understanding the Shale
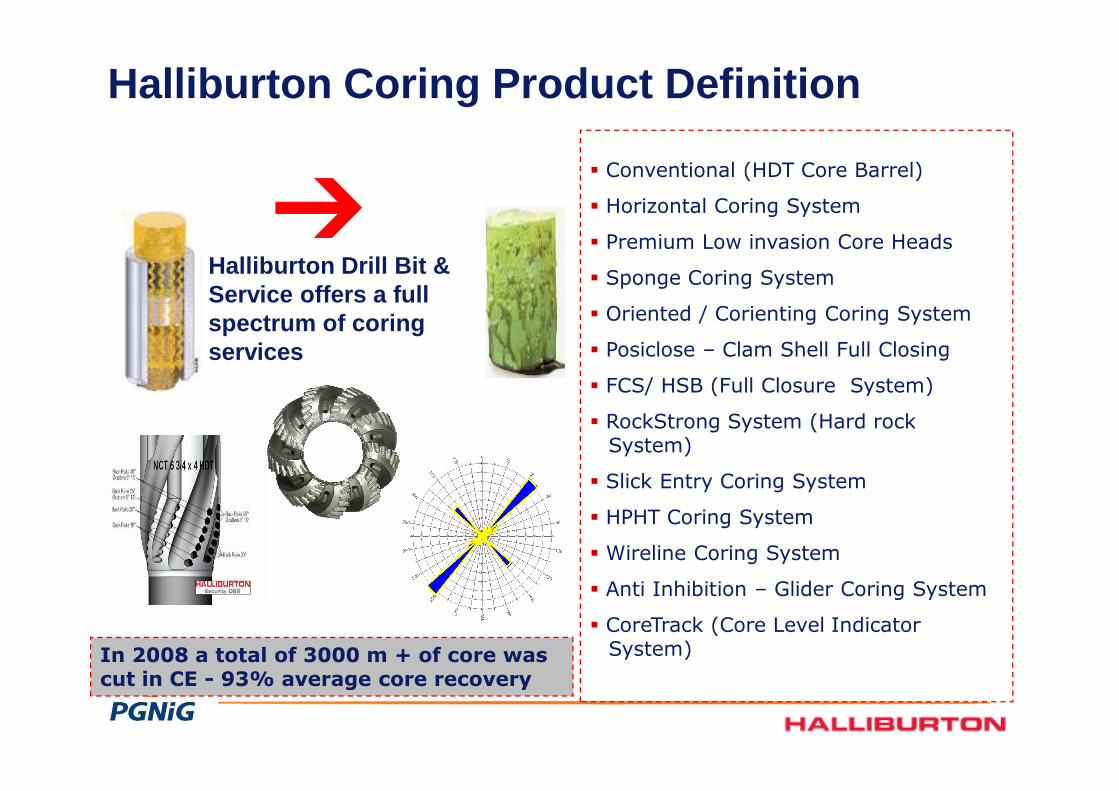
� Conventional (HDT Core Barrel)
� Horizontal Coring System
� Premium Low invasion Core Heads
� Sponge Coring System
� Oriented / Corienting Coring System
� Posiclose – Clam Shell Full Closing
� FCS/ HSB (Full Closure System)
Halliburton Drill Bit & Service offers a full spectrum of coring services
Halliburton Coring Product Definition
� FCS/ HSB (Full Closure System)
� RockStrong System (Hard rock System)
� Slick Entry Coring System
� HPHT Coring System
� Wireline Coring System
� Anti Inhibition – Glider Coring System
� CoreTrack (Core Level Indicator System)In 2008 a total of 3000 m + of core was
cut in CE - 93% average core recovery

Coring Services
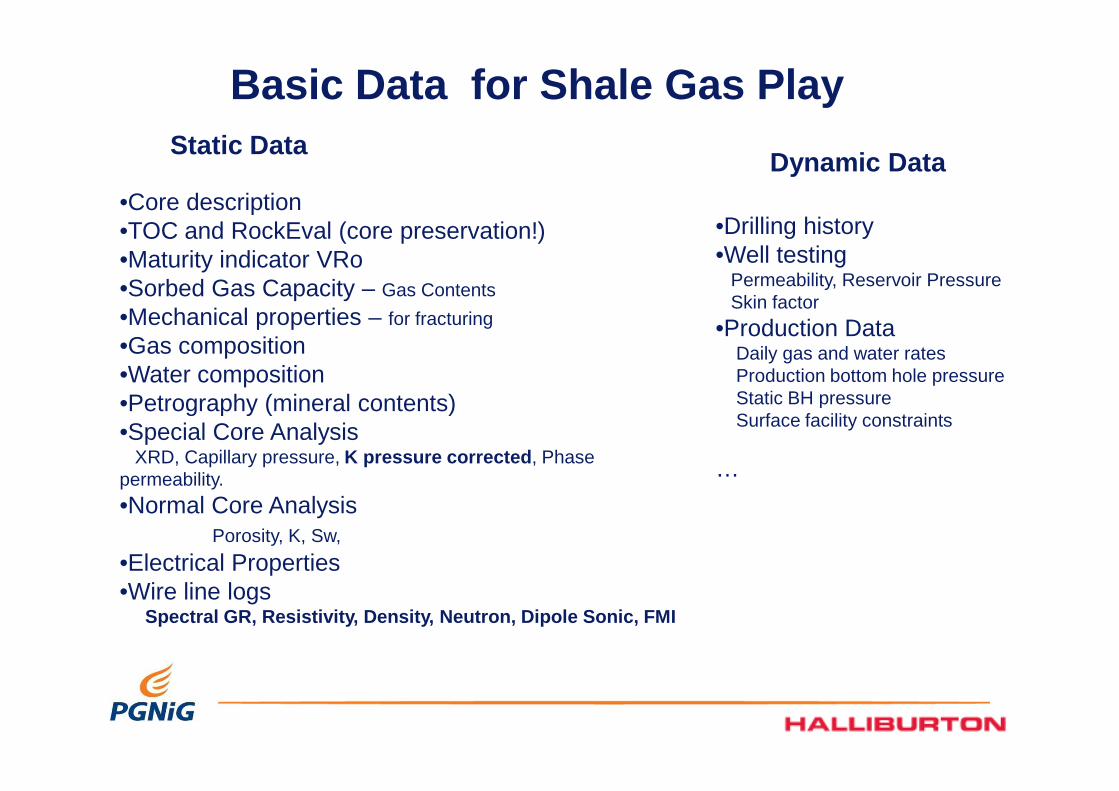
Basic Data for Shale Gas Play
•Core description•TOC and RockEval (core preservation!) •Maturity indicator VRo•Sorbed Gas Capacity – Gas Contents
•Mechanical properties – for fracturing
•Gas composition •Water composition•Petrography (mineral contents)
•Drilling history•Well testing
Permeability, Reservoir PressureSkin factor
•Production DataDaily gas and water ratesProduction bottom hole pressureStatic BH pressure
Static DataDynamic Data
•Petrography (mineral contents)•Special Core Analysis
XRD, Capillary pressure, K pressure corrected , Phase permeability.
•Normal Core Analysis Porosity, K, Sw,
•Electrical Properties•Wire line logs
Spectral GR, Resistivity, Density, Neutron, Dipole Sonic, FMI
Static BH pressureSurface facility constraints
…

5. Główne kryteria ekonomiczne projektu•zasoby geologiczne gazu (niepewnosc wyznacznia zasobow)
• jakość gazu (zakladana, zalezy od czynnikow geologicznych)
•cena gazu (obecna, w przyszlosci)
•koszty i metoda rozwiercania złoŜa odwiertami horyzontalnymi (gestos powierzchniowa klastrow, ilosc odwiertow w klastrze, dlugosc odwiertu, metoda szczelinowania…)klastrze, dlugosc odwiertu, metoda szczelinowania…)
•koszty zagospodarowania gazu (cena koncesji, budowy rurociagow…)
•…?
= WIELE, WIELE OPCJI
(kto chce byc decydentem?)24Zielona Góra, 24.04.2009
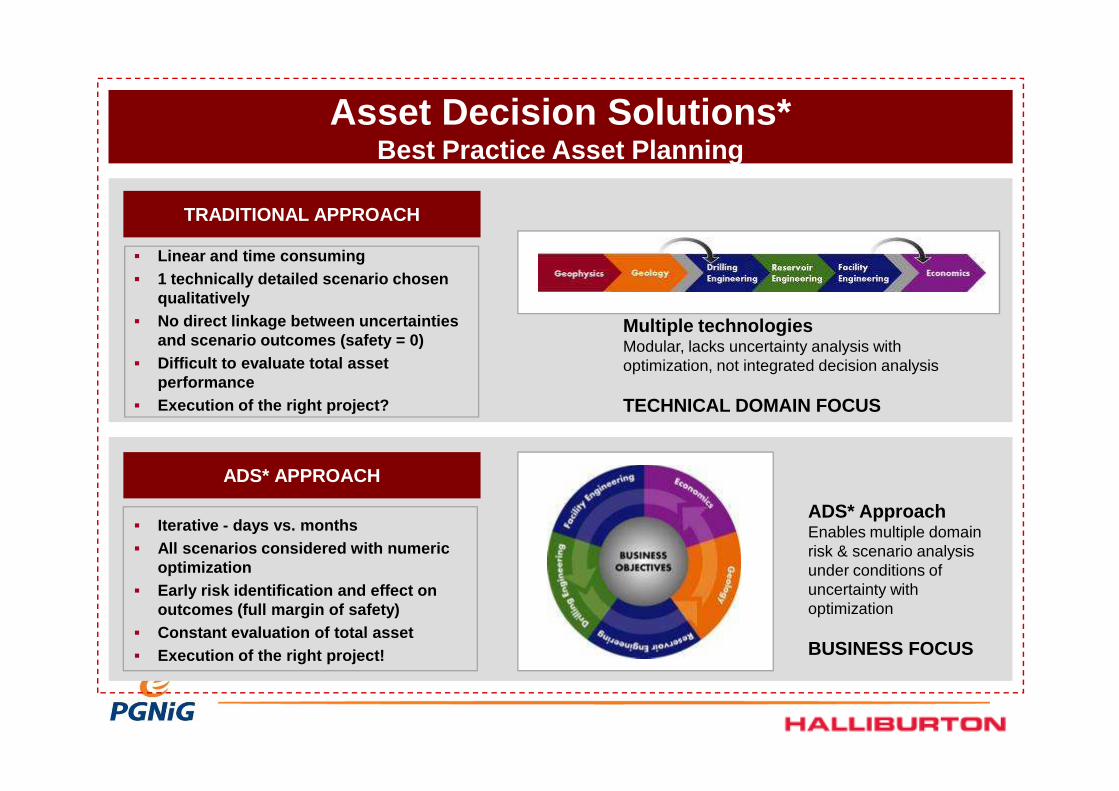
Asset Decision Solutions*Best Practice Asset Planning
TRADITIONAL APPROACH
� Linear and time consuming � 1 technically detailed scenario chosen
qualitatively � No direct linkage between uncertainties
and scenario outcomes (safety = 0) � Difficult to evaluate total asset
performance
Multiple technologiesModular, lacks uncertainty analysis with optimization, not integrated decision analysis
TECHNICAL DOMAIN FOCUS
ADS* APPROACH
� Execution of the right project?
� Iterative - days vs. months� All scenarios considered with numeric
optimization� Early risk identification and effect on
outcomes (full margin of safety)� Constant evaluation of total asset � Execution of the right project!
ADS* ApproachEnables multiple domain risk & scenario analysis under conditions of uncertainty with optimization
BUSINESS FOCUS
TECHNICAL DOMAIN FOCUS
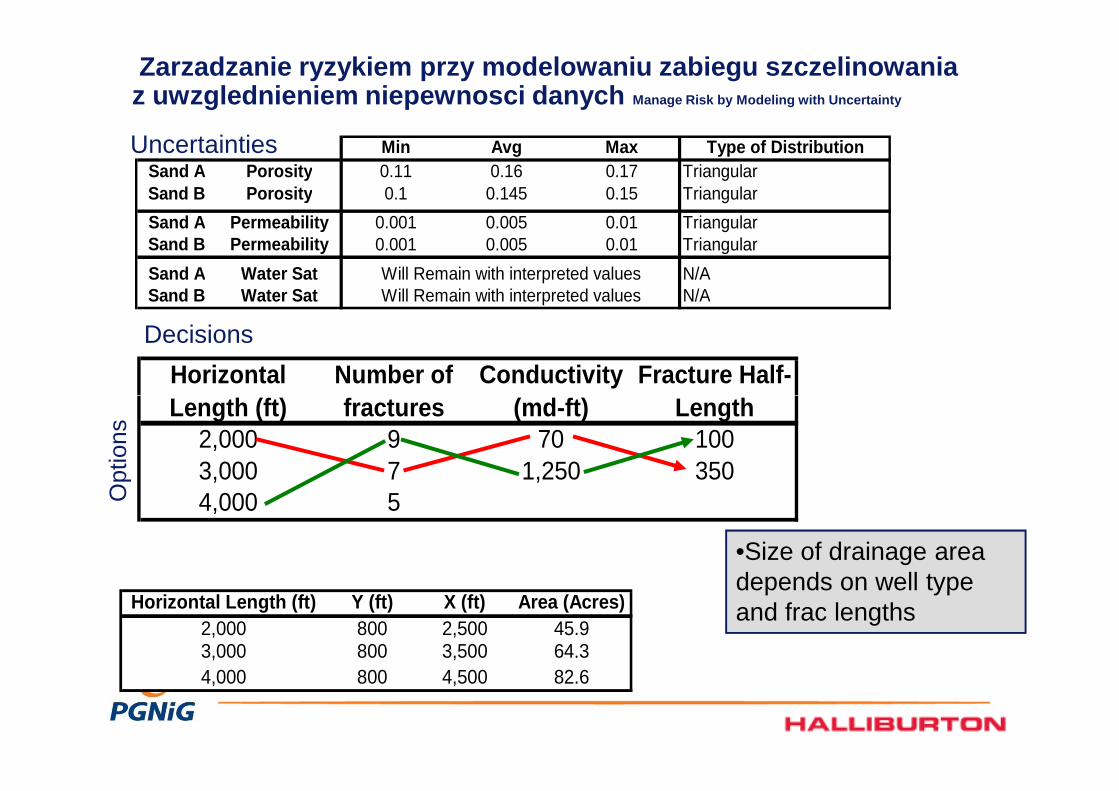
Zarzadzanie ryzykiem przy modelowaniu zabiegu szcze linowania z uwzglednieniem niepewnosci danych Manage Risk by Modeling with Uncertainty
Horizontal Length (ft)
Number of fractures
Conductivity (md-ft)
Fracture Half-Length
Decisions
Min Avg Max Type of DistributionSand A Porosity 0.11 0.16 0.17 TriangularSand B Porosity 0.1 0.145 0.15 Triangular
Sand A Permeability 0.001 0.005 0.01 TriangularSand B Permeability 0.001 0.005 0.01 Triangular
Sand A Water Sat N/ASand B Water Sat N/A
Will Remain with interpreted valuesWill Remain with interpreted values
Uncertainties
Length (ft) fractures (md-ft) Length2,000 9 70 1003,000 7 1,250 3504,000 5
Horizontal Length (ft) Y (ft) X (ft) Area (Acres)2,000 800 2,500 45.93,000 800 3,500 64.34,000 800 4,500 82.6
•Size of drainage area depends on well type and frac lengths
Opt
ions
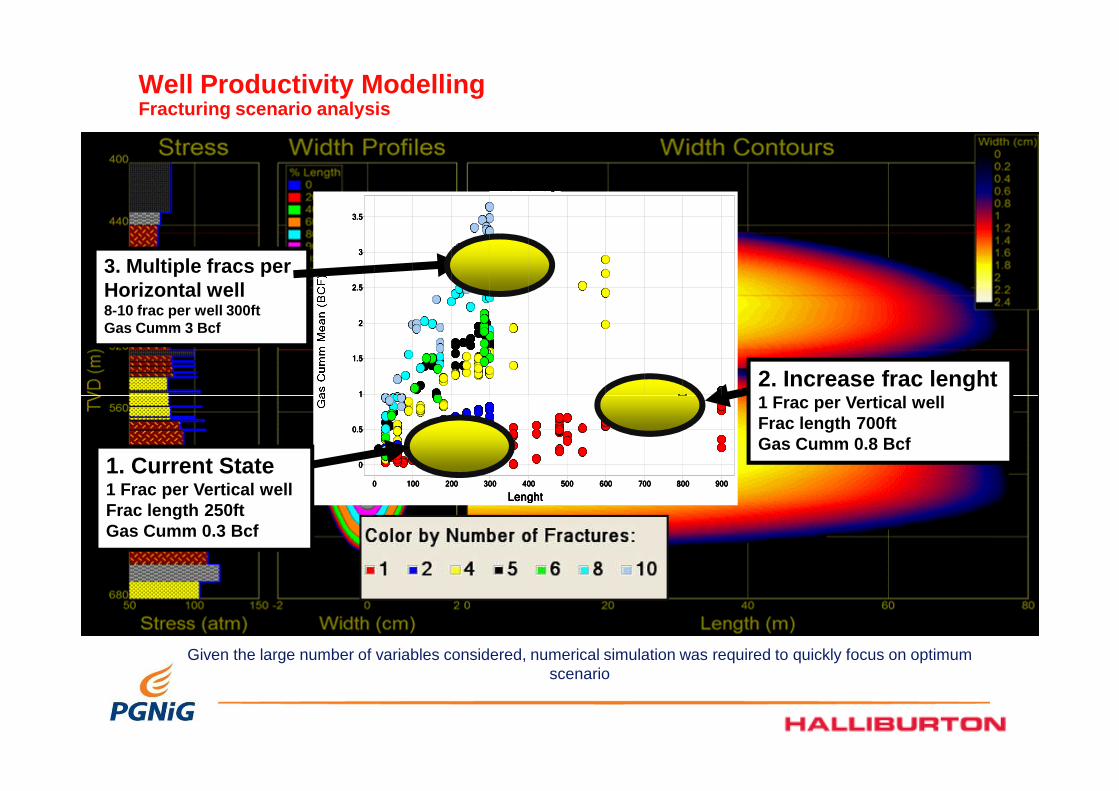
Well Productivity ModellingFracturing scenario analysis
Eff. Front. Hor. LenghtEff. Front. Hor. LenghtEff. Front. Hor. LenghtEff. Front. Hor. Lenght
1111
1.51.51.51.5
2222
2.52.52.52.5
3333
3.53.53.53.5
3. Multiple fracs perHorizontal well8-10 frac per well 300ftGas Cumm 3 Bcf
2. Increase frac lenght1 Frac per Vertical well
LenghtLenghtLenghtLenght
0000 100100100100 200200200200 300300300300 400400400400 500500500500 600600600600 700700700700 800800800800 900900900900
0000
0.50.50.50.5
1111
1. Current State1 Frac per Vertical well Frac length 250ftGas Cumm 0.3 Bcf
1 Frac per Vertical well Frac length 700ftGas Cumm 0.8 Bcf
Given the large number of variables considered, numerical simulation was required to quickly focus on optimum scenario

ASSET DECISION SOLUTIONAn Example of Possible Scenarios
RESERVOIR Typewell count enhanced method price
Conventional D vertical 5 no one 0
Tight Gas Ps horizontal 10 acidizing 10
Shale Gas S multilateral 15 fracturing 100
Decisions
Shale Gas S multilateral 15 fracturing 100
D+Ps deviated >20 advanced fracturing 1000
PS+D+Svertical to CA multilateral
Shale 50 10000
S+D shale gas 100 100000
Con_D+un_D+uncS 150
Acidizing + fracturing
Opt
ions

Analyze and Optimize
Decisions with uncertainty
• Build Integrated Asset ModelN
PV
_Mea
n
NPV_SDev
NP
V_M
ean


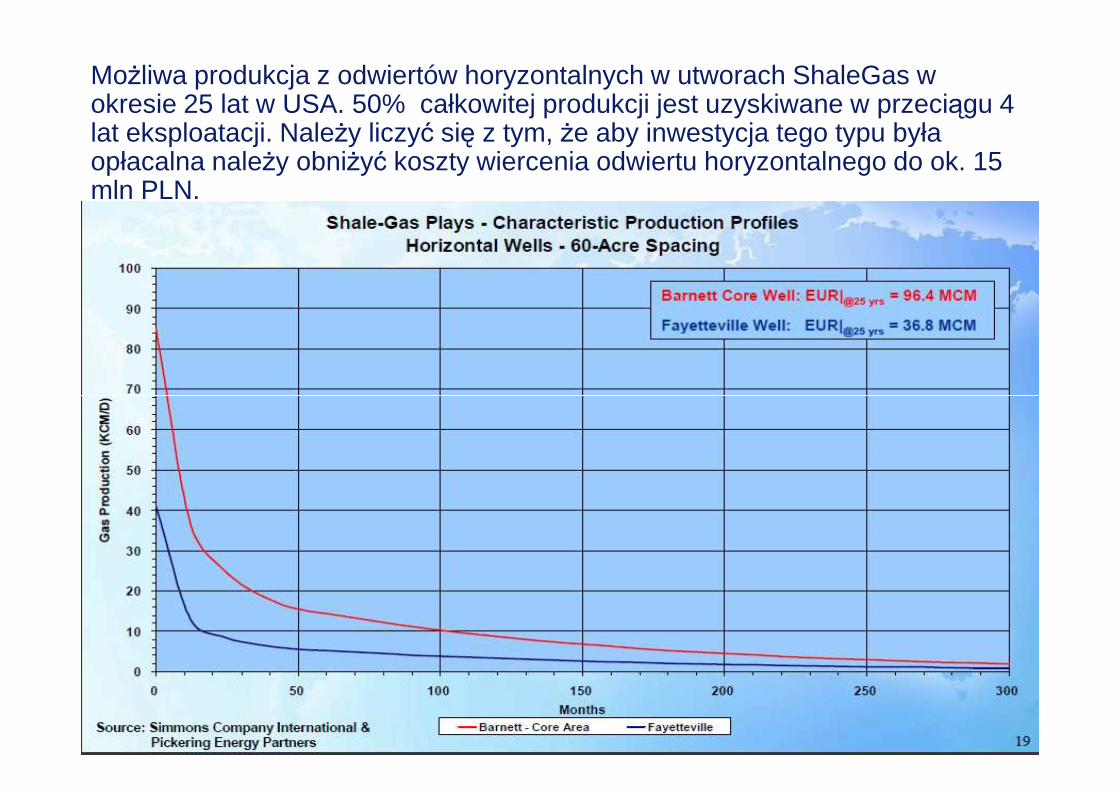
MoŜliwa produkcja z odwiertów horyzontalnych w utworach ShaleGas w okresie 25 lat w USA. 50% całkowitej produkcji jest uzyskiwane w przeciągu 4 lat eksploatacji. NaleŜy liczyć się z tym, Ŝe aby inwestycja tego typu była opłacalna naleŜy obniŜyć koszty wiercenia odwiertu horyzontalnego do ok. 15 mln PLN.
Zielona Góra, 24.04.2009 32

Zielona Góra, 24.04.2009 33