generating data from national forest monitoring and carbon ... · national forest monitoring and...
TRANSCRIPT
Click to edit
Master title style
Click to edit Master subtitle style
Generating Data from
National Forest Monitoring
and Carbon Accounting
(REDD MRV)
Alexander LotschWorld Bank
Forest Carbon Partnership Facility
“Estimating the Opportunity and Implementation Costs of REDD+ for the National Planning Process”
Bangkok, April 25-29, 2011
Session Objectives
You will understand:
– Function and Purpose of REDD MRV
– Basic methods and technologies used to map Land (Forest) Cover & Carbon
– Approach to estimate and report emissions national through MRV
– How REDD MRV activities at the national level can be harnessed to perform and improve OCA
REDD Readiness requires operational Forest Monitoring and ‘Baselines’
Two important technical activities for national REDD preparation
1. Forest Monitoring and Mapping; Carbon Accounting (Measurement, Reporting, Verification - MRV)– Remote Sensing– Field-based Sampling and/or Inventory Information
2. Reference Emission Levels (REL) and Reference Levels (RL)– ‘Baselines’ for GHG emissions and forest carbon stocks
• Historical Analysis (multi-temporal satellite image analysis)• Modeling (forward-looking)
– REL/RL will be result of climate negotiations, informed by technical studies
– Can be regional/jurisdictional (sub-national implementation on an interim basis)
Why REDD MRV?
• Let’s recall: REDD+ activities
Bali Action Plan calls for “policy approaches and positive incentives on issues relating
to reducing emissions from (1) deforestation and (2) forest degradation; and the role of (3) conservation, (4) sustainable management of forests and (5) enhancement of forest carbon stocks in developing countries”.
• REDD MRV system– Tracks changes in forest carbon associated with drivers of forest cover change
– Compares trends in forest carbon to a ‘baseline’ (REL/RL)
– Measures performance (of REDD policies)
– Generates data for carbon accounting and reporting
• But it encompasses more than just carbon:– Monitoring of drivers (for policy design/intervention)
– ‘co-benefits’: biodiversity; water; livelihoods, community participation etc.
• MRV system will not (necessarily) generate land-use maps (needed for OCA), but rather forest carbon maps and emission estimates
Early MRV system design considerations
First countries need to …• Identify the drivers of forest cover change• Choose REDD+ options (which activities?)• Assess capacities• Understand (and ultimately quantify) forest trends
… and then design the MRV system accordingly:• What will be monitored (D, D, or +)? And how?• Develop data and capacity• Institutional arrangements: Who does what (best)? • Use info from monitoring for policy design: no performance – no
payment
Core activities and design ideas are defined in country-owned REDD readiness preparation proposals (R-PPs)
Significance of Emission Sources
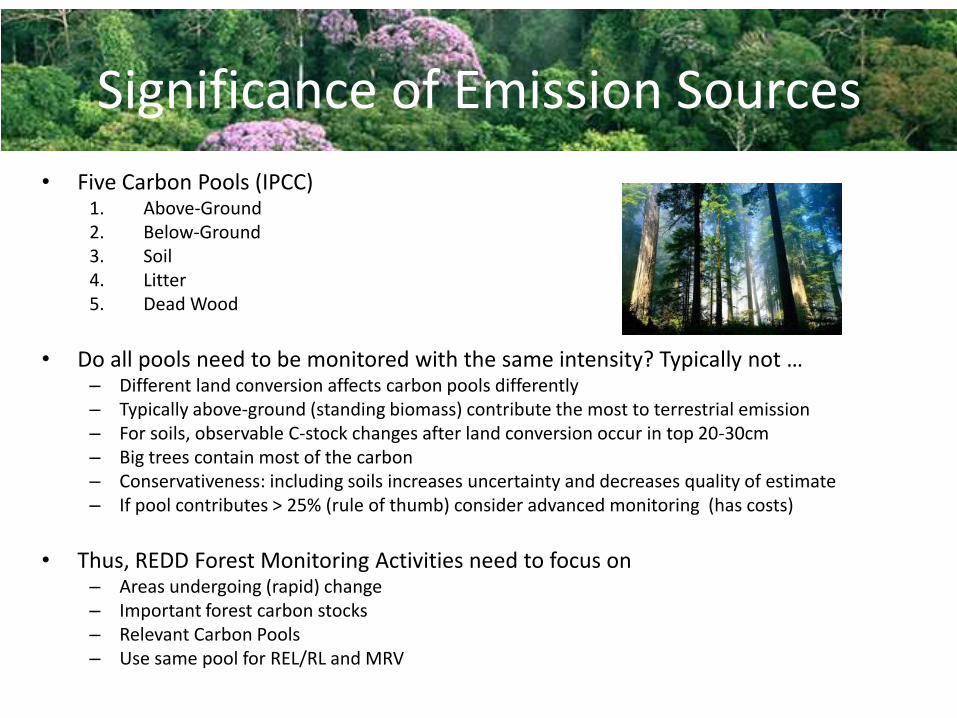
• Five Carbon Pools (IPCC)1. Above-Ground2. Below-Ground3. Soil4. Litter5. Dead Wood
• Do all pools need to be monitored with the same intensity? Typically not … – Different land conversion affects carbon pools differently– Typically above-ground (standing biomass) contribute the most to terrestrial emission– For soils, observable C-stock changes after land conversion occur in top 20-30cm– Big trees contain most of the carbon– Conservativeness: including soils increases uncertainty and decreases quality of estimate– If pool contributes > 25% (rule of thumb) consider advanced monitoring (has costs)
• Thus, REDD Forest Monitoring Activities need to focus on– Areas undergoing (rapid) change– Important forest carbon stocks– Relevant Carbon Pools– Use same pool for REL/RL and MRV
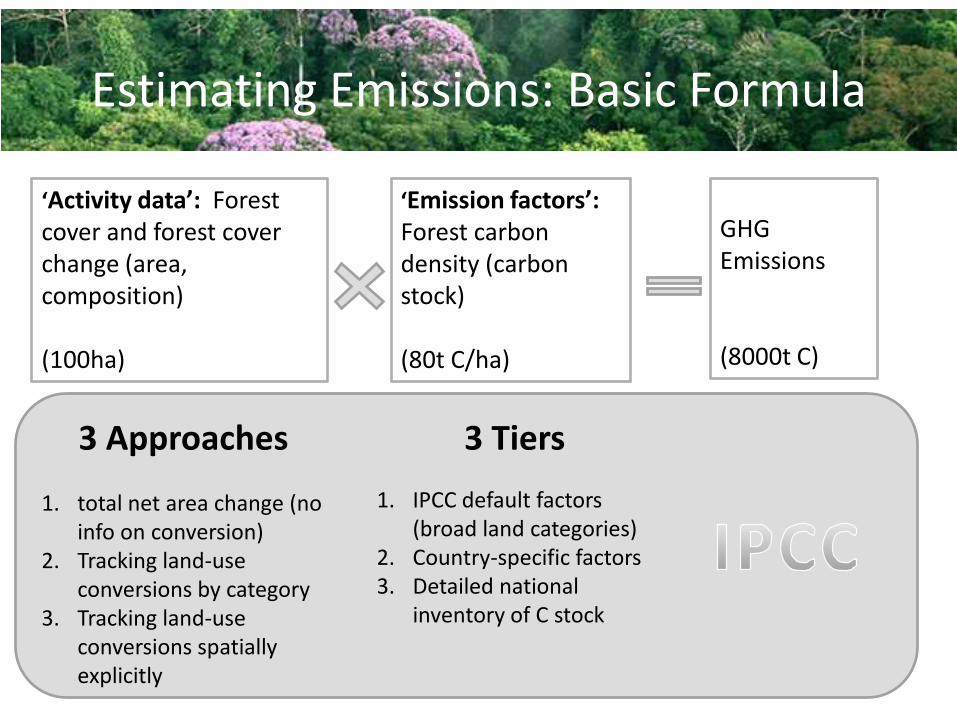
Estimating Emissions: Basic Formula
‘Activity data’: Forest cover and forest cover change (area, composition)
(100ha)
‘Emission factors’: Forest carbon density (carbon stock)
(80t C/ha)
GHG Emissions
(8000t C)
3 Approaches
1. total net area change (no info on conversion)
2. Tracking land-use conversions by category
3. Tracking land-use conversions spatially explicitly
3 Tiers
1. IPCC default factors (broad land categories)
2. Country-specific factors3. Detailed national
inventory of C stock
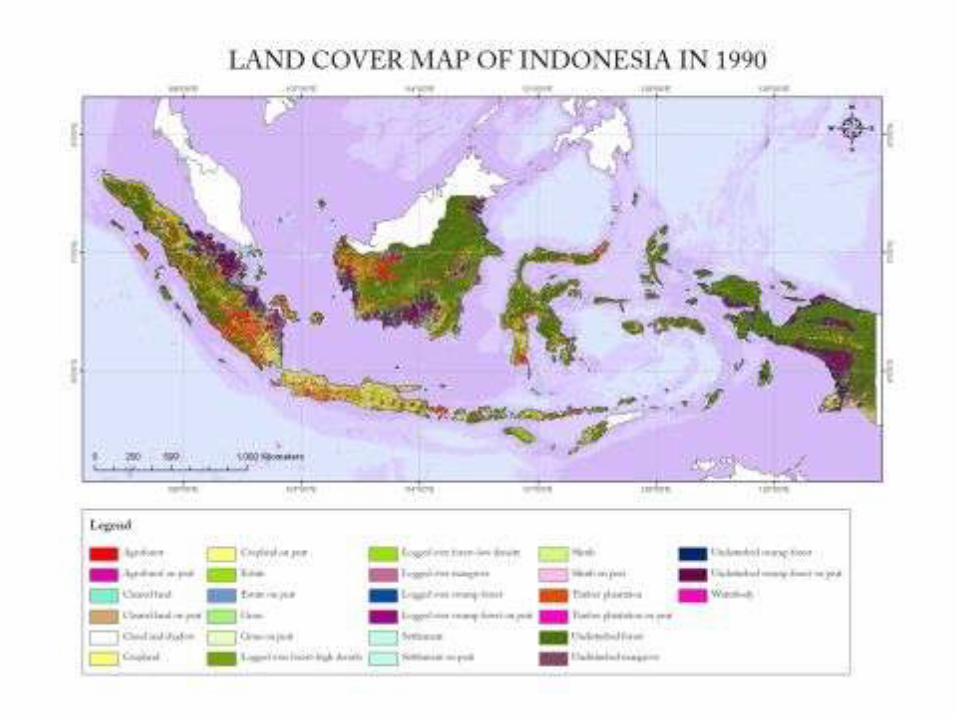
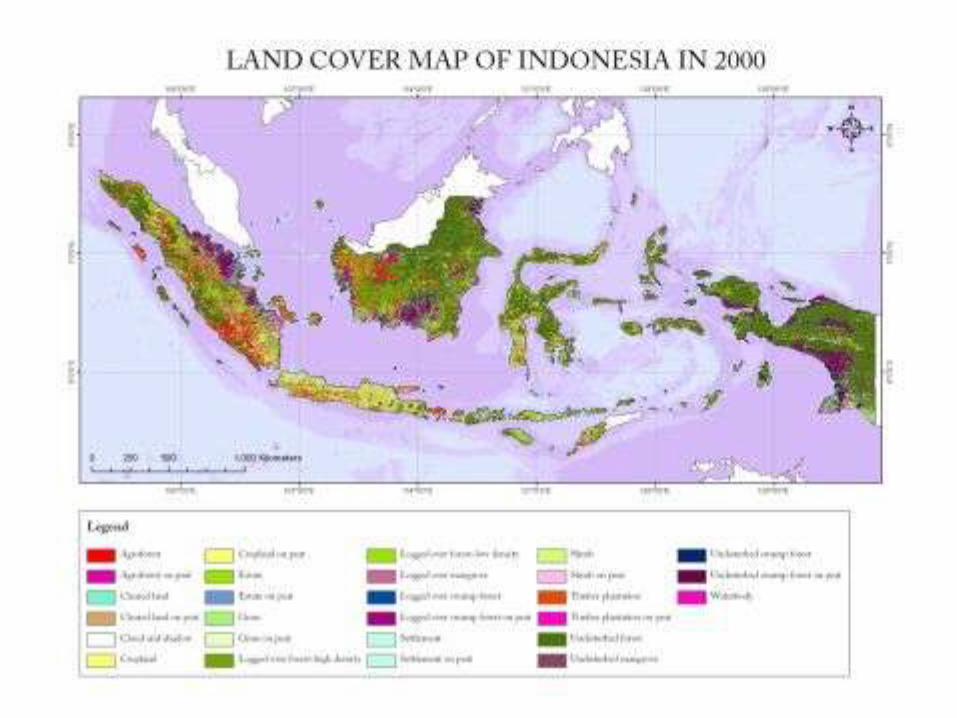
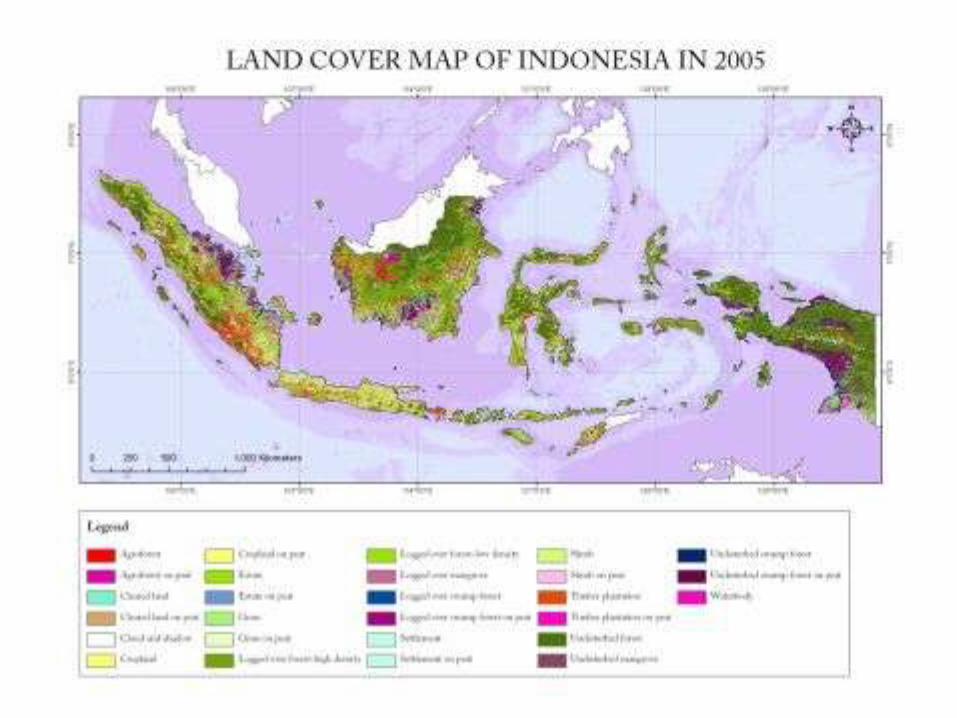
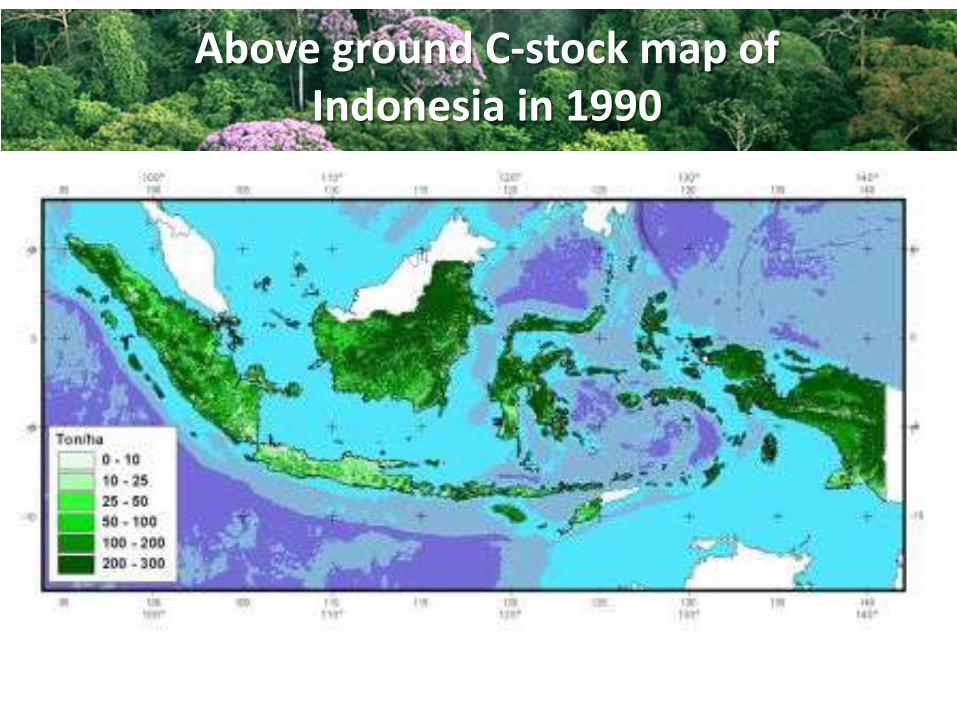
Above ground C-stock map of Indonesia in 1990
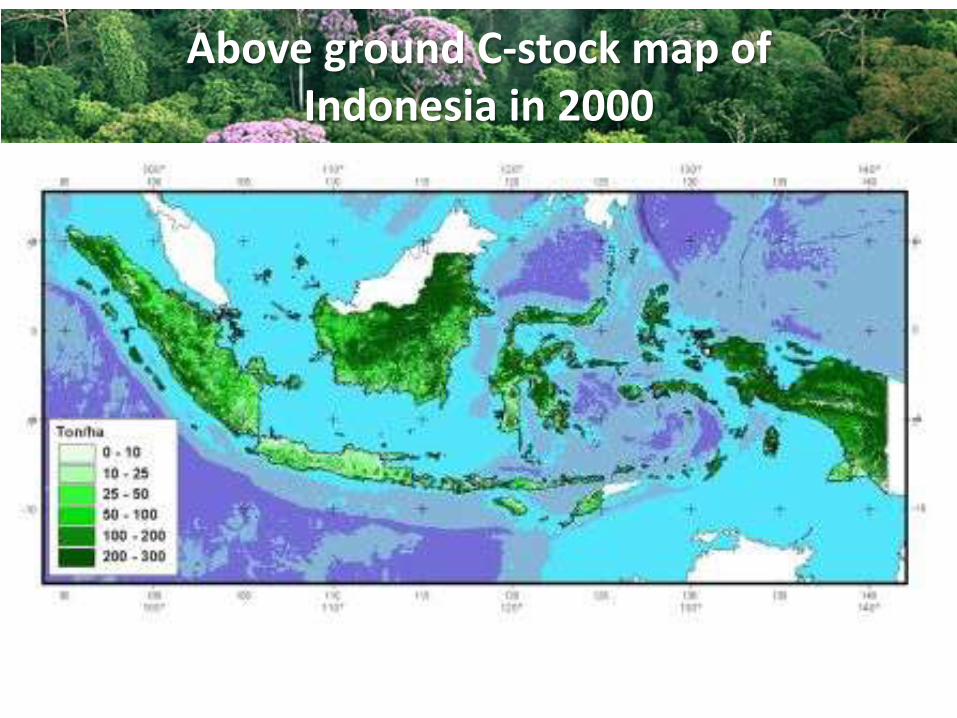
Above ground C-stock map of Indonesia in 2000
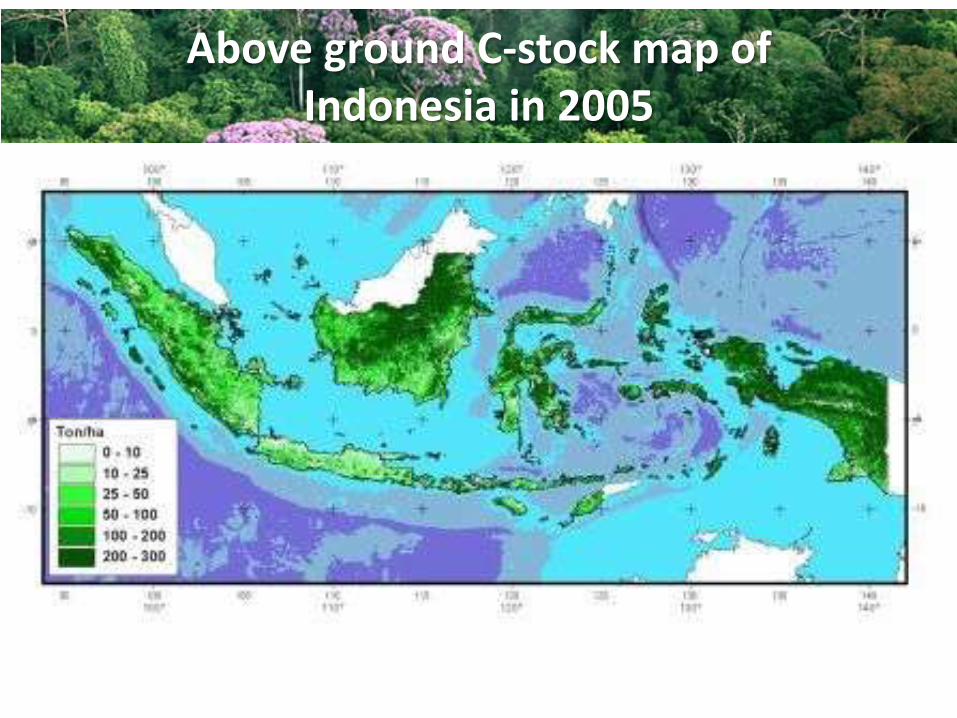
Above ground C-stock map of Indonesia in 2005
What does this entail?
1. Mapping forests and forest cover change using satellites– Cost-effective– Determine forest/non-forest area and canopy density– Only above-ground biomass– Many new sources of satellite data
2. Forest carbon density– Derived from ‘inventories’ (is a national forest inventory necessary?!)
and field methods– Many countries have not had a forest inventories in decades– REDD requires information on carbon (not volume or biomass)
3. Estimate and report emissions– Following established protocols (IPCC good practice guidance and
IPCC guidelines)– Complex: needs capacity building and simple ‘tools’ to get started
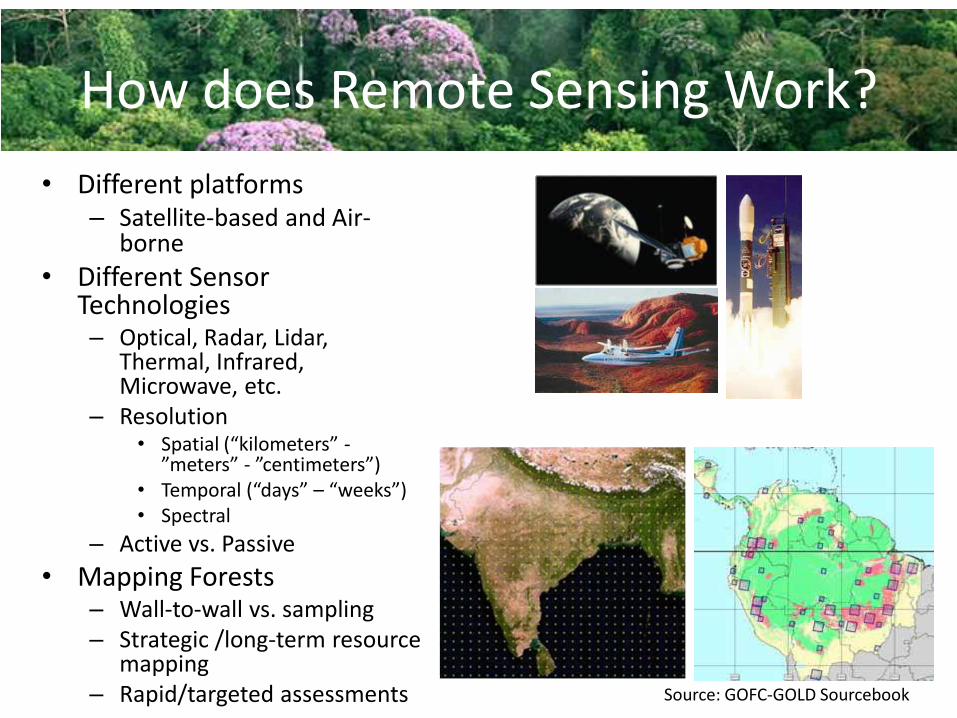
How does Remote Sensing Work?
• Different platforms– Satellite-based and Air-
borne
• Different Sensor Technologies– Optical, Radar, Lidar,
Thermal, Infrared, Microwave, etc.
– Resolution • Spatial (“kilometers” -
”meters” - ”centimeters”)• Temporal (“days” – “weeks”)• Spectral
– Active vs. Passive
• Mapping Forests– Wall-to-wall vs. sampling– Strategic /long-term resource
mapping– Rapid/targeted assessments Source: GOFC-GOLD Sourcebook
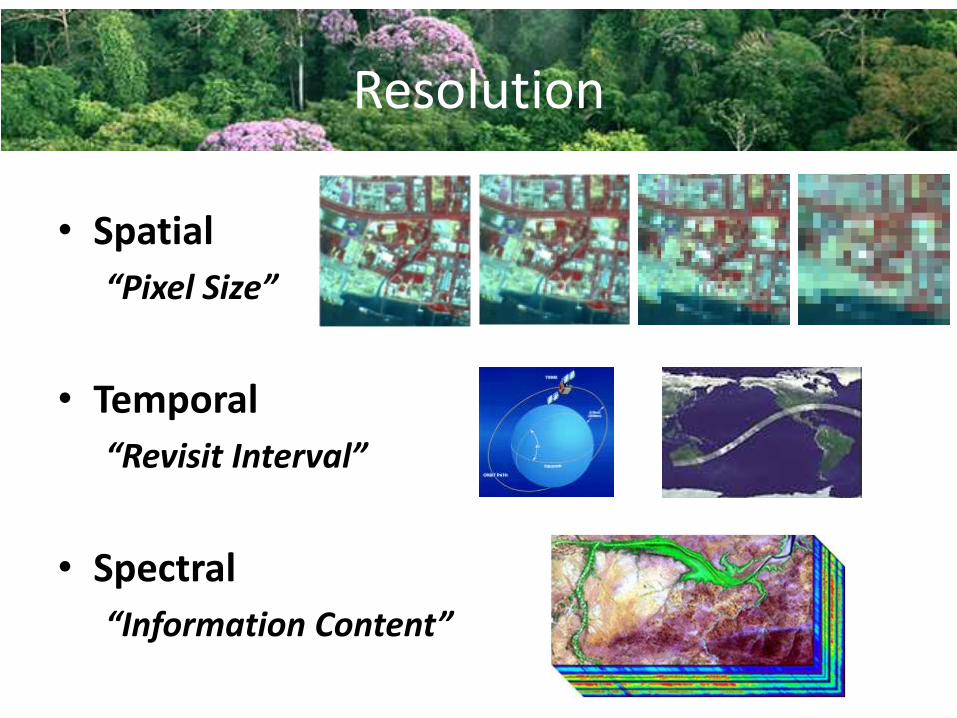
Resolution
• Spatial
“Pixel Size”
• Temporal
“Revisit Interval”
• Spectral
“Information Content”
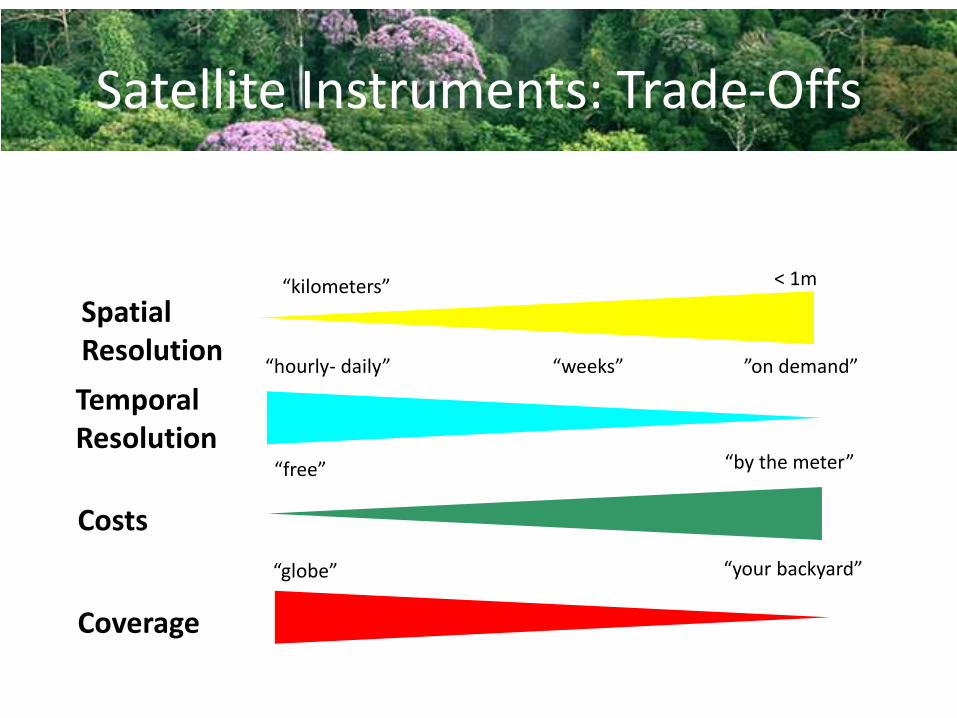
Satellite Instruments: Trade-Offs
Spatial Resolution
Temporal Resolution
Costs
Coverage
“kilometers” < 1m
“hourly- daily” “weeks” ”on demand”
“free” “by the meter”
“globe” “your backyard”
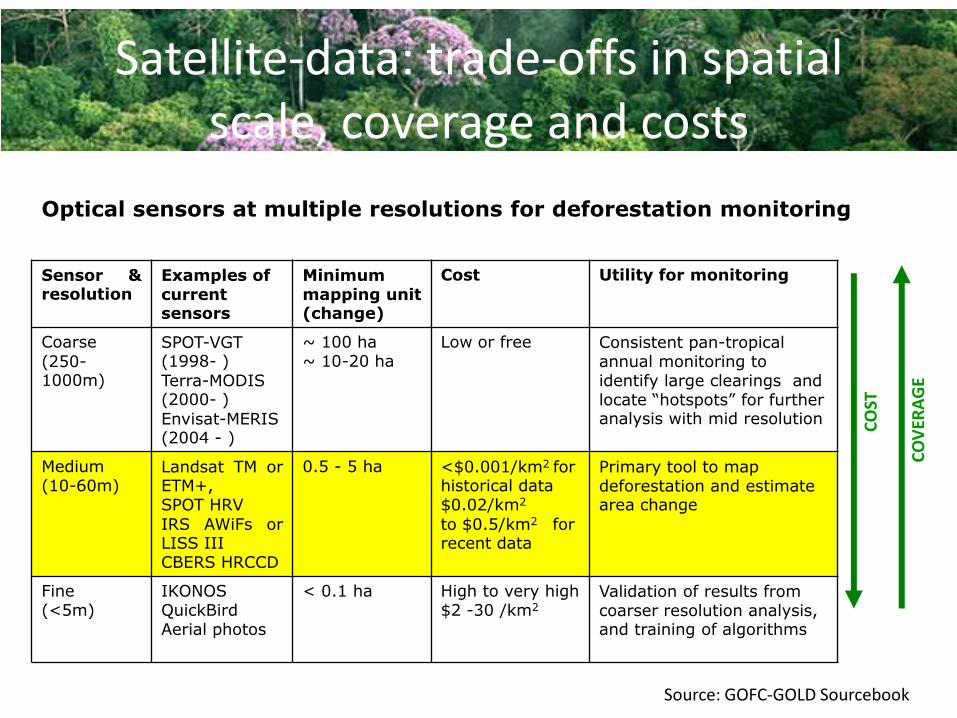
Satellite-data: trade-offs in spatial scale, coverage and costs
Sensor &resolution
Examples of current sensors
Minimummapping unit(change)
Cost Utility for monitoring
Coarse
(250-1000m)
SPOT-VGT(1998- )
Terra-MODIS(2000- )
Envisat-MERIS(2004 - )
~ 100 ha ~ 10-20 ha
Low or free Consistent pan-tropical annual monitoring to identify large clearings and locate “hotspots” for further analysis with mid resolution
Medium(10-60m)
Landsat TM orETM+,SPOT HRV
IRS AWiFs orLISS IIICBERS HRCCD
0.5 - 5 ha <$0.001/km2 for historical data$0.02/km2
to $0.5/km2 for recent data
Primary tool to map deforestation and estimate area change
Fine(<5m)
IKONOSQuickBirdAerial photos
< 0.1 ha High to very high$2 -30 /km2
Validation of results from coarser resolution analysis, and training of algorithms
Optical sensors at multiple resolutions for deforestation monitoring
CO
ST
CO
VER
AG
E
Source: GOFC-GOLD Sourcebook
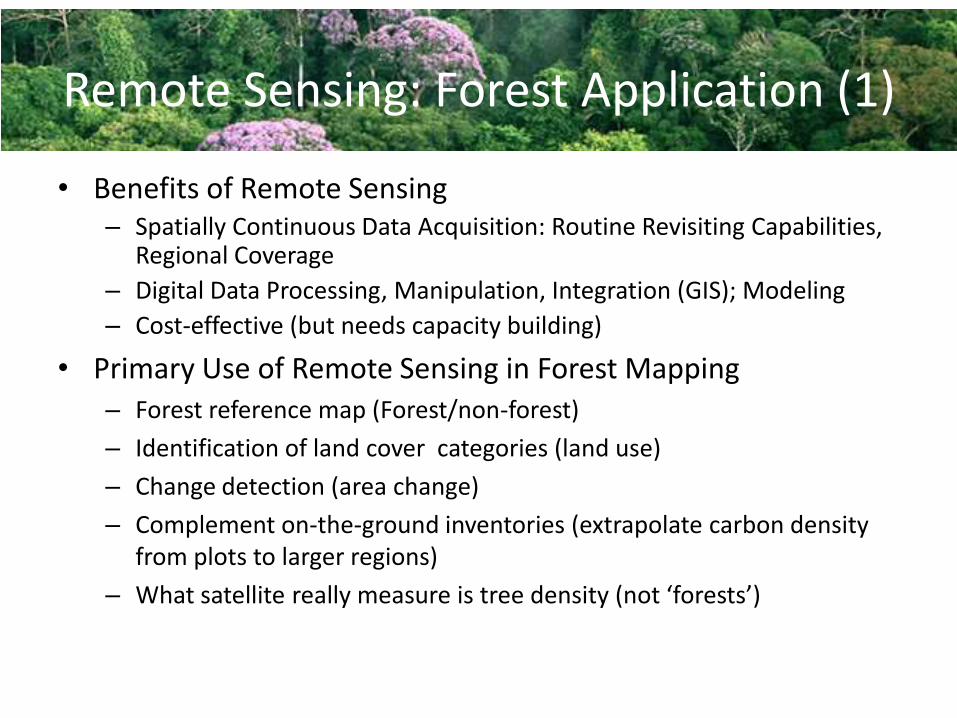
Remote Sensing: Forest Application (1)
• Benefits of Remote Sensing– Spatially Continuous Data Acquisition: Routine Revisiting Capabilities,
Regional Coverage
– Digital Data Processing, Manipulation, Integration (GIS); Modeling
– Cost-effective (but needs capacity building)
• Primary Use of Remote Sensing in Forest Mapping– Forest reference map (Forest/non-forest)
– Identification of land cover categories (land use)
– Change detection (area change)
– Complement on-the-ground inventories (extrapolate carbon density from plots to larger regions)
– What satellite really measure is tree density (not ‘forests’)
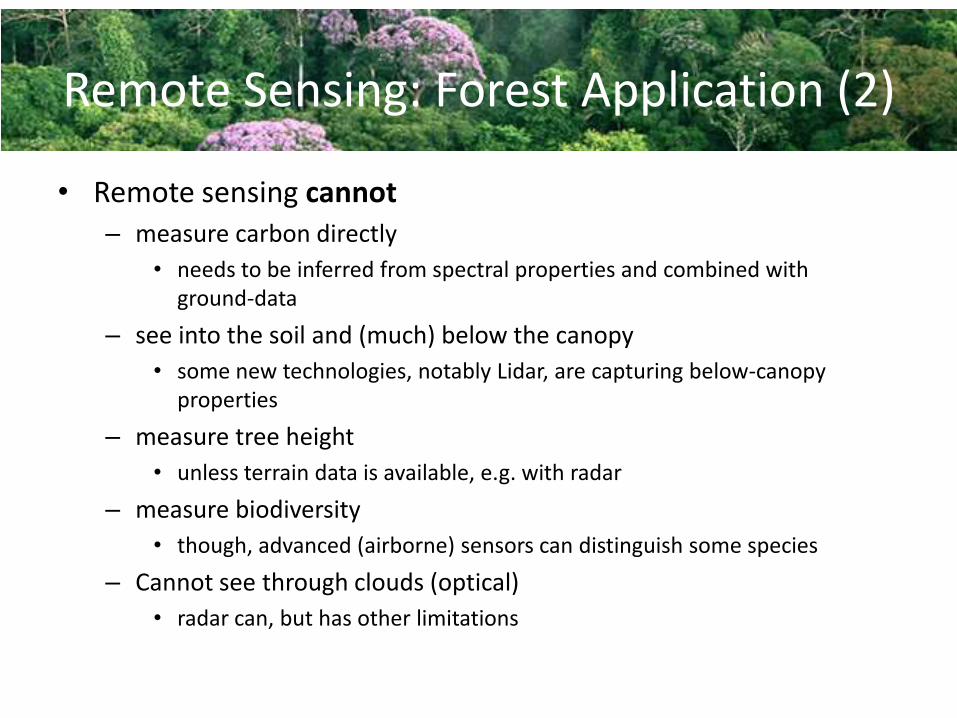
Remote Sensing: Forest Application (2)
• Remote sensing cannot– measure carbon directly
• needs to be inferred from spectral properties and combined with ground-data
– see into the soil and (much) below the canopy
• some new technologies, notably Lidar, are capturing below-canopy properties
– measure tree height
• unless terrain data is available, e.g. with radar
– measure biodiversity
• though, advanced (airborne) sensors can distinguish some species
– Cannot see through clouds (optical)
• radar can, but has other limitations
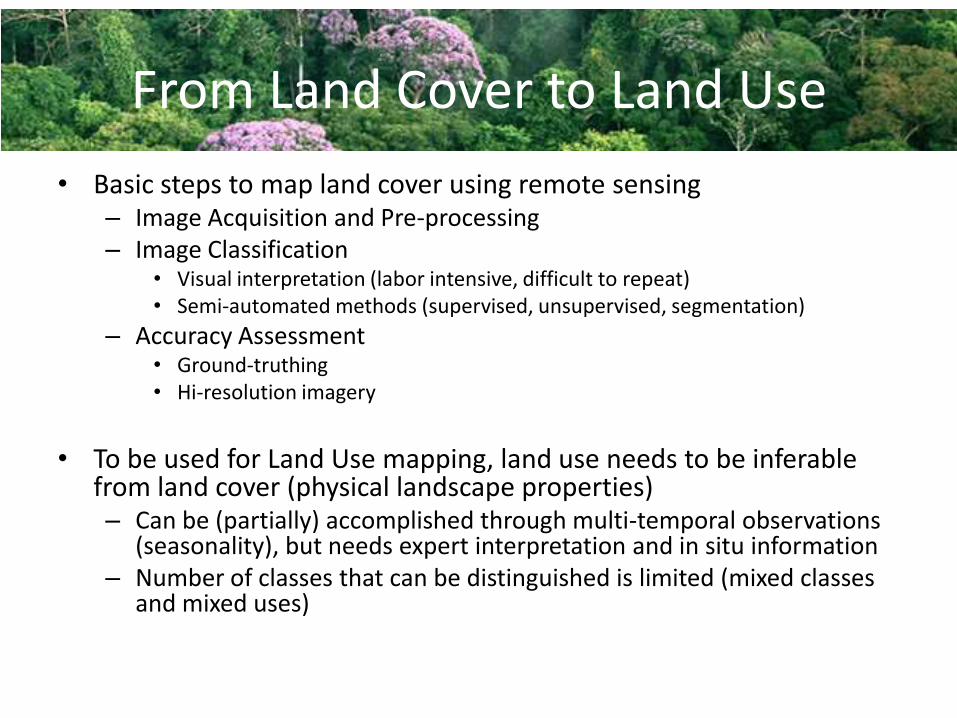
From Land Cover to Land Use
• Basic steps to map land cover using remote sensing– Image Acquisition and Pre-processing– Image Classification
• Visual interpretation (labor intensive, difficult to repeat)• Semi-automated methods (supervised, unsupervised, segmentation)
– Accuracy Assessment• Ground-truthing• Hi-resolution imagery
• To be used for Land Use mapping, land use needs to be inferable from land cover (physical landscape properties)– Can be (partially) accomplished through multi-temporal observations
(seasonality), but needs expert interpretation and in situ information– Number of classes that can be distinguished is limited (mixed classes
and mixed uses)
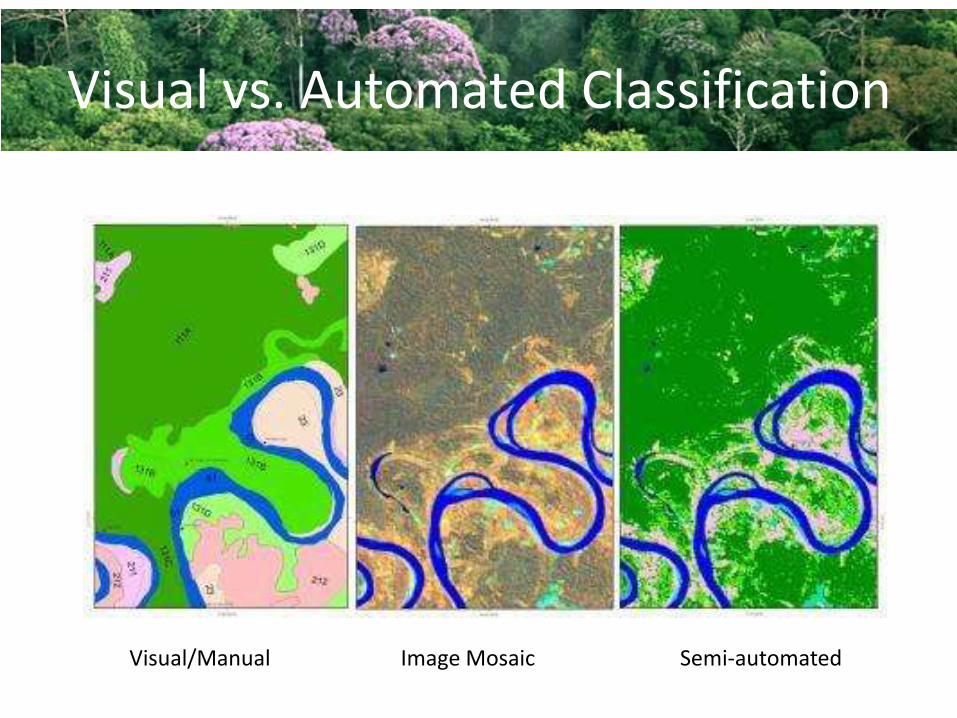
Visual vs. Automated Classification
Visual/Manual Image Mosaic Semi-automated
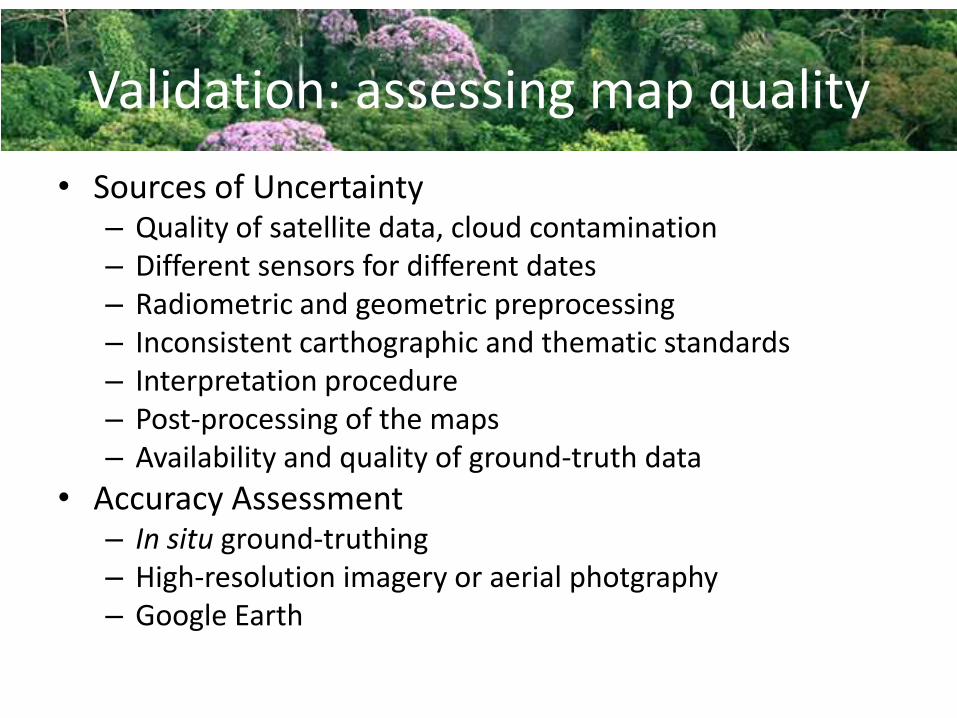
Validation: assessing map quality
• Sources of Uncertainty– Quality of satellite data, cloud contamination– Different sensors for different dates– Radiometric and geometric preprocessing– Inconsistent carthographic and thematic standards– Interpretation procedure– Post-processing of the maps– Availability and quality of ground-truth data
• Accuracy Assessment– In situ ground-truthing– High-resolution imagery or aerial photgraphy– Google Earth
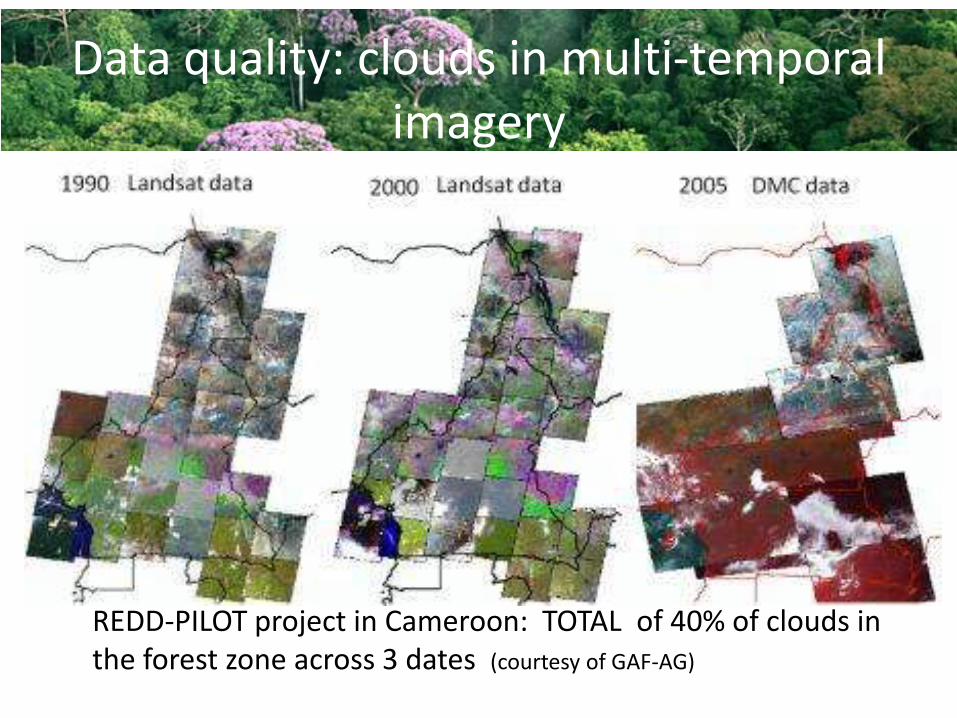
Data quality: clouds in multi-temporal imagery
REDD-PILOT project in Cameroon: TOTAL of 40% of clouds in the forest zone across 3 dates (courtesy of GAF-AG)
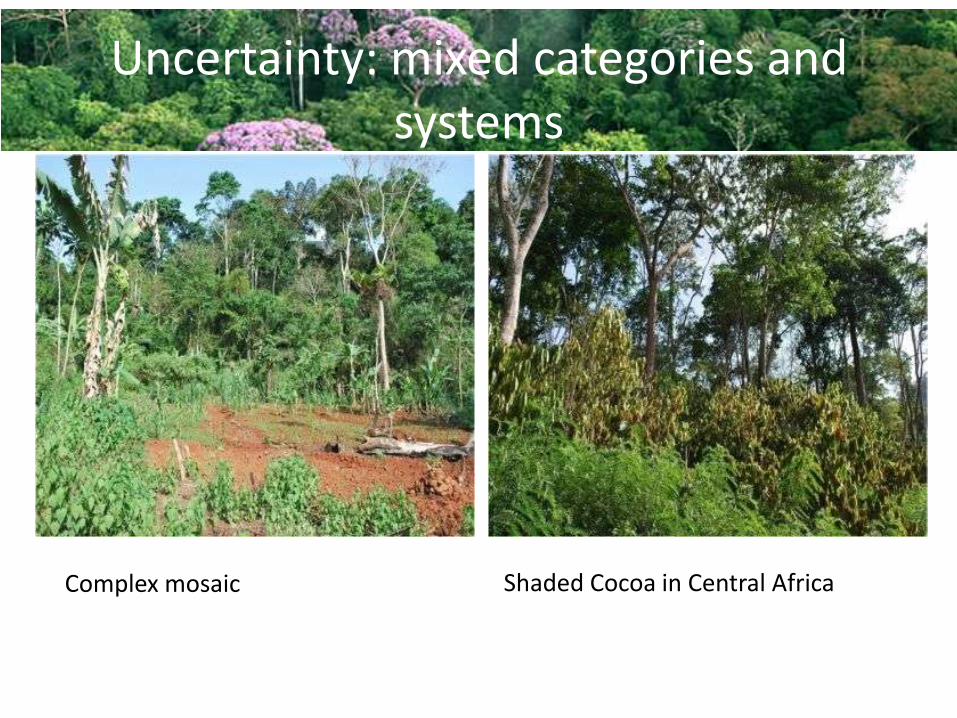
Uncertainty: mixed categories and systems
Shaded Cocoa in Central AfricaComplex mosaic
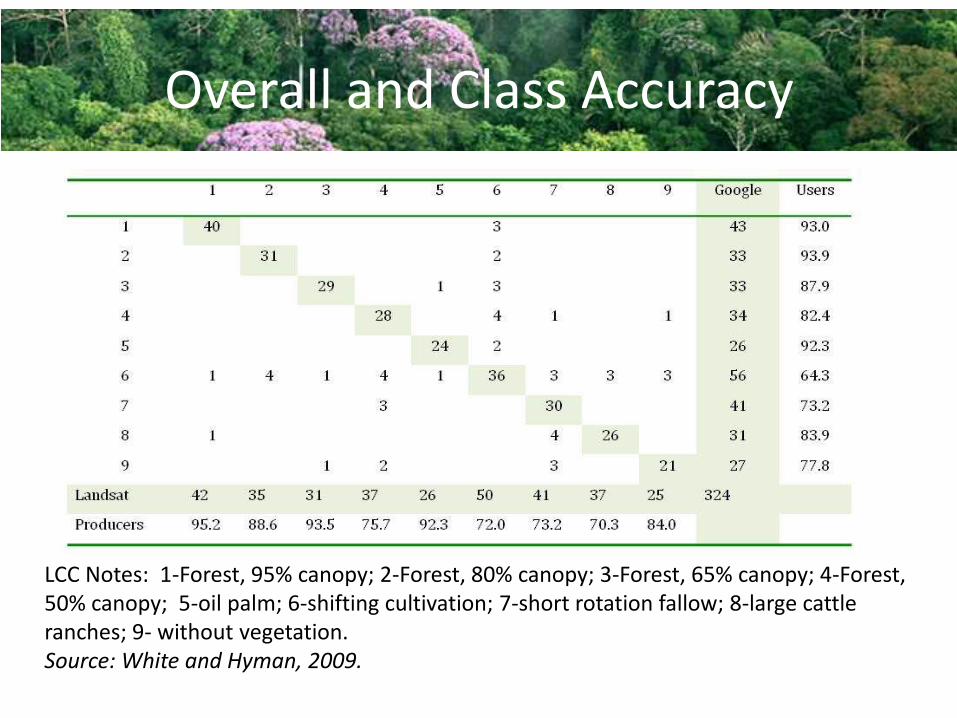
Overall and Class Accuracy
LCC Notes: 1-Forest, 95% canopy; 2-Forest, 80% canopy; 3-Forest, 65% canopy; 4-Forest, 50% canopy; 5-oil palm; 6-shifting cultivation; 7-short rotation fallow; 8-large cattle ranches; 9- without vegetation. Source: White and Hyman, 2009.
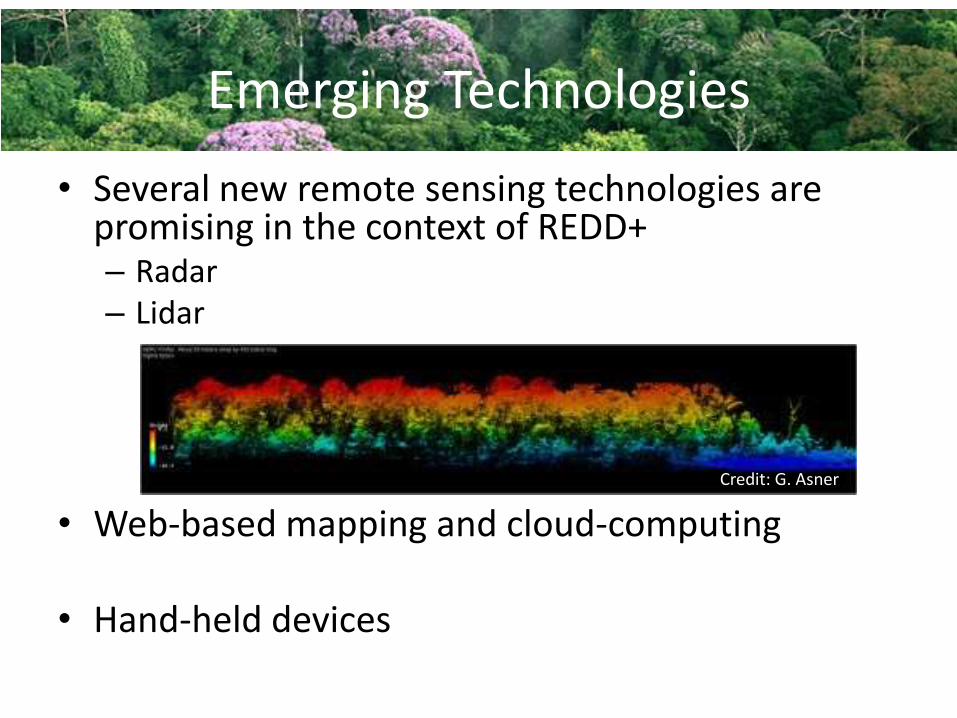
Emerging Technologies
• Several new remote sensing technologies are promising in the context of REDD+– Radar– Lidar
• Web-based mapping and cloud-computing
• Hand-held devices
Credit: G. Asner
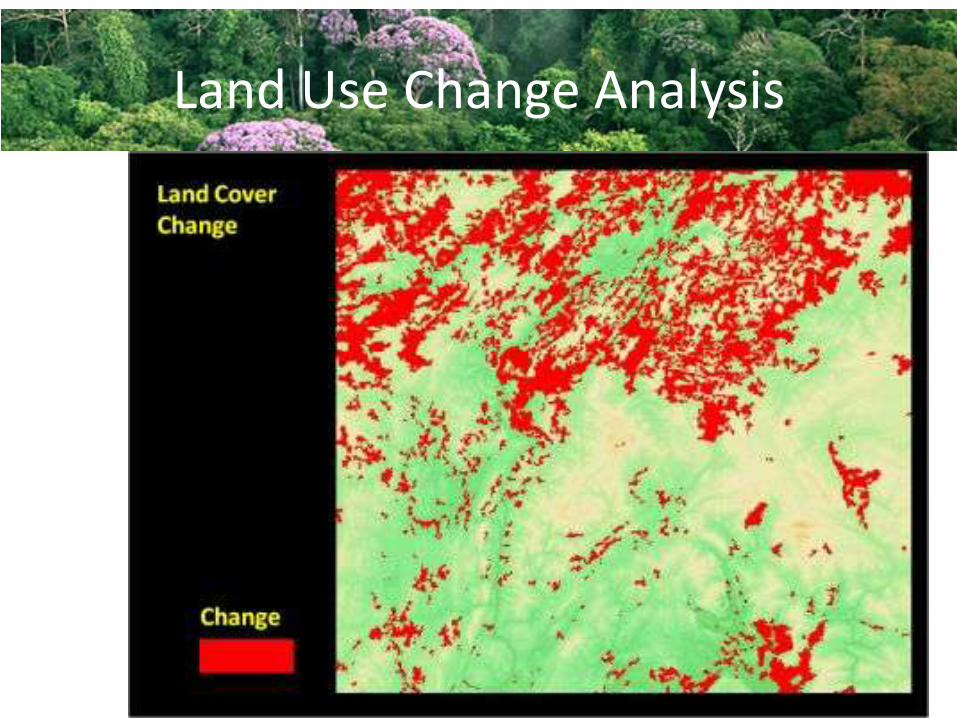
Land Use Change Analysis
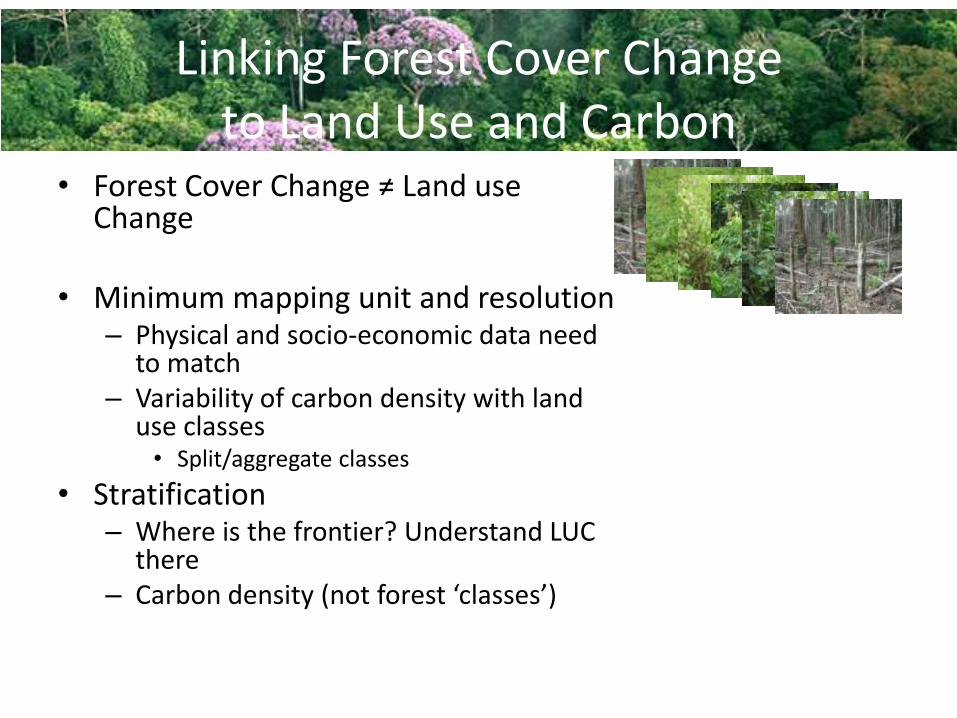
Linking Forest Cover Change to Land Use and Carbon
• Forest Cover Change ≠ Land use Change
• Minimum mapping unit and resolution– Physical and socio-economic data need
to match– Variability of carbon density with land
use classes• Split/aggregate classes
• Stratification– Where is the frontier? Understand LUC
there– Carbon density (not forest ‘classes’)
From Land Cover to Emissions: Sources of Uncertainty
• Estimates of Forest Cover depend on– Technology used– Definition of Land Cover classes and forest– Methodology used
• Estimates of Deforestation rate depend on– Forest cover data– Definition of Deforestation (forest definition defines boundary
between ‘deforestation’ and ‘degradation’)– Spatial and temporal scale, baseline period
• Estimates of Emissions depend on– All of the above– Quality of Carbon stock data (Tier)– Pools monitored– Deforestation and Degradation– Net or Gross? (Regeneration/regrowth)
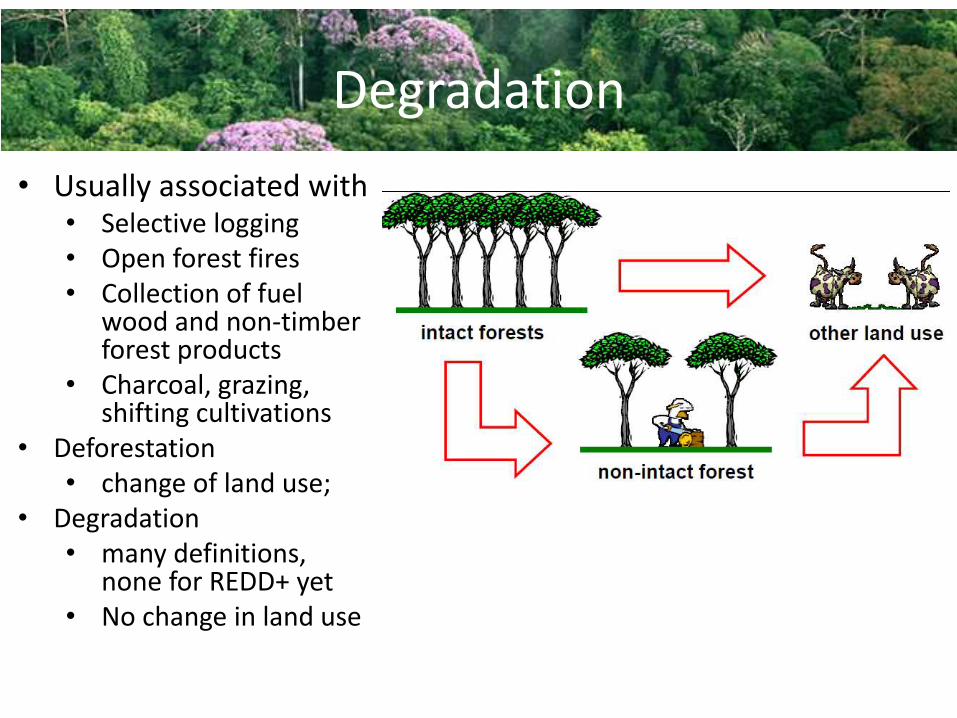
Degradation
• Usually associated with• Selective logging• Open forest fires• Collection of fuel
wood and non-timberforest products
• Charcoal, grazing, shifting cultivations
• Deforestation• change of land use;
• Degradation• many definitions,
none for REDD+ yet• No change in land use
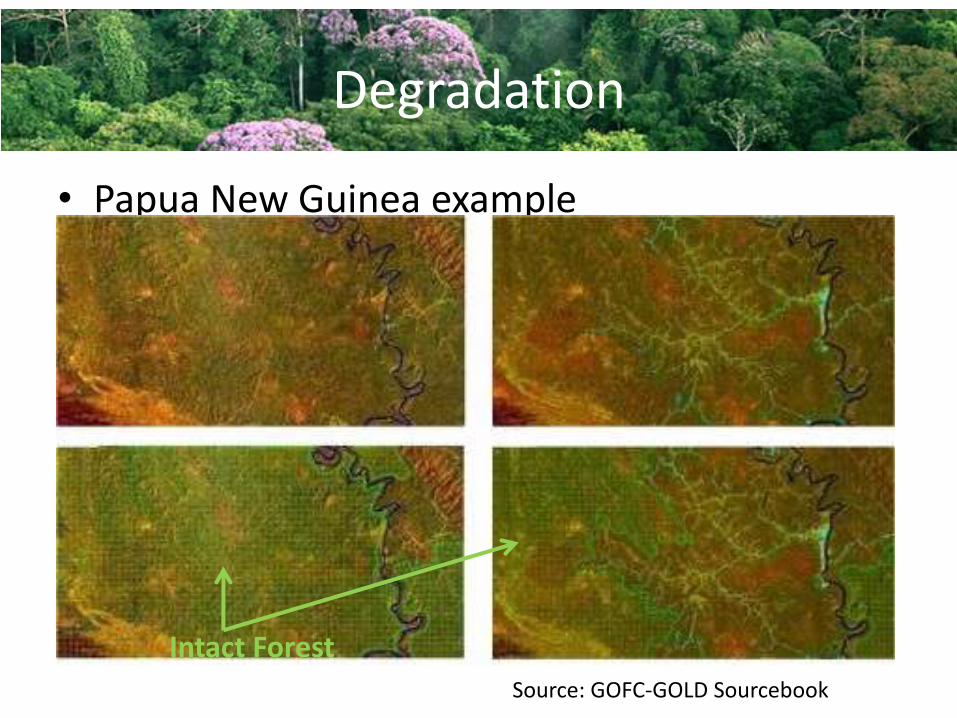
Degradation
• Papua New Guinea example
Source: GOFC-GOLD Sourcebook
Intact Forest
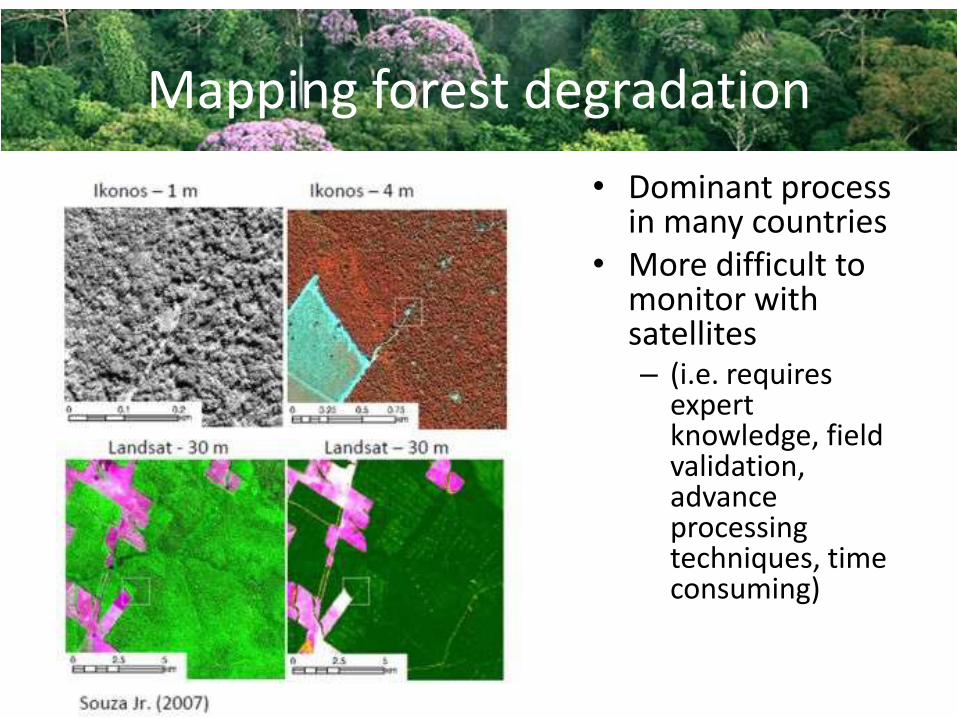
Mapping forest degradation
• Dominant process in many countries
• More difficult to monitor with satellites – (i.e. requires
expert knowledge, field validation, advance processing techniques, time consuming)

Role of Forest Communities in MRV
• Plots, People, Pixels
– Role of Communities in National REDD Planning?
Pixels
Plots
Credit: Baccini & Walker
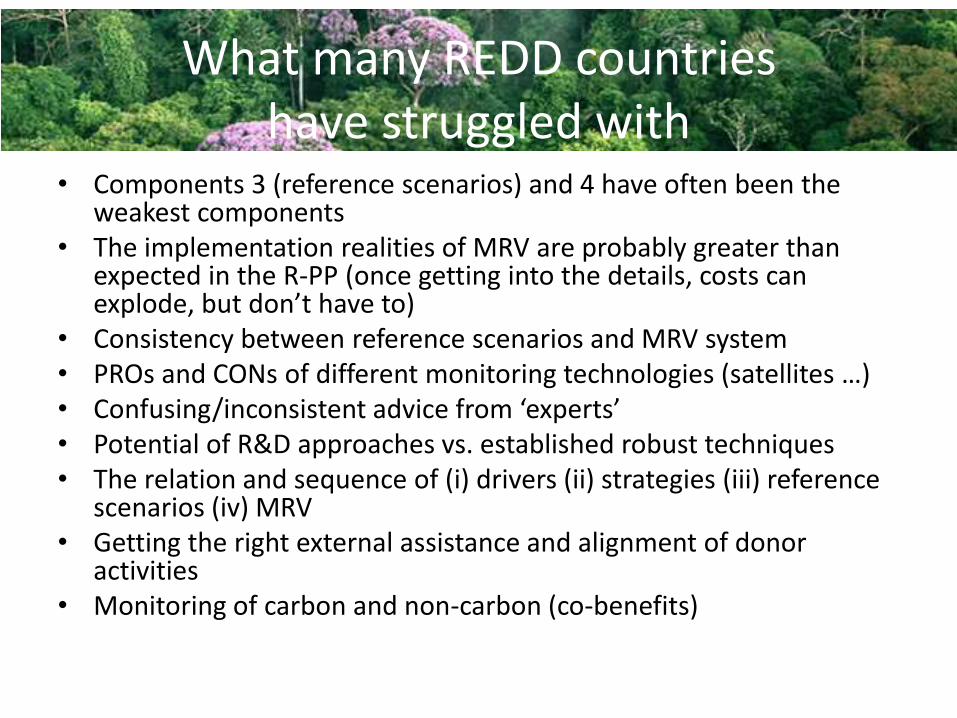
What many REDD countries have struggled with
• Components 3 (reference scenarios) and 4 have often been the weakest components
• The implementation realities of MRV are probably greater than expected in the R-PP (once getting into the details, costs can explode, but don’t have to)
• Consistency between reference scenarios and MRV system• PROs and CONs of different monitoring technologies (satellites …)• Confusing/inconsistent advice from ‘experts’• Potential of R&D approaches vs. established robust techniques• The relation and sequence of (i) drivers (ii) strategies (iii) reference
scenarios (iv) MRV• Getting the right external assistance and alignment of donor
activities• Monitoring of carbon and non-carbon (co-benefits)
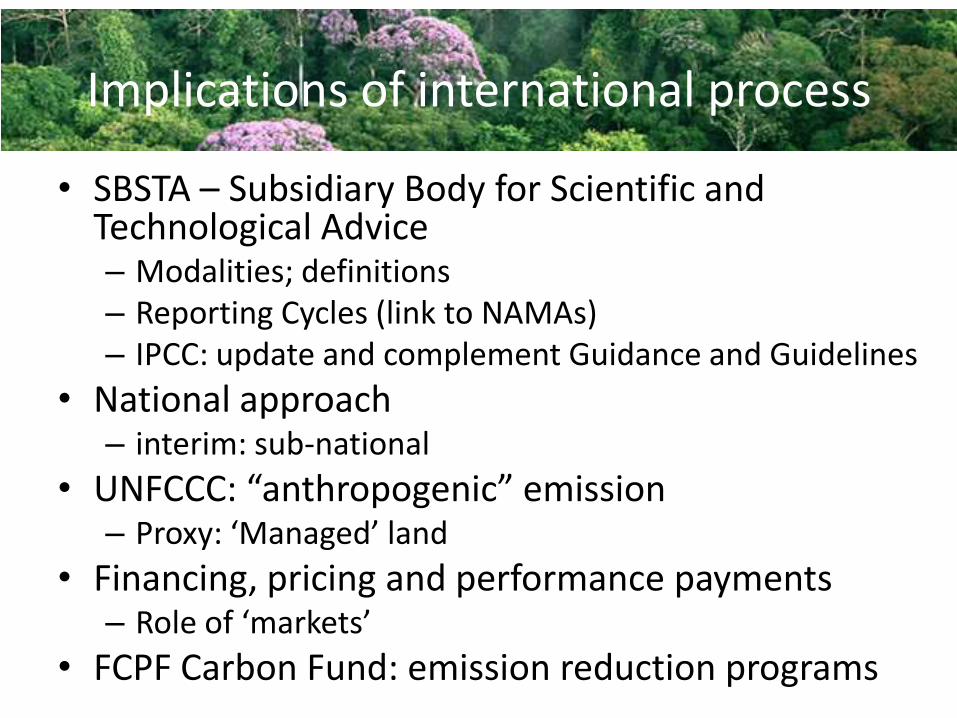
Implications of international process
• SBSTA – Subsidiary Body for Scientific and Technological Advice– Modalities; definitions – Reporting Cycles (link to NAMAs)– IPCC: update and complement Guidance and Guidelines
• National approach – interim: sub-national
• UNFCCC: “anthropogenic” emission– Proxy: ‘Managed’ land
• Financing, pricing and performance payments– Role of ‘markets’
• FCPF Carbon Fund: emission reduction programs
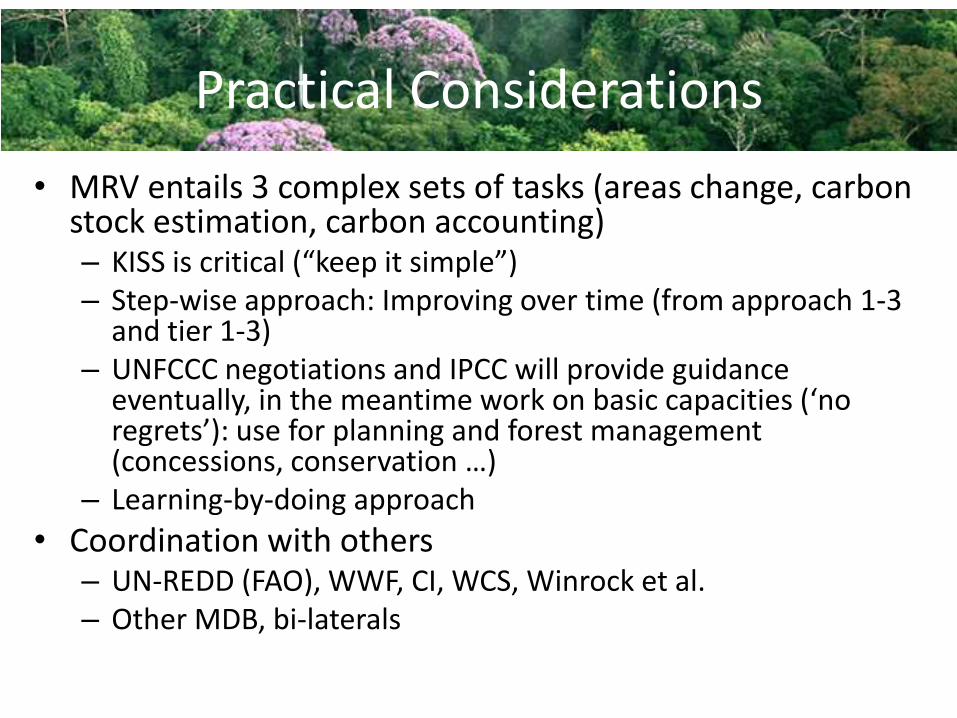
Practical Considerations
• MRV entails 3 complex sets of tasks (areas change, carbon stock estimation, carbon accounting)– KISS is critical (“keep it simple”)– Step-wise approach: Improving over time (from approach 1-3
and tier 1-3)– UNFCCC negotiations and IPCC will provide guidance
eventually, in the meantime work on basic capacities (‘no regrets’): use for planning and forest management (concessions, conservation …)
– Learning-by-doing approach
• Coordination with others– UN-REDD (FAO), WWF, CI, WCS, Winrock et al.– Other MDB, bi-laterals
More considerations
• Desired ‘national systems’ are the end-point of REDD-Readiness– Requires long-term (5-10? years) and sustained effort of technical
assistance
• A critical first task is to perform a comprehensive review of capacity building and data needs (‘gap analysis’)
• Preliminary analysis should indentify the carbon pools that will be targeted by MRV
• REDD+ encompasses a total of 5 activities – each requires a tailored MRV approach– Which are the activities that have been identified/prioritized?
• Having intermediate outputs and demonstrating performance early will be essential to maintain momentum (donor interest, private sector, market development)– How can MRV efforts be phased?