gender disparity - desorissa.nic.indesorissa.nic.in/pdf/lt_publication/gender...
TRANSCRIPT

4
GENDER DISPARITY ODISHA, 2010
Directorate of Economics and Statistics, Odisha, Bhubaneswar

5
GENDER DISPARITY ODISHA, 2010
Directorate of Economics and Statistics, Odisha, Bhubaneswar

6
Shri Panchanan Dash, ISS Special Secretary to Government Planning & Coordination Department Government of Orissa
FOREWORD
Gender refers to the social attributes and opportunities associated with male and female and the relationships between women and men and girls and boys. Gender inequality which indicates status of women in various sectors of economy has adverse impact on economic growth. It hampers the overall well being because blocking women from participation in social, political and economic activities can adversely affect the whole society. The Constitution of India ensures gender equality in its preamble as a fundamental right but also empowers the state to adopt measures of positive discrimination in favor of women by ways of legislation and policies. The Government has also drawn up a draft National policy for the empowerment of women which is a policy statement outlining the state's response to problems of gender discrimination.
The Directorate of Economics & Statistics collects & compiles information on gender
issues & brings out publication “The Gender Disparity in Odisha, 2010”, on the occasion of 4th Statistics Day Celebration to commemorate birth anniversary of Prof P.C.Mahalanobis, the father of modern statistical system in India. The report is the 1st initiative which analyzes different dimensions of gender inequality & provides valuable information for the planners & policy makers to know the gender gaps & disparities.
The publication also incorporates analytical information on Population growth, trends
in sex ratio for the state & districts, Gender disparity in literacy, Participation of women & men in economic activities, achievement on health indicators including comparison with selected states which put emphasis on the challenges ahead.
I would like to thank the Director, Economics & Statistics & the team of officers
assigned in preparation of the publication & look forward for constructive suggestions from all concerned for its further improvements.
(Panchanan Dash)
7
ACKNOWLEDGEMENT
Gender issues are received a lot of emphasis in recent times. To promote gender equality, Government have been playing major role in spreading education, health and empowerment for women. To address the needs of planners and policy makers on gender issues, the Publication Division of the Directorate of Economics and Statistics, Orissa took initiative in collection of information from various sources and brought out the publication on “Gender Disparity in Orissa, 2010”, comprising of five chapters.
The Staff of Publication Division of the Directorate of Economic and Statistics, Orissa assisted in collection of gender data. Sri G.K. Behera, S.I., Sri K.N. Parija, S.I., and Sri P.K. Nayak, S.A. of the Publication Division took active participation in organizing the data where as Md. F. Khan, Assistant Director shoulder the responsibility on analytical and graphical presentation of data. There efforts are highly appreciated.
Besides above, Sri Byomakesh Patra, S.I., and Sarat Chandra Sahoo, S.A.
of Computer Centre, DE&S have made sincere efforts in scrutinizing and designing of the report, which is highly acknowledged. Miss Mamata Dash, S.A, Sri Manoranjan Mohanty, S.A., Sri Kshiroda Kumar Sahoo, S.A., Sri Suresh Chandra Swain, S.A. of Computer Center, DE&S helped a lot in typing the manuscript..
Lastly, I am also thankful to Sri B.D. Jena, Deputy Director, Publication
Division, who has also involved in finalizing the report. Sri G.B. Dash, Deputy Director, Computer Center, Dr. Dillip Ray, Deputy Director and Dr. S.K. Pattnaik , Deputy Director, DE&S also provided inputs and edited the publication which is appreciated.
I hope, that the report will be useful for policy makers, planners and academicians. I welcome any suggestions for future improvement of quality of this publication.
(M. K. Nanda ) Director

8
Contents
Chapter – 1 Page
Population Diversity 4-30
Chapter - 2
Health Scenario 31-52
Chapter - 3
Educational Gains in Men & Women 53-80
Chapter - 4
Men & Women in Economic Activities 81-108
Chapter -5
Other Gender Issues 109-113

9
TABLES
Table No. Subject Page No.
1 2 3 Table - 1 : Population of Orissa since 1951 by sex & sectors 4
Table - 2 : Percentage of Population by sex and region of Orissa 5
Table - 3 : Decadal Growth of Population of Orissa by sex & sectors 7
Table - 4 : Percentage of Population of selected States and All India by sex, 2001 Census
8
Table - 5 : Share of Population to all India by Sex of Selected States 9
Table – 6 : Decadal Growth of population of selected states, 1991-2001 10
Table – 7 : Population of Orissa by age & sex 10
Table – 8 : Percentage distribution of projected population by age & sex of Orissa
12
Table – 9 : District-wise population & projected population by sex 14
Table - 10 : District-wise female population share & rank of the district 17
Table - 11 : District-wise percentage distribution of younger, working age & elderly population of Orissa, 2001
19
Table - 12 : Trends in Sex Ratio of Orissa 20
Table - 13 : State-wise Sex Ratio and Gender Gap – A Comparative Analysis 22
Table - 14 : Sex ratio/ projected sex ratio by age groups of Orissa 23
Table - 15 : District-wise Sex Ratio & Projected Sex Ratio of Orissa 25
Table - 16 : Female target population of Orissa & selected states by age group & category, 2001 Census
29
Table - 17 : Population of Female target groups for Orissa during 2001 30
Table - 18 : Crude Death Rate of Orissa since 2003 31
Table - 19 : Crude Death Rate by selected states, 2008 32
Table - 20 : Death Rate for Persons for specific ages of Orissa 33
Table - 21 : Age Specific Death Rate by States & Sex, 2007 34
Table - 22 : Infant Mortality Rate in Orissa 35
Table - 23 : Infant Mortality Rate by Sex & selected states, 2008 36
Table - 24 : Maternal Mortality Ratio (Per one lakh live births) of Selected States 38
10
Table No. Subject Page No.
1 2 3
Table - 25 : Crude Birth Rate of Orissa since 2003 39
Table - 26 : Crude birth rate by selected States & sector, 2008 40
Table - 27 : Total Fertility Rate of Orissa 42
Table - 28 : Total Fertility Rate of states, 2007 43
Table - 29 : Expectation of Life at Birth by Sex 44
Table - 30 : Year wise number of HIV Positive detected in Orissa 45
Table - 31 : Nutritional Status Report of 0-3 Years Children of Orissa 46
Table - 32 : Nutritional Status Report of 3-6 Years Children of Orissa 46
Table - 33 : District-wise Nutritional Status Report of 0-3 Years Children,
2009-10
48
Table - 34 : District-wise Nutritional Status Report of 3-6 Years Children,
2009-10
49
Table - 35 : Population with Disability, 2001 Census And percentage disability out of total disabled
51
Table - 36 : Population with Disability, 2001 Census 51
Table - 37 : Literacy rate of Orissa 53
Table - 38 : Literacy Rates of Selected States of Orissa by Sex 54
Table - 39 : Literacy rate in Orissa by Sector 55
Table - 40 : District-wise Literacy Rate, 2001 57
Table - 41 : Percentage of Literates by sex & age in Orissa, 2001 63
Table - 42 : District-wise literacy rate by age, 2001 Census 64
Table - 43 : Percentage of Literates by sex & age according to educational level in Orissa, 2001
68
Table - 44 : Percentage Distribution of Population by educational level & Sector for Orissa, 2001
69
Table - 45 : Enrollment of Boys & Girls in Primary Level of Orissa & Gender Parity Index
70
Table - 46 : Enrollment of Boys & Girls in Middle Level of Orissa & Gender Parity Index
70
11
Table No. Subject Page No.
1 2 3 Table - 47 : Enrollment of Boys & Girls in Secondary Level of Orissa
& Gender Parity Index 71
Table - 48 : Percentage enrollment (Primary school) in Orissa 72
Table - 49 : Percentage enrollment (Middle school) in Orissa 72
Table - 50 : Percentage enrollment (Secondary school) in Orissa 73
Table - 51 : District-wise Gender Parity Index, 2008-09 74
Table - 52 : District-wise Adult Literacy Rate (15+) of Orissa : Census 2001
75
Table - 53 : Dropout rates at different educational stage 79
Table -54 : Work Participation Rate of Orissa by sex since 1961 81
Table - 55 : Work participation rate of total worker, main and marginal worker of selected states by sex, 2001
82
Table -56 : Percentage Distribution of Workers According to Category of Workers, 1991 Census
83
Table -57 : Percentage Distribution of Workers According to Category of Workers, 2001 Census
84
Table -58 : Labour force Participation Rate in selected states, 1992-93 ( Per 1000 Person)
85
Table -59 : Labour force Participation Rate in selected states, 2004-05 ( per 1000 person)
86
Table - 60 : Per 1000 distribution of Persons by Usual Principal Status Activity
87
Table - 61 : Per 1000 distribution of usually employed persons in the Principal status
87
Table - 62 : Un_employment rate in selected states, (Per 1000 Person) 88
Table - 63 : Un_Employment rate in selected states, (Per 1000 Person) 88
Table - 64 : District-wise Number of workers and work participation rate by sex of Orissa Census 2001
90
Table - 65 : District-wise Number of workers and work participation rate by sex in Rural Areas of Orissa Census 2001
92
Table - 66 : District-wise Number of workers and work participation rate by sex in Urban Areas of Orissa Census 2001
93

12
Table No. Subject Page No.
1 2 3
Table - 67 : Employment in un-organized sector in Orissa by sex & sector 98
Table - 68 : Percentage Distribution of Employment in unorganized sector by Sex & Sector in Orissa, 2005
98
Table - 69 : Number of Worker Per Establishment, 2005 98
Table - 70 : Employment in Organized Sector 99
Table - 71 : Employment Generation under Poverty Alleviation Schemes 100
Table - 72 : Women self-help group of Orissa 102
Table -73 : Number of MSME unit set up and women entrepreneurs in Orissa 103
Table - 74 : District-wise Women Self-Help Group Formed up to 2008-09 104
Table-75 : Women Entrepreneur by category ( in numbers) 106
Table -76 : Average Agricultutal Labour Wages of Unskilled Laboures of the State by Sex
107
Table - 77 : District-wise Average Agricultutal Labour Wages of Unskilled Laboures by Sex for 2007-08
108
Table - 78 : Women in Decision making 109
Table - 79 : Weekly average time spent on SNA, Extended SNA and Non-SNA activities by sex and place of residence (All persons)
110
Table - 80 : Percentage of weekly average time spent on SNA, Extended SNA and Non-SNA activities by sex and place of residence
(All persons)
110
Table - 81 : Incidence & Rate of Crime Committed against Women in Orissa 111
Table - 82 : Population by marital status by sex,2007 113
13
CHARTS
Chart No. Subject Page No.
1 2 3
Chart-1 : Female / Male Population of Orissa 4
Chart-2 : Female Population in Orissa since 1951 & Growth Rate 5
Chart-3 : Trends in Rural Female / Male Population 6
Chart-4 : Trends in Urban Female / Male Population 6
Chart-5 : Decadal Growth of Population by Sex in Rural Orissa 7
Chart-6 : Decadal Growth of Population by Sex in Urban Orissa 8
Chart-7 : Percentage Female / Male Population, 2001 9
Chart-8 : Population Pyramid of Orissa by age, 2001 11
Chart-9 : Population Pyramid of Orissa by age, 2011 11
Chart-10 : Proportion of Male / Female Population of Orissa by younger, working age & elderly category, 2001
13
Chart-11 : District wise Percentage share of projected female Population, 2021 18
Chart-12 : Trends in Sex Ratio / Projected Sex Ratio of Orissa 20
Chart-13 : Trends in Sex ratio in Rural Orissa, 2001 21
Chart-14 : Trends in Sex ratio in Urban Orissa, 2001 21
Chart-15 : Sex Ratio of States 22
Chart-16 : Trends in Sex Ratio of Orissa by Age Groups 24
Chart-17 : Sex Ratio & Projected Sex Ratio of Districts 26
Chart-18 : Sex Ratio and Projected Sex Ratio of the Regions 27
Chart-19 : Region wise Share of Female Population, 2001 28
Chart-20 : Region wise Share of Female Population, 2011 28
Chart-21 : Region wise Share of Female Population, 2021 28
Chart-22 : Female Population by Category, 2001 Census 29
Chart-23 : Trends in Crude Death Rate of Orissa by Sex 31
Chart-24 : Crude Death Rate by States, 2008 32
Chart-25 : Age Specific Death Rate of Orissa, 2007 33
14
Chart No. Subject Page No.
1 2 3
Chart-26 : Age Specific Death Rate by States & Sex, 2007 34
Chart-27 : Infant Mortality Rate by Sex 35
Chart-28 : Infant Mortality Rate by Sex, 2008 36
Chart-29 : Infant Mortality Rate by Sex, 2008(Rural) 37
Chart-30 : Infant Mortality Rate by Sex, 2008(Urban) 37
Chart-31 : Maternal Mortality Ratio of States 38
Chart-32 : Trends in Birth Rate in Orissa by sector 39
Chart-33 : Crude Birth Rate by States & sector, 2008 40
Chart-34 : Trends in Crude Death Rate & Crude Birth Rate of Orissa 41
Chart-35 : Death / Birth Rate of Selected States, 2008 41
Chart-36 : Total Fertility Rate of Orissa 42
Chart-37 : Total Fertility Rate of states, 2007 43
Chart-38 : Trends in Expectation of life at birth, Orissa 44
Chart-39 : Trends in HIV Positive detected in Adult in Orissa 45
Chart-40 : Nutritional Status of Children in the State( 0-3 Years) 47
Chart-41 : Nutritional Status of Children in the State( 3-6 years) 47
Chart-42 : Percentage Disability according to type (2001 Census), Orissa 52
Chart-43 : Percentage Disability by type & sex, 2001 52
Chart - 44 : Trends in literacy rate by sex in Orissa 53
Chart - 45 : Literacy Rates of Selected States of Orissa by Sex, 2001 54
Chart - 46 : Literacy by Sex in Rural Orissa 55
Chart - 47 : Literacy by Sex in Urban Orissa 56
Chart - 48 : Districtwise Female Literacy Rate (2001) 58
Chart -49 : Districtwise gender disparity index in Literacy rate, 2001 60
Chart - 50 : Districtwise gender disparity index in Rural Literacy of Orissa, 2001 61

15
Chart No. Subject Page No.
1 2 3 Chart - 51 : District wise gender disparity index in Urban Literacy of Orissa, 2001 62
Chart - 52 : Literacy rate by age of Orissa 63
Chart - 53 : District-wise Female Literacy Rate (6-14 years) 65
Chart - 54 : District-wise Female Literacy Rate (15 – 24 years) 66
Chart - 55 : District-wise Female Literacy Rate (25 years & above) 67
Chart - 56 : Adult Literacy (15+ years) Rate in Orissa, 2001 76
Chart - 57 : Region wise Literacy Rate (2001) 76
Chart - 58 : Percentage teachers by sex in Primary School 77
Chart - 59 : Percentage teachers by sex in Middle School 77
Chart - 60 : Percentage teachers by sex in Secondary School 78
Chart - 61 : Drop-out rate in Primary Level 79
Chart - 62 : Drop-out rate in Middle Level 80
Chart - 63 : Drop-out rate in Secondary Level 80
Chart - 64 : Trends in work participation rate of Orissa by sex 81
Chart - 65 : State wise Work Participation Rate, 2001 82
Chart - 66 : Percentage Category of Workers in Rural Orissa, 2001 84
Chart - 67 : Percentage Category of Workers in Urban Orissa, 2001 85
Chart - 68 : Unemployment rate of States(Rural), 2004-05 89
Chart - 69 : Unemployment rate of States(Urban), 2004-05 89
Chart - 70 : District wise work participation rate of Female, 2001 Census 91
16
Chart No. Subject Page No.
1 2 3 Chart - 71 : District wise WPR by sectors of Orissa (2001) 95
Chart - 72 : Percentage Workers to state total according to region, 2001 96
Chart - 73 : Percentage Male Workers according to region, 2001 96
Chart - 74 : Percentage Female Workers according to region, 2001 97
Chart - 75 : Trends in Female Employment in Organized Sector 99
Chart -76 : Percentage Women man days 100
Chart - 77 : District-wise total man days & women man days in 2009-10 101
Chart - 78 : Number of WSHG formed & No. involved in Income Activities in the State
102
Chart - 79 : MSME unit set up / Women Entrepreneur 103
Chart - 80 : Women Entrepreneur by Category, 2008-09 106
Chart - 81 : Average Wages of Unskilled Agril Labourers 107
Chart - 82 : Women / Men MLAs in Orissa 109
Chart - 83 : Rate of Crime Committed against Women in Orissa, ( Per one lakh Population)
112
Chart - 84 : Percentage Population by marital status in Orissa 113
MAPS
Map No. Subject Page No.
1 2 3 Map -1 District wise Female Population Concentration in Orissa as per
2001 Census 15
Map - 2 Female Sex Ratio in Orissa 16
Map- 3 Percentage Malnourished Children in the age group of 0-3 years in Orissa, 2009-10
50
Map - 4 Percentage Malnourished Children in the age group of 3-6 years in Orissa, 2009-10
50
Map - 5 District wise female literacy rate, 2001 Census 59
Map - 6 District wise Female work participation rate in Orissa, 2001 Census 94
Map - 7 District wise Women Self Help Group in Orissa, 2009-10 105

17
GENDER DISPARITY IN ORISSA, 2010
Executive Summary
The proportion of women constitutes half of the total population in Orissa. But they are faced with many issues with present set up of societies. The Constitution of India not only provides equal rights and privileges for women and men but also making special provision for women. A series of social legislations have been enacted from time to time for raising the status of women in the country. The Five Year Plans have consistently placed special emphasis on providing minimum health facilities integrated with family welfare and nutrition for women and children, acceleration of women’s education, their increase in the labour force and welfare services for women in need.
Gender issues have taken the centre stage of development process in most of the countries including India. In fact, how to empowerment of women to reduce gender inequalities is the major concern of the planners and policy makers of our country.
In the decade of 1960’s, the policy of the government aimed at the welfare of the women. In 1970’s there was a shift from the welfare, to the development of women. In 1980’s and onwards, the shift took place from the development to the empowerment of women. Women’s empowerment refers to the ability of women to transform economic and social development. When empowered to fully participate in the decisions, that affect their lives, through leadership training, coaching, consulting and the provision of enabling tools for women to lead within their communities, regions and countries.
Despite all the development measures and the Constitutional legal guarantees,
women have lagged behind men in many sectors. There still exist gaps and inconsistencies in the march of women towards equality. Gender inequality has its adverse impact on development goals which reduces economic growth.

18
The present publication “Gender Disparity in Orissa, 2010” analyzes various
gender issues in the State containing five chapters – Population Diversity, Education,
Health Services, Economic activities and other gender issues.
POPULATION DIVERSITY
It reflects population trends by sex, age including projected population of the
State, Districts and selected States. Population by various age groups/ female target
groups have been presented. The decennial growth rate of the population with witness
decreasing trend in the State has been highlighted. The sex-ratio of the State/Districts
including projected sex-ratio has also been included in the chapter.
HEALTH SCENARIO
It highlights death rate, birth rate, mortality and fertility rate by sex in Orissa
along with selected states. Nutritional status of children in the age group (0-3) and (3-
6) years and HIV positive cases by sex have also been incorporated.
EDUCATIONAL GAINS IN MEN & WOMEN
Gender disparity in literacy rate of the state and districts including variation in
literacy rate among the districts by sex and sectors have been highlighted in the chapter.
Besides, it also depicts sex wise enrolment position in Primary, Middle and Secondary
level along with Gender Parity Index for the State and Districts.
MEN & WOMEN IN ECONOMIC ACTIVITIES
The Chapter covers total workers, work participation rate, labour force
participation rate, employment in organized and unorganized sectors of the economy.
Agricultural labour wages, women entrepreneurs, women man days generated in rural
areas, women SHGs formed etc. have been found place in the chapter.

19
OTHER GENDER ISSUES
This includes crime against women, women empowerment, population by
marital status and time use by sex in the State.
The data have been collected from various sources like Census of India,
Statistical Abstract of Orissa, Economic Survey of Orissa, SRS Bulletin and Statistical
Report, National Crime Record Bureau Report, Report on men and women in India and
from departments of the State Government. The report also incorporates presentation of
data through graphical representation and mapping.
20
POPULATION DIVERSITY

21
Table-1 Population of Orissa since 1951 by sex & sectors
(In’000)
Rural Urban Combined Year
Female Male Total Female Male Total Female Male Total 1 2 3 4 5 6 7 8 9 10
1951 7,124 6,927 14,051 278 315 593 7,402 7,242 14,644
1961 8,282 8,156 16,438 495 613 1,108 8,777 8,769 17,546
1971 10,058 10,041 20,099 845 1,000 1,845 10,903 11,041 21,944
1981 11,623 11,636 23,259 1,436 1,673 3,109 13,059 13,309 26,368
1991 13,629 13,794 27,423 1,965 2,269 4,234 15,594 16,063 31,657
2001 15,538 15,748 31,286 2,605 2,911 5,516 18,143 18,659 36,802
2005(Projected) 16,122 16,332 32,454 2,872 3,164 6,036 18,994 19,496 38,490
2011(Projected) 16,861 17,058 33,919 3,287 3,544 6,831 20,148 20,602 40,750
2015(Projected) 17,285 17,470 34,755 3,580 3,804 7,384 20,865 21,274 42,139
2021(Projected) 17,828 17,996 35,824 4,042 4,202 8,244 21,870 22,198 44,068
Source : Census of India
Chart-1 : Female / Male Population of Orissa
0
5,000
10,000
15,000
20,000
25,000
Figu
re in
'000
num
bers
19511961
19711981
19912001
2005(Projected)
2011(Projected)
2015(Projected)
2021(Projected)
Female Male

22
Chart-2 : Female Population in Orissa since 1951 & Growth Rate
0
5000
10000
15000
20000
25000
1951 1961 1971 1981 1991 2001 2011 2021
Pop
ulat
ion
in '0
00
0
5
10
15
20
25
30
(Gro
wth
rate
)
Female Growth rate
The population of Orissa was 14 million in 1951 and was increased to 37 million in 2001. It is
expected to increase from 37 million to 41 million in 2011 and 44 million in 2021, an increase
of 10% and 19% respectively over 2001. Similarly, female population of the state will
increase from 18 million in 2001 to 22 million in 2021. However, growth rate of female
population shows a decreasing trend from 18.58% in 1961 to 8.55% in 2021.
Table-2 Percentage of Population by sex and region of Orissa
Rural % Urban % Total %
Year Female Male Female Male Female Male
1951 50.70 49.30 46.88 53.12 50.55 49.45
1961 50.38 49.62 44.68 55.32 50.02 49.98
1971 50.04 49.96 45.80 54.20 49.69 50.31
1981 49.97 50.03 46.19 53.81 49.53 50.47
1991 49.70 50.30 46.41 53.59 49.26 50.74
2001 49.66 50.34 47.23 52.77 49.30 50.70
2005(Projected) 49.68 50.32 47.58 52.42 49.35 50.65
2011(Projected) 49.71 50.29 48.12 51.88 49.44 50.56
2015(Projected) 49.73 50.27 48.48 51.52 49.51 50.49
2021(Projected) 49.77 50.23 49.03 50.97 49.63 50.37
23
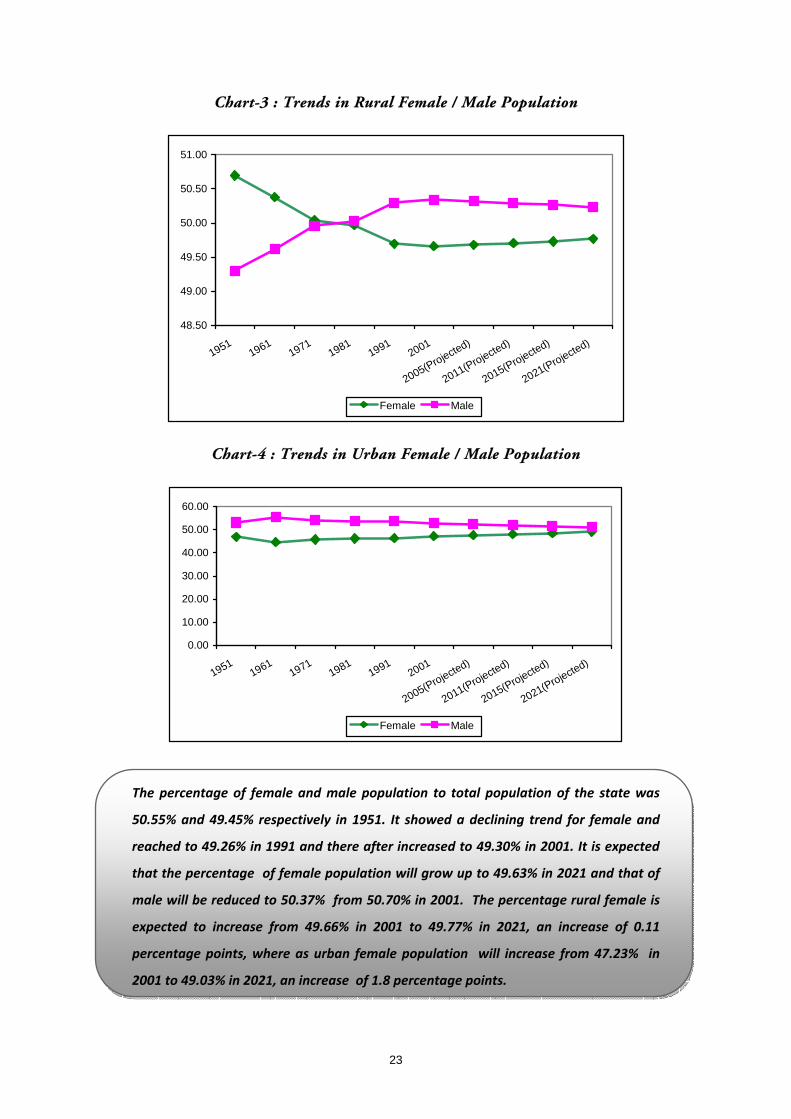
Chart-3 : Trends in Rural Female / Male Population
48.50
49.00
49.50
50.00
50.50
51.00
19511961
19711981
19912001
2005(Projected)
2011(Projected)
2015(Projected)
2021(Projected)
Female Male
Chart-4 : Trends in Urban Female / Male Population
0.00
10.00
20.00
30.00
40.00
50.00
60.00
19511961
19711981
19912001
2005(Projected)
2011(Projected)
2015(Projected)
2021(Projected)
Female Male
The percentage of female and male population to total population of the state was
50.55% and 49.45% respectively in 1951. It showed a declining trend for female and
reached to 49.26% in 1991 and there after increased to 49.30% in 2001. It is expected
that the percentage of female population will grow up to 49.63% in 2021 and that of
male will be reduced to 50.37% from 50.70% in 2001. The percentage rural female is
expected to increase from 49.66% in 2001 to 49.77% in 2021, an increase of 0.11
percentage points, where as urban female population will increase from 47.23% in
2001 to 49.03% in 2021, an increase of 1.8 percentage points.

24
Table-3
Decadal Growth of Population of Orissa by sex & sectors
Rural Urban Combined Decennial Year Female Male Total Female Male Total Female Male Total
1 2 3 4 5 6 7 8 9 10
1951-61 16.25 17.75 16.99 78.17 94.38 86.79 18.58 21.09 19.82
1961-71 21.44 23.10 22.26 70.55 62.88 66.30 24.21 25.89 25.05
1971-81 15.56 15.89 15.73 69.98 67.33 68.54 19.78 20.55 20.17
1981-91 17.26 18.55 17.91 36.81 35.61 36.16 19.41 20.69 20.06
1991-2001 14.00 14.16 14.08 32.55 28.31 30.28 16.34 16.16 16.25
2001-2011 8.51 8.32 8.42 26.18 21.75 23.84 11.05 10.41 10.73
2011-2021 5.74 5.50 5.62 22.97 18.57 20.69 8.55 7.75 8.14
Chart-5 : Decadal Growth of Population by Sex in Rural Orissa
48.50
49.00
49.50
50.00
50.50
51.00
19511961
19711981
19912001
2005(Projected)
2010(Projected)
2015(Projected)
2020(Projected)
Female Male
25
Chart-6 : Decadal Growth of Population by Sex in Urban Orissa
0.00
10.00
20.00
30.00
40.00
50.00
60.00
70.00
80.00
90.00
100.00
1951-611961-71
1971-811981-91
1991-2001
2001-2011
2011-2021
Female Male
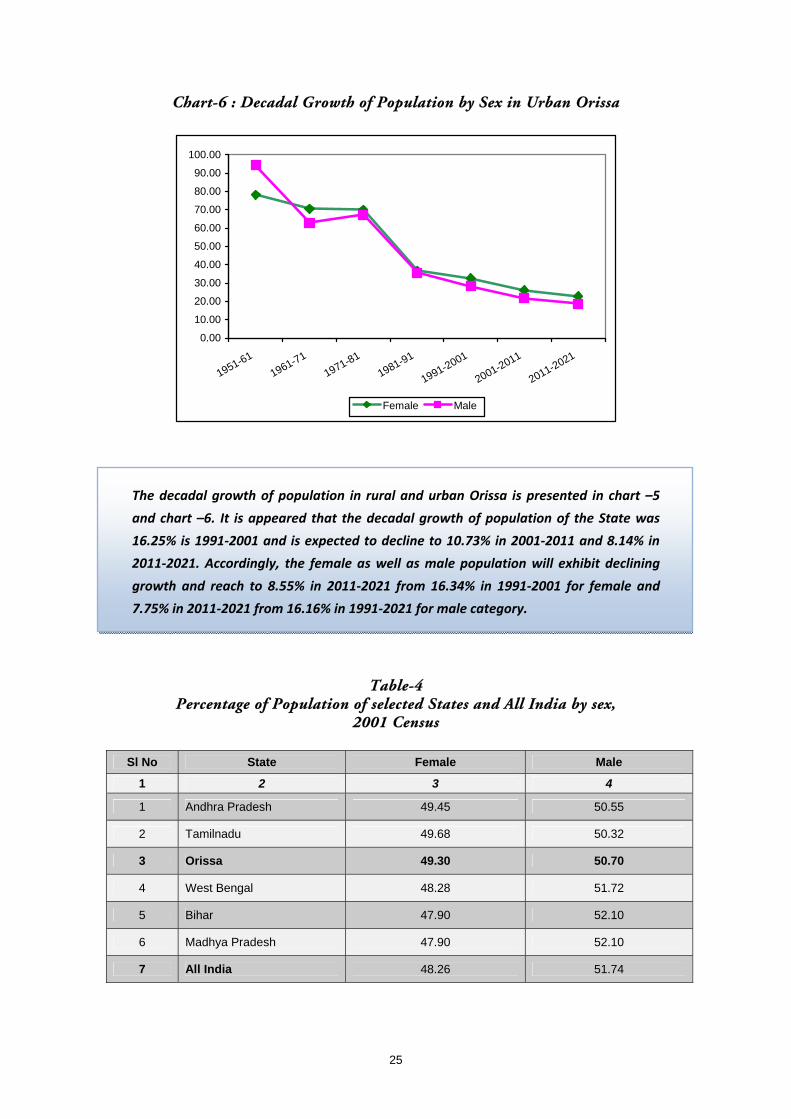
The decadal growth of population in rural and urban Orissa is presented in chart –5
and chart –6. It is appeared that the decadal growth of population of the State was
16.25% is 1991‐2001 and is expected to decline to 10.73% in 2001‐2011 and 8.14% in
2011‐2021. Accordingly, the female as well as male population will exhibit declining
growth and reach to 8.55% in 2011‐2021 from 16.34% in 1991‐2001 for female and
7.75% in 2011‐2021 from 16.16% in 1991‐2021 for male category.
Table-4 Percentage of Population of selected States and All India by sex,
2001 Census
Sl No State Female Male
1 2 3 4
1 Andhra Pradesh 49.45 50.55
2 Tamilnadu 49.68 50.32
3 Orissa 49.30 50.70
4 West Bengal 48.28 51.72
5 Bihar 47.90 52.10
6 Madhya Pradesh 47.90 52.10
7 All India 48.26 51.74

26
Chart-7 : Percentage Female / Male Population, 2001
50.55
50.32
50.7
51.72
52.1
52.1
51.74
49.45
49.68
49.3
48.28
47.9
47.9
48.26
45 46 47 48 49 50 51 52 53
Andhra Pradesh
Tamilnadu
Orissa
West Bengal
Bihar
Madhya Pradesh
All India
Male Female
Table-5
Share of Population to all India by Sex of Selected States
(Percentage)
1991 2001 Sl No. States
Female Male Total Female Male Total
1 Andhra Pradesh 8.05 7.68 7.86 7.59 7.24 7.41
2 Tamilnadu 6.77 6.44 6.60 6.25 5.90 6.07
3 Orissa 3.83 3.66 3.74 3.65 3.51 3.58
4 West Bengal 8.00 8.09 8.04 7.80 7.79 7.79
5 Bihar 10.11 10.29 10.21 8.01 8.13 8.07
6 Madhya Pradesh 7.84 7.80 7.82 5.82 5.91 5.87
All India 100.00 100.00 100.00 100.00 100.00 100.00
27
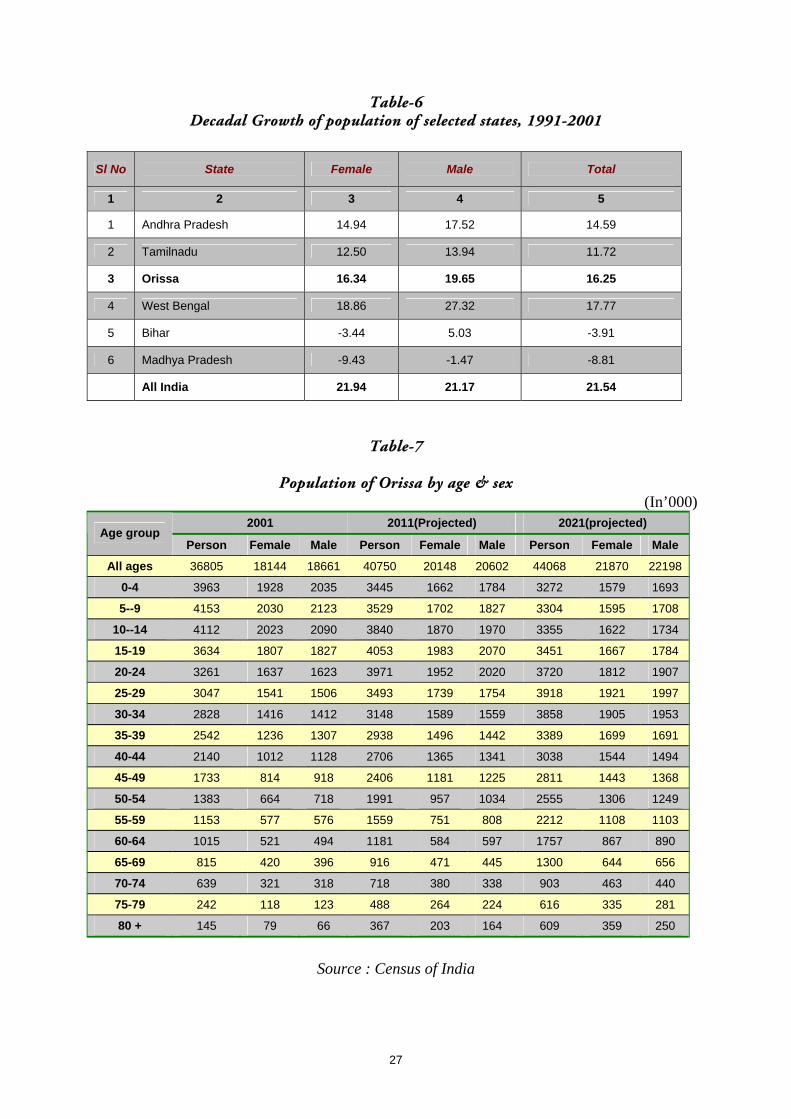
Table-6 Decadal Growth of population of selected states, 1991-2001
Sl No State Female Male Total
1 2 3 4 5
1 Andhra Pradesh 14.94 17.52 14.59
2 Tamilnadu 12.50 13.94 11.72
3 Orissa 16.34 19.65 16.25
4 West Bengal 18.86 27.32 17.77
5 Bihar -3.44 5.03 -3.91
6 Madhya Pradesh -9.43 -1.47 -8.81
All India 21.94 21.17 21.54
Table-7
Population of Orissa by age & sex (In’000)
2001 2011(Projected) 2021(projected) Age group
Person Female Male Person Female Male Person Female Male
All ages 36805 18144 18661 40750 20148 20602 44068 21870 22198
0-4 3963 1928 2035 3445 1662 1784 3272 1579 1693
5--9 4153 2030 2123 3529 1702 1827 3304 1595 1708
10--14 4112 2023 2090 3840 1870 1970 3355 1622 1734
15-19 3634 1807 1827 4053 1983 2070 3451 1667 1784
20-24 3261 1637 1623 3971 1952 2020 3720 1812 1907
25-29 3047 1541 1506 3493 1739 1754 3918 1921 1997
30-34 2828 1416 1412 3148 1589 1559 3858 1905 1953
35-39 2542 1236 1307 2938 1496 1442 3389 1699 1691
40-44 2140 1012 1128 2706 1365 1341 3038 1544 1494
45-49 1733 814 918 2406 1181 1225 2811 1443 1368
50-54 1383 664 718 1991 957 1034 2555 1306 1249
55-59 1153 577 576 1559 751 808 2212 1108 1103
60-64 1015 521 494 1181 584 597 1757 867 890
65-69 815 420 396 916 471 445 1300 644 656
70-74 639 321 318 718 380 338 903 463 440
75-79 242 118 123 488 264 224 616 335 281
80 + 145 79 66 367 203 164 609 359 250
Source : Census of India

28
Chart-8 : Population Pyramid of Orissa by age, 2001
8 6 4 2 0 2 4 6 8
0-4
10--14
20-24
30-34
40-44
50-54
60-64
70-74
80 +
Age
FEMALE MALE
Chart-9 : Population Pyramid of Orissa by age, 2011
8 6 4 2 0 2 4 6 8
0-4
10--14
20-24
30-34
40-44
50-54
60-64
70-74
80 +
Age
FEMALE MALE
The population pyramid 2001, 2011(projected) depicts that the proportion of population under the
age 14 will be expected to decline and that of over age 60+ will be increased in 2011 compared to
2001, thus making all inference about the State having aged population. This also indicate that the
crude death rate of the State will tend to increase as the proportion above 70+ age(older
population) looks higher in 2011 compared to 2001.
29
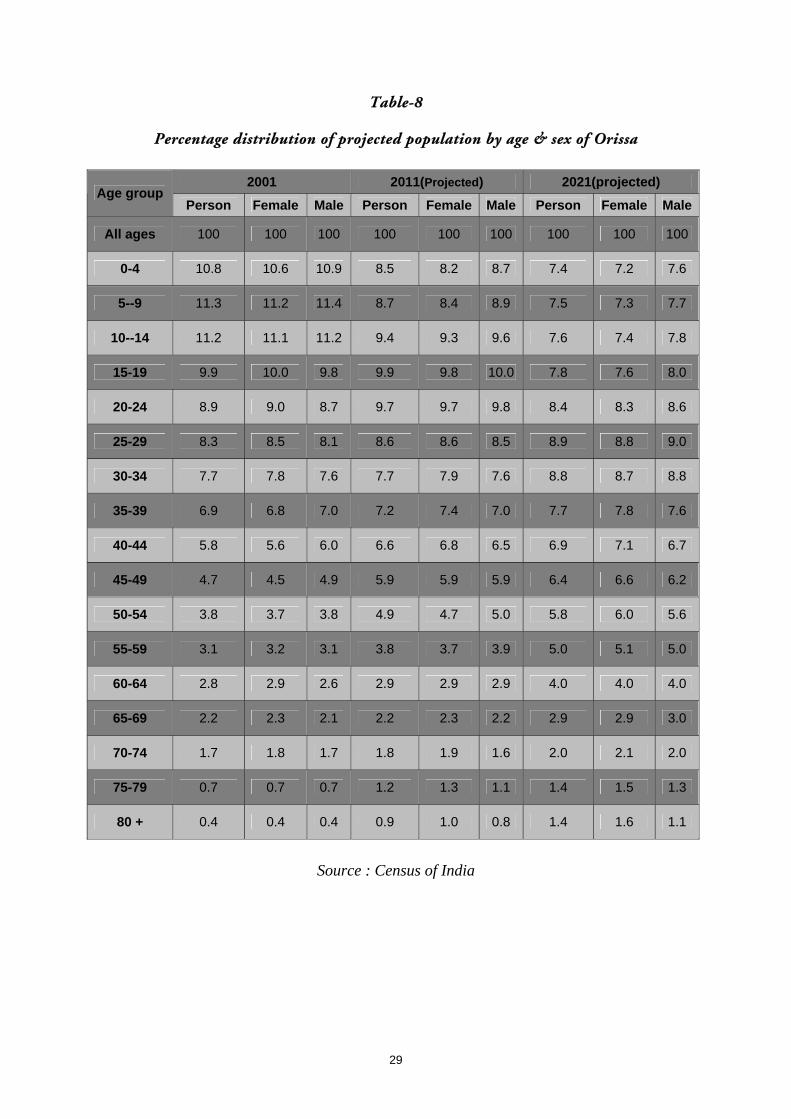
Table-8
Percentage distribution of projected population by age & sex of Orissa
2001 2011(Projected) 2021(projected) Age group
Person Female Male Person Female Male Person Female Male
All ages 100 100 100 100 100 100 100 100 100
0-4 10.8 10.6 10.9 8.5 8.2 8.7 7.4 7.2 7.6
5--9 11.3 11.2 11.4 8.7 8.4 8.9 7.5 7.3 7.7
10--14 11.2 11.1 11.2 9.4 9.3 9.6 7.6 7.4 7.8
15-19 9.9 10.0 9.8 9.9 9.8 10.0 7.8 7.6 8.0
20-24 8.9 9.0 8.7 9.7 9.7 9.8 8.4 8.3 8.6
25-29 8.3 8.5 8.1 8.6 8.6 8.5 8.9 8.8 9.0
30-34 7.7 7.8 7.6 7.7 7.9 7.6 8.8 8.7 8.8
35-39 6.9 6.8 7.0 7.2 7.4 7.0 7.7 7.8 7.6
40-44 5.8 5.6 6.0 6.6 6.8 6.5 6.9 7.1 6.7
45-49 4.7 4.5 4.9 5.9 5.9 5.9 6.4 6.6 6.2
50-54 3.8 3.7 3.8 4.9 4.7 5.0 5.8 6.0 5.6
55-59 3.1 3.2 3.1 3.8 3.7 3.9 5.0 5.1 5.0
60-64 2.8 2.9 2.6 2.9 2.9 2.9 4.0 4.0 4.0
65-69 2.2 2.3 2.1 2.2 2.3 2.2 2.9 2.9 3.0
70-74 1.7 1.8 1.7 1.8 1.9 1.6 2.0 2.1 2.0
75-79 0.7 0.7 0.7 1.2 1.3 1.1 1.4 1.5 1.3
80 + 0.4 0.4 0.4 0.9 1.0 0.8 1.4 1.6 1.1
Source : Census of India

30
Chart-10 : Proportion of Male / Female Population of Orissa by younger, working age & elderly category, 2001
33.5
32.9
6
33.2
2
59.0
3
58.9
9
59.0
2
7.49 8.04
7.76
0
10
20
30
40
50
60
70
0-14 (Younger) 15-59(Working Age) 60+(Elderly)
Male Female Person
The proportion of younger female population (0‐14) stood at 32.96% against 33.50%
for male counterpart in Orissa. The population proportion for working age group (15‐
59) for female was 58.99% against 59.03% for male category. However, the female
proportion for elderly category (60+) was 8.04%, which was higher compared to male
(7.49%).
Population Dependency Ratio
The Population Dependency Ratio is the ratio of persons in the dependant age (under
14 years and over 60 years) to those in the working ages (15‐59 years). Thus the
Population Dependency in Orissa was worked out to 69.44%, which indicates that
there were 69 persons in the dependant age for every 100 persons in the working age.
The dependency was found more because of larger population of children in the
population.

31
Table-9
District wise population & projected population by sex (In’000 nos.)
2001 2011(Projected) 2021(Projected) Sl No.
District
Male Female Total Male Female Total Male female Total
1 2 3 4 5 6 7 8 9 10 11
1 Angul 587 553 1140 662 626 1287 728 692 1420
2 Balasosre 1036 988 2024 1175 1125 2300 1300 1250 2551
3 Bargarh 681 665 1346 722 705 1428 746 730 1476
4 Bhadrak 676 658 1334 778 752 1530 872 840 1712
5 Bolangir 674 663 1337 687 686 1373 678 690 1368
6 Boudh 188 185 373 208 209 416 224 229 453
7 Cuttack 1208 1133 2341 1247 1295 2542 1251 1445 2696
8 Deogarh 138 136 274 152 152 303 162 165 328
9 Dhenkanal 544 523 1067 580 563 1144 604 592 1196
10 Gajapati 255 263 519 281 284 565 301 299 600
11 Ganjam 1582 1579 3161 1764 1754 3519 1920 1905 3826
12 Jagatsinghpur 539 519 1058 633 504 1137 724 468 1192
13 Jajpur 824 801 1624 920 893 1813 1002 974 1976
14 Jharsuguda 262 248 510 290 270 560 313 287 600
15 Kalahandi 668 668 1335 749 754 1503 821 831 1652
16 Kandhamal 323 325 648 363 369 731 397 408 806
17 Kendrapara 646 656 1302 693 712 1404 723 755 1478
18 Keonjhar 790 772 1562 875 863 1738 946 943 1889
19 Khurda 987 891 1877 1163 1058 2221 1333 1223 2556
20 Koraput 591 590 1181 641 649 1290 679 697 1377
21 Malkangiri 252 252 504 282 289 571 307 324 631
22 Mayurbhanja 1123 1100 2223 1259 1240 2499 1377 1365 2742
23 Nawarangpur 515 511 1026 592 590 1183 664 666 1330
24 Nayagarh 446 418 865 473 434 908 490 439 928
25 Nuapada 264 266 531 284 288 572 297 304 601
26 Puri 763 739 1503 839 811 1650 900 870 1770
27 Rayagada 410 421 831 451 472 923 484 517 1001
28 Sambalpur 475 460 936 513 512 1025 540 557 1098
29 Subarnpur 276 266 542 301 286 587 320 301 621
30 Sundargarh 936 895 1831 1024 1005 2029 1095 1102 2197
Source : Census of India
32
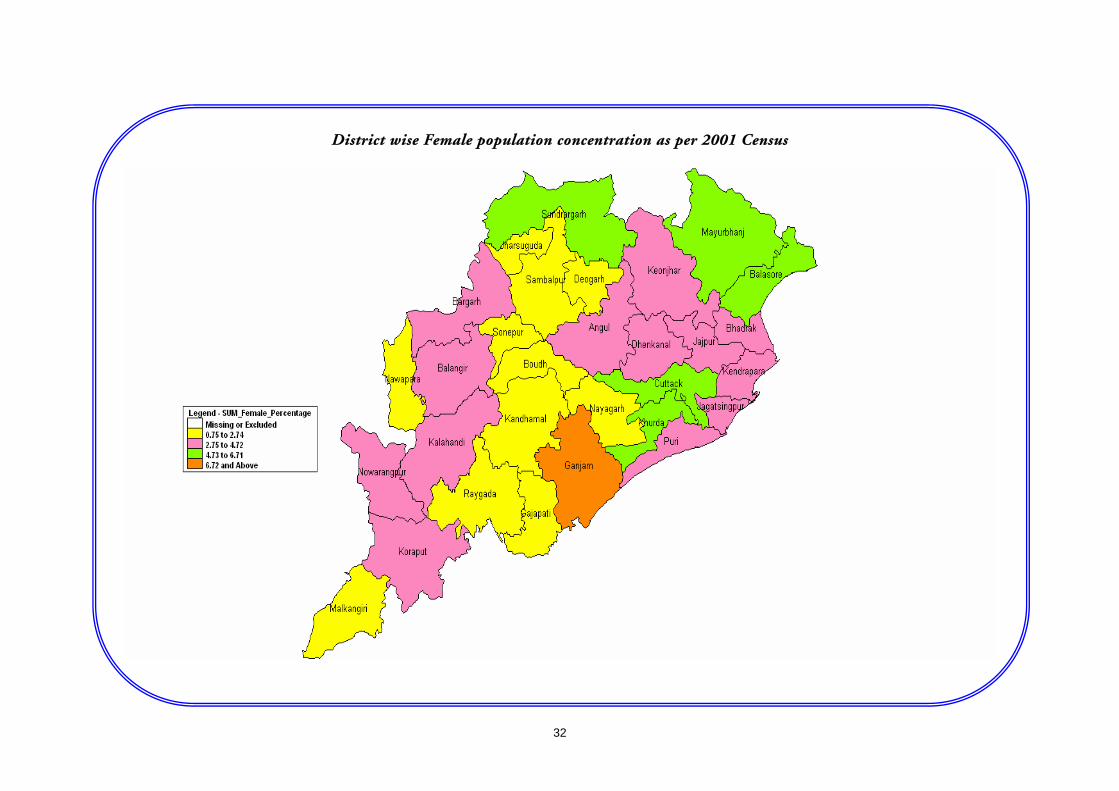
District wise Female population concentration as per 2001 Census
33
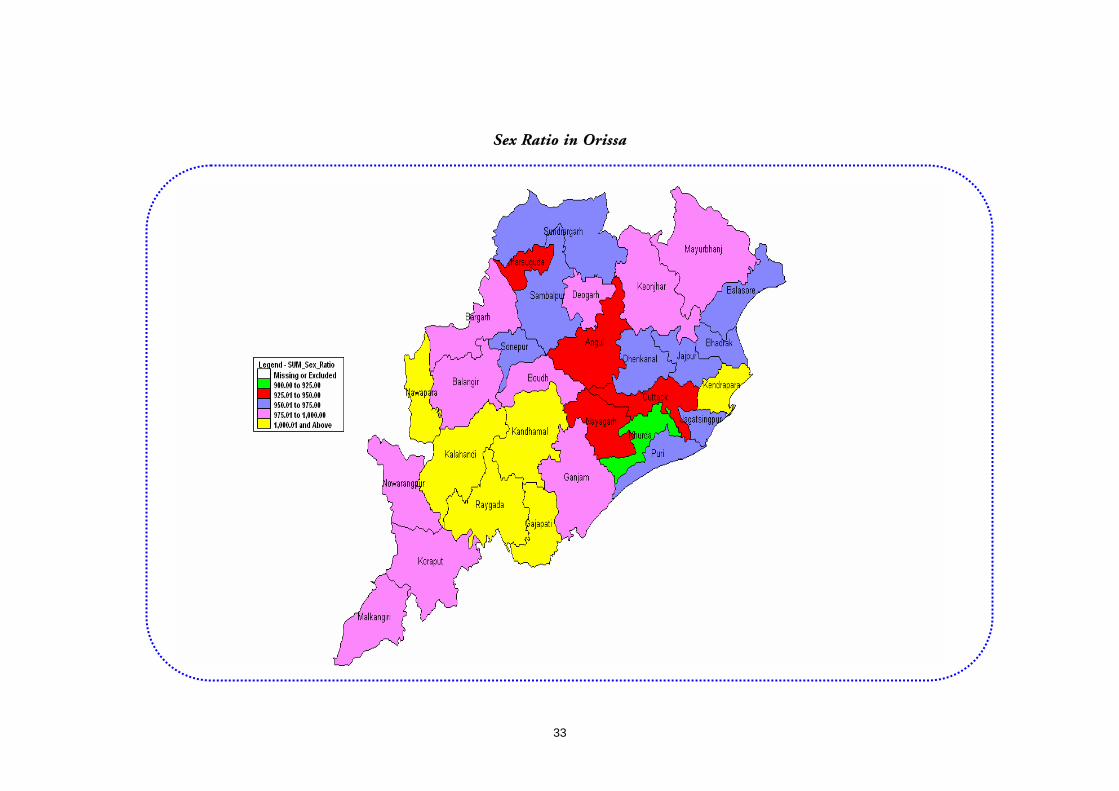
Sex Ratio in Orissa

34
Table-10
District wise female population share & rank of the district
2001 2011(Projected) 2021(Projected) Sl No.
District
Female Populati
on, fig (000)
% to total female
population
Rank of the
District
Female Populati
on, fig(000)
% to total female
population
Rank of the
District
Female Populati
on fig(000)
% to total female
population
Rank of the District
1 2 3 4 5 6 7 8 9 10 11
1 Angul 553 3.047 16 626 3.105 16 692 3.164 15
2 Balasosre 988 5.445 4 1125 5.582 4 1250 5.718 4
3 Bargarh 665 3.664 11 705 3.500 13 730 3.337 13
4 Bhadrak 658 3.627 13 752 3.734 11 840 3.841 10
5 Bolangir 663 3.655 12 686 3.406 14 690 3.156 16
6 Boudh 185 1.021 29 209 1.035 29 229 1.049 29
7 Cuttack 1133 6.246 2 1295 6.427 2 1445 6.607 2
8 Deogarh 136 0.748 30 152 0.752 30 165 0.756 30
9 Dhenkanal 523 2.882 17 563 2.795 18 592 2.708 18
10 Gajapati 263 1.452 26 284 1.410 27 299 1.367 27
11 Ganjam 1579 8.701 1 1754 8.707 1 1905 8.713 1
12 Jagatsinghpur 519 2.859 18 504 2.499 20 468 2.140 21
13 Jajpur 801 4.412 7 893 4.433 7 974 4.453 7
14 Jharsuguda 248 1.366 28 270 1.340 28 287 1.314 28
15 Kalahandi 668 3.681 10 754 3.740 10 831 3.799 11
16 Kandhamal 325 1.793 23 369 1.830 23 408 1.867 23
17 Kendrapara 656 3.613 14 712 3.533 12 755 3.453 12
18 Keonjhar 772 4.255 8 863 4.284 8 943 4.313 8
19 Khurda 891 4.908 6 1058 5.251 5 1223 5.593 5
20 Koraput 590 3.251 15 649 3.219 15 697 3.188 14
21 Malkangiri 252 1.387 27 289 1.434 24 324 1.481 24
22 Mayurbhanja 1100 6.064 3 1240 6.152 3 1365 6.240 3
23 Nawarangpur 511 2.814 19 590 2.929 17 666 3.044 17
24 Nayagarh 418 2.306 22 434 2.156 22 439 2.005 22
25 Nuapada 266 1.468 24 288 1.429 25 304 1.389 25
26 Puri 739 4.075 9 811 4.026 9 870 3.978 9
27 Rayagada 421 2.322 21 472 2.342 21 517 2.362 20
28 Sambalpur 460 2.538 20 512 2.543 19 557 2.548 19
29 Subarnpur 266 1.467 25 286 1.421 26 301 1.376 26
30 Sundargarh 895 4.933 5 1005 4.987 6 1102 5.040 6
Total 18144 100 20148 100 21870 100.00
35
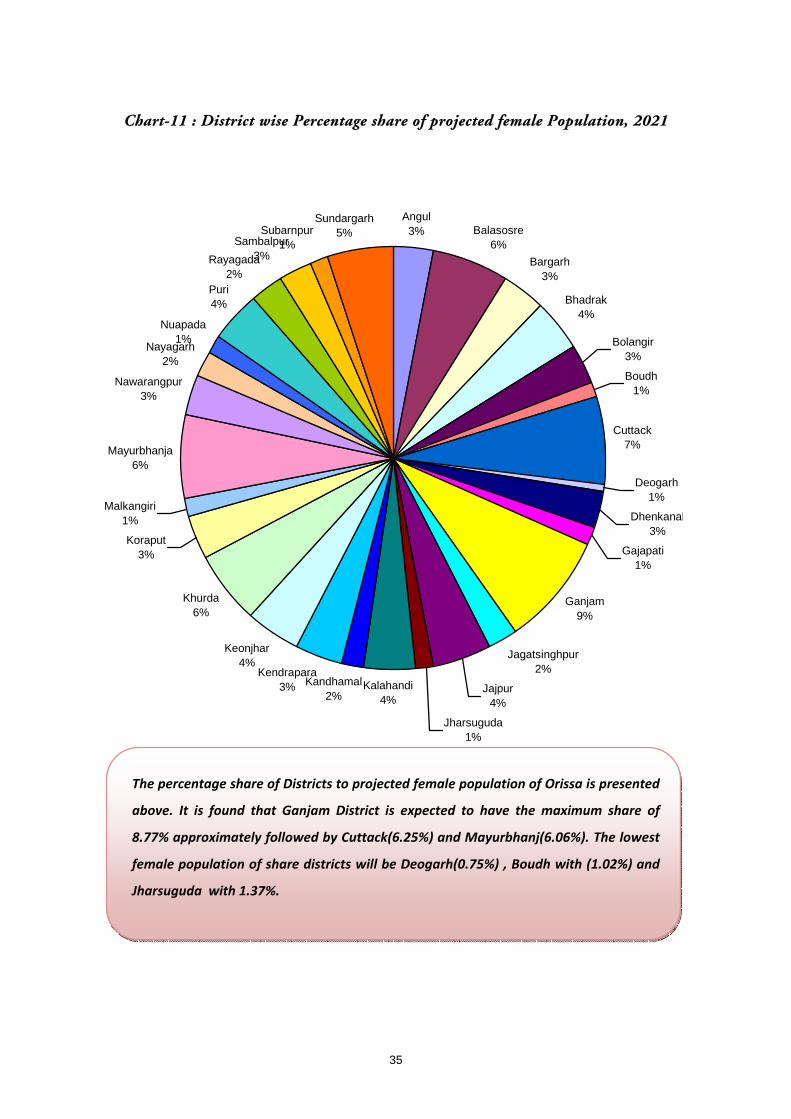
Chart-11 : District wise Percentage share of projected female Population, 2021
Angul3% Balasosre
6%Bargarh
3%
Bhadrak4%
Bolangir3%
Boudh1%
Cuttack7%
Deogarh1%
Dhenkanal3%
Gajapati1%
Ganjam9%
Jagatsinghpur2%
Jajpur4%
Jharsuguda1%
Kalahandi4%
Kandhamal2%
Kendrapara3%
Keonjhar4%
Khurda6%
Koraput3%
Malkangiri1%
Mayurbhanja6%
Nawarangpur3%
Nayagarh2%
Nuapada1%
Puri4%
Rayagada2%
Sambalpur3%
Subarnpur1%
Sundargarh5%
The percentage share of Districts to projected female population of Orissa is presented
above. It is found that Ganjam District is expected to have the maximum share of
8.77% approximately followed by Cuttack(6.25%) and Mayurbhanj(6.06%). The lowest
female population of share districts will be Deogarh(0.75%) , Boudh with (1.02%) and
Jharsuguda with 1.37%.

36
Table-11
Districtwise percentage distribution of younger, working age &
elderly population of Orissa, 2001
0-14(Younger Age) 15-59( Working Age) 60+(Elderly) Name of the District
Person Male Female Person Male Female Person Male Female
Population Depen- dency Ratio
1 2 3 4 5 6 7 8 9 10 11
Anugul 32.43 32.05 32.82 60.03 60.25 59.79 7.55 7.69 7.39 66.6
Balangir 32.41 32.66 32.15 58.17 58.51 57.82 9.42 8.83 10.02 71.9
Baleshwar 34.12 34.06 34.18 57.97 58.10 57.84 7.91 7.85 7.99 72.5
Bargarh 30.48 30.49 30.46 59.79 60.17 59.40 9.73 9.34 10.14 67.3
Baudh 34.21 34.36 34.05 57.81 57.63 57.99 7.99 8.01 7.96 73.0
Bhadrak 34.12 34.48 33.75 57.30 56.90 57.71 8.59 8.63 8.54 74.5
Cuttack 29.29 29.11 29.47 60.91 61.14 60.66 9.81 9.75 9.87 64.2
Debagarh 34.33 34.46 34.20 57.60 57.45 57.75 8.07 8.09 8.05 73.6
Dhenkanal 31.84 31.98 31.70 59.41 58.98 59.85 8.75 9.04 8.46 68.3
Gajapati 38.08 39.67 36.55 55.41 54.57 56.23 6.50 5.77 7.22 80.5
Ganjam 34.45 35.11 33.79 56.93 56.40 57.47 8.62 8.50 8.74 75.6
Jagatsinghapur 29.06 29.32 28.80 60.12 59.72 60.55 10.81 10.96 10.66 66.3
Jajapur 32.31 32.72 31.89 58.86 58.38 59.36 8.82 8.90 8.75 69.9
Jharsuguda 31.53 31.22 31.85 60.26 60.84 59.64 8.22 7.94 8.51 66.0
Kalahandi 34.22 34.58 33.87 57.69 58.15 57.22 8.09 7.28 8.91 73.4
Kandhamal 38.67 39.62 37.73 54.91 54.55 55.26 6.43 5.83 7.02 82.1
Kendrapara 32.16 33.16 31.17 57.02 55.79 58.23 10.82 11.04 10.61 75.4
Kendujhar 35.16 35.37 34.94 58.14 58.27 58.01 6.70 6.36 7.05 72.0
Khordha 29.25 28.77 29.78 62.71 63.25 62.12 8.04 7.98 8.10 59.5
Koraput 35.98 36.76 35.19 58.43 58.13 58.72 5.59 5.10 6.09 71.2
Malkangiri 38.61 39.33 37.89 55.66 55.48 55.83 5.74 5.19 6.28 79.7
Mayurbhanj 36.21 36.86 35.54 56.63 56.51 56.75 7.16 6.63 7.71 76.6
Nabarangapur 38.60 39.12 38.09 55.29 55.23 55.35 6.11 5.65 6.56 80.9
Nayagarh 30.43 30.43 30.43 59.43 59.22 59.66 10.14 10.35 9.91 68.3
Nuapada 34.85 35.42 34.29 55.98 56.40 55.57 9.17 8.18 10.14 78.6
Puri 29.85 30.13 29.57 60.38 60.11 60.66 9.77 9.76 9.78 65.6
Rayagada 36.64 38.09 35.24 57.43 56.97 57.87 5.93 4.94 6.89 74.1
Sambalpur 31.46 31.44 31.48 60.15 60.28 60.01 8.39 8.28 8.51 66.3
Sonapur 33.16 32.96 33.38 57.83 58.15 57.49 9.01 8.89 9.14 72.9
Sundargarh 33.45 33.32 33.58 59.78 60.10 59.43 6.78 6.58 6.98 67.3

37
Table-12
Sex Ratio of Orissa
Year Rural Urban Combined
1951 1029 881 1022
1961 1015 807 1001
1971 1002 845 988
1981 999 859 981
1991 988 866 971
2001 987 895 972
2005(Projected) 987 908 974
2011(Projected) 988 927 978
2015(Projected) 989 941 981
2021(Projected) 991 962 985
Source : Census of India
Chart-12 : Trends in Sex Ratio / Projected Sex Ratio of Orissa
700
800
900
1000
1100
19511961
19711981
19912001
2005(Projected)
2011(Projected)
2015(Projected)
2021(Projected)
Rural Urban Combined

38
Chart-13 : Trends in Sex ratio in Rural Orissa, 2001
800 850 900 950 1000 1050
195119611971198119912001
2005(Projected)2011(Projected)2015(Projected)2021(Projected)
Chart-14 : Trends in Sex ratio in Urban Orissa, 2001
800 850 900 950 1000
195119611971198119912001
2005(Projected)2011(Projected)2015(Projected)2021(Projected)
Sex Ratio
The ratio of women living compared to men is called sex ratio and is calculated as the
number of females per 1000 males. The number varies signifies around the World
often due to the inequalities between men and women. Such imbalance in sex ratio
may lead to social unrest, where young males will unable to find an spouse. The sex
ratio of Orisssa is presented in table‐12. The sex ratio witnesses a declining trend from
1951 to 1991 and after a decade it increase to 972 in 2001 from 971 in 1991. It is
expected that sex ratio of the State will increase to 985 in 2021 from 972 in 2001.
Similarly in rural and urban Orissa, the sex ratio will increase to 991 and 962
respectively.

39
Table – 13
Statewise Sex Ratio and Gender Gap – A Comparative Analysis
Sex ratio Gender gap Sl.
No. State
1991 2001 1991 2001
1 2 3 4 5 6
1 Andhra Pradesh 972 933 28 67
2 Tamil Nadu 974 987 26 13
3 Orissa 971 972 29 28
4 West Bengal 917 934 83 66
5 Bihar 911 919 89 81
6 Madhya Predesh 931 919 69 81
All India 927 933 73 67
Chart-15 : Sex Ratio of States
972
974
971
917
911
931
927
933
987
972
934
919
919
933
860 880 900 920 940 960 980 1000
Andhra Pradesh
Tamil Nadu
Orissa
West Bengal
Bihar
Madhya Predesh
All India
1991 2001
40
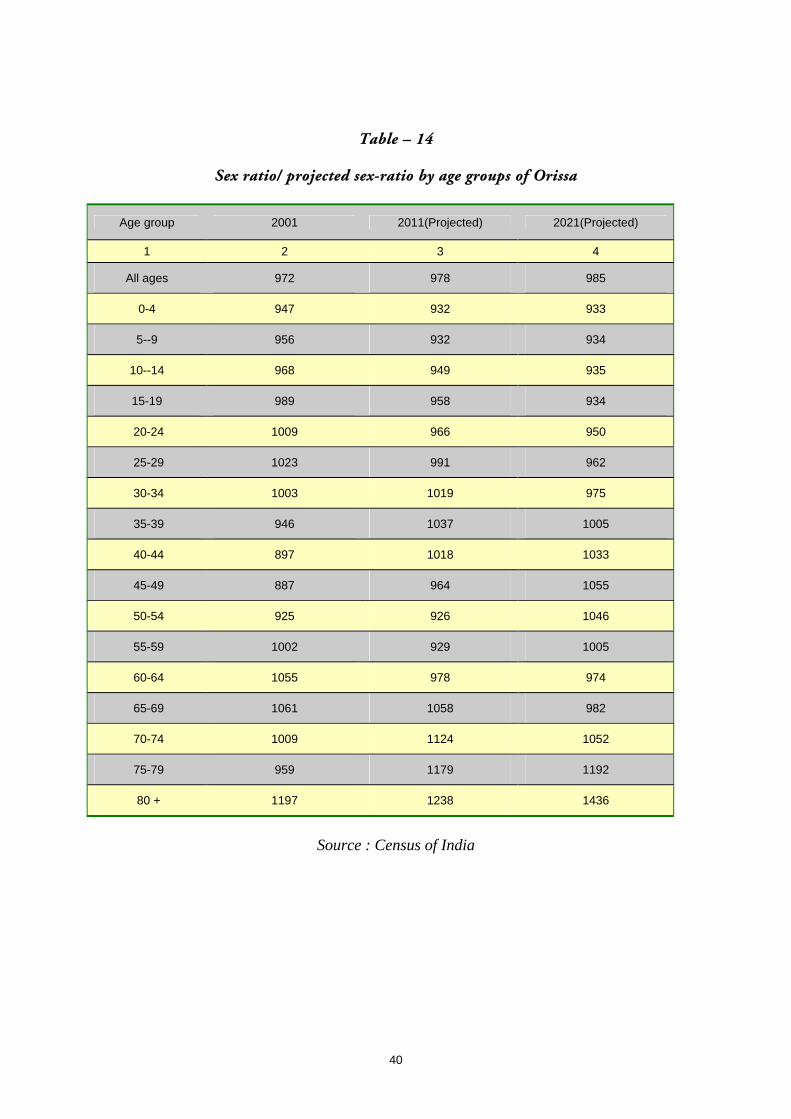
Table – 14
Sex ratio/ projected sex-ratio by age groups of Orissa
Age group 2001 2011(Projected) 2021(Projected)
1 2 3 4
All ages 972 978 985
0-4 947 932 933
5--9 956 932 934
10--14 968 949 935
15-19 989 958 934
20-24 1009 966 950
25-29 1023 991 962
30-34 1003 1019 975
35-39 946 1037 1005
40-44 897 1018 1033
45-49 887 964 1055
50-54 925 926 1046
55-59 1002 929 1005
60-64 1055 978 974
65-69 1061 1058 982
70-74 1009 1124 1052
75-79 959 1179 1192
80 + 1197 1238 1436
Source : Census of India

41
Chart-16 : Trends in Sex Ratio of Orissa by Age Groups
0 200 400 600 800 1000 1200 1400All ages
0-4
5--9
10--14
15-19
20-24
25-29
30-34
35-39
40-44
45-49
50-54
55-59
60-64
65-69
70-74
75-79
80 +
2001 2011 (Projected)
The sex ratio in the age group of 20‐24, 25‐29 and 30‐34 was above 1000 in 2001
Census, which is appeared to be declined in 2011(except in the age 30‐34) and 2021.
But the sex ratio in 35‐39, 40‐44 and 45‐49 age group shows an increasing trend. It is
also found that the sex ratio in age‐group below 14 years shows a declining trend,
which is quite alarming. The all Orissa sex ratio trend is expected to increase from 972
in 2001 to 978 in 2011 and 985 in 2021, which gives an encouraging picture in
population diversity.

42
Table – 15 District wise Sex Ratio & Projected Sex Ratio of Orissa
Sl. No.
District 2001 2011(P) 2021(P)
1 Angul 941 945 951
2 Balasosre 953 957 962
3 Bargarh 976 976 978
4 Bhadrak 974 968 964
5 Bolangir 984 999 1018
6 Boudh 984 1004 1025
7 Cuttack 938 1038 1155
8 Deogarh 980 999 1019
9 Dhenkanal 961 970 981
10 Gajapati 1031 1012 994
11 Ganjam 998 994 992
12 Jagatsinghpur 963 795 647
13 Jajpur 972 971 972
14 Jharsuguda 946 931 918
15 Kalahandi 1001 1006 1012
16 Kandhamal 1008 1017 1027
17 Kendrapara 1014 1028 1044
18 Keonjhar 977 986 997
19 Khurda 902 909 918
20 Koraput 999 1011 1026
21 Malkangiri 997 1025 1056
22 Mayurbhanja 980 984 991
23 Nawarangpur 991 996 1003
24 Nayagarh 938 917 896
25 Nuapada 1007 1015 1024
26 Puri 968 967 966
27 Rayagada 1028 1047 1067
28 Sambalpur 969 999 1031
29 Subarnpur 966 952 939
30 Sundargarh 957 981 1007
State 972 978 985
The district‐wise sex‐ratio and projected sex ratio is presented in the table above. Six
districts namely Ganjam, Kalahandi, Kandhamal, Kendrapara, Nuapada and
Rayagada have sex ratio above 1000 in 2001. Sex ratio of 10 districts in 2011 and sex
ratio of 14 districts in 2021 are expected to increase above 1000. Sex ratio of
Jagatsinghpur, Bhadrak, Jharsuguda, Nayagarh and Subarnapur are expected to
decline compared to sex‐ratio in 2001. It is also noticed that sex ratio of Southern
districts were more compared to Northern and Central districts.

43
Chart-17 : Sex Ratio & Projected Sex Ratio of Districts
0 200 400 600 800 1000 1200
Angul
Balasosre
Bargarh
Bhadrak
Bolangir
Boudh
Cuttack
Deogarh
Dhenkanal
Gajapati
Ganjam
Jagatsinghpur
Jajpur
Jharsuguda
Kalahandi
Kandhamal
Kendrapara
Keonjhar
Khurda
Koraput
Malkangiri
Mayurbhanja
Nawarangpur
Nayagarh
Nuapada
Puri
Rayagada
Sambalpur
Subarnpur
Sundargarh
2001 2011(P) 2021(P)

44
Chart-18 : Sex Ratio and Projected Sex Ratio of the Regions
958
1002
966
961
1007
976
966
1014
988
930 940 950 960 970 980 990 1000 1010 1020
Central
Southern
Northern
2001 2011 2021
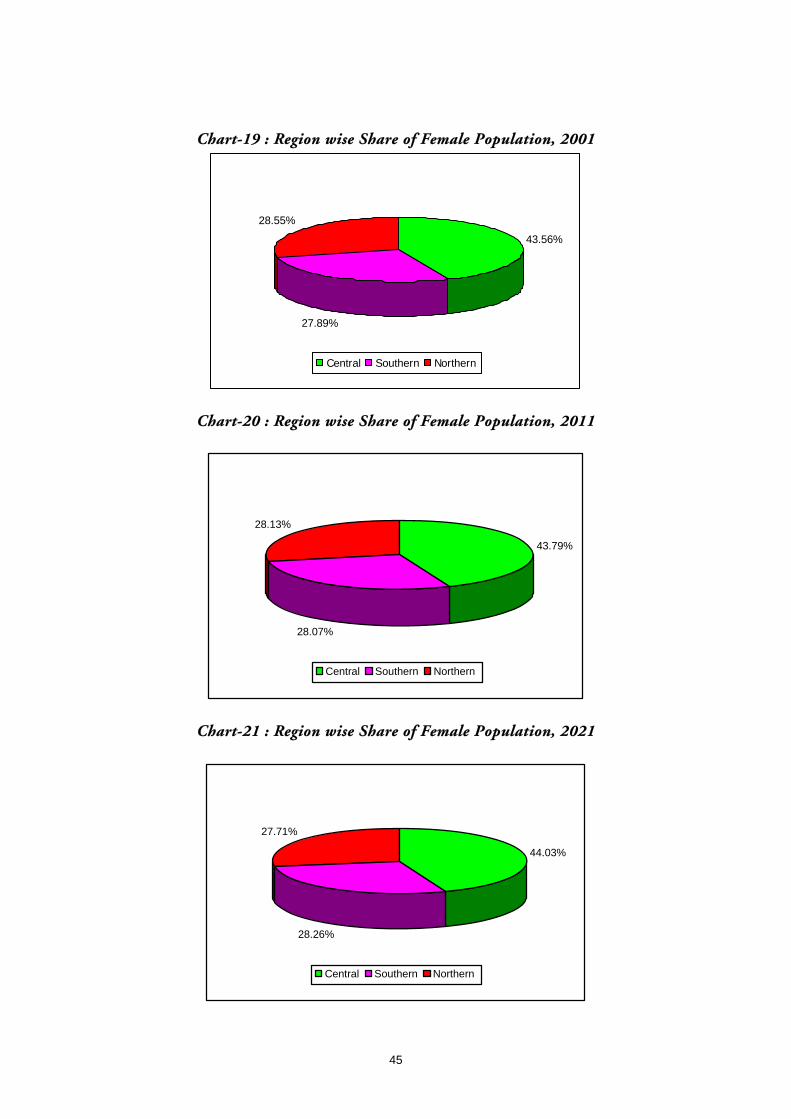
The region wise sex ratio and projected sex ratio is presented in the Chart‐18.
Central region had the lowest sex ratio compared to Northern and Southern
region. Southern region, being the backward region and all regions got the
highest sex ratio with 1002 in 2001, 1007 in 2011(projected) and 1014 in
2021(projected), although the sex ratio in Central and Northern regions are
expected to increase in 2011 and 2021.
45
Chart-19 : Region wise Share of Female Population, 2001
43.56%
27.89%
28.55%
Central Southern Northern
Chart-20 : Region wise Share of Female Population, 2011
43.79%
28.07%
28.13%
Central Southern Northern
Chart-21 : Region wise Share of Female Population, 2021
44.03%
28.26%
27.71%
Central Southern Northern
46
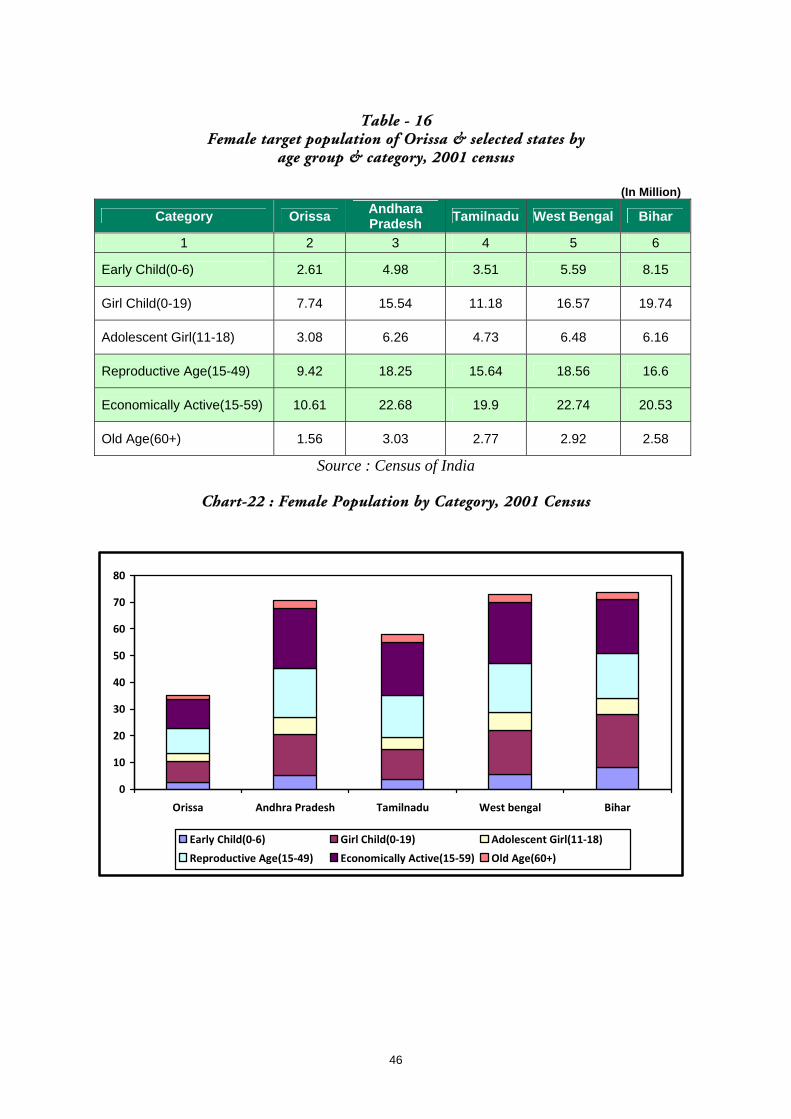
Table - 16
Female target population of Orissa & selected states by age group & category, 2001 census
(In Million)
Category Orissa Andhara Pradesh Tamilnadu West Bengal Bihar
1 2 3 4 5 6
Early Child(0-6) 2.61 4.98 3.51 5.59 8.15
Girl Child(0-19) 7.74 15.54 11.18 16.57 19.74
Adolescent Girl(11-18) 3.08 6.26 4.73 6.48 6.16
Reproductive Age(15-49) 9.42 18.25 15.64 18.56 16.6
Economically Active(15-59) 10.61 22.68 19.9 22.74 20.53
Old Age(60+) 1.56 3.03 2.77 2.92 2.58
Source : Census of India
Chart-22 : Female Population by Category, 2001 Census
0
10
20
30
40
50
60
70
80
Orissa Andhra Pradesh Tamilnadu West bengal Bihar
Early Child(0‐6) Girl Child(0‐19) Adolescent Girl(11‐18)
Reproductive Age(15‐49) Economically Active(15‐59) Old Age(60+)

47
Table –17 Population of Female target groups for Orissa during 20
District
Early Child 0-6
% to total Early child
Girl Child 0-19
% to total Girl child
Adolescent Girl
11-18
% to Adoles cent girl
Reproductive Age
15-49
% to total Reprod.
age
Economically Active 15 59
% to total Econ. active
Old Age 60 +
% to total
Old age 1 2 3 4 5 6 7 8 9 10 11 12 13
Bargarh 85334 3.26 273122 3.53 120153 3.89 344203 3.69 394084 3.71 67238 4.30 Jharsuguda 32549 1.25 105527 1.36 45696 1.48 147776 1.40 147510 1.39 21057 1.35 Sambalpur 61406 2.35 262122 3.39 81895 2.65 252517 2.62 275648 2.60 39080 2.50 Debagarh 20704 0.79 60389 0.78 24158 0.78 91758 0.75 78304 0.74 10915 0.70 Sundargarh 130451 4.99 387489 5.00 155454 5.04 460780 5.04 531144 5.01 62416 3.99 Keonjhar 119445 4.57 332815 4.30 130639 4.23 392159 4.24 447200 4.22 54320 3.47 Mayurbhanj 178253 6.82 478503 6.18 168773 5.47 529193 5.84 623514 5.88 84678 5.41 Balasore 143749 5.50 435587 5.63 175066 5.67 498153 5.48 570879 5.38 78820 5.04 Bhadrak 93483 3.58 292472 3.78 122141 3.96 340049 3.64 379527 3.58 56179 3.59 Kendrapara 84783 3.24 275041 3.55 119229 3.86 334931 3.58 381517 3.60 69489 4.44 Jagatsinghpu 59868 2.29 204432 2.64 90786 2.94 278649 2.92 313824 2.96 55239 3.53 Cuttack 138899 5.31 453116 5.85 196934 6.38 583829 6.48 686842 6.47 111701 7.14 Jajpur 105606 4.04 416409 5.38 148540 4.81 412862 4.48 474748 4.48 69980 4.47 Dhenkanal 70092 2.68 211643 2.73 91957 2.98 279475 2.93 312385 2.94 44141 2.82 Anugul 79302 3.03 242852 3.14 100267 3.25 295146 3.11 325385 3.07 40217 2.57 Nayagarh 53730 2.06 168234 2.17 70877 2.30 225621 2.30 249011 2.35 41360 2.64 Khurda 110783 4.24 355709 4.59 152147 4.93 477377 5.24 551944 5.20 71990 4.60 Puri 90894 3.48 295294 3.81 127329 4.13 387696 4.19 448027 4.22 72210 4.62 Ganjam 230258 8.81 685157 8.85 274208 8.88 756266 8.48 905245 8.53 137681 8.80 Gajapati 45497 1.74 118719 1.53 41075 1.33 147549 1.40 147884 1.39 18988 1.21 Kandhamal 57768 2.21 150906 1.95 52306 1.69 174253 1.71 179626 1.69 22817 1.46 Baudh 29993 1.15 80785 1.04 30727 1.00 113698 1.00 107289 1.01 14736 0.94 Sonepur 37984 1.45 117944 1.52 50436 1.63 149986 1.42 152833 1.44 24291 1.55 Bolangir 94243 3.60 277627 3.59 111450 3.61 333649 3.56 382989 3.61 66402 4.25 Nuapada 41594 1.59 114529 1.48 42150 1.37 146424 1.38 147912 1.39 27001 1.73 Kalahandi 108082 4.13 281170 3.63 99948 3.24 331686 3.54 381769 3.60 59430 3.80 Rayagada 72042 2.76 182342 2.35 60335 1.95 225078 2.30 243244 2.29 28957 1.85 Nawarangppur 93460 3.58 237024 3.06 77560 2.51 257543 2.68 282162 2.66 33445 2.14 Korapput 99508 3.81 255581 3.30 85032 2.76 306984 3.25 345326 3.26 35806 2.29 Malkangiri 44498 1.70 116866 1.51 39044 1.27 143738 1.35 140266 1.32 15786 1.01 Orissa 2614258 100.00 7742992 100.00 3086312 100.00 9419038 100.00 10608038 100.00 1564053 100.00

53
HEALTH SCENARIO
Table – 18
54
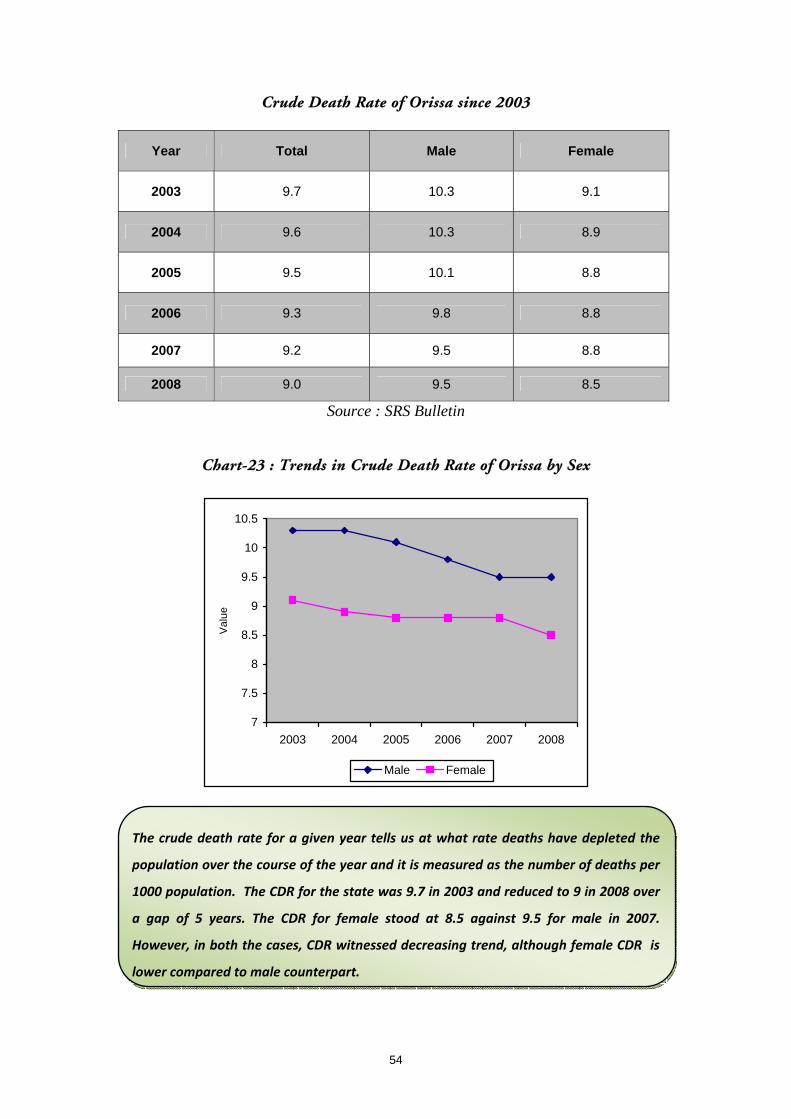
Crude Death Rate of Orissa since 2003
Year Total Male Female
2003 9.7 10.3 9.1
2004 9.6 10.3 8.9
2005 9.5 10.1 8.8
2006 9.3 9.8 8.8
2007 9.2 9.5 8.8
2008 9.0 9.5 8.5
Source : SRS Bulletin
Chart-23 : Trends in Crude Death Rate of Orissa by Sex
7
7.5
8
8.5
9
9.5
10
10.5
2003 2004 2005 2006 2007 2008
Val
ue
Male Female
The crude death rate for a given year tells us at what rate deaths have depleted the
population over the course of the year and it is measured as the number of deaths per
1000 population. The CDR for the state was 9.7 in 2003 and reduced to 9 in 2008 over
a gap of 5 years. The CDR for female stood at 8.5 against 9.5 for male in 2007.
However, in both the cases, CDR witnessed decreasing trend, although female CDR is
lower compared to male counterpart.

55
Table – 19 Crude Death Rate by selected states, 2008
States Total Male Female
Orissa 9.0 9.5 8.5
Andhra Pradesh 7.5 8.3 6.7
Tamilnadu 7.4 8.3 6.5
Bihar 7.3 7.6 6.9
West Bengal 6.2 6.9 5.5
All India 7.4 8.0 6.8
Source : SRS Bulletin
Chart-24 : Crude Death Rate by States, 2008
0 2 4 6 8 10Orissa
Andhra
Prad
eshTa
milnad
uBiha
r
Wes
t Ben
gal
All Ind
ia
Total Male Female
Crude Death Rates for Orissa was 9.0 in 2008, which was higher compared to other
states above including all India figure of 7.4. Crude Death Rate by sex indicates that
Orissa had 9.5 for male and 8.5 for female against all India figure of 8.0 and 6.8
respectively. The lowest Crude Death Rate State was West Bengal with 6.9 for male
and 5.5 for female against state average of 6.2.

56
Table – 20
Death Rate for Persons for specific ages of Orissa
0-4 5--14 15-59 60+
Year/ Age
Total Male Female Total Male Female Total Male Female Total Male Female
2004 22.2 22 22.4 1.8 1.9 1.6 4.4 5 3.8 50.8 55.4 46.4
2005 21.4 21.3 21.6 1.6 1.5 1.8 4.5 5.4 3.7 50.8 53.4 48.2
2006 22 21.5 22.4 1.8 1.7 1.9 4.6 5.1 4.1 47.9 51.7 44.2
2007 20 19.7 20.4 1.6 1.6 1.5 4.3 4.7 3.9 51.7 53.6 49.8
Source – SRS Statistical Report
Chart-25 : Age Specific Death Rate of Orissa, 2007
0
10
20
30
40
50
60
0-4 '5-14 '15-59 60+
Growth rate 2007
Age Specific Death Rate (per 1000 population) constitutes population of number of
deaths in a particular age group to mid‐year population of the same age group.
Female age specific death rate in 0 – 4 year was 20.4 in 2007, which was higher
compared to male counterpart, where as the corresponding figure of female in the age
group 5 ‐14, 15 – 59 and 60+ years was lower as compared to male.

57
Table – 21
Age Specific Death Rate by States & Sex, 2007
0-4 5-14 15-59 60+ STATES/Age
Male Female Male Female Male Female Male Female
Orissa 19.7 20.4 1.6 1.5 4.7 3.9 53.6 49.8
Bihar 17.7 20.1 1.4 1.9 4.0 3.3 45.5 43.2
Andhra Pradesh 14.7 14.5 0.6 0.6 5.5 3.2 46.4 39.9
West Bengal 9.3 9.1 0.9 0.9 3.7 2.6 51.4 42.5
Tamilnadu 8.7 8.2 0.8 0.7 4.6 2.9 45.6 41.2
All India 15.2 16.9 1.1 1.2 4.4 3.0 51.0 42.0
Source – SRS Statistical Report, 2007
Chart-26 : Age Specific Death Rate by States & Sex, 2007
Age specific death rate for selected states in 2007 is presented above, Orissa had
higher death rate in 0–4, 5–14, and 60+ age group compared to other states except for
female in 5 – 14 age group in which Bihar had highest with 1.9. Andhra Pradesh had
higher male death rate (5.5) in the age group 15 – 59 compared to above selected
States. It is also noticed that death rate in the age group 0‐4 and 60+ years for above
selected states was higher compared to 5‐14 and 15‐59 age group.
58
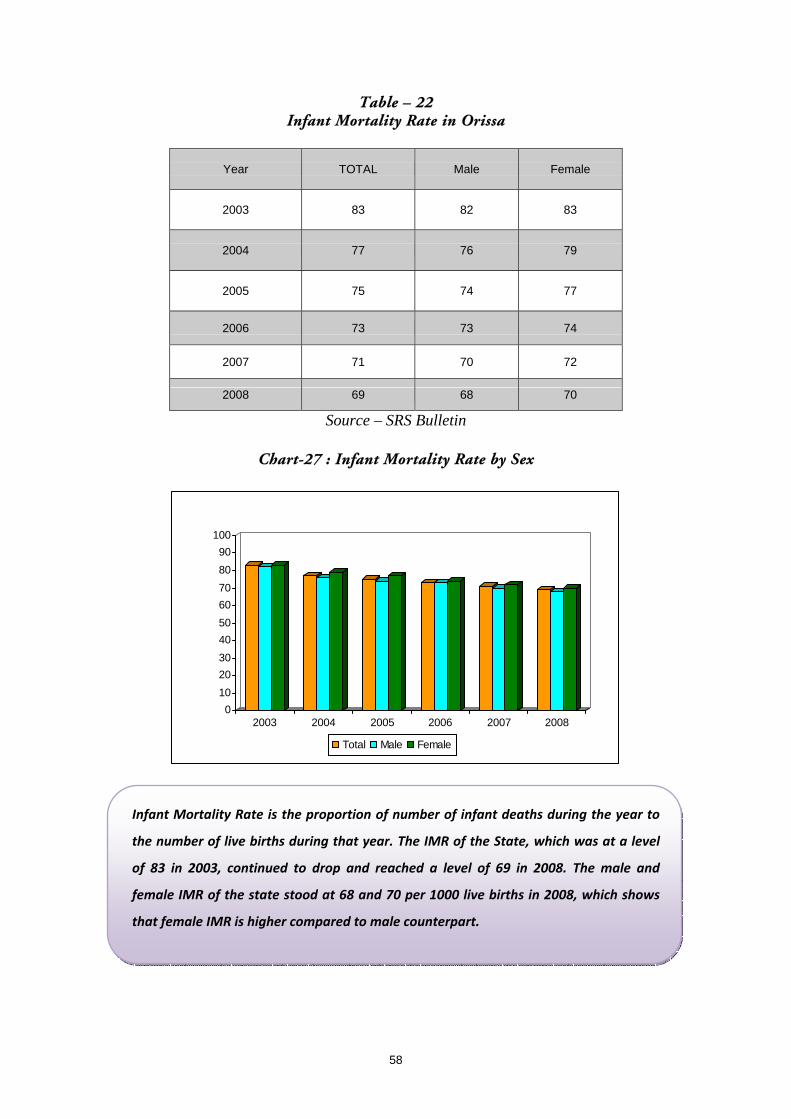
Table – 22 Infant Mortality Rate in Orissa
Year TOTAL Male Female
2003 83 82 83
2004 77 76 79
2005 75 74 77
2006 73 73 74
2007 71 70 72
2008 69 68 70
Source – SRS Bulletin
Chart-27 : Infant Mortality Rate by Sex
0102030405060708090
100
2003 2004 2005 2006 2007 2008
Total Male Female
Infant Mortality Rate is the proportion of number of infant deaths during the year to
the number of live births during that year. The IMR of the State, which was at a level
of 83 in 2003, continued to drop and reached a level of 69 in 2008. The male and
female IMR of the state stood at 68 and 70 per 1000 live births in 2008, which shows
that female IMR is higher compared to male counterpart.

59
Table – 23 Infant Mortality Rate by Sex & selected states, 2008
Total Rural Urban
States Total Male Female Total Male Female Total Male Female
1 2 3 4 5 6 7 8 9 10
Andhra Pradesh 52 51 54 58 56 60 36 36 37
Tamilnadu 31 30 33 34 33 35 28 27 30
Bihar 56 53 58 57 54 59 42 41 44
Orissa 69 68 70 71 70 73 49 45 52
West Bengal 35 34 37 37 36 38 29 27 31
All India 53 52 55 58 57 60 36 34 38
Source – SRS Bulletin, 2008
Chart-28 : Infant Mortality Rate by Sex, 2008
52 51 54
31 30 33
56 53 58
69 68 70
35 34 37
53 52 55
0 50 100 150 200 250
Andhra Pradesh
Tamilnadu
Bihar
Orissa
West Bengal
All India
Total Male Female
The Statewise IMR indicates that IMR was highest in Orissa among above states.
Tamilnadu had lowest IMR with 31 followed by West Bengal with 35 against all India
figure of 53. IMR in Rural Orissa was 71 and the corresponding figure for Urban Orissa
was 49. The lowest Rural IMR was also noticed in Tamilnadu with 34 and followed by
37 in West Bengal . The MDG goal of IMR for all India is 27 by 2015.

60
Chart-29 : Infant Mortality Rate by Sex, 2008(Rural)
5834
57 7137
58
56
33
5470
36
57
60
35
59
73
38
60
0
50
100
150
200
250
AndhraPradesh
Tamilnadu Bihar Orissa West Bengal All India
Total Male Female
Chart-30 : Infant Mortality Rate by Sex, 2008(Urban)
36 2842 49
29 36
3627
4145
2734
37
30
4452
31
38
0
20
40
60
80
100
120
140
160
AndhraPradesh
Tamilnadu Bihar Orissa West Bengal All India
Total Male Female
The rural and urban IMR for selected states are presented in the charts above. It is
observed that Urban India had lower IMR compared to Rural India. Orissa had
witnessed higher IMR for rural and urban area compared to above states. It is found
that IMR for Tamilnadu in rural/urban area was the lowest compared to above states
including all India.

61
Table – 24 Maternal Mortality Ratio (Per one lakh live births) of Selected States
Selected States MMR 2001-03 MMR 2004-06 Drop in MMR (2001-03)-(2004-06)
Andhra Pradesh 195 154 41
Bihar( undivided) 371 312 59
Orissa 358 303 55
Tamil Nadu 134 111 23
West Bengal 194 141 53
INDIA TOTAL 301 254 47
Chart-31 : Maternal Mortality Ratio of States
195
371 358
134
194
301
154
312 303
111141
254
0
50
100
150
200
250
300
350
400
450
Andhra Pradesh
Bihar ( undivided)Orissa
Tamil Nadu West Bengal
INDIA TOTAL
MMR 2001-03 MMR 2004-06
Maternal Mortality Ratio (MMR) is the number of maternal deaths per one lakh live
births. For Orissa the MMR was 303 (2004‐06), which is just below the MMR of
undivided Bihar (312). However for the other selected states like Andhra Pradesh,
Tamilnadu and West Bengal had the MMR was lowest with 154, 111 and 141
compared to Orissa. The all India MMR stood at 254, against MDG goal 109 by 2015.
Further compared to MMR 2001‐03, undivided Bihar, Orissa and West Bengal
witnessed larger drop in MMR(2004‐05) with 59, 55 and 53 against all India drop in
MMR of 47.

62
Table – 25
Crude Birth Rate of Orissa since 2003
Year Total Rural Urban
2004 22.7 23.6 17.3
2005 22.3 23.2 16.3
2006 21.9 22.8 16.2
2007 21.5 22.4 16.1
2008 21.4 22.2 16.0
Source – SRS Bulletin
Chart-32 : Trends in Birth Rate in Orissa by Sector
0
5
10
15
20
25
2004 2005 2006 2007 2008
Total Rural Urban
To examine the changes in the level of fertility, Crude Birth Rate (CBR) is being
calculated and is expressed as number of births per 1000 population. The CBR of the
state was 22.7 in 2004 and declined to 21.4 in 2008 with 22.2 in Rural and 16.0 in
Urban Orissa for 2008. Besides the crude birth rate in rural Orissa was found higher
compared urban area. For both rural and urban Orissa the CBR was witnessing a
decreasing trend.

63
Table – 26
Crude Birth Rate by selected States & Sector, 2008
States Total Rural Urban
Andhra Pradesh 18.4 19.1 16.8
Tamilnadu 16 16.2 15.8
Bihar 28.9 29.7 22.5
Orissa 21.4 22.2 16
West Bengal 17.5 19.4 12.4
All India 22.8 24.4 18.5
Source – SRS Bulletin
Chart-33 : Crude birth rate by States & sector, 2008
0
5
10
15
20
25
30
35
Andhra Pradesh
TamilnaduBihar
Orissa
West BengalAll In
dia
Total Rural Urban
Among the selected states, the Crude Birth Rate was lowest in Tamilnadu with 16
followed by West Bengal with 17.5. Bihar had highest CBR with 28.9 against all India
figure of 22.8. Orissa stood at second with 21.4 behind Bihar state. In urban sector,
West Bengal had the lowest CBR with 12.4 against all India figure of 18.5. Tamilnadu
had the second lowest CBR with 15.8, although urban Orissa had CBR with 16.0.

64
Chart-34 : Trends in Crude Death Rate & Crude Birth Rate of Orissa
9.6
9.5
9.3
9.2
9
22.7
22.3
21.9
21.521.4
8.7
8.8
8.9
9
9.1
9.2
9.3
9.4
9.5
9.6
9.7
2004 2005 2006 2007 200820.5
21
21.5
22
22.5
23
CDR CBR
Chart-35 : Death / Birth Rate of Selected States, 2008
0
5
10
15
20
25
30
35
Orissa
Andhra PradeshTamilnadu Bihar
West BengalAll India
Death rate Birth rate
65
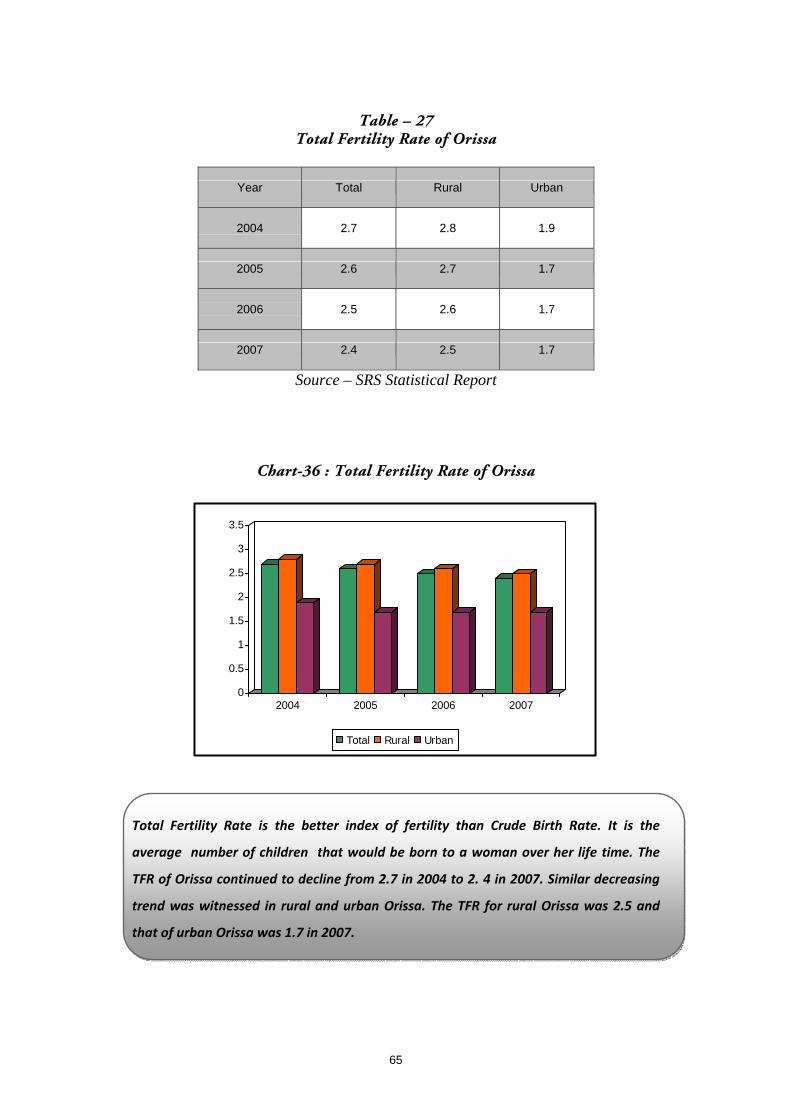
Table – 27
Total Fertility Rate of Orissa
Year Total Rural Urban
2004 2.7 2.8 1.9
2005 2.6 2.7 1.7
2006 2.5 2.6 1.7
2007 2.4 2.5 1.7
Source – SRS Statistical Report
Chart-36 : Total Fertility Rate of Orissa
0
0.5
1
1.5
2
2.5
3
3.5
2004 2005 2006 2007
Total Rural Urban
Total Fertility Rate is the better index of fertility than Crude Birth Rate. It is the
average number of children that would be born to a woman over her life time. The
TFR of Orissa continued to decline from 2.7 in 2004 to 2. 4 in 2007. Similar decreasing
trend was witnessed in rural and urban Orissa. The TFR for rural Orissa was 2.5 and
that of urban Orissa was 1.7 in 2007.

66
Table – 28
Total Fertility Rate of states, 2007
States Total Rural Urban
Andhra Pradesh 1.9 2 1.6
Tamilnadu 1.6 1.7 1.5
Bihar 3.9 4.1 2.9
Orissa 2.4 2.5 1.7
West Bengal 1.9 2.1 1.4
All India 2.7 3 2
Chart-37 : Total Fertility Rate of states, 2007
0
1
2
3
4
5
Andhra PradeshTamilnadu Bihar
OrissaWest Bengal
All India
Total Rural Urban
The Total Fertility Rate of selected states shows that Tamilnadu had the lowest TFR
with 1.6 followed by Andhra Pradesh and West Bengal with 1.9 each. However Bihar
had higher TFR with 3.9 against all India figure of 2. 7. In case of rural sector,
Tamilnadu had the lowest fertility rate with 1.7. However in urban sector West Bengal
had the lowest total fertility rate with 1.4 against all India figure of 2.0.

67
Table – 29 Expectation of Life at Birth by Sex
Orissa All India
Year Total Male Female Total Male Female
1 2 3 4 5 6 7
1971-81 50.76 51.93 49.59 NA NA NA
1981-86 53.01 54.13 51.9 56 55.6 56.4
1986-91 56.14 57.13 55.15 58.6 58.1 59.1
1991-96 59.26 60.13 58.4 61.15 60.6 61.7
1996-01 61.64 62.13 61.15 63.5 62.8 64.2
2001-05(Proj) 61.3 60.3 62.3 64.95 63.8 66.1
2006-10(Proj) 63.55 62.3 64.8 66.95 65.8 68.1
Source – Report of the technical group on Population Projection, National Commission on Population.
Chart-38 : Trends in Expectation of life at birth, Orissa
40
45
50
55
60
65
70
1971-811981-86
1986-911991-96
1996-01
2001-05(Proj)
2006-10(Proj)
MALE FEMALE
Life expectancy at birth reflects the average number of years a new born baby is expected to
survive. It is found from the table that life expectancy for female in Orissa was lower, compared to
male counterpart for 1971‐81 to 1996‐01. However, during 2001‐06, the female life expectancy
increases to 62.3 years against 60.3 years for male. The projected life expectancy for 2006‐10 also
shows that female expectation of life would be 64.8 against 62.3 for male, where as the all India
figure for female and male would be 68.1 years and 65.8 years respectively.

68
Table – 30
Year wise Number of HIV Positive detected in Orissa
Adult Children Year
Male Female Ratio(F/M) Male Female Ratio(F/M)
2005 759 390 0.51 53 49 0.92
2006 1320 755 0.57 83 59 0.71
2007 1841 1106 0.60 111 80 0.72
Source – Orissa State AIDS Control Society (CMIS)
Chart-39 : Trends in HIV Positive detected in Adult in Orissa
759
1320
1841
390
755
1106
0
500
1000
1500
2000
2005 2006 2007
In n
umbe
rs
Male Female
The HIV positive detected cases in Orissa shows an increasing trend for both male and
female category. The ratio of female to male (adult HIV positive) was 0.51 in 2005 and
increased to 0.60 in 2007, whereas the ratio of female to male (children HIV positive)
was decreased to 0.72 in 2007 against 0.92 in 2005.

69
Table – 31
Nutritional Status Report of 0-3 Years Children of Orissa
Children Weighed No of Malnourished children Percentage Month
Boys Girls Boys Girls Boys Girls
2004-05 1139675 1101657 652716 665270 57.27 60.39
2005-06 1134958 1093064 627810 650941 55.32 59.55
2006-07 1150108 1103268 621627 642965 54.05 58.28
2007-08 1187584 1136633 623167 641944 52.47 56.48
2008-09 1221279 1164794 630859 647450 51.66 55.58
2009-10 1221037 1169209 618018 633988 50.61 54.22
Table – 32
Nutritional Status Report of 3-6 Years Children of Orissa
Children Weighed No of Malnourished children Percentage Month
Boys Girls Boys Girls Boys Girls
2004-05 941562 914596 537411 546469 57.08 59.75
2005-06 923225 893694 518023 530526 56.11 59.36
2006-07 921638 896050 509665 519846 55.30 58.02
2007-08 957936 927693 511143 519216 53.36 55.97
2008-09 974352 941071 508189 519687 52.16 55.22
2009-10 1007504 970474 510450 518038 50.66 53.38
Source – Women and Child Development Department, Orissa

70
Chart-40 : Malnourished Children in the State( 0-3 years)
57.27
60.39
55.32
59.55
54.05
58.28
52.47
56.48
51.66
55.58
50.61
54.22
44
46
48
50
52
54
56
58
60
62
(In P
erce
ntag
e)
2004-05 2005-06 2006-07 2007-08 2008-09 2009-10
Boys Girls
Chart-41 : Malnourished Children in the State( 3-6 years)
57.08
59.75
56.11
59.36
55.3
58.02
53.36
55.97
52.16
55.22
50.66
53.38
46
48
50
52
54
56
58
60
(In P
erce
ntag
e)
2004-05 2005-06 2006-07 2007-08 2008-09 2009-10
Boys Girls

71
Table – 33
Districtwise Nutritional Status Report of 0-3 Years Children, 2009-10
Children Weighed No of Malnourished Children Percentage Sl
No District
Boys Girls Boys Girls Boys Girls
1 2 3 4 5 6 7 8
1 Angul 32127 29357 16256 16543 50.60 56.35
2 Balasore 63374 60493 30567 31338 48.23 51.80
3 Baragarh 39954 38694 21342 21919 53.42 56.65
4 Bhadrak 46760 44590 26479 25275 56.63 56.68
5 Bolangir 56740 55027 28979 29152 51.07 52.98
6 Boudh 13306 13253 6606 7526 49.65 56.79
7 Cuttack 54785 51452 21277 21846 38.84 42.46
8 Deogarh 9442 9122 4690 5044 49.67 55.29
9 Dhenkanal 31431 28295 13939 13703 44.35 48.43
10 Gajapati 23045 22765 13039 13416 56.58 58.93
11 Ganjam 108786 102187 55374 53777 50.90 52.63
12 Jharsuguda 14135 13342 7203 7885 50.96 59.10
13 Jajpur 52951 50684 26662 25826 50.35 50.95
14 Jagatsinghpur 26279 25124 9227 9179 35.11 36.53
15 Kalahandi 53486 51753 28193 30585 52.71 59.10
16 Kendrapara 53491 50070 24476 23067 45.76 46.07
17 Keonjhar 56400 55117 31626 32619 56.07 59.18
18 Khurda 38576 35638 15078 15006 39.09 42.11
19 Koraput 51523 51080 31296 31922 60.74 62.49
20 Malkangiri 24746 24157 15328 15811 61.94 65.45
21 Mayurbhanj 73434 71236 37118 41871 50.55 58.78
22 Nuapada 20952 20598 10967 12376 52.34 60.08
23 Nawarangpur 47694 47692 29149 30026 61.12 62.96
24 Nayagarh 26059 23319 11415 11404 43.80 48.90
25 Kandhamal 25698 25156 13201 14180 51.37 56.37
26 Puri 45261 43442 16306 16170 36.03 37.22
27 Rayagada 31203 30372 19383 19974 62.12 65.76
28 Sambalpur 26011 25099 14084 15149 54.15 60.36
29 Subarnapur 21068 20217 10002 9927 47.47 49.10
30 Sundargarh 52320 49878 28756 31472 54.96 63.10
State Total 1221037 1169209 618018 633988 50.61 54.22
Source : Women and Child Development Department, Orissa

72
Table – 34
Districtwise Nutritional Status Report of 3-6 Years Children, 2009-10
Children Weighed No of Malnourished Children Percentage Sl
No District
Boys Girls Boys Girls Boys Girls
1 2 3 4 5 6 7 8
1 Angul 29875 27508 14160 14110 47.40 51.29
2 Balasore 59042 56231 29297 29159 49.62 51.86
3 Baragarh 28772 28691 15194 15436 52.81 53.80
4 Bhadrak 35217 33801 19490 19090 55.34 56.48
5 Bolangir 38597 37559 20235 20417 52.43 54.36
6 Boudh 12134 12076 6541 6673 53.91 55.26
7 Cuttack 50265 47467 19251 18786 38.30 39.58
8 Deogarh 7803 7214 4172 3891 53.47 53.94
9 Dhenkanal 27215 24416 11579 11051 42.55 45.26
10 Gajapati 16627 16380 9225 9298 55.48 56.76
11 Ganjam 89289 84526 44482 43992 49.82 52.05
12 Jharsuguda 12455 11899 6851 7364 55.01 61.89
13 Jajpur 44256 42191 20462 21011 46.24 49.80
14 Jagatsinghpur 23537 22581 8953 8553 38.04 37.88
15 Kalahandi 34134 33361 19353 20641 56.70 61.87
16 Kendrapara 46229 44064 20394 19440 44.12 44.12
17 Keonjhar 40802 40223 22859 23514 56.02 58.46
18 Khurda 30715 28579 12614 12595 41.07 44.07
19 Koraput 43756 43148 26727 25909 61.08 60.05
20 Malkangiri 20478 20932 12595 13263 61.51 63.36
21 Mayurbhanj 68420 66434 36429 39552 53.24 59.54
22 Nuapada 14976 14838 8735 9441 58.33 63.63
23 Nawarangpur 38466 38761 23394 24227 60.82 62.50
24 Nayagarh 23462 21179 11558 11054 49.26 52.19
25 Kandhamal 19467 19043 9639 10262 49.51 53.89
26 Puri 42547 41692 15632 16033 36.74 38.46
27 Rayagada 20276 19710 12382 12670 61.07 64.28
28 Sambalpur 23200 22301 13360 13795 57.59 61.86
29 Subarnapur 16725 16281 7087 6873 42.37 42.21
30 Sundargarh 48767 47388 27800 29938 57.01 63.18
State Total 1007504 970474 510450 518038 50.66 53.38
Source : Women and Child Development Department, Orissa

73
Percentage of Malnourished Children in the age group of 0-3 Years in Orissa, 2009-10
Percentage of Malnourished Children in the age group of 3-6 Years in Orissa, 2009-10

74
Table – 35
Population with Disability, 2001 Census
And percentage disability out of total disabled
Type Persons Percentage Male Percentage Female Percentage
1 2 3 4 5 6 7
Total Disabled 1021335 100 568914 100 452421 100
In Seeing 514104 50.34 274151 48.19 239953 53.04
In Speech 68673 6.72 37625 6.61 31048 6.86
In Hearing 84115 8.24 45701 8.03 38414 8.49
In Movement 250851 24.56 153077 26.91 97774 21.61
In Mental 103592 10.14 58360 10.26 45232 10.00
Source : Census of India
Table – 36
Population with Disability, 2001 Census
Type Persons Male Female Persons Male Female
1 2 3 4 5 6 7
Total Disabled 1021335 568914 452421 100 55.70 44.30
In Seeing 514104 274151 239953 100 53.33 46.67
In Speech 68673 37625 31048 100 54.79 45.21
In Hearing 84115 45701 38414 100 54.33 45.67
In Movement 250851 153077 97774 100 61.02 38.98
In Mental 103592 58360 45232 100 56.34 43.66
Source : Census of India

75
Chart-42 : Percentage Disability according to type (2001 Census), Orissa
50.34%
6.72%8.24%
24.56%
10.14%
In Seeing In Speech In Hearing In Movement In Mental
Chart-43 : Percentage Disability by type & sex, 2001
53.33 54.79 54.33 61.02 56.34
46.67 45.21 45.67 38.98 43.66
0.00
20.00
40.00
60.00
80.00
100.00
120.00
In Seeing In Speech In Hearing InMovement
In Mental
Male Female

76
EDUCATIONAL GAINS IN
MEN & WOMEN

77
Table - 37
Literacy rate of Orissa
Year Male Female Person Gender Disparity Index
1 2 3 4 5
1961 33.1 7.9 28.5 0.7636
1971 44.5 16.3 30.5 0.6146
1981 56.5 25.1 40.9 0.5884
1991 63.1 34.7 49.1 0.5076
2001 75.4 50.5 63.1 0.4764
Source : Census of India
Chart - 44 : Trends in literacy rate by sex in Orissa
0.00
10.00
20.00
30.00
40.00
50.00
60.00
70.00
80.00
19611971
19811991
2001
Male Female Persons
An educated population leads to increased productivity, which in turn can contribute effectively to output growth. Literacy and education are the two important indicators that reflect the development in the society. According to the census definition, persons of age 7 years and above who can both read and write with understanding in any language is treated as literate. The literacy rate of Orissa was increased from 28.5 in 1961 to 63.1 in 2001, an increase of 34.6 percentage points between 1961‐2001. The male literacy rate of Orissa was 75.4 in 2001 and that of female literacy was 50.5 only. The gender disparity in Orissa’s literacy rate in 2001 was 0.4764 as against 0.5076 in 1991 a decline of 0.0312 points.

78
Table – 38 Literacy Rates of selected States of Orissa by Sex
Year/ State 1991 2001
State Male Female Person Gender Disparity
Index Male Female Person
Gender Disparity
Index
Andhra Pradesh 55.1 32.7 44.1 0.4024 70.9 51.2 61.1 0.3654
Bihar 52.5 22.9 38.5 0.5707 60.3 33.6 47.5 0.4783
Orissa 63.1 34.7 49.1 0.5076 75.4 50.5 63.1 0.4764
Tamilnadu 73.8 51.3 62.7 0.4272 82.3 64.6 73.5 0.4080
West Bengal 67.8 46.5 57.7 0.3843 77.6 60.2 69.2 0.3590
All India 64.1 39.3 52.2 0.4406 75.3 53.7 64.8 0.4197
Source: Census of India
Chart – 45 : Literacy Rates of selected States of Orissa by Sex, 2001
0 10 20 30 40 50 60 70 80 90
Andhra Pradesh
Bihar
Orissa
Tamilnadu
West Bengal
All India
Male Female
The literacy rates of states presented in the table above shows that Tamilnadu had highest
literacy rate with 73.5 in 2001 followed by West Bengal with 69.2. The all India literacy rate
was 64.8 in 2001. The gender disparity index of West Bengal was 0.3590 being the lowest
compared to other states above in 2001, where as the disparity index of Orissa stood at
0.4764 as against 0.4197 of all India.

79
Table - 39
Literacy rate in Orissa by Sector
Sector Census Male Female Person Gender Disparity Index
1981 53.5 21.9 37.7 0.6131
1991 60.0 30.7 45.4 0.5297 Rural
2001 72.9 46.7 59.8 0.4885
1981 76.3 50.9 64.8 0.4921
1991 81.2 61.1 71.9 0.4393 Urban
2001 87.9 72.9 80.8 0.4333
1981 56.4 25.1 40.9 0.5866
1991 63.1 34.6 49.1 0.5095 Persons
2001 75.4 50.5 63.1 0.4764
Rural-Urban Disparity in Literacy
1981 0.4469 0.5678 0.4832
1991 0.4593 0.5497 0.4882
2001 0.4320 0.4872 0.4520
Source: Census of India
Chart – 46 : Literacy by Sex in Rural Orissa
0 15 30 45 60 75 90 105 120 135 150
1981
1991
2001
Males Females

80
Chart – 47 : Literacy by Sex in Urban Orissa
0 20 40 60 80 100 120 140 160 180 200
1981
1991
2001
Males Females
The literacy rate of Orissa by sectors indicates that rural Orissa literacy rate
was 59.8 in 2001 as against 80.8 for urban Orissa, a gap of 21.0 point. The
gender disparity index of rural Orissa literacy was 0.4885 in 2001, which was
higher compared to all Orissa disparity of 0.4764. However, urban disparity
index in literacy was 0.4333 in 2001, a decline of 0.0431 point for all Orissa
disparity of 0.4764. Thus there was a significant disparity between rural and
urban Orissa in literacy rate. The rural urban disparity index in literacy shows a
declining trend from 0.4832 in 1981 to 0.4520 in 2001.

81
Table – 40
District wise Literacy Rate, 2001
Literacy Rate (Rural) Literacy Rate (Urban) Literacy Rate (All classes) Gender Disparity IndexSl
No. Name of the District/State
Person Male Female Person Male Female Person Male Female Rural Urban Total
1 2 3 4 5 6 7 8 9 10 11 12 13 14
1 Angul 66.1 79.7 52.0 85.1 91.4 77.5 68.8 81.4 55.4 0.5590 0.4906 0.5483
2 Balasore 69.5 81.2 57.4 78.8 85.8 71.2 70.6 81.7 58.9 0.5048 0.3870 0.4932
3 Baragarh 62.7 76.5 48.6 79.2 87.7 70.1 64.0 77.4 50.3 0.5367 0.4845 0.5304
4 Bhadrak 74.3 85.4 63.0 70.4 78.9 61.4 73.9 84.7 62.9 0.5342 0.3708 0.5132
5 Bolangir 52.7 69.5 35.8 78.0 87.1 68.2 55.7 71.7 39.5 0.6125 0.4977 0.5881
6 Boudh 56.5 75.3 37.4 82.0 92.9 70.5 57.7 76.2 39.0 0.7085 0.7366 0.7000
7 Cuttack 73.6 84.3 62.5 84.7 89.7 78.9 76.7 85.8 66.9 0.5060 0.3658 0.4763
8 Deogarh 59.1 72.4 45.6 76.3 84.1 67.7 60.4 73.3 47.2 0.4959 0.4035 0.4883
9 Dhenkanal 68.0 79.5 56.1 84.1 90.8 76.7 69.4 80.6 57.9 0.4823 0.4776 0.4795
10 Gajapati 37.6 51.4 24.5 71.1 81.2 61.1 41.3 54.7 28.4 0.5126 0.4389 0.4832
11 Ganjam 56.5 72.2 41.3 79.7 88.2 70.6 60.8 75.2 46.4 0.5679 0.4956 0.5442
12 Jagatsinghpur 78.7 88.6 68.8 82.2 88.1 74.5 79.1 88.6 69.3 0.5477 0.4053 0.5352
13 Jajpur 71.0 81.6 60.1 81.7 88.4 74.3 71.4 81.9 60.8 0.4676 0.4195 0.4654
14 Jharsuguda 66.7 79.5 53.6 77.5 86.6 67.4 70.7 82.2 58.5 0.5265 0.4945 0.5145
15 Kalahandi 43.5 60.7 26.5 74.4 84.6 63.4 45.9 62.7 29.3 0.6317 0.5000 0.6078
16 Kandhamal 50.1 67.8 32.8 85.4 93.6 76.6 52.7 69.8 35.9 0.6353 0.6508 0.6162
17 Kendrapara 76.5 87.0 66.3 82.6 89.6 75.3 76.8 87.1 66.8 0.5309 0.4488 0.5270
18 Keonjhar 56.9 70.2 43.6 73.7 82.8 63.6 59.2 72.0 46.2 0.4840 0.4394 0.4757
19 Khurda 74.1 85.0 63.0 86.7 91.4 80.9 79.6 87.9 70.4 0.5213 0.3968 0.4858
20 Koraput 27.3 39.2 15.6 74.9 83.4 65.9 35.7 47.2 24.3 0.5415 0.4143 0.4457
21 Malkangiri 27.9 37.4 18.4 65.3 74.9 55.0 30.5 40.1 20.9 0.4223 0.3890 0.4042
22 Mayurbhanj 49.5 63.8 35.0 82.6 89.1 75.2 51.9 65.8 37.8 0.5146 0.4332 0.4990
23 Nabarangpur 31.3 44.6 18.0 73.7 83.1 63.5 33.9 47.0 20.7 0.5645 0.4525 0.5326
24 Nayagarh 69.8 82.2 56.7 85.6 92.4 78.0 70.5 82.7 57.6 0.5473 0.5334 0.5445
25 Nuapada 40.3 57.6 23.8 70.5 81.6 59.0 42.0 58.5 25.8 0.6384 0.4891 0.6074
26 Puri 77.3 88.2 66.3 81.9 87.5 75.9 78.0 88.1 67.6 0.5786 0.3488 0.5498
27 Rayagada 29.9 42.1 18.3 72.2 81.8 62.4 36.2 48.2 24.6 0.5130 0.4329 0.4557
28 Sambalpur 62.8 75.9 49.5 79.1 86.9 70.6 67.3 79.0 55.2 0.5062 0.4410 0.4852
29 Sonepur 61.7 78.1 44.7 77.3 88.6 65.0 62.8 78.9 46.2 0.6461 0.6200 0.6405
30 Sundargarh 55.3 67.4 43.1 82.5 89.0 75.0 64.9 75.3 53.9 0.4370 0.4322 0.4175
O R I S S A 59.8 72.9 46.7 80.8 87.9 72.9 63.1 75.4 50.5 0.4885 0.4333 0.4764
Co efficient of Variation 27.2 21.2 37.2 6.9 5.0 9.6 24.4 18.9 33.2
Source: Census of India

82
Chart – 48 : District wise Female Literacy Rate (2001)
0
10
20
30
40
50
60
70
80
Khurda
Jagatsinghpur
Puri
Cuttack
Kendrapara
BhadrakJajpur
Balasore
Jharsuguda
Dhenkanal
NayagarhAngul
Sambalpur
Sundargarh
Baragarh
Deogarh
Ganjam
Keonjhar
Sonepur
BolangirBoudh
Mayurbhanj
Kandhamal
Kalahandi
Gajapati
Nuapada
Rayagada
Koraput
Malkangiri
Nabarangpur
Female Literacy

83
District wise Female Literacy Rate (2001 Census)

84
Chart – 49 : Districtwise gender disparity index in Literacy rate, 2001
0.70
00
0.64
05
0.61
62
0.60
78
0.60
74
0.58
81
0.54
98
0.54
83
0.54
45
0.54
42
0.53
52
0.53
26
0.53
04
0.52
70
0.51
45
0.51
32
0.49
90
0.49
32
0.48
83
0.48
58
0.48
52
0.48
32
0.47
95
0.47
63
0.47
57
0.46
54
0.45
57
0.44
57
0.41
75
0.40
42
0.0000
0.1000
0.2000
0.3000
0.4000
0.5000
0.6000
0.7000
0.8000
Boud
hSo
nepu
rKa
ndha
mal
Kala
hand
iN
uapa
daBo
lang
ir
Puri
Angu
lN
ayag
arh
Gan
jam
Jaga
tsin
ghpu
rN
abar
angp
urBa
raga
rhKe
ndra
para
Jhar
sugu
daBh
adra
kM
ayur
bhan
jBa
laso
reD
eoga
rhKh
urda
Sam
balp
urG
ajap
ati
Dhe
nkan
alC
utta
ckKe
onjh
arJa
jpur
Ray
agad
aKo
rapu
tSu
ndar
garh
Mal
kang
iri
Rat
e
Gender disparity
The District wise gender disparity index in literacy is presented in the chart‐49. The highest & lowest gender disparity index was found in
Boudh with 0.7000 & Malkangiri with 0.4042 being the southern districts. Amongst central region districts, Puri had the highest disparity
with 0.5498 followed by Nayagarh with 0.5445. The highest disparity in northern region was seen in Sonepur district with 0.6405 followed by
Bolangir with 0.5881.

85
Chart - 50 : Districtwise gender disparity index in Rural Literacy of Orissa, 2001
0.70
85
0.64
61
0.63
84
0.63
53
0.63
17
0.61
25
0.57
86
0.56
79
0.56
45
0.55
9
0.54
77
0.54
73
0.54
15
0.53
67
0.53
42
0.53
09
0.52
65
0.52
13
0.51
46
0.51
3
0.51
26
0.50
62
0.50
6
0.50
48
0.49
59
0.48
4
0.48
23
0.46
76
0.43
7
0.42
23
0
0.1
0.2
0.3
0.4
0.5
0.6
0.7
0.8
Boudh
Sonepur
Nuapada
Kandhamal
Kalahandi
BolangirPuri
Ganjam
NabarangpurAngul
Jagatsinghpur
Nayagarh
Koraput
Baragarh
Bhadrak
Kendrapara
Jharsuguda
Khurda
Mayurbhanj
Rayagada
Gajapati
Sambalpur
Cuttack
Balasore
Deogarh
Keonjhar
DhenkanalJajpur
Sundargarh
Malkangiri
Rat
e
Gender disparity Index (Rural)

86
Chart – 51 : Districtwise gender disparity index in Urban Literacy of Orissa, 2001
0.73
66
0.65
08
0.62
0.53
34
0.5
0.49
77
0.49
56
0.49
45
0.49
06
0.48
91
0.48
45
0.47
76
0.45
25
0.44
88
0.44
1
0.43
94
0.43
89
0.43
32
0.43
29
0.43
22
0.41
95
0.41
43
0.40
53
0.40
35
0.39
68
0.38
9
0.38
7
0.37
08
0.36
58
0.34
88
0
0.1
0.2
0.3
0.4
0.5
0.6
0.7
0.8
Boud
hKa
ndha
mal
Sone
pur
Naya
garh
Kala
hand
iBo
lang
irG
anja
mJh
arsu
guda
Angu
lNu
apad
aBa
raga
rhDh
enka
nal
Naba
rang
pur
Kend
rapa
raSa
mba
lpur
Keon
jhar
Gaj
apat
iM
ayur
bhan
jRa
yaga
daSu
ndar
garh
Jajp
urKo
rapu
tJa
gats
ingh
pur
Deog
arh
Khur
daM
alka
ngiri
Bala
sore
Bhad
rak
Cutta
ckPu
ri
Rat
e
Gender disparity Index (Urban)

87
Table - 41
Percentage of Literates by sex & age in Orissa, 2001
Age Group Person Male Female Gender disparity index
1 2 3 4 5
All ages 63.1 75.3 50.5 0.4764
6-14 75.3 80.1 70.3 0.2310
15-24(Youth) 75.4 84.5 66.3 0.4419
25+ 53.8 70.2 37.0 0.6037
Source: Census of India
Chart – 52 : Literacy rate by age in Orissa
75.3
80.1
84.5
70.2
50.5
70.3
66.3
37.0
0 10 20 30 40 50 60 70 80 90
All ages
6--14
15-24(Youth)
25+
Male Female
The literacy rate by sex and age in Orissa for 2001 is presented in Table‐41. As against
63.1 for all Orissa literacy rate, the literacy rates for the age group 6‐14 years and 15‐
24 years and 25+ years were 75.3, 75.4 and 53.8 respectively. The gender disparity
index in literacy for the age group 6‐14 years was 0.2310 as against 0.4419 for 15‐24
years and 0.6037 for 25+ years.

88
Table - 42
District wise literacy rate by age, 2001 Census
7--14 15-24(Youth) 25+ Sl No.
Name of the District Person Male Female Person Male Female Person Male Female
1 2 3 4 5 6 7 8 9 10 11
1 Anugul 81.7 85.5 77.9 79.49 88.06 70.82 59.53 77.48 39.79
2 Balangir 74.5 81.2 67.6 67.99 81.59 54.16 44.57 64.71 24.33
3 Baleshwar 77.6 81.3 73.8 82.20 88.86 75.28 63.02 79.03 46.12
4 Bargarh 84.4 87.9 80.8 78.64 87.62 69.38 51.42 69.98 32.47
5 Baudh 75.4 82.4 68.3 67.06 83.34 51.36 47.73 71.43 23.38
6 Bhadrak 81.3 84.3 78.1 84.73 90.51 78.95 66.19 82.43 49.61
7 Cuttack 86.7 88.7 84.7 87.84 91.88 83.61 69.01 82.62 54.29
8 Debagarh 73.3 77.9 68.7 72.8 82.3 63.8 50.4 68.2 31.7
9 Dhenkanal 83.4 86.4 80.5 81.9 88.5 75.4 59.5 75.6 42.5
10 Gajapati 56.8 65.5 47.6 50.6 66.0 36.9 30.9 45.6 17.3
11 Ganjam 73.3 78.8 67.7 71.9 83.4 60.6 51.5 70.7 32.6
12 Jagatsinghapur 90.8 92.3 89.2 91.4 94.8 88.0 70.5 85.0 55.4
13 Jajapur 80.8 84.3 77.2 83.1 88.8 77.4 62.9 78.1 47.4
14 Jharsuguda 86.6 89.3 83.8 83.6 90.6 76.1 59.5 76.2 41.9
15 Kalahandi 62.6 72.6 52.4 58.2 75.3 41.3 35.9 54.9 17.1
16 Kandhamal 70.4 79.1 61.2 63.5 81.2 47.7 40.8 61.6 20.3
17 Kendrapara 87.5 89.5 85.5 89.1 93.2 85.4 67.8 83.8 52.2
18 Kendujhar 71.6 76.5 66.5 72.0 81.9 62.3 49.4 66.6 31.7
19 Khordha 88.0 90.1 85.8 89.3 93.3 84.9 73.0 85.2 59.3
20 Koraput 49.1 59.2 38.3 43.3 58.5 29.9 27.9 38.8 16.9
21 Malkangiri 44.6 51.5 37.3 36.2 49.3 24.7 22.0 31.7 12.0
22 Mayurbhanj 65.0 71.8 57.7 66.5 78.7 54.2 41.7 58.9 24.6
23 Nabarangapur 48.1 58.4 37.2 40.2 56.5 25.1 25.3 38.6 11.8
24 Nayagarh 83.6 86.1 81.1 84.0 90.0 77.6 61.3 79.0 42.4
25 Nuapada 60.3 71.5 48.9 52.7 70.5 35.6 31.3 49.3 13.6
26 Puri 90.6 92.2 88.9 90.6 94.6 86.6 68.8 84.3 52.9
27 Rayagada 50.7 59.7 41.0 44.2 58.7 31.2 27.5 39.7 16.0
28 Sambalpur 83.6 86.7 80.3 79.5 87.4 71.5 56.6 73.1 39.5
29 Sonapur 81.5 86.0 76.8 75.5 87.7 62.6 50.6 72.8 27.5
30 Sundargarh 78.2 81.9 74.4 78.1 85.7 70.4 54.5 68.9 39.2
Source: Census of India

89
Chart – 53 : District wise Female Literacy Rate (6-14 years)
89.2
88.9
85.8
85.5
84.7
83.8
81.1
80.8
80.5
80.3
78.1
77.9
77.2
76.8
74.4
73.8
68.7
68.3
67.7
67.6
66.5
61.2
57.7
52.4
48.9
47.6
41
38.3
37.3
37.2
0
10
20
30
40
50
60
70
80
90
100
Jaga
tsin
ghap
ur
Pur
i K
hord
ha
Ken
drap
ara
Cut
tack
Jh
arsu
guda
N
ayag
arh
Ba
rgar
h
Dhe
nkan
al
Sam
balp
ur
Bha
drak
A
nugu
l J
ajap
ur
Son
apur
S
unda
rgar
h B
ales
hwar
D
ebag
arh
Bau
dh
Gan
jam
B
alan
gir
Ken
dujh
ar
Kan
dham
al
May
urbh
anj
Kala
hand
i N
uapa
da
Gaj
apat
i R
ayag
ada
Kor
aput
M
alka
ngiri
N
abar
anga
pur
Literacy rate
The district wise female literacy rate (7‐14 years) of Orissa, 2001 is presented in the
above chart. Jagatsinghpur district had the highest female literacy rate in that group
with 89.2, whereas the lowest rate was 37.2 for Nowarangpur district.

90
Chart – 54 : District wise Female Literacy Rate (15 – 24 years)
88 86.6
85.4
84.9
83.6
79 77.6
77.4
76.1
75.4
75.3
71.5
70.8
70.4
69.4
63.8
62.6
62.3
60.6
54.2
54.2
51.4
47.7
41.3
36.9
35.6
31.2
29.9
25.1
24.7
0
10
20
30
40
50
60
70
80
90
100
Jaga
tsin
ghap
ur
Pur
i K
endr
apar
a K
hord
ha
Cut
tack
B
hadr
ak
Nay
agar
h
Jaj
apur
Jh
arsu
guda
D
henk
anal
B
ales
hwar
S
amba
lpur
A
nugu
l S
unda
rgar
h Ba
rgar
h
Deb
agar
h S
onap
ur
Ken
dujh
ar
Gan
jam
M
ayur
bhan
j B
alan
gir
Bau
dh
Kan
dham
al
Kala
hand
i G
ajap
ati
Nua
pada
R
ayag
ada
Kor
aput
N
abar
anga
pur
Mal
kang
iri
Literacy rate
The district wise female literacy rate for the age group 15‐24 years. Of Orissa, 2001
also shows highest rate of 88.0 for Jagatsingpur district and the lowest rate was 24.7
for Malkangiri district.

91
Chart – 55 : District wise Female Literacy Rate (25 years & above) 59
.3
55.4
54.3
52.9
52.2
49.6
47.4
46.1
42.5
42.4
41.9
39.8
39.5
39.2
32.6
32.5
31.7
31.7
27.5
24.6
24.3
23.4
20.3
17.3
17.1
16.9
16
13.6
12 11.8
0
10
20
30
40
50
60
70
Ken
drap
ara
Jaga
tsin
ghap
ur
Cut
tack
Pur
i K
hord
ha
Bal
eshw
ar
Anu
gul
Deb
agar
h Jh
arsu
guda
N
ayag
arh
B
hadr
ak
Sam
balp
ur
Dhe
nkan
al
Barg
arh
G
anja
m
Jaj
apur
S
onap
ur
Bal
angi
r S
unda
rgar
h K
andh
amal
M
ayur
bhan
j K
endu
jhar
Bau
dh
Nua
pada
K
alah
andi
K
orap
ut
Ray
agad
a G
ajap
ati
Nab
aran
gapu
r M
alka
ngiri
Literacy rate
The district wise female literacy rate for the age group 25 years and above of Orissa,
2001 is presented in the above chart. Kendrapara district with 59.3 had the highest
rate in the age‐group, where as Malkangiri district with only 11.8 had the lowest rate.

92
Table - 43
Percentage of Literates by sex & age according to educational level in Orissa, 2001
Educational Level All ages 7-19 20-29 30-39 40-49 50-59 60+
Male Female Male Female Male Female Male Female Male Female Male Female Male Female
1 2 3 4 5 6 7 8 9 10 11 12 13 14 15
Literate 75.3 50.5 81.7 70.1 81.3 57.6 71.9 43.5 70.3 38.1 68.0 26.9 60.3 15.7
Literate without education level 1.7 1.0 0.7 0.6 1.5 1.0 2.1 1.1 2.3 1.2 2.7 1.2 3.6 1.2
Below Primary 20.9 15.6 30.7 27.4 10.0 9.0 14.5 10.5 16.6 11.4 20.8 11.0 27.2 7.7
Primary 20.6 16.2 24.7 21.5 16.7 15.6 18.1 15.6 21.2 16.3 20.3 10.7 18.7 5.3
Middle 11.2 7.0 14.5 11.6 14.4 9.1 10.8 4.9 8.0 3.0 5.5 1.4 2.8 0.5
Matric/Secondary 10.5 6.1 8.1 6.9 14.6 10.3 12.2 6.3 12.2 3.9 10.6 1.6 4.8 0.6
High / Senior Secondary/ IA 4.2 2.3 2.9 2.0 10.8 6.1 3.8 1.6 2.0 0.6 1.5 0.2 0.7 0.1
Non Tech Diploma N N N N 0.1 N 0.1 N N N 0.1 N N N
Tech Diploma 0.7 0.2 0.1 N 1.0 0.2 1.0 0.5 1.1 0.3 1.5 0.1 0.6 N
Graduate & above 5.4 2.1 0.0 N 12.1 6.4 9.3 3.0 6.9 1.4 5.1 0.6 2.0 0.2
N= negligible
Source: Census of India

93
Table - 44
Percentage Distribution of Population by educational level & Sector for Orissa, 2001 All Orissa Illiterate Literate without
educational level
Below
primary
Primary Middle Matric
/Secondary
Higher secondary/
Senior secondary
Non-technical
diploma
Technical
diploma
Graduate &
above
All Levels
1 2 3 4 5 6 7 8 9 10 11 12
Persons 36.92 1.36 18.30 18.44 9.15 8.32 3.25 0.03 0.46 3.77 100.00
Males 24.65 1.75 20.91 20.62 11.20 10.46 4.17 0.05 0.73 5.45 100.00
Females 49.49 0.96 15.63 16.21 7.04 6.12 2.30 0.01 0.19 2.05 100.00
Rural
Persons 40.16 1.45 19.10 18.36 8.75 7.04 2.49 0.01 0.35 2.30 100.00
Males 27.08 1.90 22.27 21.05 10.99 9.19 3.38 0.02 0.56 3.55 100.00
Females 53.34 0.99 15.90 15.64 6.49 4.88 1.59 0.00 0.13 1.04 100.00
Urban
Persons 19.16 0.88 13.95 18.90 11.32 15.32 7.42 0.11 1.10 11.84 100.00
Males 12.07 0.97 13.84 18.35 12.30 17.07 8.30 0.17 1.63 15.30 100.00
Females 27.13 0.78 14.08 19.51 10.22 13.34 6.43 0.04 0.52 7.95 100.00
Source: Census of India,2001

81
Table - 45
Enrollment of Boys & Girls in Primary Level of Orissa & Gender Parity Index
( Students in 000' No)
All Community SC ST
Year Boys Girls Gender
parity Index Boys Girls Gender parity Index Boys Girls Gender
parity Index1 2 3 4 5 6 7 8 9 10
2001-02 2685 2084 0.78 586 391 0.67 441 451 1.02
2002-03 2490 2155 0.87 513 446 0.87 620 498 0.80
2003-04 2631 3295 1.25 452 412 0.91 682 622 0.91
2004-05 2594 3243 1.25 445 407 0.91 672 614 0.91
2005-06 2219 2050 0.92 435 410 0.94 607 546 0.90
2006-07 2349 2139 0.91 479 438 0.91 678 597 0.88
2007-08 2317 2196 0.95 456 438 0.96 639 610 0.95
2008-09 2353 2233 0.95 456 438 0.96 679 649 0.96
Compound growth rate % -2.09 -1.39 -2.57 1.07 3.70 4.03
Source: Statistical Abstract Orissa 2008/DISE 07-08 and 08-09.
Table - 46
Enrollment of Boys & Girls in Middle Level of Orissa & Gender Parity Index
All Community SC ST Year Boys Girls Gender
parity Index Boys Girls Gender parity Index Boys Girls Gender
parity Index1 2 3 4 5 6 7 8 9 10
2001-02 654 401 0.61 215 96 0.45 163 78 0.48
2002-03 529 424 0.80 98 72 0.73 87 58 0.67
2003-04 1017 876 0.86 175 150 0.86 264 227 0.86
2004-05 1089 905 0.83 187 166 0.89 282 250 0.89
2005-06 903 781 0.86 166 137 0.83 147 106 0.72
2006-07 977 841 0.86 191 160 0.84 187 138 0.74
2007-08 1047 950 0.91 201 181 0.90 202 163 0.81
2008-09 1106 1022 0.92 214 198 0.93 220 182 0.83
Compound growth rate % 8.41 13.06 4.05 12.21 5.66 10.77
Source: Statistical Abstract Orissa 2008/DISE 07-08 and 08-09.

82
Table - 47
Enrollment of Boys & Girls in Secondary Level of Orissa & Gender Parity Index
All Community SC ST Year
Boys Girls Gender parity Index Boys Girls Gender
parity Index Boys Girls Gender parity Index
1 2 3 4 5 6 7 8 9 10
2001-02 669 465 0.70 99 60 0.61 89 50 0.56
2002-03 710 535 0.75 103 72 0.70 92 58 0.63
2003-04 727 569 0.78 109 79 0.72 94 62 0.66
2004-05 727 598 0.82 117 90 0.77 97 64 0.66
2005-06 743 602 0.81 115 86 0.75 98 69 0.70
2006-07 745 618 0.83 117 92 0.79 101 73 0.72
2007-08 746 633 0.85 118 96 0.81 103 74 0.72
2008-09 772 670 0.87 132 109 0.83 116 87 0.75
Compound growth rate % 1.61 4.44 3.49 7.44 3.19 6.97
Source: Statistical Abstract Orissa 2008/DISE 07-08 and 08-09.
The enrolment by sex and social group and gender parity index are presented in table
47. It is observed from the above tables that the gender parity index was decreased at
middle and secondary level compared to primary level. During 2008‐09, the gender
parity index for middle and secondary level for all community was 0.95, 0.92 and 0.87
respectively where as it was 0.96 at Primary, 0.93 at Middle and 0.83 at Secondary for
SCs and 0.96 at Primary, 0.83 at Middle , 0.75 at Secondary for STs in 2008‐09.

83
Table – 48
Percentage enrollment (Primary school) in Orissa
All Community( % Enrolment of Boys/Girls out of Total Enrolment)
%SC Enrolment out of total Boys ,Girls & All
%ST Enrolment out of total Boys,Girls & All Year
Boys Girls Total Boys Girls Total Boys Girls Total
1 2 3 4 5 6 7 8 9 10
2001-02 56.30 43.70 100 21.82 18.76 20.49 16.42 21.64 18.70
2002-03 53.61 46.39 100 20.60 20.70 20.65 24.90 23.11 24.07
2003-04 44.40 55.60 100 17.18 12.50 14.58 25.92 18.88 22.00
2004-05 44.44 55.56 100 17.15 12.55 14.60 25.91 18.93 22.03
2005-06 51.98 48.02 100 19.60 20.00 19.79 27.35 26.63 27.01
2006-07 52.34 47.66 100 20.39 20.48 20.43 28.86 27.91 28.41
2007-08 51.34 48.66 100 19.68 19.95 19.81 27.58 27.78 27.68
2008-09 51.31 48.69 100 19.38 19.61 19.49 28.86 29.06 28.96
Source: Statistical Abstract Orissa 2008/DISE 07-08 and 08-09.
Table – 49
Percentage enrollment (Middle school) in Orissa
All Community( % Enrolment of Boys/Girls out of Total Enrolment)
%SC Enrolment out of total Boys,Girls & All
%ST Enrolment out of total Boys,Girls & All Year
Boys Girls Total Boys Girls Total Boys Girls Total
1 2 3 4 5 6 7 8 9 10
2001-02 61.99 38.01 100 32.87 23.94 29.48 24.92 19.45 22.84
2002-03 55.51 44.49 100 18.53 16.98 17.84 16.45 13.68 15.22
2003-04 53.72 46.28 100 17.21 17.12 17.17 25.96 25.91 25.94
2004-05 54.61 45.39 100 17.17 18.34 17.70 25.90 27.62 26.68
2005-06 53.62 46.38 100 18.38 17.54 17.99 16.28 13.57 15.02
2006-07 53.74 46.26 100 19.55 19.02 19.31 19.14 16.41 17.88
2007-08 52.43 47.57 100 19.20 19.05 19.13 19.29 17.16 18.28
2008-09 51.97 48.03 100 19.35 19.37 19.36 19.89 17.81 18.89
Source: Statistical Abstract Orissa 2008/DISE 07-08 and 08-09.

84
Table – 50
Percentage enrollment (Secondary school) in Orissa
All Community( % Enrolment of Boys/Girls out of Total Enrolment)
%SC Enrolment out of total Boys ,Girls & All
%ST Enrolment out of total Boys,Girls & All Year
Boys Girls Total Boys Girls Total Boys Girls Total
1 2 3 4 5 6 7 8 9 10
2001-02 58.99 41.01 100 14.80 12.90 14.02 13.30 10.75 12.26
2002-03 57.03 42.97 100 14.51 13.46 14.06 12.96 10.84 12.05
2003-04 56.10 43.90 100 14.99 13.88 14.51 12.93 10.90 12.04
2004-05 54.87 45.13 100 16.09 15.05 15.62 13.34 10.70 12.15
2005-06 55.24 44.76 100 15.48 14.29 14.94 13.19 11.46 12.42
2006-07 54.66 45.34 100 15.70 14.89 15.33 13.56 11.81 12.77
2007-08 54.10 45.90 100 15.82 15.17 15.52 13.81 11.69 12.84
2008-09 53.54 46.46 100 17.10 16.27 16.71 15.03 12.99 14.08
Source: Statistical Abstract Orissa 2008/DISE 07-08 and 08-09.
The social group wise percentage of enrolment in all the three level of education for
the years2001‐02 to 2008‐09 for both boys and girls separately is presented in the
above three tables. It is observed that over the years, the gap between boys and girls
decreased significantly across all social group. Even the percentage enrolment for girls
is more in case of ST community in Primary school level during 2008‐09.

85
Table - 51
District wise Gender Parity Index, 2008-09
Sl. No. District Primary Level Middle Level Secondary Level
1 2 3 4 5
1 Angul 0.93 0.95 0.92
2 Balasore 0.94 0.94 0.98
3 Bargarh 0.94 0.98 0.93
4 Bhadrak 0.96 0.98 0.94
5 Bolangir 0.97 0.89 0.79
6 Boudh 1.00 0.93 0.88
7 Cuttack 0.97 0.98 0.92
8 Deogarh 1.00 0.89 0.83
9 Dhenkanal 0.93 0.91 0.92
10 Gajapati 0.90 0.77 0.75
11 Ganjam 0.94 0.98 0.98
12 Jagatsinghpur 0.91 0.97 0.96
13 Jajpur 0.93 0.96 0.95
14 Jharsuguda 0.96 0.94 1.00
15 Kalahandi 0.97 0.80 0.54
16 Kandhamal 0.98 0.84 0.73
17 Kendrapara 0.95 1.00 0.59
18 Keonjhar 0.94 0.91 0.93
19 Khurda 0.95 0.96 0.78
20 Koraput 0.97 0.74 0.67
21 Malkangiri 0.98 0.73 0.60
22 Mayurbhanj 0.94 0.89 0.81
23 Nabarangpur 0.99 0.80 0.60
24 Nayagarh 0.92 0.93 0.71
25 Nuapara 1.00 0.78 0.55
26 Puri 0.93 0.96 0.97
27 Rayagada 0.92 0.79 0.67
28 Sambalpur 0.92 0.87 0.94
29 Subarnapur 0.97 1.00 1.00
30 Sundargarh 0.96 0.96 1.03
Source: DISE 2008-09. The gender parity index is the ratio of number of girls to number of boys enrolled. The district wise gender parity index for in 2008‐09 is presented in table‐48. The table shows that the gender parity index in primary level was above 0.90 in all the District with Nuapada , Boudh and Deogarh had parity index 1.00. In the middle level, the lowest gender parity index district was Malkangiri with 0.73 followed by Koraput with 0.74 Kendrapara and Subarnapur districts have gender parity index 1.00. In the Secondary level Kalahandi district had the lowest gender parity index with 0.54 followed by Nuapada with 0.55. There were 15 districts in the State whose gender parity index was found less than .90 in seconday level.

86
Table – 52
District wise Adult Literacy Rate (15+) of Orissa : Census 2001
Sl.No District Person Male Female Gender disparity index
1 2 3 4 5 6 1 Anugul 65.2 80.4 48.9 0.3033
2 Balangir 50.7 69.2 32.1 0.3927
3 Baleshwar 68.5 81.8 54.5 0.2678
4 Bargarh 58.9 74.8 42.6 0.3150
5 Baudh 52.9 74.6 31.1 0.4522
6 Bhadrak 71.7 84.8 58.4 0.2687
7 Cuttack 74.3 85.2 62.6 0.2400
8 Debagarh 56.7 72.0 41.0 0.3079
9 Dhenkanal 65.7 79.1 51.9 0.2635
10 Gajapati 36.2 50.9 22.6 0.3914
11 Ganjam 57.1 74.2 40.3 0.3342
12 Jagatsinghapur
76.3 87.7 64.5 0.2592
13 Jajapur 68.9 81.3 56.3 0.2472
14 Jharsuguda 66.4 80.4 51.6 0.2783
15 Kalahandi 41.4 60.0 23.1 0.4613
16 Kandhamal 46.8 66.6 27.8 0.4355
17 Kendrapara 73.9 86.5 61.8 0.2624
18 Kendujhar 55.6 70.7 40.2 0.3057
19 Khordha 77.7 87.5 66.6 0.2401
20 Koraput 31.7 43.5 20.3 0.3649
21 Malkangiri 25.8 36.2 15.6 0.3958
22 Mayurbhanj 47.9 63.9 31.9 0.3522
23 Nabarangapur 29.2 43.1 15.4 0.4816
24 Nayagarh 67.3 81.9 51.8 0.2924
25 Nuapada 36.7 54.6 19.2 0.4954
26 Puri 74.9 87.1 62.4 0.2672
27 Rayagada 31.8 44.5 20.0 0.3819
28 Sambalpur 63.0 77.0 48.5 0.2753
29 Sonapur 57.6 77.0 37.4 0.3918
30 Sundargarh 61.1 73.5 48.0 0.2499
ORISSA 59.7 74.1 45.1 0.2828
Source: Census of India

87
Chart - 56 : Adult Literacy (15+ years) Rate in Orissa, 2001
59.7
74.1
45.1
0
10
20
30
40
50
60
70
80
Persons Males Females
Chart – 57 : Region wise Literacy Rate (2001)
82.8 76.7 61.4
61.2 50.8 33.1
47.163.972.2
0%
10%
20%
30%
40%
50%
60%
70%
80%
90%
100%
Central Region Northern Region Southern Region
Persons Males Females
Region wise literacy rate, 2001 is presented in the above chart. It is found that Central
region lead the highest literacy rate with 72.12 as against 63.9 for Northern and 47.1
for Southern region. The gender disparity indices of the above three regions in literacy
were 0.2237 for Central, 0.2515 for Northern and 0.3156 for Southern region. The
Southern region had both lowest literacy rate as well as highest gender disparity and
literacy compared to other regions.

88
Chart – 58 : Percentage teachers by sex in Primary School
75.2
3
68.1
4
67.0
6
65.7
6
64.5
5
63.7
2
60.5
4
59.7
3
24.7
7
31.8
6
32.9
4
34.2
4
35.4
5
36.2
8
39.4
6
40.2
7
0%
20%
40%
60%
80%
100%
120%
2001-02 2002-03 2003-04 2004-05 2005-06 2006-07 2007-08 2008-09
Male Female
Chart – 59 : Percentage teachers by sex in Middle School
85.2
9
75.4
1
77.4
4
76.1
4
74.8
4
74.5
6
70.2
4
69.0
7
14.7
1
24.5
9
22.5
6
23.8
6
25.1
6
25.4
4
29.7
6
30.9
3
0%
20%
40%
60%
80%
100%
120%
2001-02 2002-03 2003-04 2004-05 2005-06 2006-07 2007-08 2008-09
Male Female

89
Chart – 60 : Percentage teachers by sex in Secondary School
78.7
9
77.8
5
77.8
5
77.6
9
78.2
8
77.2
76.4
5
21.2
1
22.1
5
22.1
5
22.3
1
21.7
2
22.8
23.5
5
0%
20%
40%
60%
80%
100%
120%
2001-02 2002-03 2003-04 2004-05 2005-06 2006-07 2007-08
Male Female
Source: Statistical Abstract Orissa 2008/DISE 08-09.
The percentage of teachers by sex at Primary, Middle and Secondary level is presented
in the charts above. It is fond that the percentage of female teachers decreases with
the increase of schools level. However, at the percentage of female teachers was
increased significantly from 24.77% in 2001‐02 to 40.27% in 2008‐09. at primary level
and from 14.71% in 2001‐02 t0 30.93 in 2008‐09 at Middle level. However, in case of
Secondary level, the percentage increase of female teachers was marginal in 2007‐08
compared to 2001‐02.

90
Table – 53
Dropout rates at different educational stage
Primary Middle Secondary
Year Female Male Female Male Female Male
1 4 5 2 3 6 7
2000-01 41.4 42.3 91.1 52.9 0.0 0.0
2001-02 40.0 42.0 60.5 52.0 72.0 67.0
2002-03 36.5 32.3 60.5 57.7 68.5 65.9
2003-04 35.4 31.9 58.6 56.5 66.7 62.5
2004-05 32.7 31.4 50.1 48.2 66.0 61.0
2005-06 18.9 18.1 29.0 27.9 64.0 60.0
2006-07 10.7 10.3 18.5 17.6 62.0 59.0
2007-08 7.8 7.8 13.5 13.1 61.0 58.2
Source: Statistical Abstract Orissa 2008
Chart – 61 : Drop-out rate in Primary Level
60 40 20 0 20 40 60
2007‐08
2006‐07
2005‐06
2004‐05
2003‐04
2002‐03
2001‐02
2000‐01
Female Male

91
Chart – 62 : Drop-out rate in Middle Level
100 50 0 50 100
2007‐08
2006‐07
2005‐06
2004‐05
2003‐04
2002‐03
2001‐02
2000‐01
Female Male
Chart – 63 : Drop-out rate in Secondary Level
80 60 40 20 0 20 40 60 80
2007‐08
2006‐07
2005‐06
2004‐05
2003‐04
2002‐03
2001‐02
Female Male
Drop out rate measures the phenomenon of pupils from a cohort leaving school
without completion. Thus the dropout rate by sex at Primary, Middle and Secondary
level is presented in table‐50 and charts above. It is found that the dropout rate of
primary level was as low as 7.81 for both male and female category in 2007‐08, where
as it was around 13% at Middle level and as high as 60% at Secondary level in 2007‐08.
`

92
MEN & WOMEN IN
ECONOMIC ACTIVITIES

93
Table -54
Work Participation Rate of Orissa by sex
Year Female Male Person
1 2 3 4
1961 26.58 60.75 43.66
1971 10.47 55.62 33.19
1981 19.81 55.86 38.01
1991 20.79 53.79 37.53
2001 24.66 52.52 38.78
2011(Projected) 28.53 51.25 40.03
Chart – 64 : Trends in work participation rate of Orissa by sex
0
10
20
30
40
50
60
70
1961 1971 1981 1991 2001
2011(Projected)
Rat
e
Female Male Person
The work participation rate of a state indicates to a great extent the economic
empowerment of men and women in the society. WPR of a State is the ratio of workers to
total population of the state. The work participation rate of Orissa took a reverse trend from
1961 to 1971, where it was decreased from 43.66 to 33.19. Again during 1991 census, the
WPR had again decreased to 37.53 against 38.01 in 1981. However, during 2001 census, the
WPR of the State had increased to 38.78 over 1991. The female work participation rate
showed an increasing trend with 19.81 in 1981, 20.79 in 1991 and 24.66 in 2001. The
projected WPR of the state is expected to increase at 40.03 with 28.53 for female and 51.25
for male category.

94
Table - 55 Work participation rate of total worker, main and marginal worker
of selected states by sex, 2001 Work participation rate of
total Worker Work participation rate of main
worker Work participation rate of
marginal worker Sl No
India/State
Person Male Female Person Male Female Person Male Female
1 2 3 4 5 6 7 8 9 10 11
India 39.1 51.7 25.6 30.4 45.1 14.7 8.7 6.6 11.0
1 Punjab 37.5 53.6 19.1 32.2 49.5 12.4 5.3 4.1 6.7
2 Haryana 39.6 50.3 27.2 29.5 43.4 13.4 10.1 6.9 13.8
3 Delhi 32.8 52.1 9.4 31.2 49.9 8.4 1.6 2.2 1.0
4 Rajasthan 42.1 50.0 33.5 30.9 43.7 17.0 11.2 6.3 16.5
5 Uttar Pradesh 32.5 46.8 16.5 23.7 39.2 6.4 8.8 7.6 10.2
6 Bihar 33.7 47.4 18.8 25.4 40.5 8.9 8.3 6.9 9.9
7 Sikkim 48.6 57.4 38.6 39.4 50.8 26.3 9.3 6.7 12.3
8 Arunachal Pradesh 44.0 50.6 36.5 37.8 46.1 28.5 6.2 4.5 8.0
9 Assam 35.8 49.9 20.7 26.7 42.5 9.8 9.1 7.4 10.9
10 West Bengal 36.8 54.0 18.3 28.7 47.0 9.1 8.1 7.0 9.2
11 Orissa 38.8 52.5 24.7 26.1 42.9 8.7 12.7 9.6 15.9
12 Madhya Pradesh 42.7 51.5 33.2 31.7 44.7 17.5 11.1 6.8 15.8
13 Gujarat 42.0 54.9 27.9 33.6 51.1 14.6 8.4 3.8 13.3
Source : Census of India
Chart – 65 : State wise Work Participation Rate, 2001
0
10
20
30
40
50
60
Rat
e
India@
Punjab
Haryan
aDelh
iRaja
sthan
Uttar P
rades
hBiha
rSikk
im
Arunac
hal P
rades
hAss
amW
est B
enga
lOris
sa
Madhy
a Prad
esh
Gujarat
Person Male Female

95
The selected statewise WPR including Orissa for 2001 is presented in Table 55 and
Chart‐65. The All India WPR stood at 39.1 with 51.7 for male and 25.6 for female.
Sikkim had the highest WPR with 48.6 including female WPR of 38.6. However female
WPR for Rajastan, Arunachal Pradesh and Madhya Pradesh was 33.5, 36.5 and 33.2
respectively. The female WPR of Orissa was 24.7 against 9.4 of Delhi. WPR of main and
marginal worker is also presented in the table, Orissa witnessed a high female WPR of
15.9 in marginal category as against 8.7 in main category of workers. North Eastern
states like Sikkim and Arunachal Pradesh had higher female WPR in main worker
category with 26.3 and 28.5 respectively.
Table -56
Percentage Distribution of Workers According to Category of Workers, 1991 Census
Rural Urban Combined
Category of workers
Female Male Person Female Male Person Female Male Person
1 2 3 4 5 6 7 8 9 10
Main Workers 56.72 98.15 86.13 86.82 99.04 97.49 58.20 98.27 87.33
Marginal Workers 43.28 1.85 13.87 13.18 0.96 2.51 41.80 1.73 12.67
Total Workers 100.00 100.00 100.00 100.00 100.00 100.00 100.00 100.00 100.00

96
Table -57
Percentage Distribution of Workers According to Category of Workers, 2001 Census
Rural Urban Combined
Category of workers
Female Male Persons Female Male Persons Female Male Persons
1 2 3 4 5 6 7 8 9 10
Main Workers 33.10 79.74 64.13 72.72 92.93 89.80 35.41 81.66 67.17
Marginal Workers 66.90 20.26 35.87 27.28 7.07 10.20 64.59 18.34 32.83
Total Workers 100.00 100.00 100.00 100.00 100.00 100.00 100.00 100.00 100.00
Classification of total workers(%)
Cultivators 21.20 39.47 33.35 2.58 3.01 2.94 20.11 34.15 29.75
Agricultural Labourers 56.55 30.33 39.10 11.24 3.35 4.57 53.90 26.39 35.02
Workers in Husehold Industry 8.58 3.36 5.11 7.74 2.71 3.49 8.53 3.26 4.91
Other Workers 13.67 26.85 22.44 78.45 90.93 89.00 17.46 36.19 30.32
Chart - 66 : Percentage Category of Workers in Rural Orissa, 2001
33.1
79.7464.13
66.9
20.2635.87
0%
20%
40%
60%
80%
100%
120%
Female Male Persons
(In P
erce
ntag
e)
Main Workers Marginal Workers

97
Chart – 67 : Percentage Category of Workers in Urban Orissa, 2001
72.7292.93 89.8
27.287.07 10.2
0%
20%
40%
60%
80%
100%
120%
Female Male Persons
(In P
erce
ntag
e)
Main Workers Marginal Workers
The percentage of marginal and main workers to total workers in the state in 2001
constituted 35.87% and 64.13% respectively. Rural Orissa exhibited 66.90% female
marginal workers of total female workers where as the corresponding figure for male
category was 20.26%.. In urban Orissa, the percentage of main workers in female
category was 72.72% of the total female workers as against 92.93% for male category.
The marginal workers in female and male category constituted 27.28% and 7.07%
respectively.
Table -58
Labour force Participation Rate in selected states, 1992-93 ( Per 1000 Person)
Rural Urban
Name of the States Male Female Person Male Female Person
1 2 3 4 5 6 7
Andhra Pradesh 635 521 578 560 207 387
Bihar 521 173 356 471 76 291
Orissa 577 319 449 546 161 365
WestBengal 567 180 382 587 167 393
Tamilnadu 613 481 546 601 247 423
All India 561 330 449 543 165 363
Source : NSS 50th Round

98
Table -59
Labour force Participation Rate in selected states, 2004-05 ( Per 1000 Person)
Rural Urban Name of the States
Male Female Person Male Female Person
1 2 3 4 5 6 7
Andhra Pradesh 612 485 548 581 232 406
Bihar 486 138 320 485 682 290
Orissa 604 351 476 553 202 386
WestBengal 587 184 389 630 169 410
Tamilnadu 604 467 534 611 253 434
All India 555 333 446 570 178 382
Source : NSS 61st Round
According to NSSO, Persons who are either ‘working’ ( or employed) or ‘seeking or
available for work’ (or unemployed) during the reference period together constitute
the labour force. The LFPR for 50th round and 61st round for selected states is presented
in the table. It is found that Andhra Pradesh had higher LFPR in Rural Area with 548 in
2004‐05 followed by 534 per 1000 persons in Tamil Nadu. The rural LFPR for Orissa was
476 with 604 for males and 351 for females in 2004‐05. The urban LFPR was highest in
Tamil Nadu with 434 followed by West Bengal with 410. In case of Orissa, it was 386
with 553 for males and 202 for females. Compared to 50th round , the rural and urban
LFPR for Orissa in 61st round had increased marginally.

99
Table - 60
Per 1000 distribution of Persons by Usual Principal Status Activity
Rural Urban Category
Male Female Person Male Female Person
1 2 3 4 5 6 7
Self-employed 331 63 199 258 24 150
Wage/Salaried 39 4 22 191 37 120
Labourer 210 76 144 79 25 53
All workers 580 143 365 528 86 323
Unemployed 24 12 18 41 29 36
Labour Force 604 155 383 569 115 359
Not in Labour Force 396 845 617 431 885 641
All 1000 1000 1000 1000 1000 1000
Source : NSS 61st Round (2004-05)
Table - 61
Per 1000 distribution of usually employed persons in the Principal status
Rural Urban Broad Industry Divisions State All India State All India
1 2 4 5 7
Agriculture 705 708 68 76
Mining & quarrying 11 6 27 8
Manufacturing 71 82 158 239
Electricity, water &gas 6 2 24 7
Construction 69 54 127 84
Trade, hotel & restaurant 67 67 268 253
Transport 22 27 82 90
Other services 49 54 246 243
ALL 1000 1000 1000 1000
Source : NSS 61st Round (2004-05)

100
Table - 62 Unemployment rate in selected states, (Per 1000 Person)
Rural Urban Name of the
States Male Female Person Male Female Person 1 2 3 4 5 6 7
Andhra Pradesh 7 1 4 28 35 30
Bihar 19 6 16 68 92 71
Orissa 18 8 14 67 60 65
WestBengal 18 17 18 63 142 79
Tamilnadu 18 6 13 43 68 50
All India 14 8 12 40 62 45
Source : 50th Round NSS, 1992-93
Table - 63
Unemployment rate in selected states, (Per 1000 Person)
Rural Urban Name of the States
Male Female Person Male Female Person
1 2 3 4 5 6 7
Andhra Pradesh 10 4 7 36 38 36
Bihar 18 2 15 67 41 64
Orissa 31 83 50 90 266 134
WestBengal 22 33 25 56 84 62
Tamilnadu 12 11 12 29 48 35
All India 16 18 17 38 69 45
Source : 61st Round NSS, 2004-05
Unemployment rate is defined as the number of persons unemployed per thousand
persons in the labour force (which includes both the employed and unemployed). The
unemployed rate of Orissa in 2004‐05 was as high as 50 in rural area and 134 in urban
area against 17 and 45 in all India level. The female unemployment rae in rural Orissa
was 83 and that of urban area was 266, which was highest compared to other states
above. Compared to 50th round survey, the unemployment rate in the state in 2004‐05
had increased substantially.

101
Chart – 68 : Unemployment rate of States(Rural), 2004-05
0
10
20
30
40
50
60
70
80
90
Rat
e (P
er '0
00 p
erso
ns)
Andhra PradeshBihar
Orissa
WestBengal
TamilnaduAll India
Male Female Person
Chart – 69 : Unemployment rate of States(Urban), 2004-05
0
50
100
150
200
250
300
Rat
e (P
er '0
00 p
erso
ns)
Andhra PradeshBihar
Orissa
WestBengal
TamilnaduAll India
Male Female Person

102
Table - 64 District-wise Number of workers and work participation rate
by sex of Orissa: Census 2001
Number of workers Work participation rate (Main + Marginal) (Main + Marginal)
Sl. No.
District
Person Male Female Person Male Female
1 2 3 4 5 6 7 8
1 Angul 453570 306209 147361 39.8 52.1 26.7
2 Bolangir 559750 371425 188325 41.9 55.1 28.4
3 Balasore 645133 532087 113046 31.9 51.3 11.4
4 Baragarh 593530 385670 207860 44.1 56.6 31.3
5 Boudh 170761 104933 65828 45.7 55.8 35.5
6 Bhadrak 385119 332037 53082 28.9 49.1 8.1
7 Cuttack 794034 638088 155946 33.9 52.8 13.8
8 Deogarh 126260 73912 52348 46.1 53.4 38.6
9 Dhenkanal 356513 277520 78993 33.4 51.0 15.1
10 Gajapati 275534 144552 130982 53.1 56.6 49.7
11 Ganjam 1305932 817840 488092 41.3 51.7 30.9
12 Jagatsinghpur 329973 270349 59624 31.2 50.2 11.5
13 Jajpur 446525 391785 54740 27.5 47.6 6.8
14 Jharsuguda 189593 133493 56100 37.2 51.0 22.6
15 Kalahandi 620950 381444 239506 46.5 57.1 35.9
16 Kandhamal 306209 168896 137313 47.2 52.3 42.2
17 Kendrapara 388296 322802 65494 29.8 49.9 10.0
18 Keonjhar 621226 404691 216535 39.8 51.2 28.1
19 Khurda 575063 496558 78505 30.6 50.3 8.8
20 Koraput 570435 332014 238421 48.3 56.2 40.4
21 Malkangiri 247624 141190 106434 49.1 55.9 42.3
22 Mayurbhanj 1027797 588954 438843 46.2 52.4 39.9
23 Nabarangpur 507395 290723 216672 49.5 56.4 42.4
24 Nayagarh 288053 241975 46078 33.3 54.2 11.0
25 Nuapada 244360 146378 97982 46.0 55.4 36.8
26 Puri 450540 393853 56687 30.0 51.6 7.7
27 Rayagada 399184 225367 173817 48.0 55.0 41.3
28 Sambalpur 421346 257200 164146 45.0 54.1 35.6
29 Sonepur 236980 149776 87204 43.7 54.3 32.8
30 Sundargarh 738803 480285 258518 40.4 51.3 28.9
Orissa 14276488 9802006 4474482 38.8 52.5 24.7
Source : PCA, Orissa, Census of India, 2001

103
Chart – 70 : District wise work participation rate of Female, 2001 Census
0
10
20
30
40
50
60An
gul
Bola
ngir
Bala
sore
Bara
garh
Bo
udh
Bh
adra
k
Cut
tack
Deo
garh
D
henk
anal
Gaj
apat
i G
anja
mJa
gats
ingh
pur
Jajp
ur
Jhar
sugu
da
Kala
hand
iKa
ndha
mal
Kend
rapa
ra
Keon
jhar
Khur
da
Kora
put
Mal
kang
iri
May
urbh
anj
Nab
aran
gpur
N
ayag
arh
N
uapa
da
Puri
Ray
agad
a
Sam
balp
urSo
nepu
r Su
ndar
garh
Rural Urban
District wise work participation rate is presented in the table 64. It clearly indicates
that Gajapati district had the highest female work participation rate with 49.7
followed by Nabarangpur with 42.4 and Malkangiri with 42.3 against all Orissa female
WPR of 24.7. The lowest female WPR was visualized in Jajpur with 6.8 followed by
Puri with 7.7 and Bhadrak with 8.1. Further it is also witnessed that Sourthern
districts had the highest female WPR compared to other Northern and Coastal
districts. In table 65 in rural Orissa , higher female WPR was noticed in Gajapati with
53.3 followed by Koraput with 45.6 and Rayagada with 45.5. the lowest female WPR
was found in Jajpur with 6.9 and Puri with 7.5. In table 66 in urban Orissa. The highest
female WPR was witnessed in Gajapati with 17.4 followed by Nuapada with 16.5. The
lowest WPR district were Jajpur with 6.0 and Kendrapara with 6.8.

104
Table - 65
District-wise Number of workers and work participation rate by sex
In Rural Areas of Orissa: Census 2001
Number of workers Work participation rate (Main + Marginal) (Main + Marginal) Sl.
No. District Person Male Female Person Male Female
1 2 3 4 5 6 7 8
1 Angul 403006 262379 140627 41.1 52.3 29.3 2 Bolangir 515640 333689 181951 43.6 56.2 30.9 3 Balasore 579649 475821 103828 32.1 51.6 11.8 4 Baragarh 562974 359711 203263 45.3 57.3 33.1 5 Boudh 165064 100466 64598 46.5 56.2 36.6 6 Bhadrak 346777 298916 47861 29.1 49.6 8.1 7 Cuttack 590892 461667 129225 34.8 53.3 15.5 8 Deogarh 119604 68625 50979 47.1 53.7 40.4 9 Dhenkanal 329717 254082 75635 33.9 51.3 15.8 10 Gajapati 257343 130935 126408 55.2 57.2 53.3 11 Ganjam 1139827 682248 457579 43.8 52.7 35.0 12 Jagatsinghpur 294078 239006 55072 30.9 49.7 11.6 13 Jajpur 426467 373800 52667 27.5 47.6 6.9 14 Jharsuguda 135791 87437 48354 41.9 53.3 30.3 15 Kalahandi 589735 355641 234094 47.7 57.8 37.8 16 Kandhamal 293239 158421 134818 48.5 52.8 44.3 17 Kendrapara 367898 304868 63030 30.0 50.1 10.2 18 Keonjhar 556654 350737 205917 41.3 51.7 30.7 19 Khurda 314289 271217 43072 29.3 49.9 8.2 20 Koraput 505923 280789 225134 51.5 57.4 45.6 21 Malkangiri 236055 132191 103864 50.3 56.3 44.2 22 Mayurbhanj 979991 549116 430875 47.4 52.7 42.0 23 Nabarangpur 488034 275681 212353 50.5 56.9 44.0 24 Nayagarh 277562 232790 44772 33.5 54.5 11.2 25 Nuapada 234000 138460 95540 46.7 55.6 38.0 26 Puri 388964 341053 47911 30.0 51.9 7.5 27 Rayagada 362321 196327 165994 50.6 55.9 45.5 28 Sambalpur 341856 193214 148642 50.1 56.3 43.9 29 Sonepur 223769 139474 84295 44.6 54.7 34.1 30 Sundargarh 559850 324934 234916 46.6 53.9 39.2
Orissa 12586969 8373695 4213274 40.2 53.2 27.1
Source : PCA, Orissa, Census of India, 2001

105
Table -66
District-wise Number of workers and work participation rate by sex
in Urban Areas of Orissa: Census 2001
Number of workers Work participation rate (Main + Marginal) (Main + Marginal)
Sl. No.
District Person Male Female Person Male Female
1 2 3 4 5 6 7 8 1 Angul 50564 43830 6734 31.9 51.0 9.3 2 Bolangir 44110 37736 6374 28.6 47.3 8.6 3 Balasore 65484 56266 9218 29.7 49.0 8.7 4 Baragarh 30556 25959 4597 29.5 48.5 9.2 5 Boudh 5697 4467 1230 31.6 48.0 14.1 6 Bhadrak 38342 33121 5221 27.2 45.4 7.7 7 Cuttack 203142 176421 26721 31.7 51.6 8.9 8 Deogarh 6656 5287 1369 33.1 50.3 14.3 9 Dhenkanal 26796 23438 3358 28.8 47.9 7.6 10 Gajapati 18191 13617 4574 34.4 51.3 17.4 11 Ganjam 166105 135592 30513 29.9 47.3 11.3 12 Jagatsinghpur 35895 31343 4552 34.4 53.6 9.9 13 Jajpur 20058 17985 2073 27.5 47.0 6.0 14 Jharsuguda 53802 46056 7746 28.9 47.0 8.8 15 Kalahandi 31215 25803 5412 31.1 49.7 11.2 16 Kandhamal 12970 10475 2495 29.4 45.8 11.8 17 Kendrapara 20398 17934 2464 27.5 47.1 6.8 18 Keonjhar 64572 53954 10618 30.3 48.4 10.5 19 Khurda 260774 225341 35433 32.4 50.8 9.8 20 Koraput 64512 51225 13287 32.5 50.3 13.7 21 Malkangiri 11569 8999 2570 33.4 50.3 15.4 22 Mayurbhanj 47806 39838 7968 30.7 48.5 10.8 23 Nabarangpur 19361 15042 4319 32.7 48.9 15.1 24 Nayagarh 10491 9185 1306 28.3 47.4 7.4 25 Nuapada 10360 7918 2442 34.5 51.9 16.5 26 Puri 61576 52800 8776 30.2 49.7 9.0 27 Rayagada 36863 29040 7823 31.9 49.5 13.8 28 Sambalpur 79490 63986 15504 31.3 48.5 12.7 29 Sonepur 13211 10302 2909 33.0 49.5 15.1 30 Sundargarh 178953 155351 23602 28.4 46.6 8.0 Orissa 1689519 1428311 261208 30.6 49.1 10.0
Source:PCA, Orissa, Census of India, 2001

106
District wise Female Work Participation Rate in Orissa (2001 Census)

107
Chart – 71 : District wise WPR by sectors of Orissa (2001)
0
10
20
30
40
50
60
70
80An
gul
Bola
ngir
Bala
sore
Bara
garh
Bo
udh
Bh
adra
k
Cutta
ckDe
ogar
h
Dhen
kana
lG
ajap
ati
Gan
jam
Jaga
tsin
ghpu
r Ja
jpur
Jh
arsu
guda
Ka
laha
ndi
Kand
ham
alKe
ndra
para
Ke
onjh
arKh
urda
Ko
rapu
tM
alka
ngiri
M
ayur
bhan
jNa
bara
ngpu
r Na
yaga
rh
Nuap
ada
Pu
riRa
yaga
da
Sam
balp
urSo
nepu
r Su
ndar
garh
Rural Uraban

108
Chart – 72 : Percentage Workers to state total according to region, 2001
37.3%
32.6%
30.1%
CENTRAL SOUTHERN NORTHERN
Chart – 73 : Percentage Male Workers according to region, 2001
42.9%
28.1%
29.0%
CENTRAL SOUTHERN NORTHERN

109
Chart – 74 : Percentage Female Workers according to region, 2001
25.1%
42.4%
32.6%
CENTRAL SOUTHERN NORTHERN
The region wise percentage total workers, male workers and female workers are
presented in the chart above. The percentage of workers in the Central Region was
37.3% followed by 32.6% in Southern Region and 30.1% in Northern Region. In case of
workers in female category, Southern Region had the highest percentage of female
workers with 42.4% followed by Northern Region with 32.6% and Central Region with
25.1%. The Central Region continued to capture higher male workers with 43% leaving
behind Northern Region with 29.0% and Southern Region with 28.1%.

110
Table -67
Employment in un-organized sector in Orissa by sex & sector (in nos.)
No of Estalishments No of Employment Rural Urban Combined Sector
Rural Urban Total Male Female Male Female Male Female
1 2 3 4 5 6 7 8 9 10
Agricultural 182073 10223 192296 184475 107406 20767 4021 205242 111427
Non Agricultural 1264662 373340 16380021754135 539695 885004 971242639139 636819
Total 1446735 383563 18302981938610 647101 905771 1011452844381 748246
Source-5th Economics Census 2005, Orissa
Table -68
Percentage Distribution of Employment in unorganized sector by Sex & Sector in Orissa, 2005
(in percentage) Rural Urban Combined
Sector Male Female Total Male Female Total Male Female Total
1 2 3 4 5 6 7 8 9 10
Agricultural 63.20 36.80 100 83.78 16.22 100 64.81 35.19 100
Non Agricultural 76.47 23.53 100 90.11 9.89 100 80.56 19.44 100
Total 74.97 25.03 100 89.95 10.05 100 73.46 20.83 100
Source-5th Economics Census, 2005, Orissa
Table – 69
Number of Worker Per Establishment, 2005
Rural Urban Combined Sector
Male Female Total Male Female Total Male Female Total
1 2 3 4 5 6 7 8 9 10
Agricultural 1.01 0.59 1.6 2.03 0.39 2.42 1.07 0.58 1.65
Non Agricultural 1.39 0.43 1.82 2.37 0.26 2.63 1.61 0.39 2.00
Total 1.34 0.45 1.79 2.36 0.26 2.63 1.55 0.41 1.96
Source-5th Economics Census, 2005, Orissa

111
Table - 70
Employment in Organized Sector Public Sector
(in 000 numbers) Private Sector
(in 000 numbers) Percentage of Female Worker Year
Total Male Female Total Male Female Public Sector Private Sector
1 2 3 4 5 6 7 8 9
2000 711 622 89 87 77 10 12.52 11.49
2001 717 625 92 89 79 10 12.83 11.24
2002 692 599 93 79 69 10 13.44 12.66
2003 680 584 96 87 77 10 14.12 11.49
2004 657 561 96 89 78 11 14.61 12.36
2005 655 555 100 90 79 11 15.27 12.22
2006 627 527 100 89 78 11 15.95 12.36
2007 598 506 92 90 80 10 15.38 11.11
Source : Economic Survey, 2009
Chart – 75 : Trends in Female Employment in Organized Sector
0.00
2.00
4.00
6.00
8.00
10.00
12.00
14.00
16.00
18.00
2000 2001 2002 2003 2004 2005 2006 2007
(In P
erce
ntag
e)
Public Private
The employment in organized sector is presented in table 70. The percentage of
female worker to total worker in Public Sector was 12.52% in 2000 and increased to
15.95% in 2006. But it was marginally decreased to 15.38 in 2007. But in case of
Private Sector, the percentage of female worker was as low as 11% in 2007. Thus
there was a huge gender gap in the employment in organized sector.

112
Table - 71
Employment Generation under Poverty Alleviation Schemes
Year Total Mandays Generated under
NREGS/SGRY
( In lakh)
Mandays generated by women
( In lakh) Percentage
1 2 3 4
2005-06 911.31 307.19 33.71
2006-07 982.95 345.56 35.16
2007-08 505.07 181.07 35.85
2008-09 429.63 160.99 37.47
2009-10 551.69 200.08 36.27
Source : Panchayati Raj Department, Orissa.
Chart – 76 : Percentage Women man days
33.71
35.16
35.85
37.47
36.27
31
32
33
34
35
36
37
38
2005‐06 2006‐07 2007‐08 2008‐09 2009‐10
Women Mandays

113
Chart – 77 : District wise total mandays & women mandays in 2009-10
0 10 20 30 40 50 60 70 80 90
Kendrapara
Khurda
Puri
Nayagarh
Jagatsinghpur
Jharsuguda
Balasore
Bhadrak
Deogarh
Nuapada
Boudh
Baragarh
Sambalpur
Sonepur
Malkangiri
Cuttack
Jajpur
Angul
Kalahandi
Sundargarh
Keonjhar
Dhenkanal
Koraput
Bolangir
Nabarangpur
Gajapati
Rayagada
Kandhamal
Mayurbhanj
Ganjam
(In lakh numbers)
Total Mandays Women mandays

114
Table - 72
Women self-help group of Orissa
Year No. of women SHGs formed
during the year
Cumulative no.of
WSHGs
No. of Groups involved in Income
Generation Activities
Percentage of Groups involved in Income Generation
Activities 1 2 3 4 5
2004-05 35418 155412 90840 58.45
2005-06 35373 190785 115545 60.56
2006-07 25792 216577 138818 64.10
2007-08 29774 246351 160396 65.11
2008-09 26961 273312 182267 66.69
2009-10( Jan,10) 13206 286518 204167 71.26
Source : Women and Child Development Department, Orissa
Chart – 78 : Number of WSHG formed & No involved in Income Activities in the State
0
50000
100000
150000
200000
250000
300000
(In n
umbe
rs)
2004-05 2005-06 2006-07 2007-08 2008-09 2009-10 ( Jan,10)
WSHG WSHG Income Activities

115
Table -73
Number of MSME unit set up and women entrepreneurs in Orissa
No of SSI / MSME Unit set up No of Women Entrepreneur Year
Rural Urban Total Rural Urban Total
Percentage Women
Entrepreneur
1 2 3 4 5 6 7 8
2004-05 3165 1346 4511 229 132 361 8.00
2005-06 3418 1368 4786 340 168 508 10.61
2006-07 3308 1248 4556 360 166 526 11.55
2007-08 3324 1386 4710 407 223 630 13.38
2008-09 3404 1402 4806 419 225 644 13.40
Source : Directorate of Industries, Orissa
Chart – 79 : MSME unit set up / Women Entrepreneur
0
50000
100000
150000
200000
250000
300000
(In n
umbe
rs)
2004-05 2005-06 2006-07 2007-08 2008-09
MSME Women Enterprenure
The table 73 exhibits percentage of women entrepreneurs in MSME set up
from 2004‐05 to 2008‐09. It is found that the percentage of women
entrepreneur was 8% in 2004‐05 and increased to 13.4% in 2008‐09.
Compared to male counterparts, the percentage of women entrepreneurs
was quite low. In the chart above, it is observed that the number of
women entrepreneurs is getting increased with the passage of years.

116
Table - 74
District wise Women Self-Help Group Formed up to 2008-09
Sl No Districts No of WSHGs formed
No of SHGs involved in Income generation activities Percentage
1 2 3 4 5 1 Angul 12495 9133 73.09
2 Balasore 14867 10952 73.67
3 Baragarh 7570 4869 64.32
4 Bhadrak 8511 5237 61.53
5 Bolangir 10346 5541 53.56
6 Boudh 2475 1962 79.27
7 Cuttack 15401 6642 43.13
8 Deogarh 2156 1356 62.89
9 Dhenkanal 9918 8610 86.81
10 Gajapati 4842 3058 63.16
11 Ganjam 15122 14641 96.82
12 Jagatsinghpur 5603 4450 79.42
13 Jajpur 8041 3290 40.92
14 Jharsuguda 3891 2682 68.93
15 Kalahandi 10843 9300 85.77
16 Kandhamal 5492 3196 58.19
17 Kendrapara 9107 6038 66.30
18 Keonjhar 8711 4982 57.19
19 Khurda 13799 8674 62.86
20 Koraput 9665 5716 59.14
21 Malkangiri 7482 4036 53.94
22 Mayurbhanj 19018 14393 75.68
23 Nawarangpur 8990 4357 48.46
24 Nayagarh 5726 3895 68.02
25 Nuapada 5458 3169 58.06
26 Puri 11682 10563 90.42
27 Rayagada 6652 5156 77.51
28 Sambalpur 8388 4979 59.36
29 Sonepur 5336 2937 55.04
30 Sundargarh 15725 8453 53.76
State- Total 273312 182267 66.69

117
District wise Women Self-Help Group in Orissa

118
Table - 75
Women Entrepreneur by category ( in Numbers)
Sl. No Category 2004-05 2005-06 2006-07 2007-08 2008-09
1 2 3 4 5 6 7
1 Food & Allied Based 63 77 67 104 81
2 Chemical & Allied Based 16 23 10 9 19
3 Electrical & Electronics 1 2 1 1 4
4 Engineering & Metal based 23 26 25 25 31
5 Forest & Wood based 21 49 32 45 59
6 Glass & Ceramics 21 27 28 26 20
7 Livestock & leather 0 2 1 1 0
8 Paper & Paper Products 12 1 12 15 8
9 Rubber & Plastics 3 3 4 11 6
10 Textiles 38 69 105 61 105
11 Misc Manufacturing 3 7 7 9 14
12 Repairing & Servicing 160 222 234 323 297
Total 361 508 526 630 644
Chart – 80 : Women Entrepreneur by Category, 2008-09
13%
3%1%
5%
9%
3%
0%
1%
1%
16%2%
46%
Food & Allied Based Chemical & Allied Based Electrical & & ElectronicsEngineering & Metal based Forest & Wood based Glass & CeramicsLivestock & leather Paper & Paper Products Rubber & PlasticsTextiles Misc Manufacturig Rapairing & Servicing

119
Table -76
Average Agricultutal Labour Wages of Unskilled Laboures of the State by Sex
(In Rupees) Agricultural field Labourers Other Agril labourers Herdsman Year
Male Female Male Female Male Female
1 2 3 4 5 6 7
2006-07 56.42 47.48 61.64 49.79 51.11 43.45
2007-08 58.29 49.3 64.32 51.91 57.31 47.59
Source : Directorate of Economics and Statistics, Orissa
Chart – 81 : Average Wages of Unskilled Agril Labourers
0
10
20
30
40
50
60
70
I(n R
upee
s)
Male Female Male Female Male Female
Agril Field Labour Other Labour Herds man
2006-07 2007-08
Agricultural field labourers include ploughman, sowers, weeders, reapes, harvesters etc. Other Agricultural field labourers relates to load carriers, well diggers, labourers for watering field etc. Herds man- These are persons whose main work is to collect live stock from different owners houses for grazing.

120
Table - 77
Districtwise Average Agricultutal Labour Wages of Unskilled Laboures by Sex for 2007-08
(In Rupees)
Agriculture field labour Other Agricultural labour Herds man Sl. No.
Name of the District
Male Female Male Female Male Female 1 2 3 4 5 6 7 8
1 Angul 60.19 45.30 65.62 47.78 50.33 40.00
2 Balasore 64.63 56.90 71.63 65.90 54.72 46.38
3 Bargarh 50.27 40.39 59.58 44.26 57.65 48.94
4 Bhadrak 62.75 56.96 100.33 62.67 57.50 49.50
5 Bolangir 48.49 47.48 56.39 50.23 46.04 42.91
6 Boudha 59.68 43.71 56.23 46.00 66.10 60.00
7 Cuttack 60.17 51.14 72.28 51.67 57.91 49.50
8 Deogarh 55.41 47.05 58.75 48.13 50.00 45.00
9 Dhenkanal 64.39 58.24 74.89 57.17 50.00 42.05
10 Gajapati 48.35 42.88 52.29 45.58 39.16 33.33
11 Ganjam 72.54 46.12 73.07 45.65 57.70 43.60
12 Jagatsinghpur 65.00 65.00 72.05 65.00 65.00 65.00
13 Jajpur 50.00 48.83 58.17 56.88 50.00 45.00
14 Jharsuguda 59.52 50.13 63.33 50.95 60.00 50.00
15 Kalahandi 56.62 44.89 52.64 46.78 47.88 40.13
16 Kendrapara 65.50 59.83 67.50 60.00 60.00 50.00
17 Keonjhar 59.33 46.63 60.46 48.86 40.00 28.75
18 Khurda 65.52 59.27 73.97 59.31 55.00 42.11
19 Koraput 56.27 42.05 59.97 53.84 44.79 40.00
20 Malkangiri 54.05 46.96 56.04 48.59 62.08 51.25
21 Mayurbhanj 53.02 41.87 55.50 45.58 50.41 40.00
22 Nawarangpur 52.33 47.54 51.25 42.08 52.08 47.42
23 Nayagarh 62.25 52.95 78.03 57.06 60.00 50.00
24 Nuapada 53.58 41.53 57.40 48.30 45.00 35.00
25 Phulbani 57.00 48.43 61.58 52.65 55.00 45.00
26 Puri 69.83 56.88 78.89 50.63 62.08 52.08
27 Rayagada 62.00 50.76 69.05 60.60 41.66 32.29
28 Sambalpur 59.97 46.12 58.15 56.34 60.00 50.00
29 Sonepur 53.88 43.30 57.33 45.43 48.54 34.58
30 Sundargarh 46.26 43.77 57.28 42.30 50.00 46.00
Total 58.29 49.30 64.32 51.91 57.31 47.59
Source : Directorate of Economics and Statistics, Orissa

121
OTHER GENDER ISSUES
Table – 78

122
Women in Decision making
(Women / Men MLAs in Orissa)
Sl No Year Total Strength of MLAs Women MLAs Men MLAs % of Women MLAs
1 1977 147 7 140 4.8
2 1980 147 5 142 3.4
3 1985 147 8 139 5.4
4 1990 147 7 140 4.8
5 1995 147 8 139 5.4
6 2000 147 14 133 9.5
7 2004 147 11 136 7.5
8 2009 147 9 138 6.1
Source : Human Development Index Report, Orissa / State Election Commission, Orissa
Chart – 82 : Women / Men MLAs in Orissa
Table – 79

123
Weekly average time spent on SNA, Extended SNA and Non-SNA activities by sex and
place of residence (All persons) (In hours)
Activities Sector
Category
SNA Extended SNA Non-SNA 1 2 3 4 5 1 Rural Male 39.54 4.34 124.1 Female 19.03 35.28 113.67 Total 29.26 19.83 118.92
2 Urban Male 42.19 5 120.81 Female 8.37 37.61 122.06 Total 26.46 20.18 121.41
3 Total Male 40.12 4.47 123.45 Female 17.07 35.7 115.2 Total 28.69 19.91 119.36
Source : Time Use Survey, D.E. & S., Orissa
Table – 80
Percentage of weekly average time spent on SNA, Extended SNA and Non-SNA
activities by sex and place of residence (All persons) Activities Total
Sector Sex SNA Extended
SNA Non-SNA
1 2 3 4 5 6 1 Rural Male 23.54 2.58 73.87 100 Female 11.33 21 67.66 100 Total 17.42 11.8 70.79 100 2 Urban Male 25.11 2.98 71.91 100 Female 4.98 22.39 72.65 100 Total 15.75 12.01 72.27 100 3 Total Male 23.88 2.66 73.48 100 Female 10.16 21.25 68.57 100 Total 17.08 11.85 71.05 100
Source : Time Use Survey, D.E. & S., Orissa

124
SNA activities consists of primary production activities like crop farming, animal husbandry, fishing , forestry, etc. and secondary activities like construction, manufacturing, trade , business and services.
Extended SNA activities include household maintenance, care for children, sick elderly.
Non-SNA activities relates to learning, social and cultural activities, personal care and self maintenance.
Table – 81 : Incidence & Rate of Crime Committed Against Women in Orissa
year Incidence Estimated Population ( in lakh)
Rate of crime ( Per one lakh Population)
2001 5357 368.0 14.6
2002 4779 372.4 12.8
2003 4243 376.7 11.3
2004 5239 380.8 13.8
2005 6249 384.9 16.2
2006 6825 388.8 17.6
2007 7304 392.7 18.6
2008 8303 396.5 20.9
Source- National Bureau of Crime, Delhi
Chart – 83 : Rate of Crime Committed against Women in Orissa ( Per one lakh Population)
0
5
10
15
20
25
2001 2002 2003 2004 2005 2006 2007 2008
Rate
Year

125
Crime against women includes rape, dowry death, cruelty by
husband/relative, molestation, sexual harassment . Crime rate
indicates rate of cognizable crimes and the incidence of crime
gives an absolute picture of crime situation in the state. The rate
of crime against women of the state indicates an increasing trend
over a period of time
Table – 82 : Percentage distribution of population by marital status and sex,
India and bigger States, 2007
Never married Married W/D/S India and bigger states Total Male Female Total Male Female Total Male Female
1 2 3 4 5 6 7 8 9 10 India 49.2 53.8 44.3 45.7 43.9 47.6 5.1 2.2 8.1 Andhra Pradesh 42.8 48.3 37.1 50.2 49.5 50.9 7.0 2.2 12.0
Bihar 53.3 57.3 49.0 43.0 40.3 45.9 3.7 2.4 5.1 Gujarat 45.7 49.9 41.1 49.2 47.5 51.0 5.1 2.6 7.9 Orissa 47.8 52.0 43.5 46.3 45.5 47.2 5.9 2.5 9.3 Punjab 47.9 52.6 42.7 47.3 44.8 50.1 4.8 2.6 7.2 Tamil Nadu 44.0 49.4 38.6 48.9 48.1 49.6 7.1 2.4 11.8 Uttar Pradesh 54.5 58.5 50.1 41.3 38.6 44.4 4.1 2.9 5.5 West Bengal 46.1 51.1 40.8 48.5 47.3 49.8 5.3 1.5 9.4
W/D/S - Widowed/Divorced/Separated Note : Total may not add to 100 due to rounding Source : SRS Bulletin
Chart - 84 : Percentage Population by marital status in Orissa,2007
0
10
20
30
40
50
60
Never married Married W/D/S
Total Male Female
Definitions

126
1. Population Dependency Ratio : Ratio of Persons in the Dependant age (under 14 years
and above 60 years) to Population in Working age (15 –
59 years)
2. Gender Gap in sex ratio : 1000 – Sex Ratio
3. Crude Death Rate : 1000No of deaths during the year XMid year population
4. Age Specific Death Rate : 1000No of deaths in a particular age group XMid year population of same age group
5. Infant Mortality Rate : 1000.
No of deaths in a particular age group XNo of livebirths during that year
6. Maternal Mortality Ratio : . 100000.
No of maternal deaths XNo of livebirths
7. Crude Birth Rate : . 1000No of live Births XMid year population
8. Total Fertility Rate :
45 49
15 1951000
Age specific fertility rateX
−
−∑
9. Gender Disparity Index in litracy : =log(x2/x1) + log(100-x1) / (100-x2) (David Sopher’s index) Where, x2>=x1
x1 = female literacy , x2= male literacy
10. Coefficient of Variation : . 100Std Deviation XMean
11.Gender Parity Index : ..
No of girls enrolledNo of boys enrolled
12.Work Participation Rate : 100Total workers XTotal Population
13. Population Projection of Districts : Those are calculated based on “Ratio Method” where share of the district population to State Population were calculated. Based on the shares of the districts, annual change in share in each districts computed and projected to the years 2011 and 2021.
14. Usual Principal Activity Status: The activity status on which a person spent
relatively longer time (major time criterion ) during 365 days preceding the date of survey.

127
ABBREVIATIONS
CDR Crude Death Rate
IMR Infant Mortality Rate
MMR Maternal Mortality Ratio
CBR Crude Birth Rate
TFR Total Fertility Rate
WPR Work Participation Rate
LFPR Labour Force Participation Rate
MSME Micro, Small & Medium Enterprise
WSHG Women Self Help Group
SNA System of National Account

128
Processed & designed by
Computer Centre,
Directorate of Economics and Statistics,
Odisha, Bhubaneswar