beyond gender: measuring disparity in south … · beyond gender: measuring disparity in south asia...
TRANSCRIPT

BEYOND GENDER: MEASURINGDISPARITY IN SOUTH ASIAUSING AN EDUCATION PARITYINDEX
Friedrich Huebler
Need Photo

Titles in this Series
The Move to Programme-Based Approaches – An Effective Partnership for Girls’ Education?The Experience of Recent EvaluationsTed Freeman
Educating Girls in South Asia: Promising ApproachesBarbara Herz
Reaching the Girls in South Asia: Differentiated Needs and Responses in EmergenciesAlexandra Mathieu
Mainstreaming Gender for Better Girls’ Education: Policy and Institutional IssuesRamya Subrahmanian
Measuring Gender Inequality in Education in South AsiaElaine Unterhalter
Addressing Social and Gender Disparity in South Asia Through SWAps and PBAs inEducation: How Can We Use World Experience?Amanda Seel
From Parity to Equality in Girls’ Education: How Are We Doing in South Asia?Els Heijnen-Maathuis
Poverty and Economic Vulnerability in South Asia: Does It Impact Girls’ Education?Eshya Mujahid-Mukhtar
Gender Mainstreaming: Does It Happen in Education in South Asia?Chandra Gunawardena and Swarna Jayaweera
Progress in Girls’ Education: The Challenge of Gender Equality in South AsiaSarah Huxley
Beyond Gender: Measuring Disparity in South Asia using an Education Parity IndexFriedrich Huebler
Friedrich Huebler
BEYOND GENDER: MEASURINGDISPARITY IN SOUTH ASIAUSING AN EDUCATION PARITYINDEX
© The United Nations Children’s Fund (UNICEF)
Regional Office for South Asia; and
United Nations Girls’ Education Initiative (UNGEI)
June, 2008
Short excerpts from this paper may be reproduced for non-profit purposes without authorization
on condition that the source is acknowledged. For longer extracts, permission in advance must be
obtained from the copyright holders via email at [email protected].
The opinions expressed in this paper are those of the author(s) and publication does not
necessarily constitute an endorsement by UNICEF or UNGEI.
Chair, Steering Committee: Susan Durston
UNGEI: Raka Rashid
Series Editor: John Evans
Feedback and correspondence to:
Websites:
www.unicef.org
www.ungei.org
Cover photo: UNICEF/HQ06-0370/Giacomo Pirozzi
Design and Colour Separations: DigiScan Pre-press, Kathmandu, Nepal
Printing: Format Printing Press, Kathmandu, Nepal

CONTENTS
Series Foreword ......................................................................................................... vAcknowledgements ................................................................................................. viiAcronyms ............................................................................................................... viiiSummary .................................................................................................................. ix
1. Introduction........................................................................................................... 1
2. Measurement of Disparity in Education ................................................................. 22.1 Education Indicators ................................................................................... 22.2 Disparity Analysis by Gender – Primary School Participation ....................... 32.3 Gender Parity Index ..................................................................................... 62.4 Composite Indicators of Disparity ................................................................ 9
3. Education Parity Index ........................................................................................12
4. Education Disparity in South Asia .......................................................................154.1 Results for South Asia ...............................................................................154.2 Education Disparity Trends in South Asia .................................................. 21
5. Conclusion .......................................................................................................... 23
References .............................................................................................................. 25
Notes ...................................................................................................................... 27
iii

iv
BEYOND GENDER:MEASURING DISPARITY IN SOUTH ASIA USING AN EDUCATION PARITY INDEX
Annex 1 Indicator Definitions ..................................................................................28Annex 2 Calculating the EPI – The Example of India ...............................................30Annex 3 Calculation of the Generalized Education Parity Index ...............................34
About the Author ......................................................................................................36

v
BEYOND GENDER:MEASURING DISPARITY IN SOUTH ASIA USING AN EDUCATION PARITY INDEX
SERIES FOREWORD
There is a growing sense of momentum around education in South Asia. Governmentsare engaged and a lot has been done. The Millennium Development Goals haveadded an additional spur to action as indeed have greater awareness on genderdisparity and the need for educated workers. There is though a long way to go if therights of all children are to be realized.
Providing access to education is only part of the story. Once children are enrolled andattending, the quality of their education must make it a worthwhile experience. Thespecial needs of girls in the social and cultural context of South Asia call for specialmeasures, as do the needs of all children in situations of conflict and emergency.South Asia has many rich, positive examples of success in advancing basiceducation. It is important that these are shared and built on if there is to be an overallimprovement throughout the region.
This series of papers aimed at promoting better education in South Asia grew out ofcollaboration between the UNICEF Regional Office for South Asia and the newlyformed UN Girls’ Education Initiative, and had its genesis at a Regional Meeting onAccelerating Girls’ Education in South Asia in February 2005.
Essentially the series is intended to be a forum that allows debate, exchange of ideasand to break new ground. It will aim to capture the momentum and extol goodpractice to all engaged in educational policy and implementation.
v
vi
BEYOND GENDER:MEASURING DISPARITY IN SOUTH ASIA USING AN EDUCATION PARITY INDEX
The series does not seek to represent a specific viewpoint, but rather is intended toenable specialist contributors to present issues in greater depth and breadth than isoften the case in official documents.
Initially the series will focus on girls’ education but it is hoped that eventually it willbroaden into a platform for more general education issues related to South Asia, witha particular emphasis on social inclusion. Contributions and feedback are invitedfrom academics and practitioners from throughout the South Asia region and beyond.The series editors are particularly interested in submissions which offer new ideasand strategies that can assist those needing answers, and which can add impetus tothe ongoing efforts in the region to provide quality education for all.
Come, join the debate!
vii
BEYOND GENDER:MEASURING DISPARITY IN SOUTH ASIA USING AN EDUCATION PARITY INDEX
This document is based on work the author presented at the conference on ‘Educationpolicy and the Right to Education: Towards More Equitable Outcomes for South Asia’sChildren’ that was organized by the UNICEF Regional Office for South Asia inSeptember 2007. I am grateful to Susan Durston, who encouraged me to studydisparities in the education systems of South Asia. I would also like to thank theconference participants for their comments on my presentation. Finally, my thanks goto Xiaodong Cai and Tomoyo Sakiyama, who reviewed drafts of this paper, and to JohnEvans, who edited the publication.
Friedrich Huebler
ACKNOWLEDGEMENTS
viii
BEYOND GENDER:MEASURING DISPARITY IN SOUTH ASIA USING AN EDUCATION PARITY INDEX
ACRONYMS
DHS Demographic and Health SurveyECCE Early Childhood Care and EducationECOSOC Economic and Social CouncilEDI EFA Development IndexEFA Education for AllEPI Education Parity IndexGDI Gender Development IndexGDP Gross Domestic ProductGEEI Gender Equality in Education IndexGEI Gender-specific EFA IndexGER Gross Enrolment RateGIR Gross Intake RateGPI Gender Parity IndexHDI Human Development IndexIIPS International Institute for Population SciencesMDG Millennium Development GoalMICS Multiple Indicator Cluster SurveyNAR Net Attendance RateNER Net Enrolment RateNIR Net Intake RateUIS UNESCO Institute for StatisticsUNDG United Nations Development GroupUNDP United Nations Development ProgrammeUNESCO United Nations Educational, Scientific and Cultural OrganizationUNICEF United Nations Children’s FundUSAID United States Agency for International Development

ix
BEYOND GENDER:MEASURING DISPARITY IN SOUTH ASIA USING AN EDUCATION PARITY INDEX
Analysis of disparities in national education systems is often limited to gender althoughother dimensions of disparity may also be important. This paper presents data on disparityin primary and secondary education by gender, area of residence and household wealthfor countries in South Asia. To facilitate the interpretation of complex data an EducationParity Index is introduced. The EPI combines information on disparities across differenteducation indicators and across different groups of disaggregation. The EPI is flexible andcan be modified according to national priorities. The use of the EPI as a tool to assesseducation disparities is illustrated with household survey data from Afghanistan,Bangladesh, India, Nepal and Pakistan.
SUMMARY


1
BEYOND GENDER:MEASURING DISPARITY IN SOUTH ASIA USING AN EDUCATION PARITY INDEX
INTRODUCTION
1
Analysis of disparities in national education systems is often limited to genderalthough other dimensions of disparity may also be important. This paper provides anoverview of disparity analysis in the area of education that looks beyond gender, witha focus on data from South Asia.
Chapter 2 describes basic concepts of disparity analysis and presents trend data onprimary school participation of boys and girls in Afghanistan, Bangladesh, Bhutan,India, the Maldives, Nepal, Pakistan and Sri Lanka. The chapter closes with anoverview of composite indicators of disparity.
Chapter 3 builds on the concepts outlined in Chapter 2 and introduces an EducationParity Index (EPI) that can be used to measure disparity across different educationindicators and across different dimensions of disaggregation.
Chapter 4 applies the Education Parity Index to household survey data from five SouthAsian countries. The EPI and its components reveal how much disparity exists in eachcountry’s education system and whether disparity is greatest with regard to gender,area of residence or household wealth. A trend analysis describes how the level ofdisparity has evolved over the past decade.
Chapter 5 describes the advantages and disadvantages of the EPI and concludes thepaper with a summary of the main findings.
2
BEYOND GENDER:MEASURING DISPARITY IN SOUTH ASIA USING AN EDUCATION PARITY INDEX
MEASUREMENT OF DISPARITY IN EDUCATION
2
2.1 Education Indicators
Various indicators have been used over the years to assess national educationsystems. Through the Education for All process and efforts related to the MillenniumDevelopment Goals, a core set of standardized indicators has emerged. For themonitoring of progress toward the Millennium Development Goals related toeducation, only four indicators are used (UN ECOSOC, 2007):
1. Primary school net enrolment rate2. Survival rate to the last grade of primary school1
3. Literacy rate of 15- to 24-year-olds, male and female4. Ratio of girls to boys in primary, secondary, and tertiary education.
The statistical tables in the annual publication The State of the World’s Children byUNICEF (2007b) list data on school attendance at the primary and secondary level ofeducation in addition to data on enrolment compiled by UNESCO. Net attendancerates are calculated from nationally representative household surveys, mainly theMultiple Indicator Cluster Surveys (MICS) by UNICEF and the Demographic andHealth Surveys (DHS) that are carried out with support from the US Agency forInternational Development (USAID).2 If there is no measurement error and if allchildren enrolled in school also attend, net enrolment rates are identical to netattendance rates.3

3
BEYOND GENDER:MEASURING DISPARITY IN SOUTH ASIA USING AN EDUCATION PARITY INDEX
The MDG education indicators and the net attendance rates in The State of theWorld’s Children meet the definition of a good indicator provided in the guide toGender-sensitive Education Statistics and Indicators (UNESCO, 1999). Goodindicators should be:
� ‘policy-relevant, by being capable of providing clear and unambiguous responsesto key policy issues and concerns;
� user friendly, i.e. comprehensible, timely and few in number;� derived from a framework, which allows the interpretation of one figure (say
enrolment) in the context of other basic variables (say demography and investmentin education) of a particular country;
� technically sound, i.e. valid, reliable and comparable;� feasible to measure at reasonable cost, in that the basic statistics required for
deriving them can be either readily available or comparatively easy to collectwithin a well-defined time-frame’ (UNESCO, 1999, p.6).
The annual Education for All Global Monitoring Report (UNESCO, 2007) containsstatistics for a larger set of indicators, including:
� Gross enrolment rate in pre-primary education� Net enrolment rate in pre-primary education� New entrants to the first grade of primary education with early childhood care and
education (ECCE) experience� Gross intake rate in primary education� Net intake rate in primary education� Transition rate to secondary education� School life expectancy� Repetition rate by grade� Dropout rate by grade� Pupil:teacher ratio� Percentage of trained teachers� Adult literacy rate
Indicator definitions and calculation methods can be found in Annex 1 and inpublications by UNESCO (1998) and the UNESCO Institute for Statistics (2003).
2.2 Disparity Analysis by Gender – Primary School Participation
The lack of available data is a common obstacle to the analysis of disparities innational education systems. Enrolment statistics in the Global Education Digest

4
BEYOND GENDER:MEASURING DISPARITY IN SOUTH ASIA USING AN EDUCATION PARITY INDEX
(UNESCO Institute for Statistics, 2007) and the EFA Global Monitoring Report(UNESCO, 2007) are usually only disaggregated by gender.
Other disparities, for example by area of residence or by household wealth, can bestudied with data from household surveys, including the Multiple Indicator ClusterSurveys (MICS) and the Demographic and Health Surveys (DHS).
This section describes primary school participation in the South Asia region,disaggregated by gender, using results compiled by UNICEF from a wide variety ofsources.
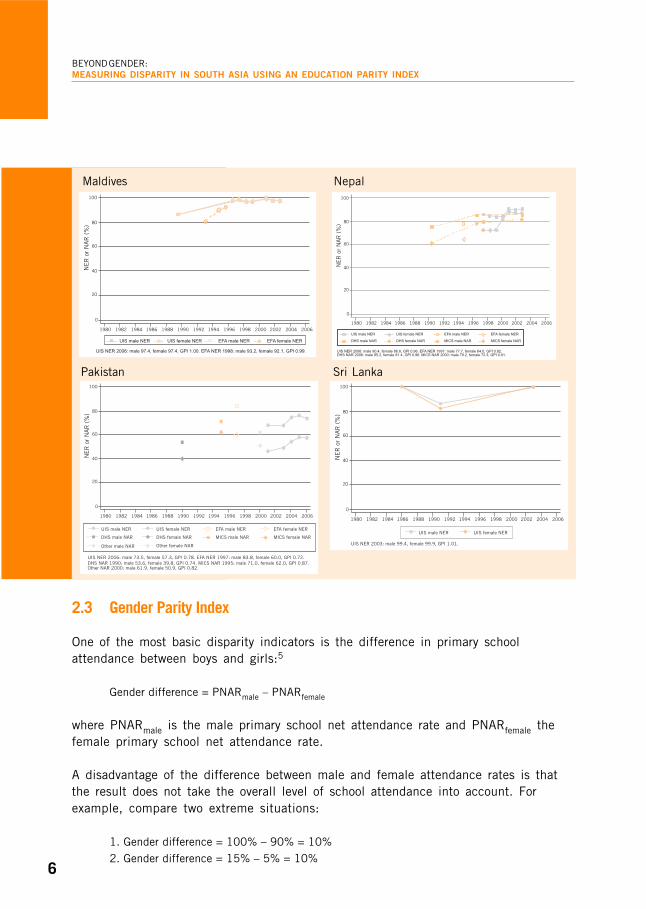
The box at the end of this section presents data on primary school participation in theeight South Asian countries from 1980 to 2006: Afghanistan, Bangladesh, Bhutan,India, the Maldives, Nepal, Pakistan and Sri Lanka. The principal sources of datawere several MICS and DHS surveys, two online databases by the UNESCO Institutefor Statistics (UIS, 1999; 2008), and an EFA database (UNESCO, 2000).4
The graphs plot primary school net enrolment rates (NER) and net attendance rates(NAR). The primary school net enrolment rate and net attendance rate are two of themost basic indicators used to assess national education systems and yet the figuresshow that there are large gaps in data coverage. At the bottom of each graph, thegender parity index (GPI) for the most recent observation in each time series is listed.The GPI is the ratio of the female over the male NER or NAR.
� In Afghanistan, primary school participation by girls was very low until the late1990s. Fewer than 20 per cent of all girls of primary school age were in school.Since 2000, primary school net attendance rates by girls have increased rapidlybut are still below the respective values for boys.
� In Bangladesh, primary school net enrolment and net attendance rates haveincreased steadily since the late 1980s. In addition, girls reached the same levelof primary school participation as boys around the year 2000 and since thenfemale enrolment and attendance rates have been above male rates.
� In Bhutan, there has been a steady increase in primary school participation since1990 and at the same time a reduction in the gap between boys and girls. The latestenrolment data shows that the country has reached gender parity in primary education.
� In India, data from a variety of sources shows high levels of primary schoolparticipation. Girls continue to lag behind boys but the gap is smaller than it wasin previous years.

5
BEYOND GENDER:MEASURING DISPARITY IN SOUTH ASIA USING AN EDUCATION PARITY INDEX
� The Maldives has been near universal primary education and gender parity sincethe late 1990s.
� In Nepal, there has been a remarkable increase in primary school attendance andenrolment by girls since the 1980s while boys’ net enrolment and attendance rateshave stayed at about the same level. The most recent DHS data from 2006 indicatesthat gender disparity has almost disappeared at the primary level of education.
� In Pakistan, data coverage is spotty and inconsistent, and no steady trend towardincreased primary school participation can be observed. At the same time the datafrom the different sources confirms that gender disparity is a persistent problem,with fewer girls than boys in primary school.
� In Sri Lanka, there is also weak data coverage but the latest enrolment ratesindicate that the Millennium Development Goals of universal primary educationand gender parity have been reached.
PRIMARY SCHOOL PARTICIPATION IN SOUTH ASIA, 1980–2006
Afghanistan Bangladesh
Bhutan India
���� ����
�
��
��
��
��
���
���� ���� ���� ���� ���� ���� ���� ���� ���� ���� ���� ����
��
��
��
���
�
���������� ������������ ������������ ��������������
��������������������� �����������! �"#����������������������������!�! ������������ �"#�������
���� ����
�
��
��
��
��
���
���� ���� ���� ���� ���� ���� ���� ���� ���� ���� ���� ����
��
��
��
���
�
���������� ���� ������ ���������� ���� ������
���������� ���� ������ ����������� ����� ������
����������������������� �������������� ������������ ��������������� �������������� ������������������������!�� �������������� ����������������"������������ �����!�������� ��"�
���� ����
�
��
��
��
��
���
���� ���� ���� ���� ���� ���� ���� ���� ���� ���� ���� ����
��
��
��
���
�
���������� ���� ������ ���������� ���� ������
���������� ���� ������ ����������� ����� ������
����������"������������ �����"�����������"��������� ��������������� ����"������������������������"������������ ����� �����������"�������������������������� �������!��������� �
���������� ������������ $�������� $����������
%&'���������� %&'������������
�����������������(��� ��������(��� �"#��������$���������������!��� ���������(�� �"#�������%&'�����������������(��! ���������(�� �"#�������
���� ����
�
��
��
��
��
���
���� ���� ���� ���� ���� ���� ���� ���� ���� ���� ���� ����
��
��
��
���
�
6
BEYOND GENDER:MEASURING DISPARITY IN SOUTH ASIA USING AN EDUCATION PARITY INDEX
Pakistan Sri Lanka
Maldives Nepal
2.3 Gender Parity Index
One of the most basic disparity indicators is the difference in primary schoolattendance between boys and girls:5
Gender difference = PNARmale – PNARfemale
where PNARmale is the male primary school net attendance rate and PNARfemale thefemale primary school net attendance rate.
A disadvantage of the difference between male and female attendance rates is thatthe result does not take the overall level of school attendance into account. Forexample, compare two extreme situations:
1. Gender difference = 100% – 90% = 10%2. Gender difference = 15% – 5% = 10%
���� ����
�
��
��
��
��
���
���� ���� ���� ���� ���� ���� ���� ���� ���� ���� ���� ����
��
��
��
���
�
���������� ���� ������ ���������� ���� ������
����������"������������ �������������� ������������ ����������!���� ������� �����������
���� ����
�
��
��
��
��
���
���� ���� ���� ���� ���� ���� ���� ���� ���� ���� ���� ����
�
� ��
��
���
�
���������� ������������ $��������
)*��������� )*����������� ������������
%&'���������� %&'������������
$����������
��������������
�����������������(��! ��������!(�� �"#����(���$�������(����������� ������������ �"#����(��)*����������������!��� ������������ �"#����(��������������!�������(��� ������������ �"#�����(�%&'��������������������� ��������!��� �"#�������
���� ����
�
��
��
��
��
���
���� ���� ���� ���� ���� ���� ���� ���� ���� ���� ���� ����
��
��
��
���
�
��������������������� ������������ �"#�������
���������� ������������
���� ����
�
��
��
��
��
���
���� ���� ���� ���� ���� ���� ���� ���� ���� ���� ���� ����
��
��
��
���
����������� ���� ������ ���������� ���� ������
���������� ���� ������ ����������� ����� ������
����������"������������ �����"�����������"��������� ��������������� ����"������������������������"������������ ����� �����������"�������������������������� �������!��������� �
7
BEYOND GENDER:MEASURING DISPARITY IN SOUTH ASIA USING AN EDUCATION PARITY INDEX
In both cases, the gender difference is 10%. However, in the first example, therelative gap between male and female attendance rates is much smaller than in thesecond example.
A more useful measure of disparity between boys’ and girls’ attendance rates is theGender Parity Index (GPI), the ratio of female to male values.
Gender Parity Index = =
If the GPI is 1, the country is at gender parity.6 A GPI above 1 indicates disparity infavour of girls and a GPI below 1 disparity in favour of boys. With the values from theprevious examples, the GPI is calculated as follows:
1. GPI = = 0.9
2. GPI = = 0.33
The difference between the male and female values is 10% in both cases but the GPIis either 0.9 or 0.33. In the case of the higher attendance rates, the country is muchcloser to gender parity – a GPI of 1 – than in the case of the lower attendance rates.As a measure of equality or inequality, the GPI is therefore more precise.
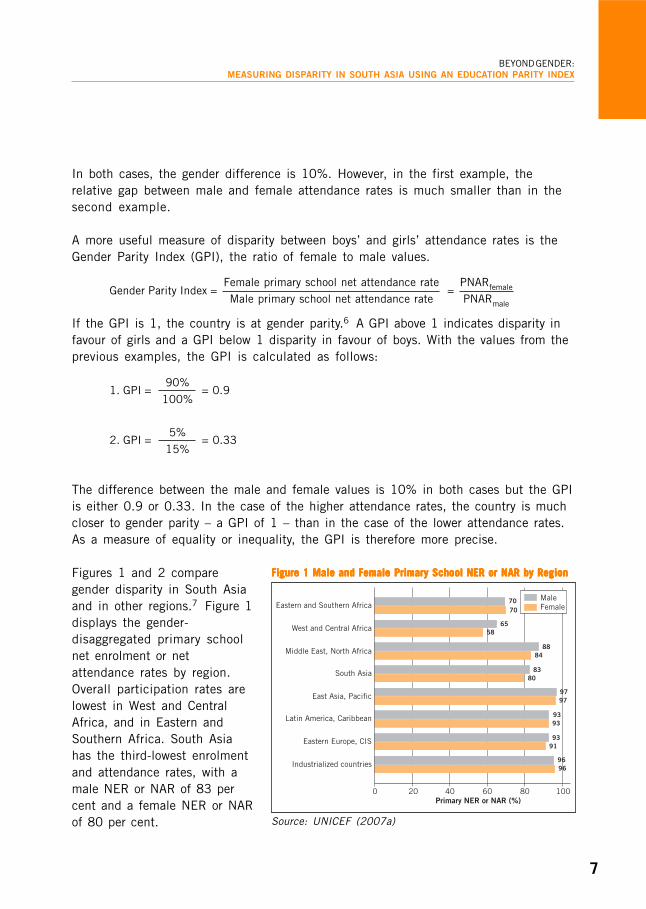
Figures 1 and 2 comparegender disparity in South Asiaand in other regions.7 Figure 1displays the gender-disaggregated primary schoolnet enrolment or netattendance rates by region.Overall participation rates arelowest in West and CentralAfrica, and in Eastern andSouthern Africa. South Asiahas the third-lowest enrolmentand attendance rates, with amale NER or NAR of 83 percent and a female NER or NARof 80 per cent.
90%
100%
5%
15%
Female primary school net attendance rateMale primary school net attendance rate
PNARfemale
PNARmale
Figure 1 Male and Female Primary School NER or NAR by RegionFigure 1 Male and Female Primary School NER or NAR by RegionFigure 1 Male and Female Primary School NER or NAR by RegionFigure 1 Male and Female Primary School NER or NAR by RegionFigure 1 Male and Female Primary School NER or NAR by Region
Source: UNICEF (2007a)
����
����
����
����
����
���
��
����
� �� �� �� �� ����� �������������������
�+,-.&�/��/0�,�1 -+&�/�.
�.&��+�-� 2� ����
3�&/+�����/1� ����/44��+
�.&��./� �#�1/�/1
� -&'��./�
�/,,����.& � �&'����/1�
5�.&��+,���+&�������/1�
�.&��+��+,�� -&'��+����/1�����$�����

8
BEYOND GENDER:MEASURING DISPARITY IN SOUTH ASIA USING AN EDUCATION PARITY INDEX
Figure 2 shows the data from Figure 1 in terms of the Gender Parity Index. All regionsexcept West and Central Africa are at or near gender parity in primary education.Eastern and Southern Africa has the highest value although, compared with mostother regions, relatively few children are in primary school. Figure 2 makes it clearthat the GPI alone provides only a partial picture of the participation of boys and girlsin the education system.
Figure 2 Gender Parity Index for Primary School NER or NAR by RegionFigure 2 Gender Parity Index for Primary School NER or NAR by RegionFigure 2 Gender Parity Index for Primary School NER or NAR by RegionFigure 2 Gender Parity Index for Primary School NER or NAR by RegionFigure 2 Gender Parity Index for Primary School NER or NAR by Region
Source: UNICEF (2007a)
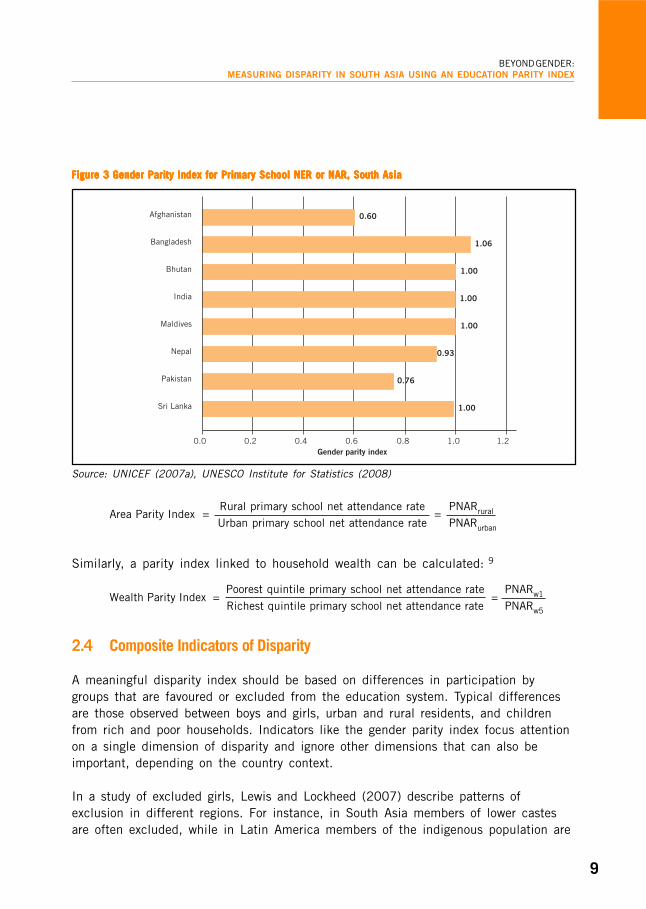
Lastly, Figure 3 displays the gender parity index for the primary school net enrolmentor net attendance rate in the eight South Asian countries.8 Bhutan, India, theMaldives and Sri Lanka have reached gender parity in primary education. Bangladeshis the only country with a gender disparity in favour of girls. In Afghanistan andPakistan, girls are far behind boys with regard to primary school attendance orenrolment. In Nepal, girls are also less likely to be in school than boys but genderparity is within reach.
The concept of the gender parity index can be extended to other types ofdisaggregation, such as the area of residence or the level of household wealth.
To calculate an area of residence parity index, the rural primary school netattendance rate can be divided by the urban primary school net attendance rate:
����
����
����
����
����
���
����
����
��� ��� ��� ��� ��� ������������� �� ���!
�+,-.&�/��/0�,�1 -+&�/�.
�.&��+�-� 2� ����
3�&/+�����/1� ����/44��+
�.&��./� �#�1/�/1
� -&'��./�
�/,,����.& � �&'����/1�
5�.&��+,���+&�������/1�
�.&��+��+,�� -&'��+����/1�
9
BEYOND GENDER:MEASURING DISPARITY IN SOUTH ASIA USING AN EDUCATION PARITY INDEX
����
����
����
����
����
����
����
����
��� ��� ��� ��� ��� ��� ������������� �� ���!
��/�3�+6�
#�6/.&�+
�2��
���,/7�.
�+,/�
8'-&�+
8�+9��,�.'
��9'�+/.&�+
Figure 3 Gender Parity Index for Primary School NER or NAR, South AsiaFigure 3 Gender Parity Index for Primary School NER or NAR, South AsiaFigure 3 Gender Parity Index for Primary School NER or NAR, South AsiaFigure 3 Gender Parity Index for Primary School NER or NAR, South AsiaFigure 3 Gender Parity Index for Primary School NER or NAR, South Asia
Source: UNICEF (2007a), UNESCO Institute for Statistics (2008)
Area Parity Index = =
Similarly, a parity index linked to household wealth can be calculated: 9
Wealth Parity Index = =
2.4 Composite Indicators of Disparity
A meaningful disparity index should be based on differences in participation bygroups that are favoured or excluded from the education system. Typical differencesare those observed between boys and girls, urban and rural residents, and childrenfrom rich and poor households. Indicators like the gender parity index focus attentionon a single dimension of disparity and ignore other dimensions that can also beimportant, depending on the country context.
In a study of excluded girls, Lewis and Lockheed (2007) describe patterns ofexclusion in different regions. For instance, in South Asia members of lower castesare often excluded, while in Latin America members of the indigenous population are
Rural primary school net attendance rateUrban primary school net attendance rate
PNARrural
PNARurban
Poorest quintile primary school net attendance rate
Richest quintile primary school net attendance rate
PNARw1
PNARw5

10
BEYOND GENDER:MEASURING DISPARITY IN SOUTH ASIA USING AN EDUCATION PARITY INDEX
excluded. The authors proceed to compare the schooling of children from differentgroups. In India, the primary school enrolment rate of majority urban boys is highestwhile enrolment rates are lowest among rural girls from scheduled castes or tribes. InBangladesh, household wealth is shown to be strongly linked to the highest gradeattained.
To overcome the disadvantages of indices that examine only one dimension ofdisparity (for example gender) or one aspect of the education system (for exampleprimary school attendance), several composite indicators have been proposed.
Gender-specific EFA Index (GEI)This index was developed by UNESCO for use in its reporting on the EFA goals. TheGEI is the average of the gender parity indices for:
� Primary GER� Secondary GER� Adult literacy rate
If the GPI for one of the three components of the GEI is greater than 1 becausefemale values are above male values, the usual calculation method (female dividedby male value) is reversed and the respective male value is divided by the femalevalue. This ensures that the GEI is limited to a range of 0 to 1.
EFA Development Index (EDI)The Education for All Global Monitoring Reports introduced the EFA DevelopmentIndex (EDI), which combines data on four EFA indicators:
� Primary NER� Adult literacy rate� Survival rate to Grade 5� Gender-specific EFA Index (GEI)
The EDI, confined to values between 0 and 1, is the arithmetic mean of these fourvalues. Thus disparity as measured by the GEI accounts for only a quarter of the valueof this index.
Gender Development Index (GDI)The Gender Development Index (GDI) is calculated by UNDP to reflect inequalitiesbetween men and women, based on the same data as the more widely known HumanDevelopment Index (HDI): life expectancy at birth, adult literacy rate and GDP percapita (UNDP, 2007).

11
BEYOND GENDER:MEASURING DISPARITY IN SOUTH ASIA USING AN EDUCATION PARITY INDEX
Gender Equality in Education Index (GEEI)Unterhalter (2006) proposes an indicator to measure gender inequality in education.Her gender equality in education index (GEEI) combines data from four indicators:
� Primary school net attendance rate of girls� Survival rate to Grade 5 of girls� Secondary school net enrolment ratio of girls� Gender Development Index (GDI)
One disadvantage of Unterhalter’s GEEI is that it is not a true measure of inequality.Except for the GDI, the other three components only refer to data for girls. It ispossible to have a high value for the GEEI if, for example, the survival rate to Grade 5is 100% for girls and 0% for boys. By design, the indicator also ignores otherdimensions of disparity, such as area of residence.
Equity across geographic regions within a countryEquity across geographic regions within a country is addressed by Sherman andPoirier (2007). The authors study equity in access, measured by enrolment ratios, andequity in resource allocation, measured by expenditure per pupil and pupil:teacherratios. Sherman and Poirier further distinguish between horizontal equity and equaleducational opportunity. Horizontal equity refers to disparities in access and resourceallocation across regions within a country. Equal educational opportunity refers to thelinks between access and resources on the one hand and wealth and residence in anurban or rural area on the other hand. The actual analysis is limited to regionaldisparities but the authors mention that disparities based on gender, race or ethnicity,and socio-economic status may be more important than regional disparities.
To measure equity in primary and secondary school enrolment between differentregions, Sherman and Poirier employ two indicators:
� Range ratio: The range ratio is calculated by dividing the highest regional valueby the lowest regional value for a given indicator. Equity is indicated by the value1. Higher values indicate inequity.
� Coefficient of variation: The coefficient of variation is calculated by dividing thestandard deviation of an indicator by its mean value. This coefficient measures thevariability of an indicator around the mean value, where perfect equity is indicatedby the value 0. Higher values indicate inequity.
A disadvantage of the range ratio is that its values are not bound by an upper limit.By reversing the calculation method and dividing the lowest by the highest regionalvalue, the range would be limited to values between 0 and 1, similar to the EFADevelopment Index, with 1 indicating equity.

12
BEYOND GENDER:MEASURING DISPARITY IN SOUTH ASIA USING AN EDUCATION PARITY INDEX
Chapter 2 introduced some basic concepts for the measurement of educationdisparity. The chapter also described existing inequality indicators and pointed outsome of their weaknesses. Here, these concepts are applied to suggest a compositeindicator that combines information on more than one dimension of disparity.
The proposed Education Parity Index or EPI measures disparity:
a) across different groups of the population, for example boys and girls or urban andrural children, and
b) across different indicators, for example school attendance or completion.
The EPI can be modified to include any number of groupings and indicatorsdepending on the desired level of analysis and depending on the available data. Thispaper focuses on three groupings:
� Gender (female, male)� Area of residence (rural, urban)� Household wealth (poorest to richest quintile)
and three indicators:
� Primary school net attendance rate (PNAR)� Secondary school net attendance rate (SNAR)� Survival rate to the last grade of primary school (SRLG)
EDUCATION PARITY INDEX
3

13
BEYOND GENDER:MEASURING DISPARITY IN SOUTH ASIA USING AN EDUCATION PARITY INDEX
The underlying concept is that of the Gender Parity Index, modified to constrain therange to 0 to 1, where 1 indicates equality. This is accomplished by always dividingthe lowest by the highest value. As an example, assume that the female primary NARin a country is 75% and the male NAR 70%. The standard Gender Parity Index for theprimary NAR would then be calculated as follows:
GPI = = = 1.07
where PNARfemale is the female primary school net attendance rate and PNARmale themale primary school net attendance rate. For the EPI, to limit the range to valuesbetween 0 and 1, the smaller of the two values is always placed in the numerator andthe larger value in the denominator:
EPIPNAR gender =
=
=
= 0.93
EPIPNAR gender is the Education Parity Index by gender for the primary school netattendance rate. The value 0.93 indicates that there is disparity in the educationsystem (the value 1 would indicate parity), but to understand whether this disparity isto the disadvantage of boys or girls it is necessary to examine the underlying data, inthis case the male and female primary NAR values.
Similar indices can be calculated by disaggregating the data by other dimensions, inthis example area of residence and household wealth. The parity index for the primaryNAR with regard to area of residence can be called EPIPNAR area and the parity indexfor the primary NAR with regard to household wealth EPIPNAR wealth.
The arithmetic mean of the three disparity indicators – EPIPNAR gender, EPIPNAR area andEPIPNAR wealth – indicates overall disparity in primary school attendance across thedimensions of gender, area of residence and wealth quintile:
EPIprimary NAR =
PNARfemale
PNARmale
75%70%
min (70%, 75%)max (70%, 75%)
70%75%
min (PNARmale, PNARfemale)max (PNARmale, PNARfemale)
EPIPNAR gender + EPIPNAR area + EPIPNAR wealth
3

14
BEYOND GENDER:MEASURING DISPARITY IN SOUTH ASIA USING AN EDUCATION PARITY INDEX
The EPI can be further expanded to include information on disparity in other areas ofthe education system. Here, we want to measure disparity for the following threeindicators:
� Primary school net attendance rate (PNAR)� Secondary school net attendance rate (SNAR)� Survival rate to the last grade of primary school (SRLG)
The indices for the secondary school net attendance rate, EPIsecondary NAR, and for thesurvival rate to the last grade of primary school, EPIsurvival rate, are, following the aboveprocedure:
EPIsecondary NAR =
EPIsurvival rate =
The overall EPI is then the average of the three individual parity indices:
EPI =
The theoretical range of the EPI is 0 to 1, where 0 indicates absolute inequality.Such a value would be obtained if no girls, rural residents or poor children were inschool. An EPI of 1 indicates absolute equality, with the same participation rates forall children.
For illustrative purposes, the calculation of the Education Parity Index isdemonstrated with data from India in Annex 2.
If desired, the EPI can be modified to cover other education indicators and othergroups of disaggregation. In Nepal and other countries in South Asia, for instance,caste and ethnicity are important determinants of exclusion from the educationsystem (World Bank and DFID, 2006). Depending on the available data, a componentmeasuring disparity between children from different castes or ethnic groups could beadded to the EPI. The generalized formula that allows such a modification of theEducation Parity Index is described in Annex 3.
EPISRLG gender + EPISRLG area + EPISRLG wealth
3
EPIprimary NAR + EPIsecondary NAR + EPIsurvival rate
3
EPISNAR gender + EPISNAR area + EPISNAR wealth
3

15
BEYOND GENDER:MEASURING DISPARITY IN SOUTH ASIA USING AN EDUCATION PARITY INDEX
4.1 Results for South Asia
The Education Parity Index described in Chapter 3 can now be used to compare thecountries in South Asia. For this analysis, household survey data was available forfive of the eight countries in the region:
� Afghanistan MICS 2003� Bangladesh MICS 2006� India DHS 2005/06� Nepal DHS 2006� Pakistan Survey 2000/01
No survey data was available for Bhutan, the Maldives and Sri Lanka.
Table 1 lists disaggregated values for the primary school NAR, secondary school NARand survival rate to the last grade of primary school in Afghanistan, Bangladesh,India, Nepal and Pakistan.10 Using this data, the Education Parity Indices for gender,area of residence and household wealth for the three indicators can be calculated,together with an overall index for each country. The calculation method is describedin Annex 2 and the resulting EPI values are shown in Table 2.
EDUCATION DISPARITY IN SOUTH ASIA
4
16
BEYOND GENDER:MEASURING DISPARITY IN SOUTH ASIA USING AN EDUCATION PARITY INDEX
� In Afghanistan, gender disparity at the secondary level of education, indicated bythe value 0.33, is much greater than at the primary level, where the gender parityindex is 0.61 (see Table 2). On the other hand, there is hardly any gender disparityin the survival rate to the last grade, as indicated by the value 0.96. Disparity byhousehold wealth is consistently greater than disparity by gender or area ofresidence. The biggest disparity exists for secondary school attendance of childrenfrom poor and rich households, as indicated by the value 0.20. The overall EPI is0.55, which shows that the education system in Afghanistan is far from equality.
� In Bangladesh, disparity at the secondary level of education is greater than at theprimary level, similar to Afghanistan. In addition, overall disparity linked tohousehold wealth (0.66) is more important than disparity linked to gender (0.92)or the area of residence (0.93).
� In India, the parity index for the secondary school net attendance rate is 0.65 andthe parity index for the survival rate to the last grade is 0.95. The biggest disparityacross the three indicators and across the three categories of disaggregation isobserved for secondary school attendance by household wealth. The value 0.35means that the secondary school NAR among children from the poorest wealthquintile is two-thirds lower than the secondary school NAR among children fromthe richest quintile.
� In Nepal, similar disparities as in India are observed. Again, there is greaterdisparity linked to the secondary NAR and to household wealth than to otherindicators and levels of disaggregation.
� In Pakistan, gender disparity is less significant than disparity by area of residence.The survey data for Pakistan contains no information on household wealth.
Figure 4 provides an overview of the parity indices from Afghanistan, Bangladesh,India, Nepal and Pakistan. At a value of 1 there is parity while lower values indicatedisparity. In each country with data, disparity by wealth is greatest, as indicated bythe low value of the wealth parity index. In Afghanistan, India, Nepal and Pakistan,gender disparity is smaller than disparity linked to the area of residence andhousehold wealth. The exception is Bangladesh, where the disparity between urbanand rural areas is smaller than the disparities linked to other groups ofdisaggregation.
Overall disparity, measured by the total Education Parity Index, the rightmost bar inFigure 4, is at roughly the same level in Bangladesh, India, Nepal and Pakistan. The

17
BEYOND GENDER:MEASURING DISPARITY IN SOUTH ASIA USING AN EDUCATION PARITY INDEX
�������
����
���" ����
����
������� ����
���
���"
���" ����
����
���� ����
��������
���
���
���
���
���
���
���
���
���
���
���
���
�#$%�� & ���"��� '��$(���&%�"��� )�� ��"��*��
����(�"��� ��+ & ���"���*��
"�+,�� ����� ����./,�+1� * -.�' �,�:���&' ; &���#�
���
��
���
!
Figure 4 Education Disparity in South AsiaFigure 4 Education Disparity in South AsiaFigure 4 Education Disparity in South AsiaFigure 4 Education Disparity in South AsiaFigure 4 Education Disparity in South Asia
approximate EPI value 0.8 means that the primary NAR, the secondary NAR, and thesurvival rate to the last grade of the most disadvantaged groups are, on average, at80% of the respective attendance and survival rates of the groups with the highestvalues in each country. The worst performing country in terms of disparity isAfghanistan, with an EPI value of 0.55.
It is important to recall that the EPI only tells us whether there is disparity in theeducation system and as such it can be used to compare the degree of disparity indifferent countries. However, the value itself conveys no information on which groupsuffers from exclusion and therefore the EPI alone cannot be used to draft policyresponses to reduce disparities. To identify disadvantaged groups it is necessary toreview the underlying data in Table 1.
A further limitation of the EPI is that it does not take the absolute level of primaryschool attendance or other indicators into account. With the calculation methoddescribed in this paper, countries with a primary NAR of 90% could have the sameparity index as countries with a primary NAR of 10%, as long as all groups ofdisaggregation participate equally in the education system.

18
BEYOND GENDER:MEASURING DISPARITY IN SOUTH ASIA USING AN EDUCATION PARITY INDEX
TTTTTable 1 Surable 1 Surable 1 Surable 1 Surable 1 Survey Data for South Asiavey Data for South Asiavey Data for South Asiavey Data for South Asiavey Data for South Asia
MaleFemaleUrbanRuralPoorest quintileSecond quintileMiddle quintileFourth quintileRichest quintile
Primary NAR (%)
65.539.672.145.839.344.853.659.071.5
Secondary NAR (%)
17.65.822.76.75.25.08.414.225.3
Survival to last gradeof primary (%)*
62.760.071.053.251.344.955.662.075.9
MaleFemaleUrbanRuralPoorest quintileSecond quintileMiddle quintileFourth quintileRichest quintile
Primary NAR (%)
78.583.580.681.173.080.282.586.586.8
Secondary NAR (%)
36.141.344.436.418.828.936.547.459.9
Survival to last gradeof primary (%)*
86.793.291.089.879.886.190.894.095.8
MaleFemaleUrbanRuralPoorest quintileSecond quintileMiddle quintileFourth quintileRichest quintile
Primary NAR (%)
85.281.488.581.569.481.287.592.295.7
Secondary NAR (%)
58.548.764.249.129.142.652.165.582.6
Survival to last gradeof primary (%)*
95.794.997.494.287.292.895.598.099.4
India 2005/06
Bangladesh 2006
Afghanistan 2003

19
BEYOND GENDER:MEASURING DISPARITY IN SOUTH ASIA USING AN EDUCATION PARITY INDEX
MaleFemaleUrbanRuralPoorest quintileSecond quintileMiddle quintileFourth quintileRichest quintile
Primary NAR (%)
86.082.090.283.276.779.884.386.996.9
Secondary NAR (%)
45.737.852.440.127.833.340.650.859.5
Survival to last gradeof primary (%)*
89.087.192.887.078.180.389.392.595.8
MaleFemaleUrbanRuralPoorest quintileSecond quintileMiddle quintileFourth quintileRichest quintile
Primary NAR (%)
61.950.972.050.1
Secondary NAR (%)
23.218.032.114.8
Survival to last gradeof primary (%)*
89.990.593.887.4
Pakistan 2000/01**
Nepal 2006
* Measured by a proxy indicator
** The survey data for Pakistan contains no information on household wealth

20
BEYOND GENDER:MEASURING DISPARITY IN SOUTH ASIA USING AN EDUCATION PARITY INDEX
TTTTTable 2 Education Parity Indices for South Asia (calculated frable 2 Education Parity Indices for South Asia (calculated frable 2 Education Parity Indices for South Asia (calculated frable 2 Education Parity Indices for South Asia (calculated frable 2 Education Parity Indices for South Asia (calculated from values in Tom values in Tom values in Tom values in Tom values in Table 1)able 1)able 1)able 1)able 1)
GenderArea of residenceHousehold wealthTotal
Primary NAR
0.610.640.550.60
Secondary NAR
0.330.300.200.27
Survival to lastgrade of primary*
0.960.750.590.77
India 2005/06
Bangladesh 2006
Afghanistan 2003
Total
0.630.560.450.55
GenderArea of residenceHousehold wealthTotal
Primary NAR
0.940.990.840.93
Secondary NAR
0.880.820.310.67
Survival to lastgrade of primary*
0.930.990.830.92
Total
0.920.930.660.84
GenderArea of residenceHousehold wealthTotal
Primary NAR
0.960.920.730.87
Secondary NAR
0.830.770.350.65
Survival to lastgrade of primary*
0.990.970.880.95
Total
0.930.880.650.82
Pakistan 2000/01
Nepal 2006
GenderArea of residenceHousehold wealthTotal
Primary NAR
0.950.920.790.89
Secondary NAR
0.830.760.470.69
Survival to lastgrade of primary*
0.980.940.820.91
Total
0.920.870.690.83
GenderArea of residenceHousehold wealthTotal
Primary NAR
0.820.70
–0.76
Secondary NAR
0.780.46
–0.62
Survival to lastgrade of primary*
0.990.93
–0.96
Total
0.860.70
–0.78
* Measured by a proxy indicator

21
BEYOND GENDER:MEASURING DISPARITY IN SOUTH ASIA USING AN EDUCATION PARITY INDEX
��
��������
���
����
���" ���"
����
����
����
��������
��!
���
��(
���
���
��!
���
��(
���
���
���! ���� ���! ���! ���� ���! ���! ���� ���!
���! ���� ���! ���! ���� ���!
�#$%�� & �� '��$(���&% )�� �
����( ��+ & ��
��,
-� ��
����
��
���
!
4.2 Education Disparity Trends in South Asia
Through a combination of survey data from several years it is possible to analysetrends in disparity as measured by the Education Parity Index. For the trend analysis,the following household surveys were available in addition to those listed above:
� Bangladesh DHS 1999/2000 � Bangladesh DHS 2004� India DHS 1998/99 � India MICS 2000� Nepal DHS 1996 � Nepal MICS 2000� Nepal DHS 2001
Figure 5 plots the EPI values calculated from each survey. Due to lack of data, notrends can be shown for Afghanistan and Pakistan. In the other three countries, theEPI has increased from the earliest to the latest year with data, indicating a decreasein disparity over the period of observation.
In Bangladesh, the EPI grew from 0.79 in 2000 to 0.84 in 2006. In India, the EPIwas at 0.77 in 1999 and 0.82 in 2006. In Nepal, the EPI shows the biggestincrease, from 0.67 in 1996 to 0.83 in 2006, interrupted by a decrease from 2000to 2001. Compared with the other countries, Nepal has thus made the most progresstoward parity in the education system.
Source: National household survey data, 1996–2006
Figure 5Figure 5Figure 5Figure 5Figure 5 Education Disparity TEducation Disparity TEducation Disparity TEducation Disparity TEducation Disparity Trrrrrends in South Asia, 1996–2006ends in South Asia, 1996–2006ends in South Asia, 1996–2006ends in South Asia, 1996–2006ends in South Asia, 1996–2006

22
BEYOND GENDER:MEASURING DISPARITY IN SOUTH ASIA USING AN EDUCATION PARITY INDEX
The data gaps in Figure 5 bring to attention one limitation of the EPI. The netenrolment rate and other data published annually by UNESCO in the Global EducationDigest or the EFA Global Monitoring Report is not disaggregated beyond gender andcan therefore not be used to calculate the EPI. On the other hand, national householdsurvey data, which permits the required level of disaggregation, is not collected everyyear but only every four or five years, on average.11

23
BEYOND GENDER:MEASURING DISPARITY IN SOUTH ASIA USING AN EDUCATION PARITY INDEX
Analysis of disparity in national education systems is often limited to a small numberof indicators and to few dimensions of disparity, mainly gender. The Education ParityIndex introduced in this paper tries to overcome this limitation by combininginformation on disparities across different aspects of the education system, such asaccess and completion, and across different groups of disaggregation, such asgender, area of residence and household wealth.
The EPI offers several advantages. It meets the requirements of a good indicatorbecause it is policy-relevant, user friendly and technically sound, it can beinterpreted in the context of other variables, and it can be readily calculated fromhousehold survey data. In addition, the EPI is flexible and can be modified to includedimensions of disparity that are important in a national context, such as caste andethnicity. The EPI can also be expanded to cover different aspects of the educationsystem, such as literacy or access to pre-primary education.
The adaptability of the index means that EPI values for different countries do notnecessarily describe the same disparities. Because of its design, the EPI is simply anoverall measure of disparity. Nevertheless, the EPI is useful for comparisons acrosscountries as long as the indicators and groupings included in its calculation for aparticular country cover that country’s main disparities. If an important disparity isexcluded from the calculation – for example, if a country does not recognizedifferences due to caste – then the EPI cannot be fully comprehensive and becomesless meaningful as a measure of disparity.
CONCLUSION
5

24
BEYOND GENDER:MEASURING DISPARITY IN SOUTH ASIA USING AN EDUCATION PARITY INDEX
The EPI has other limitations. Because it relies on detailed household survey data,which is not collected on an annual basis, the EPI can only be used to track theevolution of disparities over longer time periods. In addition, the EPI only revealswhether disparity exists in a country; to identify the disadvantaged groups it isnecessary to study the underlying data. Knowledge of the data used to calculate theEPI is also necessary because the absolute level of participation in the educationsystem can be high or low in different countries, although their EPI values may besimilar. In spite of these limitations, the EPI is a useful tool that allows analysts and policymakers to assess and compare the level of disparity in different countries with asingle, easy to interpret indicator. For South Asia, the analysis reveals that disparitylinked to area of residence and household wealth is more important than disparitylinked to gender. The analysis also shows that overall disparity, as measured by theEPI, has decreased in all countries with trend data over the past decade, bringingthem closer to the goal of education for all.
25
BEYOND GENDER:MEASURING DISPARITY IN SOUTH ASIA USING AN EDUCATION PARITY INDEX
Filmer, D. and Pritchett, L.H. (2001). Estimating wealth effects without expendituredata, or Tears: An application to educational enrolments in states of India.Demography, 38 (1), February, pp.115–132.
International Institute for Population Sciences (IIPS) and Macro International(2007a). National Family Health Survey (NFHS-3) 2005–06, India: Volume I.Mumbai: IIPS.
International Institute for Population Sciences (IIPS) and Macro International(2007b). National Family Health Survey (NFHS-3) 2005–06, India: Volume II.Mumbai: IIPS.
Lewis, M. and Lockheed, M. (2007). Inexcusable Absence: Why 60 million girls stillaren’t in school and what to do about it. Washington: Center for Global Development.
Sherman, J.D. and Poirier, J.M. (2007). Educational Equity and Public Policy:Comparing results from 16 countries. Montreal: UNESCO Institute for Statistics (UIS).
UNESCO Institute for Statistics (UIS) (1999). World Education Indicators. Onlinedatabase, http://www.uis.unesco.org/en/stats/statistics/indicators/indic0.htm.Accessed March 2005.
UNESCO Institute for Statistics (UIS) (2003). Education Indicators: Technicalguidelines. Montreal: UIS.
UNESCO Institute for Statistics (UIS) (2007). Global Education Digest 2007:Comparing education statistics across the world. Montreal: UIS.
REFERENCES

26
BEYOND GENDER:MEASURING DISPARITY IN SOUTH ASIA USING AN EDUCATION PARITY INDEX
UNESCO Institute for Statistics (UIS) (2008). Data Centre. Online database, http://stats.uis.unesco.org/unesco/tableviewer/ document.aspx?ReportId=143. AccessedMay 2008.
United Nations Children’s Fund (UNICEF) (2007a). Progress for Children: A World Fitfor Children Statistical Review. New York: UNICEF.
United Nations Children’s Fund (UNICEF) (2007b). The State of the World’s Children2008: Child survival. New York: UNICEF.
United Nations Development Group (UNDG) (2003). Indicators for Monitoring theMillennium Development Goals: Definitions, rationale, concepts, and sources. NewYork: United Nations.
United Nations Development Programme (UNDP) (2007). Human Development Report2007/2008 – Fighting Climate Change: Human solidarity in a divided world. NewYork: UNDP.
United Nations Economic and Social Council (ECOSOC) (2007). Report of theSecretary-General on the Indicators for Monitoring the Millennium DevelopmentGoals. United Nations Statistical Commission, 39th session, 26–29 February 2008,Document E/CN.3/2008/29.
United Nations Educational, Scientific and Cultural Organization (UNESCO) (1998).Education for All: The year 2000 assessment – Technical guidelines. Paris: UNESCO.
United Nations Educational, Scientific and Cultural Organization (UNESCO) (1999).Gender-sensitive Education Statistics and Indicators: A practical guide. Paris:UNESCO.
United Nations Educational, Scientific and Cultural Organization (UNESCO) (2000).Education for All 2000 Assessment: A decade of education. Paris: UNESCO Institutefor Statistics. CD-ROM.
United Nations Educational, Scientific and Cultural Organization (UNESCO) (2007).Education for All by 2015: Will We Make It? – EFA Global Monitoring Report 2008.Paris: UNESCO.
Unterhalter, E. (2006). Measuring Gender Inequality in South Asia. Kathmandu:UNICEF ROSA Issues Papers Series.
World Bank and Department for International Development (DFID) (2006). UnequalCitizens: Gender, Caste and Ethnic Exclusion in Nepal – Summary. Kathmandu: WorldBank, DFID.
27
BEYOND GENDER:MEASURING DISPARITY IN SOUTH ASIA USING AN EDUCATION PARITY INDEX
1 The survival rate to the last grade of primary school has replaced the survival rate to Grade 5 that served as an officialindicator for monitoring progress toward MDG 2, Universal Primary Education, until 2007 (UNDG, 2003).
2 MICS data is available at www.childinfo.org, DHS data at www.measuredhs.com.3 Definitions for these and other education indicators are listed in Annex 1.4 The 1999 database by UIS only contains historical data up to 1997. The newer UIS database covers the years since
1999 and is continuously updated with the most recent statistics. The separate EFA database was discontinued byUNESCO after 1998.
5 The discussion in this section can also be applied to enrolment rates. However, much of the analysis in this paper isbased on household survey data and the concepts are therefore introduced with data on attendance, not enrolment.
6 For practical purposes, any GPI between 0.96 and 1.04 is usually considered gender parity.7 The regional data is drawn from UNICEF (2007a), which combines data on enrolment published by UNESCO and data on
attendance from household surveys.8 The data for seven of the eight countries is from UNICEF (2007a). The data for Bhutan is from the UNESCO Institute for
Statistics (2008).9 In DHS and MICS surveys, household wealth is measured with an asset index as an indicator of relative wealth, using a
methodology described by Filmer and Pritchett (2001). With the wealth index, all households are ranked from poorestto richest and then divided into quintiles of equal size.
10 Because of data limitations, this paper makes use of a proxy indicator for the survival rate to the last grade. The proxyindicator is the share of 15- to 17-year-old children that ever attended school, with at least n - 1 years of education,where n is the number of grades of primary school.
11 The first three rounds of MICS surveys by UNICEF were conducted five years apart – 1995, 2000 and 2005 – but thereare plans to move the MICS to a three-year cycle.
12 The definitions were adapted from UNESCO (2007) and UNESCO Institute for Statistics (2007).13 The datasets from the India DHS can be obtained at the MEASURE DHS website, www.measuredhs.com.
NOTES

28
BEYOND GENDER:MEASURING DISPARITY IN SOUTH ASIA USING AN EDUCATION PARITY INDEX
Indicator Definitions12
Adult literacy rate: Number of literate persons aged 15 years and above, expressed asa percentage of the total population in that age group.
Dropout rate by grade: Percentage of pupils who drop out from a given grade in agiven school year.
Gender parity index (GPI): Ratio of female to male values of a given indicator. A GPIof 1 indicates parity between sexes. A GPI above or below 1 indicates a disparity infavour of one sex over the other.
Gross enrolment rate (GER): Number of pupils enrolled in a given level of education,regardless of age, expressed as a percentage of the population in the theoretical agegroup for the same level of education.
Gross intake rate (GIR) in primary education: Total number of new entrants to the firstgrade of primary education, regardless of age, expressed as a percentage of thepopulation of theoretical entrance age to primary education.
Net attendance rate (NAR): The standard definition of the NAR is 'Number of pupils inthe official age group for a given level of education who attend school in that level,expressed as a percentage of the population in that age group' (UNESCO, 2007,p.350). UNICEF uses a modified definition of the NAR that also considers childrenwho are attending higher levels of education (UNICEF, 2007b, p.133). The modifiedprimary NAR is the percentage of children of primary school age that are attendingprimary or secondary school. The standard definition of the primary NAR excludes
ANNEX 1

29
BEYOND GENDER:MEASURING DISPARITY IN SOUTH ASIA USING AN EDUCATION PARITY INDEX
children in secondary school and may thus underestimate the actual level ofparticipation in the education system. The modified secondary NAR is the percentageof children of secondary school age that are attending secondary school or higher.
Net enrolment rate (NER): Number of pupils in the theoretical age group for a givenlevel of education enrolled in that level, expressed as a percentage of the totalpopulation in that age group.
Net intake rate (NIR): New entrants to the first grade of primary education who are ofthe official primary school entrance age, expressed as a percentage of the populationof that age.
New entrants to primary education with ECCE experience: Number of new entrants toprimary education who have attended some form of organized early childhood careand education (ECCE) programmes, expressed as a percentage of the total number ofnew entrants to primary education.
Percentage of trained teachers: Number of teachers who have received the minimumorganized teacher training (pre-service or in service) required for teaching at therelevant level of education in a country, expressed as a percentage of the totalnumber of teachers at the given level of education.
Pupil:teacher ratio: Average number of pupils per teacher at a specific level ofeducation, based on headcounts for both pupils and teachers.
Repetition rate by grade: Number of pupils who are enrolled in the same grade as theprevious year, expressed as a percentage of the total enrolment in the given grade ofeducation.
School life expectancy: Number of years a child of school entrance age is expectedto spend at school or university, including years spent on repetition. School lifeexpectancy can be calculated as the sum of the age-specific enrolment rates forprimary, secondary, post-secondary non-tertiary, and tertiary education.
Survival rate to grade n: Percentage of a cohort of pupils enrolled in the first grade ofa given level of education in a given school year who are expected to reach a givengrade (n). Survival rates are calculated on the basis of the reconstructed cohortmethod, which uses data on enrolment and repeaters for two consecutive years.
Transition rate to secondary education: Number of new entrants to the first grade ofsecondary education in a given year, expressed as a percentage of the number ofpupils enrolled in the final grade of primary education in the previous year.
Youth literacy rate: Number of literate persons aged 15 to 24 years, expressed as apercentage of the total population in that age group.

30
BEYOND GENDER:MEASURING DISPARITY IN SOUTH ASIA USING AN EDUCATION PARITY INDEX
ANNEX 2
Calculating the EPI – The Example of India
This example uses India to demonstrate the calculation of the Education Parity Index.The data is from a Demographic and Health Survey that was carried out in India in2005/06 (IIPS and Macro International, 2007a,b).13 With the DHS data, values forthe following indicators can be calculated:
� Primary school net attendance rate, disaggregated by gender, area of residenceand household wealth.
� Secondary school net attendance rate, disaggregated by gender, area of residenceand household wealth.
� Survival rate to the last grade of primary school, disaggregated by gender, area ofresidence and household wealth.
The indicator estimates from the India DHS are summarized in Table A1. (See alsoTable 1 in Chapter 4.)
TTTTTable A1 Education in India, 2005/06able A1 Education in India, 2005/06able A1 Education in India, 2005/06able A1 Education in India, 2005/06able A1 Education in India, 2005/06
MaleFemaleUrbanRuralPoorest quintileSecond quintileMiddle quintileFourth quintileRichest quintile
Primary NAR (%)
85.281.488.581.569.481.287.592.295.7
Secondary NAR (%)
58.548.764.249.129.142.652.165.582.6
Survival to last gradeof primary (%)*
95.794.997.494.287.292.895.598.099.4
India 2005/06
* Measured by a proxy indicator (see Chapter 4)

31
BEYOND GENDER:MEASURING DISPARITY IN SOUTH ASIA USING AN EDUCATION PARITY INDEX
The first step is to calculate the parity indices for each education indicator and foreach of the groups of disaggregation, using the data from Table A1. The parity indexfor the primary school NAR by gender is:
EPIPNAR gender =
=
=
= 0.96
The parity index for the primary school NAR by area of residence is:
EPIPNAR area =
=
=
= 0.92
The parity index for the primary school NAR by household wealth quintile is:
EPIPNAR wealth =
=
=
= 0.73
min (85.2%, 81.4%)max (85.2%, 81.4%)
81.4%85.2%
min (PNARurban, PNARrural)max (PNARurban, PNARrural)
min (88.5%, 81.5%)max (88.5%, 81.5%)
81.5%88.5%
min (69.4%, 81.2%, 87.5%, 92.2%, 95.7%)max (69.4%, 81.2%, 87.5%, 92.2%, 95.7%)
69.4%
95.7%
min (PNARmale, PNARfemale)max (PNARmale, PNARfemale)
min (PNARw1, PNARw2, PNARw3, PNARw4, PNARw5)max (PNARw1, PNARw2, PNARw3, PNARw4, PNARw5)

32
BEYOND GENDER:MEASURING DISPARITY IN SOUTH ASIA USING AN EDUCATION PARITY INDEX
A comparison of the three EPI values above shows that disparity in primary schoolattendance is greatest with regard to household wealth, with a value of 0.73. Withregard to gender, the value 0.96 shows that there is little difference in primary schoolattendance between boys and girls.
The overall parity index for the primary school net attendance rate, EPIprimary NAR, isthe mean value of the three parity indices for gender, area of residence andhousehold wealth:
EPIprimary NAR =
=
=
= 0.87
The value 0.87 means that, on average across the three dimensions of gender, area ofresidence and household wealth, the primary school net attendance rate of the mostdisadvantaged group is 13% below the group with the highest net attendance rate.
By repeating the calculation for the secondary school net attendance rate and thesurvival rate to the last grade of primary school, Table A2 can be generated. (See alsoTable 2 in Chapter 4.)
0.96 + 0.92 + 0.733
2.613
TTTTTable A2 Education Parity Index, India, 2005/06able A2 Education Parity Index, India, 2005/06able A2 Education Parity Index, India, 2005/06able A2 Education Parity Index, India, 2005/06able A2 Education Parity Index, India, 2005/06
India 2005/06
GenderArea of residenceHousehold wealthTotal
Primary NAR
0.960.920.730.87
Secondary NAR
0.830.770.350.65
Survival rate to lastgrade of primary*
0.990.970.880.95
Total
0.930.880.650.82
EPIPNAR gender + EPIPNAR area + EPIPNAR wealth
3
* Measured by a proxy indicator (see Chapter 4)

33
BEYOND GENDER:MEASURING DISPARITY IN SOUTH ASIA USING AN EDUCATION PARITY INDEX
��������
���
���"
���
���
���
���
���
���
"�+,�� ����� ����./,�+1� * -.�' �,�:���&' ; &���#�
���
��
���
!
The parity index for the secondary school net attendance rate is 0.65 and the parityindex for the survival rate to the last grade is 0.95. The biggest disparity across thethree indicators and across the three categories of disaggregation is observed forsecondary school attendance by household wealth. The value 0.35 means that thesecondary school NAR among children from the poorest wealth quintile is two-thirdslower than the secondary school NAR among children from the richest quintile. Thelast column in Table A2 lists disparity by gender, area of residence and householdwealth across the three education variables under investigation.
The value 0.82 in the lower right corner of Table A2 is the overall Education ParityIndex. The table shows that the EPI can be calculated in two ways: (a) as the averageof the three parity indices for primary NAR, secondary NAR and the survival rate tothe last grade of primary school; and (b) as the average of the respective indices forgender, area of residence and household wealth. The value 0.82 means that theprimary NAR, secondary NAR and the survival rate are – across the dimensions ofgender, area of residence and wealth – on average 18% lower for the mostdisadvantaged groups compared with the groups with the highest values.
The Education Parity Index can also be presented in graphical format, as shown inFigure A1. Here, the total EPI is displayed as the average of the parity indices forgender, area of residence and household wealth.
Figure A1 Education Disparity in India, 2005/06Figure A1 Education Disparity in India, 2005/06Figure A1 Education Disparity in India, 2005/06Figure A1 Education Disparity in India, 2005/06Figure A1 Education Disparity in India, 2005/06
34
BEYOND GENDER:MEASURING DISPARITY IN SOUTH ASIA USING AN EDUCATION PARITY INDEX
ANNEX 3
Calculation of the Generalized Education Parity Index
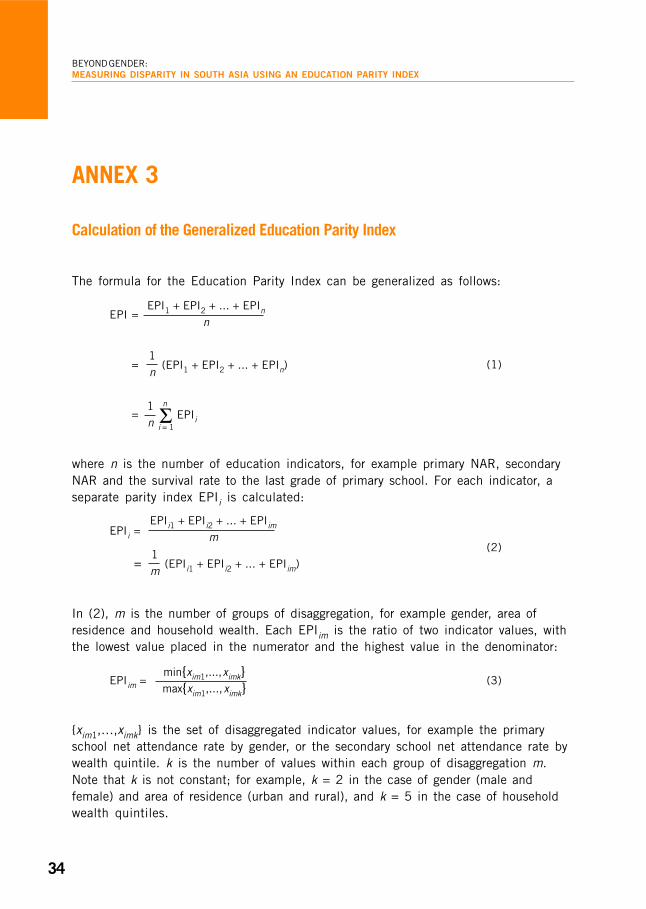
The formula for the Education Parity Index can be generalized as follows:
EPI =
= (1)
=
where n is the number of education indicators, for example primary NAR, secondaryNAR and the survival rate to the last grade of primary school. For each indicator, aseparate parity index EPIi is calculated:
EPIi =(2)
=
In (2), m is the number of groups of disaggregation, for example gender, area ofresidence and household wealth. Each EPIim is the ratio of two indicator values, withthe lowest value placed in the numerator and the highest value in the denominator:
EPIim = (3)
{xim1,…,ximk} is the set of disaggregated indicator values, for example the primaryschool net attendance rate by gender, or the secondary school net attendance rate bywealth quintile. k is the number of values within each group of disaggregation m.Note that k is not constant; for example, k = 2 in the case of gender (male andfemale) and area of residence (urban and rural), and k = 5 in the case of householdwealth quintiles.
1n
EPIiΣn
i = 1
(EPI1 + EPI2 + ... + EPIn)1n
EPI1 + EPI2 + ... + EPIn
n
EPIi1 + EPIi2 + ... + EPIim
m
1m
(EPIi1 + EPIi2 + ... + EPIim)
min{xim1,..., ximk}max{xim1,..., ximk}
35
BEYOND GENDER:MEASURING DISPARITY IN SOUTH ASIA USING AN EDUCATION PARITY INDEX
min{xi11,..., xi1k}max{xi11,..., xi1k}
min{xi21,..., xi2k}max{xi21,..., xi2k}
1m
min{xim1,..., ximk}max{xim1,..., ximk}
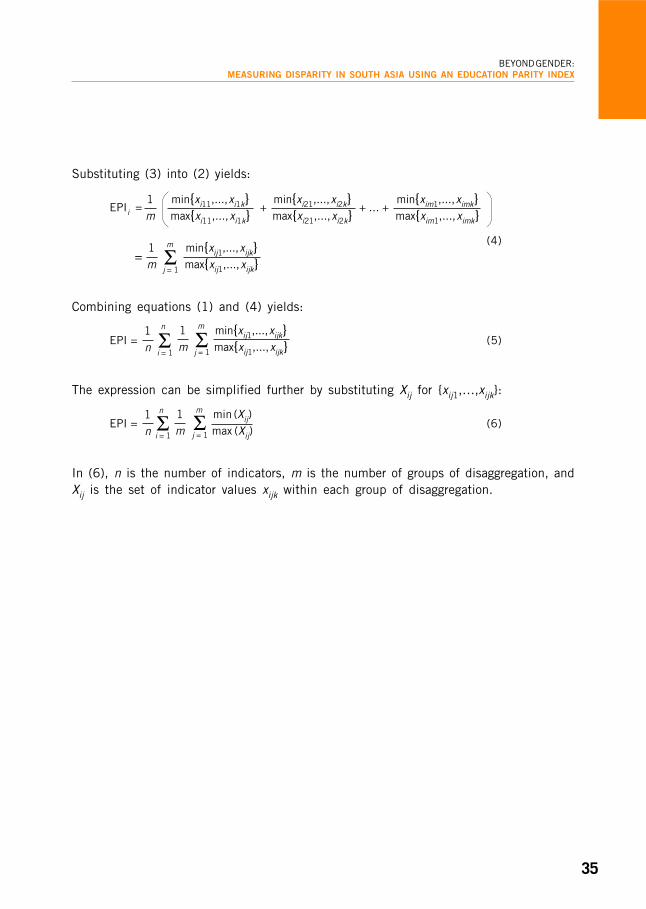
Substituting (3) into (2) yields:
EPIi = + + ... +
(4)=
Combining equations (1) and (4) yields:
EPI = (5)
The expression can be simplified further by substituting Xij for {xij1,…,xijk}:
EPI = (6)
In (6), n is the number of indicators, m is the number of groups of disaggregation, andXij is the set of indicator values xijk within each group of disaggregation.
1m Σ
m
j = 1
min{xij1,..., xijk}max{xij1,..., xijk}
1n Σ
n
i = 1
1m Σ
m
j = 1
min{xij1,..., xijk}max{xij1,..., xijk}
1n Σ
n
i = 1
1m Σ
m
j = 1
min (Xij)max (Xij)

36
BEYOND GENDER:MEASURING DISPARITY IN SOUTH ASIA USING AN EDUCATION PARITY INDEX
Friedrich Huebler is a Statistics and Monitoring Officer in the Division of Policy andPractice of UNICEF in New York. He specializes in the analysis of household surveydata, with an emphasis on education, child labour and the MillenniumDevelopment Goals. Friedrich holds an MA in Business Studies and Economicsfrom the University of Bremen and a PhD in Economics from the New School forSocial Research in New York.
ABOUT THE AUTHOR

.

Published by
United Nations Children’s FundRegional Office for South AsiaP. O. Box 5815Lekhnath MargKathmandu, Nepal
Telephone: 977-1-4417082Facsmile: 977-1-4418466 / 4419479www.unicef.org