ge-02-504 seismic considerations for road tunnels seismic... · and-cover tunnels, mined and bored...
TRANSCRIPT

PDH-Pro.com
396 Washington Street, Suite 159, Wellesley, MA 02481 Telephone – (508) 298-4787 www.PDH-Pro.com
This document is the course text. You may review this material at your leisure before or after you purchase the course. In order to obtain credit for this course, complete the following steps: 1) Log in to My Account and purchase the course. If you don’t have an account, go to New User to create an account. 2) After the course has been purchased, complete the quiz at your convenience. 3) A Certificate of Completion is available once you pass the exam (70% or greater). If a passing grade is not obtained, you may take the quiz as many times as necessary until a passing grade is obtained (up to one year from the purchase date). If you have any questions or technical difficulties, please call (508) 298-4787 or email us at [email protected].
Seismic Considerations for Road Tunnels
Course Number: GE-02-504
PDH: 4
Approved for: AK, AL, AR, GA, IA, IL, IN, KS, KY, MD, ME, MI, MN, MO, MS, MT, NC, ND, NE, NH, NJ, NM, NV, OH, OK, OR, PA, SC, SD, TN, TX, UT, VA, WI, WV, and WY
New Jersey Professional Competency Approval #24GP00025600 North Carolina Approved Sponsor #S-0695
U.S. Department of Transportation Publication No. FHWA-NHI-10-034 Federal Highway Administration December 2009
Technical Manual for Design and Construction of Road Tunnels — Civil Elements

NOTICE
The contents of this report reflect the views of the authors, who are responsible for the facts and the accuracy of the data presented herein. The contents do not
necessarily reflect policy of the Department of Transportation. This report does not constitute a standard, specification, or regulation. The United States Government
does not endorse products or manufacturers. Trade or manufacturer's names appear herein only because they are considered essential to the objective of this
document.

Technical Report Documentation Page 1. Report No.
FHWA-NHI-10-034
2. Government Accession No. 3. Recipient’s Catalog No.
4. Title and Subtitle
TECHNICAL MANUAL FOR
DESIGN AND CONSTRUCTION OF ROAD TUNNELS – CIVIL ELEMENTS
5. Report Date
December 2009 6. Performing Organization Code
7. Author(s)
Principal Investigators: C. Jeremy Hung, PE, James Monsees, PhD, PE, Nasri Munfah, PE, and John Wisniewski, PE
8. Performing Organization Report No.
9. Performing Organization Name and Address
Parsons Brinckerhoff, Inc. One Penn Plaza, New York, NY 10119
10. Work Unit No. (TRAIS)
11. Contract or Grant No.
DTFH61-06-T-07-001
12. Sponsoring Agency Name and Address
National Highway Institute U.S. Department of Transportation Federal Highway Administration, Washington, D.C. 20590
13. Type of Report and Period Covered
14. Sponsoring Agency Code
15. Supplementary Notes
FHWA COTR – Louisa Ward/ Larry Jones FHWA Task Manager – Firas I. Sheikh Ibrahim, PhD, PE FHWA Technical Reviewers – Jesús M. Rohena y Correa, PE; Jerry A. DiMaggio, PE; Steven Ernst,
PE; and Peter Osborn, PE. See Acknowledgement for List of Authors and Additional Technical Reviewers 16. Abstract
The increased use of underground space for transportation systems and the increasing complexity and constraints of constructing and maintaining above ground transportation infrastructure have prompted the need to develop this technical manual. This FHWA manual is intended to be a single-source technical manual providing guidelines for planning, design, construction and rehabilitation of road tunnels, and encompasses various types of road tunnels including mined, bored, cut-and-cover, immersed, and jacked box tunnels. The scope of the manual is primarily limited to the civil elements of road tunnels.
The development of this technical manual has been funded by the National Highway Institute, and supported by Parsons Brinckerhoff, as well as numerous authors and reviewers.
17. Key Words
Road tunnel, highway tunnel, geotechnical investigation, geotechnical baseline report, cut-and-cover tunnel, drill-and-blast, mined tunnel, bored tunnel, rock tunneling, soft ground tunneling, sequential excavation method (SEM), immersed tunnel, jacked box tunnel, seismic consideration, instrumentation, risk management, rehabilitation.
18. Distribution Statement
No restrictions.
19. Security Classif. (of this report)
UNCLASSIFIED
20. Security Classif. (of this page)
UNCLASSIFIED
21. No. of Pages
702
22. Price
Form DOT F 1700.7(8-72) Reproduction of completed page authorized

CONVERSION FACTORS
Approximate Conversions to SI Units Approximate Conversions from SI Units
When you know Multiply by To find When you know Multiply by To find
(a) Length inch 25.4 millimeter millimeter 0.039 inch foot 0.305 meter meter 3.28 foot
yard mile
0.914 1.61
meter kilometer
meter kilometer
1.09 0.621
yardmile
(b) Area square inches
square feet acres
645.2 0.093 0.405
square millimeters square meters
hectares
square millimeters square meters
hectares
0.0016 10.764
2.47
square inches square feet
acres square miles 2.59 square kilometers square kilometers 0.386 square miles
(c) Volume fluid ounces 29.57 milliliters milliliters 0.034 fluid ounces
gallons cubic feet
3.785 0.028
liters cubic meters
liters cubic meters
0.264 35.32
gallonscubic feet
cubic yards 0.765 cubic meters cubic meters 1.308 cubic yards
(d) Mass
ounces pounds
short tons (2000 lb)
28.35 0.454 0.907
grams kilograms
megagrams (tonne)
grams kilograms
megagrams (tonne)
0.035 2.205 1.102
ounces pounds
short tons (2000 lb)
(e) Force pound 4.448 Newton Newton 0.2248 pound
(f) Pressure, Stress, Modulus of Elasticity pounds per square foot pounds per square inch
47.88 6.895
Pascals kiloPascals
Pascals kiloPascals
0.021 0.145
pounds per square foot pounds per square inch
(g) Density
pounds per cubic foot 16.019 kilograms per cubic meter kilograms per cubic meter 0.0624 pounds per cubic feet
(h) Temperature Fahrenheit temperature(oF) 5/9(oF- 32) Celsius temperature(oC) Celsius temperature(oC) 9/5(oC)+ 32 Fahrenheit temperature(oF) Notes: 1) The primary metric (SI) units used in civil engineering are meter (m), kilogram (kg), second(s), newton (N) and pascal (Pa=N/m2). 2) In a "soft" conversion, an English measurement is mathematically converted to its exact metric equivalent. 3) In a "hard" conversion, a new rounded metric number is created that is convenient to work with and remember.

FOREWORD The FHWA Technical Manual for Design and Construction of Road Tunnels – Civil Elements has been published to provide guidelines and recommendations for planning, design, construction and structural rehabilitation and repair of the civil elements of road tunnels, including cut-and-cover tunnels, mined and bored tunnels, immersed tunnels and jacked box tunnels. The latest edition of the AASHTO LRFD Bridge Design and Construction Specifications are used to the greatest extent applicable in the design examples. This manual focuses primarily on the civil elements of design and construction of road tunnels. It is the intent of FHWA to collaborate with AASHTO to further develop manuals for the design and construction of other key tunnel elements, such as, ventilation, lighting, fire life safety, mechanical, electrical and control systems. FHWA intends to work with road tunnel owners in developing a manual on the maintenance, operation and inspection of road tunnels. This manual is expected to expand on the two currently available FHWA publications: (1) Highway and Rail Transit Tunnel Inspection Manual and (2) Highway and Rail Transit Tunnel Maintenance and Rehabilitation Manual.
M. Myint Lwin, Director Office of Bridge Technology

CHAPTER 13 SEISMIC CONSIDERATIONS
CHAPTER 13 13.1 INTRODUCTION Tunnels, in general, have performed better during earthquakes than have above ground structures such as bridges and buildings. Tunnel structures are constrained by the surrounding ground and, in general, can not be excited independent of the ground or be subject to strong vibratory amplification, such as the inertial response of a bridge structure during earthquakes. Another factor contributing to the reduced tunnel damage is that the amplitude of seismic ground motion tends to reduce with depth below the ground surface. Adequate design and construction of seismic resistant tunnel structures, however, should never be overlooked, as moderate to major damage has been experienced by many tunnels during earthquakes, as summarized by Dowding and Rozen (1978), Owen and Scholl (1981), Sharma and Judd (1991), and Power et al. (1998), among others. The greatest incidence of severe damage has been associated with large ground displacements due to ground failure, i.e., fault rupture through a tunnel, landsliding (especially at tunnel portals), and soil liquefaction. Ground shaking in the absence of ground failure has produced a lower incidence and degree of damage in general, but has resulted in moderate to major damage to some tunnels in recent earthquakes. The most recent reminder of seismic risk to underground structures under the ground shaking effect is the damage and near collapse at the Daikai and Nagata subway stations (Kobe Rapid Transit Railway) during the 1995 Kobe Earthquake in Japan. Near-surface rectangular cut-and-cover tunnels and immersed tube tunnels in soil have also been vulnerable to transient seismic lateral ground displacements, which tend to cause racking of a tunnel over its height and increased lateral pressures on the tunnel walls. Their seismic performance could be vital, particularly when they comprise important components of a critical transportation system (e.g., a transit system) to which little redundancy exists. The general procedure for seismic design and analysis of tunnel structures should be based primarily on the ground deformation approach (as opposed to the inertial force approach); i.e., the structures should be designed to accommodate the deformations imposed by the ground. The analysis of the structure response can be conducted first by ignoring the stiffness of the structure, leading to a conservative estimate of the ground deformations. This simplified procedure is generally applicable for structures embedded in rock or very stiff/dense soil. In cases where the structure is stiff relative to the surrounding soil, the effect of soil-structure interaction must be taken into consideration. Other critical conditions that warrant special seismic considerations include cases where a tunnel intersects or meets another tunnel (e.g., tunnel junction or tunnel/cross-passage interface) or a different structure (such as a ventilation building). Under these special conditions, the tunnel structure may be restrained from moving at the junction point due to the stiffness of the adjoining structure, thereby inducing stress concentrations at the critical section. Complex numerical methods are generally required for cases such as these where the complex nature of the seismic soil-structure interaction system exists.
13.2 DETERMINATION OF SEISMIC ENVIRONMENT 13.2.1 Earthquake Fundamental General: Earthquakes are produced by abrupt relative movements on fractures or fracture zones in the earth's crust. These fractures or fracture zones are termed earthquake faults. The mechanism of fault movement is elastic rebound from the sudden release of built-up strain energy in the crust. The built-up strain energy accumulates in the earth's crust through the relative movement of large, essentially intact
FHWA-NHI-09-010 13-Seismic Considerations
13-1 Road Tunnel Manual March 2009

pieces of the earth's crust called tectonic plates. This relief of strain energy, commonly called fault rupture, takes place along the rupture zone. When fault rupture occurs, the strained rock rebounds elastically. This rebound produces vibrations that pass through the earth crust and along the earth's surface, generating the ground motions that are the source of most damage attributable to earthquakes. If the fault along which the rupture occurs propagates upward to the ground surface and the surface is uncovered by sediments, the relative movement may manifest itself as surface rupture. Surface ruptures are also a source of earthquake damage to constructed facilities including tunnels.
The major tectonic plates of the earth's crust are shown in Figure 13-1 (modified from Park, 1983). There are also numerous smaller, minor plates not shown on this figure. Earthquakes also occur in the interior of the plates, although with a much lower frequency than at plate boundaries.
Figure 13-1 Major Tectonic Plates and Their Approximate Direction of Movement. (Source: www.maps.com)
For the continental United States, the principal tectonic plate boundary is along the western coast of the continent, where the North American Plate and the Pacific Plate are in contact. In California, the boundary between these plates is a transform fault wherein the relative movement is generally one of lateral slippage of one plate past the other. Elsewhere along the west coast (e.g., off the coast of Oregon, Washington, and Alaska), the plate boundary is a subduction zone wherein one plate dives (subducts) beneath the other plate. In the western interior of the United States, adjacent to the western edge of the American Plate, there may be subplates that have formed as a result of subcrustal flow. Earthquake sources in Utah and Montana may be attributable to such subplate sources. Earthquake source areas in the central and eastern United States and along the Saint Lawrence Valley are within the American Plate and are considered to be intraplate source zones. The mechanisms generating earthquakes in these intraplate zones are poorly understood, but may be related to relief of locked-in stresses from ancient tectonic movements, crustal rebound from the ice ages, re-adjustment of stress in the interior of the plate due to boundary loads, sediment load such as the Mississippi River basin, or other unrecognized
FHWA-NHI-09-010 13-Seismic Considerations
13-2 Road Tunnel Manual March 2009

mechanisms. Earthquakes in Hawaii are believed to be associated with an isolated plume of molten rock from the mantle referred to as a hot spot.
The intensity and impact of earthquakes may be as great or greater in the plate interiors as they are at the active plate boundaries. The differences between plate boundary and intraplate earthquakes is in their geographic spread and the frequency of occurrence. Earthquake activity is much greater along the plate boundaries than in the plate interior. However, ground motions from intraplate earthquakes tend to attenuate, or dissipate, much more slowly than those from plate boundary events. Plate boundary faults are relatively longer than those in the plate interior and tend to be associated with a smaller stress drop (the stress drop is the sudden reduction of stress across the fault plane during rupture), longer duration of shaking, and a more frequent rate of earthquake occurrence.
Fault Movements: Faults are created when the stresses within geologic materials exceed the ability of those materials to withstand the stresses. Most faults that exist today are the result of tectonic activity that occurred in earlier geological times. These faults are usually non-seismogenic (i.e. incapable of generating earthquakes, or inactive). However, faults related to past tectonism may be reactivated by present-day tectonism in seismically active areas and can also be activated by anthropogenic (man-made) activities such as impoundment of a reservoir by a dam or injection of fluids (e.g. waste liquids) deep into the subsurface. The maximum size of an earthquake on an anthropogenically reactivated fault is a subject of some controversy, but earthquakes as large as moment magnitude 6.5 have been attributed to reservoir impoundment.
Not all faults along which relative movement is occurring are a source of earthquakes. Some faults may be surfaces along which relative movement is occurring at a slow, relatively continuous rate, with an insufficient stress drop to cause an earthquake. Such movement is called fault creep. Fault creep may occur along a shallow fault, where the low overburden stress on the fault results in a relatively low threshold stress for initiating displacement along the fault. Alternatively, a creeping fault may be at depth in soft and/or ductile materials that deform plastically. Also, there may be a lack of frictional resistance or asperities (non-uniformities) along the fault plane, allowing steady creep and the associated release of the strain energy along the fault. Fault creep may also prevail where phenomena such as magma intrusion or growing salt domes activate small shallow faults in soft sediments. Faults generated by extraction of fluids (e.g., oil or water in southern California), which causes ground settlement and thus activates faults near the surface may also result in fault creep. Faults activated by other non-tectonic mechanisms, e.g. faults generated by gravity slides that take place in thick, unconsolidated sediments, could also produce fault creep.
Active faults that extend into crystalline bedrock are generally capable of building up the strain energy needed to produce, upon rupture, earthquakes strong enough to affect transportation facilities. Fault ruptures may propagate from the crystalline bedrock to the ground surface and produce ground rupture. Fault ruptures which propagate to the surface in a relatively narrow zone of deformation that can be traced back to the causative fault in crystalline rock are sometimes referred to as primary fault ruptures. Fault ruptures may also propagate to the surface in diffuse, distributed zones of deformation which cannot be traced directly back to the basement rock. In this case, the surface deformation may be referred to as secondary fault rupture.
Whether or not a fault has the potential to produce earthquakes is usually judged by the recency of previous fault movements. If a fault has propagated to the ground surface, evidence of faulting is usually found in geomorphic features associated with fault rupture (e.g., relative displacement of geologically young sediments). For faults that do not propagate to the ground surface, geomorphic evidence of previous earthquakes may be more subdued and more difficult to evaluate (e.g., near surface folding in sediments or evidence of liquefaction or slumping generated by the earthquakes). If a fault has undergone
FHWA-NHI-09-010 13-Seismic Considerations 13-3 Road Tunnel Manual March 2009

relative displacement in relatively recent geologic time (within the time frame of the current tectonic setting), it is reasonable to assume that this fault has the potential to move again. If the fault moved in the distant geologic past, during the time of a different tectonic stress regime, and if the fault has not moved in recent (Holocene) time (generally the past 11,000 years), it may be considered inactive. For some very important and critical facilities, such as those whose design is governed by the US Nuclear Regulatory Commission (NRC), a timeframe much longer than the 11,000-yr criterion has been used. In accordance with the US NRC regulations a fault is defined as “capable” (as opposed to “active”) if it has shown activity within the past 35,000 years or longer. Geomorphic evidence of fault movement cannot always be dated. In practice, if a fault displaces the base of unconsolidated alluvium, glacial deposits, or surficial soils, then the fault is likely to be active. Also, if there is micro-seismic activity associated with the fault, the fault may be judged as active and capable of generating earthquakes. Microearthquakes occurring within basement rocks at depths of 7 to 20 km may be indicative of the potential for large earthquakes. Microearthquakes occurring at depths of 1 to 3 km are not necessarily indicative of the potential for large, damaging earthquake events. In the absence of geomorphic, tectonic, or historical evidence of large damaging earthquakes, shallow microtremors may simply indicate a potential for small or moderate seismic events. Shallow microearthquakes of magnitude 3 or less may also sometimes be associated with mining or other non-seismogenic mechanisms. If there is no geomorphic evidence of recent seismic activity and there is no microseismic activity in the area, then the fault may be inactive and not capable of generating earthquakes. In some instances, fault rupture may be confined to the subsurface with no relative displacement at the ground surface due to the fault movement. Subsurface faulting without primary fault rupture at the ground surface is characteristic of almost all but the largest magnitude earthquakes in the central and eastern United States. Due to the rarity of large magnitude intraplate events, geological processes may erase surface manifestations of major earthquakes in these areas. Therefore, intraplate seismic source zones often must be evaluated using instrumental seismicity and paleoseismicity studies. This is particularly true if the intraplate sources are covered by a thick mantle of sediments, as in the New Madrid, Tennessee, and Charleston, South Carolina, intraplate seismic zones. Instrumental recording of small magnitude events can be particularly effective in defining seismic source zones. Essentially all of the active faults with surface fault traces in the United States are shallow crustal faults west of the Rocky Mountains. However, not all shallow crustal faults west of the Rocky Mountains have surface fault traces. Several recent significant earthquakes along the Pacific Coast plate boundary (e.g., the 1987 Whittier Narrows earthquake and the 1994 Northridge earthquake) were due to rupture of thrust (compressional) faults that did not break the ground surface, termed blind thrust faults. A long fault, like the San Andreas Fault in California or the Wasatch Fault in Utah, typically will not move along its entire length at any one time. Such faults typically move in portions, one segment at a time. An immobile (or "locked") segment, a segment which has remained stationary while the adjacent segments of the fault have moved, is a strong candidate for the next episode of movement. Type of Faults: Faults may be broadly classified according to their mode, or style of relative movement. The principal modes of relative displacement are illustrated in Figure 13-2 and are described subsequently.
FHWA-NHI-09-010 13-Seismic Considerations
13-4 Road Tunnel Manual March 2009

Figure 13-2 Types of Fault Movement
Strike Slip Faults: Faults along which relative movement is essentially horizontal (i.e., the opposite sides of the fault slide past each other laterally), are called strike slip faults. Strike slip faults are often essentially linear (or planar) features. Strike slip faults that are not fairly linear may produce complex surface features. The San Andreas fault is a strike slip fault that is essentially a north-south linear feature over most of its length. Strike slip faults may sometimes be aligned in en-echelon fashion wherein individual sub-parallel segments are aligned along a linear trend. En-echelon strike slip faulting is sometimes accompanied by step over zones where fault displacement is transferred from adjacent strike slip faults. Ground rupture patterns within these zones may be particularly complex. Dip Slip Faults: Faults in which the deformation is perpendicular to the fault plane may occur due to either normal (extensional) or reverse (compressional) motion. These faults are referred to as dip slip faults. Reverse faults are also referred to as thrust faults. Dip slip faults may produce multiple fractures within rather wide and irregular fault zones. Other Special Cases: Faults that show both strike slip and dip slip displacement may be referred to as oblique slip faults. Earthquake Magnitude: Earthquake magnitude, M, is a measure of the energy released by an earthquake. A variety of different earthquake magnitude scales exist. The differences among these scales is attributable to the earthquake characteristic used to quantify the energy content. Characteristics used to quantify earthquake energy content include the local intensity of ground motions, the body waves generated by the earthquake, and the surface waves generated by the earthquake. In the eastern United States, earthquake magnitude is commonly measured as a (short period) body wave magnitude, mb. However, the (long period) body wave magnitude, mBB , scale is also sometimes used in the central and
FHWA-NHI-09-010 13-Seismic Considerations
13-5 Road Tunnel Manual March 2009

eastern United States. In California, earthquake magnitude is often measured as a local (Richter) magnitude, ML, or surface wave magnitude, Ms. The Japan Meteorological Agency Magnitude (MJMA) scale is commonly used in Japan.
Due to limitations in the ability of some recording instruments to measure values above a certain amplitude, some of these magnitude scales tend to reach an asymptotic upper limit. To correct this, the moment magnitude, Mw, scale was developed by seismologists (Hanks and Kanamori, 1979). The moment magnitude of an earthquake is a measure of the kinetic energy released by the earthquake. Mw is proportional to the seismic moment, defined as a product of the material rigidity, fault rupture area, and the average dislocation of the rupture surface. Moment magnitude has been proposed as a unifying, consistent magnitude measure of earthquake energy content. Figure 13-3 (Heaton, et al., 1986) provides a comparison of the various other magnitude scales with the moment magnitude scale.
Hypocenter and Epicenter and Site-to-Source Distance: The hypocenter (focus) of an earthquake is the point from which the seismic waves first emanate. Conceptually, it may be considered as the point on a fault plane where the slip responsible for an earthquake was initiated. The epicenter is a point on the ground surface directly above the hypocenter. Figure 13-4 shows the relationship between the hypocenter, epicenter, fault plane, and rupture zone of an earthquake. Figure 13-4 also shows the definition of the strike and dip angles of the fault plane.
The horizontal distance between the site of interest to the epicenter is termed epicentral distance, RE, and is commonly used in the eastern United States. The distance between the site and the hypocenter (more widely used in the western United States) is termed hypocentral distance, RH.
Figure 13-3 Comparison of Earthquake Magnitude Scales (Heaton, et al., 1986)
FHWA-NHI-09-010 13-Seismic Considerations 13-6 Road Tunnel Manual March 2009

Figure 13-4 Definition of Basic Fault Geometry Including Hypocenter and Epicenter
13.2.2 Ground Motion Hazard Analysis For the seismic design of underground tunnel facilities, one of the main tasks is to define the design earthquake(s) and the corresponding ground motion levels and other associated seismic hazards. The process by which design ground motion parameters are established for a seismic analysis is termed the seismic hazard analysis. Seismic hazard analyses generally involve the following steps: • Identification of the seismic sources capable of strong ground motions at the project site • Evaluation of the seismic potential for each capable source • Evaluation of the intensity of the design ground motions at the project site Identification of seismic sources includes establishing the type of fault and its geographic location, depth, size, and orientation. Seismic source identification may also include specification of a random seismic source to accommodate earthquakes not associated with any known fault. Evaluation of the seismic potential of an identified source involves evaluation of the earthquake magnitude (or range of magnitudes) that the source can generate and, often times, the expected rate of occurrence of events of these magnitudes. Identification of capable seismic sources together with evaluation of the seismic potential of each capable source may be referred to as seismic source characterization. Once the seismic sources are characterized, the intensity of ground motions at the project site from these sources must be characterized. There are three general ways by which the intensity of ground motions at a project site is assessed in practice. They are, in order of complexity: (1) use of existing hazard analysis results published by credible agencies such as US Geological Survey (USGS) and some State agencies; (2) project-specific and site-specific deterministic seismic hazard evaluation; and (3) project-specific and site-specific probabilistic seismic
FHWA-NHI-09-010 13-Seismic Considerations
13-7 Road Tunnel Manual March 2009

hazard evaluation. Which particular approach is adopted may depend on the importance and complexity of the project and may be dictated by regulatory agencies. The choice of the design ground motion level, whether based upon probabilistic or deterministic analysis, cannot be considered separately from the level of performance specified for the design event. Sometimes, facilities may be designed for multiple performance levels, with a different ground motion level assigned to each performance level, a practice referred to as performance based design. Common performance levels used in design of transportation facilities include protection of life safety and maintenance of function after the event. A safety level design earthquake criterion is routinely employed in seismic design. Keeping a facility functional after a large earthquake adds another requirement to that of simply maintaining life safety, and is typically required for critical facilities. The collapse of a modern transportation tunnel (particularly for mass transit purpose) during or after a major seismic event could have catastrophic effects as well as profound social and economical impacts. It is typical therefore for modern and critical transportation tunnels to be designed to withstand seismic ground motions with a return period of 2,500 years, (corresponding to 2 % probability of exceedance in 50 years, or 3% probability of exceedance in 75 years). In addition, to avoid lengthy down time and to minimize costly repairs, a modern and critical transportation tunnel is often required to withstand a more frequent earthquake (i.e., a lower level earthquake) with minimal damage. The tunnel should be capable of being put immediately back in service after inspection following this lower level design earthquake. In the high seismic areas, this lower level earthquake is generally defined to have a 50% probability of probability of exceedance 75 years, corresponding to a 108-year return period. In the eastern United States, where earthquake occurrence is much less frequent, the lower level design earthquake for modern and critical transportation tunnels is generally defined at a higher return period such as 500 years. Use Of Existing Hazard Analysis Results: Information used for seismic source characterization can often be obtained from publications of the United States Geological Survey (USGS), or various state agencies. These published results are often used because they provide credibility for the designer and may give the engineer a feeling of security. However, if there is significant lag time between development and publication, the published hazard results may not incorporate recent developments on local or regional seismicity. Furthermore, there are situations where published hazard results may be inadequate and require site-specific seismic hazard evaluation. These situations may include: (1) the design earthquake levels (e.g., in terms of return period) are different than those assumed in the published results, (2) for sites located within 6 miles of an active surface or shallow fault where near-field effect is considered important, and (3) the published hazard results fail to incorporate recent major developments on local or regional seismicity. Seismic hazard maps that include spectral acceleration values at various spectral periods have been developed by USGS under the National Earthquake Hazard Reduction Program (NEHRP). Map values for peak and spectral accelerations with a probability of being exceeded of 2 percent, 5 percent, and 10 percent in 50 years (corresponding approximately to 2,500-yr, 1,000-yr, and 500-yr return period, respectively) can be recovered in tabular form. Figure 13-5 below shows an example of the national ground motion hazard maps in terms of peak ground acceleration (in Site Class B – Soft Rock Site) for an event of 2% probability of exceedance in 50 Years (i.e., 2,500-yr Return Period). In addition, USGS also provides information (e.g., the de-aggregated hazard) that can be used to estimate the representative “magnitude and distance” for a site in the continental United States.
FHWA-NHI-09-010 13-Seismic Considerations
13-8 Road Tunnel Manual March 2009

Figure 13-5 National Ground Motion Hazard Map by USGS (2002) - Peak Ground Acceleration with
2% Probability of Exceedance in 50 Years (2,500-yr Return Period) - for Site Class B, Soft Rock
The Deterministic Hazard Analysis Approach: In a deterministic seismic hazard analysis, the seismologist performing the analysis first identifies the capable seismic sources and assigns a maximum magnitude to each source. Then, the intensity of shaking at the site from each capable source is calculated and the design earthquake is identified based on the source capable of causing the greatest damage. The steps in a deterministic seismic hazard analysis are as follows:
1. Establish the location and characteristics (e.g., style of faulting) of all potential earthquake sources that might affect the site. For each source, assign a representative earthquake magnitude.
2. Select an appropriate attenuation relationship and estimate the ground motion parameters at the site from each capable fault as a function of earthquake magnitude, fault mechanism, site-tosource distance, and site conditions. Attenuation relationships discriminate between different styles of faulting and between rock and soil sites.
3. Screen the capable (active) faults on the basis of magnitude and the intensity of the ground motions at the site to determine the governing source.
The deterministic analysis approach provides a framework for the evaluation of worst-case scenarios at a site. It provides little information about the likelihood or frequency of occurrence of the governing earthquake. If such information is required, a probabilistic analysis approach should be used to better define the seismic ground motion hazard. The Probabilistic Hazard Analysis Approach: A probabilistic seismic hazard analysis incorporates the likelihood of a fault rupturing and the distribution of earthquake magnitudes associated with fault rupture into the assessment of the intensity of the design ground motion at a site. The objective of a probabilistic seismic hazard analysis is to compute, for a given exposure time, the probability of exceedance FHWA-NHI-09-010 13-Seismic Considerations
13-9 Road Tunnel Manual March 2009

corresponding to various levels of a ground motion parameter (e.g., the probability of exceeding a peak ground acceleration of 0.2 g in a 100-year period). The ground motion parameter may be either a peak value (e.g., peak ground acceleration) or a response spectra ordinate associated with the strong ground motion at the site. The probabilistic value of the design parameter incorporates both the uncertainty of the attenuation of strong ground motions and the randomness of earthquake occurrences. A probabilistic seismic hazard analysis usually includes the following steps, as illustrated in Figure 13-6: 1. Identify the seismic sources capable of generating strong ground motion at the project site. In areas
where no active faults can be readily identified it may be necessary to rely on a purely statistical analysis of historical earthquakes in the region.
2. Determine the minimum and maximum magnitude of earthquake associated with each source and assign a frequency distribution of earthquake occurrence to the established range of magnitudes. The Gutenberg-Richter magnitude-recurrence relationship (Gutenberg and Richter, 1942) is the relationship used most commonly to describe the frequency distribution of earthquake occurrence. While the maximum magnitude is a physical parameter related to the fault dimensions, the minimum magnitude may be related to both the physical properties of the fault and the constraints of the numerical analysis.
3. For each source, assign an attenuation relationship on the basis of the style of faulting. Uncertainty is usually assigned to the attenuation relationships based upon statistical analysis of attenuation in previous earthquakes.
4. Calculate the probability of exceedance of the specified ground motion parameter for a specified time interval by integrating the attenuation relationship over the magnitude distribution for each source and summing up the results.
Figure 13-6 General Procedure for Probabilistic Seismic Hazard Analysis
FHWA-NHI-09-010 13-Seismic Considerations 13-10 Road Tunnel Manual March 2009

13.2.3 Ground Motion Parameters
Once the design earthquake events are defined, design ground motion parameters are required to characterize the design earthquake events. Various types of ground motion parameters may be required depending on the type of analysis method used in the design. In general, ground motions can be characterized by three translational components (e.g., longitudinal, transverse, and vertical with respect to the tunnel axis). The various types of common ground motion parameters are described in the following paragraphs.
Peak Ground Motion Parameters: Peak ground acceleration (PGA), particularly in the horizontal direction, is the most common index of the intensity of strong ground motion at a site. Peak ground velocity (PGV) and peak ground displacement (PGD) are also used in some engineering analyses to characterize the damage potential of ground motions. For seismic design and analysis of underground structures including tunnels, the PGV is as important as the PGA because ground strains (or the differential displacement between two points in the ground) can be estimated using the PGV. PGA values are generally available from published hazard results such as those from the USGS hazard study. Attenuation relations are also generally available for estimating PGA values. However, there has been little information in the past for estimating the PGV values. Previous studies have attempted to correlate the PGV with PGA by establishing PGV-to-PGA ratios (as a function of earthquake magnitudes, site soil conditions, and source-to-site distance in some cases). However, these correlations were derived primarily from ground motion database in the Western United States (WUS) and failed to account for the different ground motion characteristics in the Central and Eastern United States (CEUS). Recent study (NCHRP-12-70, 2008) has found that PGV is strongly correlated with the spectral acceleration at 1.0 second (S1). Using published strong motion data, regression analysis was conducted and the following correlation has been recommended for design purposes.
PGV = 0.394 x 10 0.434C 13-1
Where:
PGV is in in/sec
C = 4.82 + 2.16 log10 S1 + 0.013 [2.30 log10 S1 + 2.93]2 13-2
The development of the PGV-S1 correlation is based on an extensive earthquake database established from recorded accelerograms representative of both rock and soil sites for the WUS and CEUS. The earthquake magnitude was found to play only a small role and is not included in the correlation in developing Equations 13-1 and 13-2. Equation 13-1 is based on the mean plus one standard deviation from the regression analysis (i.e., 1.46 x the median value) for conservatism.
Design Response Spectra: Response spectra represent the response of a damped single degree of freedom system to ground motion. Design response spectra including the consideration of soil site effects can be established using code-specified procedures such as those specified in the NEHRP (National Earthquake Hazards Reduction Program) publications or the new AASHTO LRFD Guide Specifications using the appropriate design earthquake parameters consistent with the desirable design earthquake hazard levels (refer to discussions in Section 13.2.2). Figure 13-7 illustrates schematically the construction of design response spectra using the NEHRP procedure. The terms and parameters used in Figure 13-7 are documented in details in NEHRP 12-70 (2008) and in AASHTO LRFD Bridge Design Specifications (2008 Interim Provisions). Alternatively, project-specific and site-specific hazard analysis can also be performed to derive the design response spectra. Site-specific dynamic soil response analysis can also be performed to study the effects of the local soil/site conditions (site effects).
FHWA-NHI-09-010 13-Seismic Considerations 13-11 Road Tunnel Manual March 2009

Figure 13-7 Design Response Spectra Constructed Using the NEHRP Procedure
It should be noted that while the design response spectra are commonly used for the seismic design and analysis of above-ground structures such as bridges and buildings, they are not as useful in the seismic evaluation for underground structure. This is because response spectra are more relevant for evaluating the inertial response effect of above-ground structures while for underground structures, ground strains or ground displacements are the governing factor. Nevertheless, design response spectra effectively establish the ground motion shaking intensity level and can be used for deriving other ground motion parameters that are useful and relevant for underground structures. For example, using the design spectral acceleration at 1.0 sec (SD1), PGV can be estimated using the empirical correlation discussed above (Equation 13-1). In addition, design response spectra can also be used as the target spectra for generating the design ground motion time histories which in turn can be used in seismic analysis for underground structures if more refined numerical analysis is required. Ground Motion Time histories and Spatially Varying Ground Motion Effects: The developed time histories should match the target design response spectra and have characteristics that are representative of the seismic environment of the site and the local site conditions. Characteristics of the seismic environment of the site to be considered in selecting time-histories include: tectonic environment (e.g., subduction zone; shallow crustal faults in WUS or similar crustal environment; CEUS or similar crustal environment); earthquake magnitude; type of faulting (e.g., strike-slip; reverse; normal); seismic-sourceto-site distance; local site conditions; and design or expected ground-motion characteristics (e.g., design response spectrum; duration of strong shaking; and special ground-motion characteristics such as near-fault characteristics).
It is desirable to select time-histories that have been recorded under conditions similar to the seismic conditions (as described above) at the site, but compromises are usually required because of the multiple attributes of the seismic environment and the limited data bank of recorded time-histories. Selection of time-histories having similar earthquake magnitudes and distances, within reasonable ranges, are especially important parameters because they have a strong influence on response spectral content, response spectral shape, duration of strong shaking, and near-source ground-motion characteristics.
FHWA-NHI-09-010 13-Seismic Considerations
13-12 Road Tunnel Manual March 2009

For long structures such as tunnels, different ground motions may be encountered by different parts of the structure. Thus, it is sometime necessary for the tunnel to be evaluated for the spatially varying ground motions effects, particularly when the longitudinal response of the tunnel is of concern (refer to discussions in Section 13.5.2). In this case the differential displacements and force buildup along the length of the tunnel could be induced due to the spatially varying ground motion effects. In deriving the spatially varying ground motion time histories, as a minimum the following factors should be taken into considerations: • Local soil site effect • Wave traveling/passage effect • Extended source effect • Near-field effect. Ground Motion Parameters Attenuation with Depth: The ground motions parameters discussed above are typically established at ground surface. Tunnels, however, are generally constructed at some depth below the ground surface. For seismic evaluation of the tunnel structure, the ground motion parameters should be derived at the elevation of the tunnel. Because ground motions generally decrease with depth below the ground surface, these parameters generally have lower values than estimated for ground surface motions (e.g., Chang et al., 1986). The ratios of ground motion values at tunnel depths to those at the ground surface may be taken as the ratios summarized in Table 13-1 unless lower values are justified based on site-specific assessments. For more accurate assessment of the ground motion parameters at depth, site-specific dynamic site response analysis should be performed to account for detailed subsurface conditions and site geometry. Results from the dynamic site response analysis would provide various aspects of ground motion parameters as a function of depth (in a one-dimensional site response analysis) or as a function of spatial coordinates (in a two- or three-dimensional site response analysis).
Table 13-1 Ground Motion Attenuation with Depth
Tunnel Depth (m) Ratio Of Ground Motion At Tunnel Depth To Motion At Ground Surface
≤ 6 1.0 6 -15 0.9
15 -30 0.8 ≥ 30 0.7
13.3 FACTORS THAT INFLUENCE TUNNEL SEISMIC PERFORMANCE The main factors influencing tunnel seismic performance generally can be summarized as (1) seismic hazard, (2) geologic conditions, and (3) tunnel design, construction, and condition. Each of these factors is briefly described in the following sections. 13.3.1 Seismic Hazard In a broad sense, earthquake effects on underground tunnel structures can be grouped into two categories: (1) ground shaking, and (2) ground failure. Based on tunnel performance records during past earthquakes, the damaging effects of ground failure on tunnels are significantly greater than the ground shaking effects. FHWA-NHI-09-010 13-Seismic Considerations
13-13 Road Tunnel Manual March 2009

Ground Shaking: Ground shaking refers to the vibration of the ground produced by seismic waves propagating through the earth’s crust. The area experiencing this shaking may cover hundreds of square miles in the vicinity of the fault rupture. The intensity of the shaking attenuates with distance from the fault rupture. Ground shaking motions are composed of two different types of seismic waves, each with two sub-types, described as follows: • Body waves traveling within the earth’s material. They may be either longitudinal P waves or
transverse shear S waves and they can travel in any direction in the ground. • Surface waves traveling along the earth’s surface. They may be either Rayleigh waves or Love
waves. As the ground is deformed by the traveling waves, any tunnel structure in the ground will also be deformed, since tunnel structures are constrained by the surrounding medium (soil or rock). As long as the ground (i.e., the surrounding medium) is stable, the structures cannot move independently of the ground. Therefore, the design and analysis of underground structures is based on ground deformations/strains rather than ground acceleration values. If the magnitude of ground deformation during earthquakes is small, the seismic effect on tunnels is negligible. For example, there is generally little concern for tunnel sections constructed in reasonably competent rock because the seismically induced deformations/strains in rock are generally very small, except when shear/fault zones are encountered or when there are large loosened rock pieces behind the lining. In loose or soft soil deposits, on the other hand, the soil deformation developed during the design earthquake(s) should be estimated and used for the structure’s design and analysis. In general the potential effects of ground shaking range from minor cracking of a concrete liner to collapse of the liner and major caving of geologic materials into the tunnel. Ground Failure: Ground failure broadly includes various types of ground instability such as fault rupture, tectonic uplift and subsidence, landsliding, and soil liquefaction. Each of these hazards may be potentially catastrophic to tunnel structures, although the damages are usually localized. Design of a tunnel structure against ground instability problems is often possible, although the cost may be high. If an active fault crosses the tunnel alignment, there is a hazard of direct shearing displacement through the tunnel in the event of a moderate to large magnitude earthquake. Such displacements may range from a few inches to greater than ten feet and, in many cases, may be concentrated in a narrow zone along the fault. Fault rupture can and has had very damaging effects on tunnels. Tectonic uplift and subsidence can have similar damaging effects to fault rupture, if the uplift/subsidence movements cause sufficient differential deformation of the tunnel. Landsliding through a tunnel, whether statically or seismically induced, can result in large, concentrated shearing displacements and either full or partial collapse of tunnel cross sections. Landslide potential is greatest when a preexisting landslide mass intersects the tunnel. A statically stable landslide mass may be activated by earthquake shaking. The hazard of landsliding is usually greatest in shallower parts of a tunnel alignment and at tunnel portals. For tunnels located in soils below the groundwater table, there could be a potential for liquefaction if loose to medium-dense cohesionless soils (sands, silts, gravels) are adjacent to the tunnel. Potential effects of liquefaction of soils adjacent to a tunnel include: (a) increased lateral pressures on the lining or walls of the tunnel, which could lead to failure of the lining or walls depending on their design; (b) flotation or sinking of a tunnel embedded in liquefied soil, depending on the relative weight of the tunnel and the soils replaced by the tunnel; and (c) lateral displacements of a tunnel if there is a free face toward which liquefied soil can move and/or if the tunnel is constructed below sloping ground. FHWA-NHI-09-010 13-Seismic Considerations
13-14 Road Tunnel Manual March 2009
13.3.2 Geologic Conditions Other unfavorable geologic conditions could lead to unsatisfactory seismic tunnel performance unless recognized and adequately accounted for in the tunnel design and construction. Unfavorable geologic conditions include: soft soils; rocks with weak planes intersecting a tunnel, such as shear zones or well developed weak bedding planes and well developed joint sets that are open or filled with weathered and decomposed rock; failures encountered during tunnel construction that may have further weakened the geologic formations adjacent to a tunnel (e.g., cave-ins or running ground leaving incompletely filled voids or loosened rock behind a lining; squeezing ground with relatively low static factor of safety against lining collapse); and adjacent geologic units having major contrasts in stiffness that can lead to stress concentrations or differential displacement. 13.3.3 Tunnel Design, Construction, and Condition Elements of tunnel design, construction, and condition that may influence tunnel seismic behavior include:
1. Whether seismic loadings and behavior were explicitly considered in tunnel design 2. The nature of the tunnel lining and support system (e.g., type of lining, degree of contact between
lining/support systems and geologic material, use of rock bolts and dowels) 3. Junctions of tunnels with other structures 4. History of static tunnel performance in terms of failures and cracking or distortion of
lining/support system 5. Current condition of lining/support system, such as degree of cracking of concrete and
deterioration of concrete or steel materials over time. In evaluating an existing tunnel in the screening stage or in a more detailed evaluation, or in designing retrofit measures, it is important to obtain as complete information as possible on the tunnel design, construction, and condition and the geologic conditions along the tunnel alignment. To obtain this information, the design and evaluation team should review the design drawings and design studies, as-built drawings, construction records as contained in the construction engineer daily reports and any special reports, maintenance and inspection records, and geologic and geotechnical reports and maps. Special inspections and investigations may be needed to adequately depict the existing conditions and determine reasons for any distress to the tunnel. 13.4 SEISMIC PERFORMANCE AND SCREENING GUIDELINES OF TUNNELS 13.4.1 Screening Guidelines Applicable to All Types of Tunnels There are certain conditions that would clearly indicate a potentially significant seismic risk to a bored tunnel, cut-and-cover tunnel, or submerged tube and thus require more detailed evaluations. These conditions include: • An active fault intersecting the tunnel; • A landslide intersecting the tunnel, whether or not the landslide is active; • Liquefiable soils adjacent to the tunnel, and • History of static distress to the tunnel (e.g., local collapses, large deformations, cracking or spalling of
the liner due to earth movements), unless retrofit measures were taken to stabilize the tunnel.
FHWA-NHI-09-010 13-Seismic Considerations
13-15 Road Tunnel Manual March 2009

In addition to the above, detailed seismic evaluations should also be conducted for tunnels that are considered lifeline structures (important and critical structures) that must be usable or remain open to traffic immediately after the earthquake. Transit tunnels in metropolitan areas are often considered as critical/lifeline structures and, therefore, warrant detailed seismic evaluations.
13.4.2 Additional Screening Guidelines for Bored Tunnels
If the above conditions do not exist, then the risk to a bored tunnel is a function of the tunnel design and construction, the characteristics of the geologic media, and the level of ground shaking. In this section, additional screening guidelines are presented considering these factors and empirical observations of tunnel performance during earthquakes.
It should be noted that although not as damaging as ground failure effects, ground shaking effect alone (i.e., in the absence of ground failure) has resulted in moderate to major damage to many tunnels in earthquakes. Figure 13-8 shows a highway tunnel experiencing lining falling off from tunnel crown under the ground shaking effect during the 2004 Niigata Earthquake in Japan. In another incident, the 1999 Koceali Earthquake in Turkey caused the collapse of two tunnels (the Bolu Tunnels) constructed using NATM method (15 m arch high and 16 m wide). At the time of the earthquake, the collapsed section of the tunnel had been stabilized with steel rib, shotcrete, and anchors.
Figure 13-8 Highway Tunnel Lining Falling from Tunnel Crown – 2004 Niigata Earthquake, Japan
Figure 13-9 presents a summary of empirical observations of the effects of seismic ground shaking on the performance of bored/mined tunnels. The figure is from the study by Power et al. (1998), which updates earlier presentations of tunnel performance data by Dowding and Rozen (1978), Owen and Scholl (1981), and Sharma and Judd (1991). The data are for damage due only to shaking; damage that was definitely or
FHWA-NHI-09-010 13-Seismic Considerations
13-16 Road Tunnel Manual March 2009
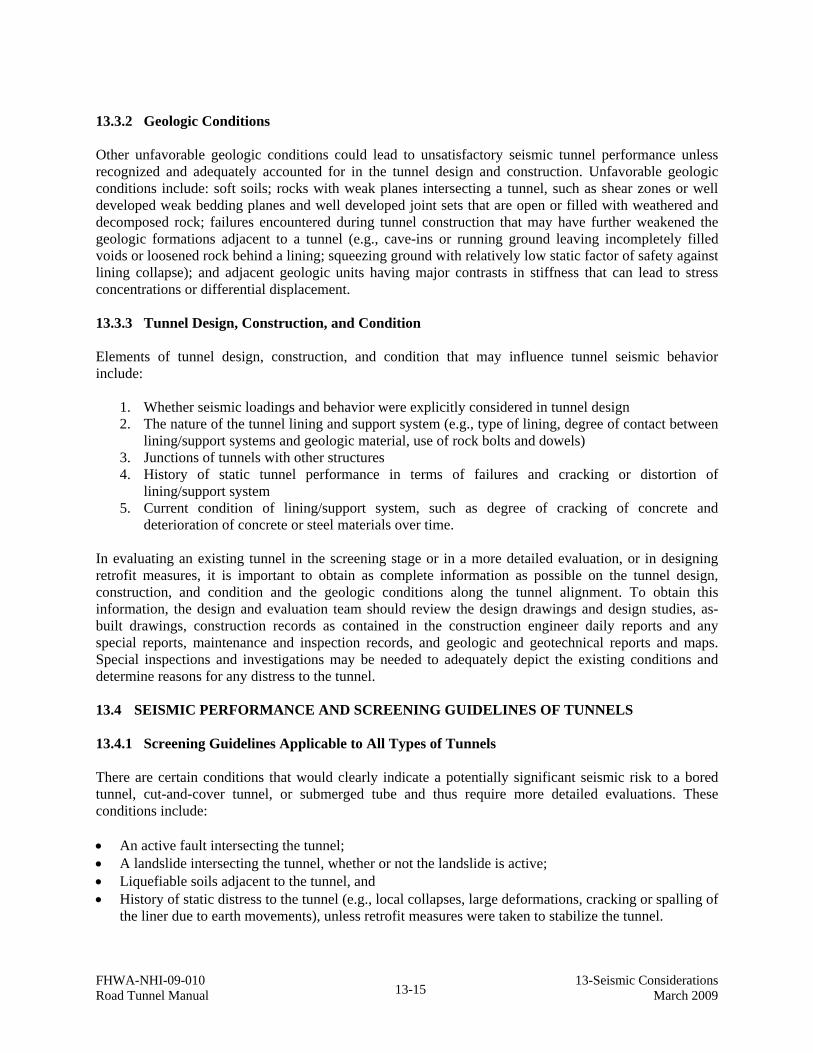
probably attributed to fault rupture, landsliding, and liquefaction is not included. The data are for bored/mined tunnels only; data for cut-and-cover tunnels and submerged tubes are not included in Figure 13-9.
Figure 13-9 Summary of Observed Bored/Mined Tunnel Damage under Ground Shaking Effects (Power et al., 1998)
Figure 13-9 incorporates observations for 192 tunnels from ten moderate to large magnitude earthquakes (moment magnitude MW 6.6 to 8.4) in California, Japan, and Alaska. Ninety-four of the observations are from the moment magnitude MW 6.9 1995 Kobe, Japan, earthquake. This earthquake produced by far the most observations for moderate to high levels of shaking (estimated peak ground accelerations, PGA, at ground surface above the tunnels in the range of about 0.4 g to 0.6 g for the Kobe data). Peak ground accelerations in Figure 13-9 are estimated for actual or hypothetical outcropping rock conditions at ground surface above the tunnel. Other observations are from moderate to large (MW 6.7 to 8.4) earthquakes in California and Japan. Figure 13-9 shows the level of damage induced in tunnels with different types of linings subjected to the indicated levels of ground shaking. Damage was categorized into four states: none for no observable damage; slight for minor cracking and spalling; moderate for major cracking and spalling, falling of pieces of lining and rocks; and heavy for major cave-ins, blockage, and collapse. The figure indicates the following trends: • For PGA equal to or less than 0.2 g, ground shaking caused essentially no damage in tunnels. • For PGA in the range of 0.2 g to 0.5 g, there are some instances of damage ranging from slight to
heavy. Note that the three instances of heavy damage are all from the 1923 Kanto, Japan, earthquake. For the 1923 Kanto earthquake observation with PGA equal to 0.25 g shown on Figure 13-9, the investigations for this tunnel indicated the damage may have been due to landsliding. For the other two Kanto earthquake observations, collapses occurred in the shallow portions of the tunnels.
FHWA-NHI-09-010 13-Seismic Considerations
13-17 Road Tunnel Manual March 2009

• For PGA exceeding about 0.5 g, there are a number of instances of slight to moderate damage (and one instance of heavy damage noted above for the Kanto earthquake).
• Tunnels with stronger linings appear to have performed better, especially those tunnels with reinforced concrete and/or steel linings.
The trends in Figure 13-9 can be used as one guide in assessing the need for further evaluations of the effects of ground shaking on bored/mined tunnels. 13.4.3 Additional Screening Guidelines for Cut-and-Cover Tunnels Reporting on the seismic performance of shallow cut-and-cover box-like tunnels has been relatively poor in comparison to the performance of bored/mined tunnels. This was especially evident during the 1995 Kobe, Japan, earthquake (O’Rourke and Shiba, 1997; Power et al., 1998). Figure 13-10 and Figure 13-11 show the damage to the center columns of the cut-and-cover tunnels running between Daikai and Nagata Stations during the 1995 Kobe Earthquake.
Figure 13-10 Fracture at Base of Columns of Cut-and-Cover Tunnel between Daikai and Nagata Stations - 1995 Kobe Earthquake, Japan
FHWA-NHI-09-010 13-Seismic Considerations 13-18 Road Tunnel Manual March 2009

Figure 13-11 Shear Failure at Top of Columns of Cut-and-Cover Tunnel Between Daikai and Nagata Stations - 1995 Kobe Earthquake, Japan
The 1995 Kobe Earthquake also caused a major collapse of the Daikai subway station which was constructed by cut-and-cover method without specific seismic design provisions. The schematic drawing shown in Figure 13-12 (Iida et al., 1996) shows the collapse experienced by the center columns of the station, which was accompanied by the collapse of the ceiling slab and the settlement of the soil cover by more than 2.5 m.
Figure 13-12 Daikai Subway Station Collapse – 1995 Kobe Earthquake, Japan
The relatively poor performance of cut-and-cover tunnels under the ground shaking effect may reflect: (1) relatively softer near-surface geologic materials surrounding these types of structures as compared to the harder materials that often surround bored tunnels at greater depths; (2) higher levels of acceleration at and near the ground surface than at depth (due to tendencies for vibratory ground motions to reduce with depth below the ground surface); and (3) vulnerability of these box-like structures to seismically induced
FHWA-NHI-09-010 13-Seismic Considerations
13-19 Road Tunnel Manual March 2009
racking deformations of the box cross section (Refer to Figure 13-13 in Section 13.5), unless specifically designed to accommodate these racking deformations. Cut-and-cover tunnels in soil tend to be more vulnerable than those excavated into rock because of the larger soil shear deformations causing the tunnel racking. Tunnels in soft soil may be especially vulnerable. The most important determinant in assessing whether more detailed seismic evaluations of cut-and-cover tunnels are required is whether the original design considered loadings and deformations consistent with the seismic environment and geologic conditions, and especially, whether racking behavior was taken into account in the seismic analysis, design, and detailing of the structure. 13.4.4 Additional Screening Guidelines for Immersed Tubes Submerged tubes are particularly susceptible to permanent ground movements during seismic shaking. Tubes are typically located at shallow depths and in soft or loose soils. Liquefaction of loose cohesionless soils may cause settlement, uplift (flotation), or lateral spreading. Earthquake shaking may also cause permanent displacement of soft clay soils on sloping ground. Joints connecting tube segments must accommodate the relative displacement of adjacent segments while maintaining a watertight seal. Generally, submerged tubes can be screened out from more detailed evaluations if the original design appropriately considered and analyzed the po tential for ground failure modes and if joints have been carefully designed to achieve water tightness.
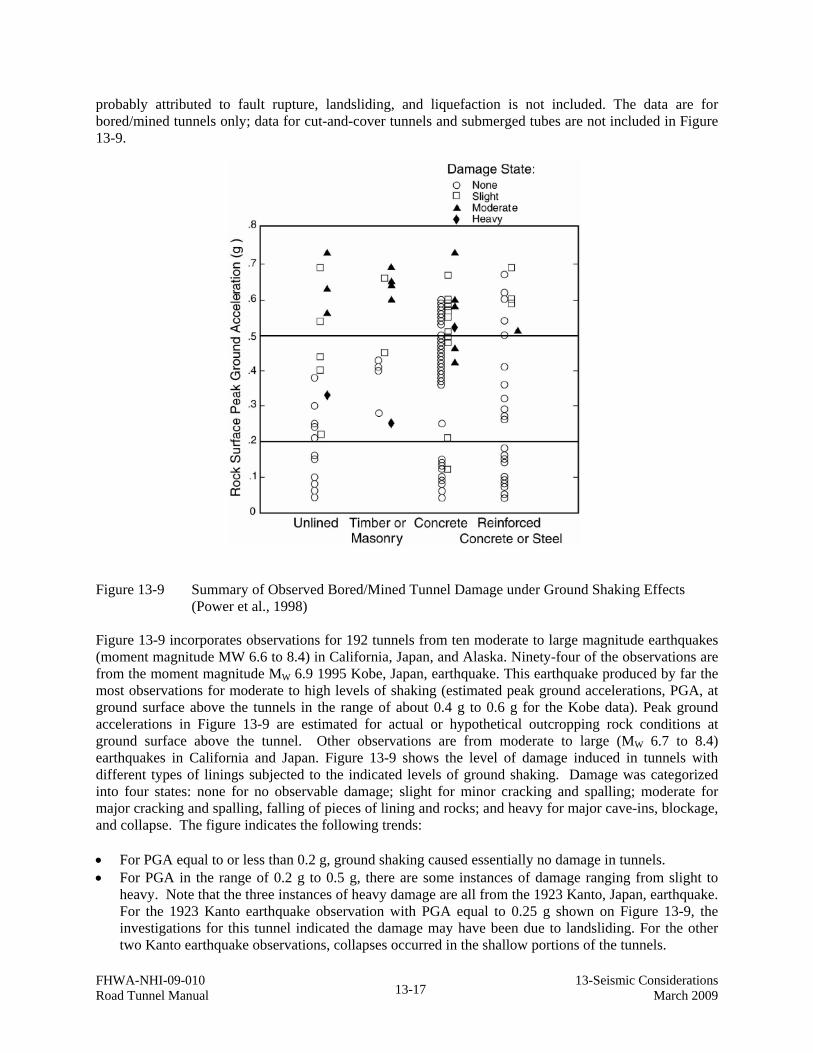
13.5 SEISMIC EVALUATION PROCEDURES - GROUND SHAKING EFFECTS Underground tunnel structures undergo three primary modes of deformation during seismic shaking: ovaling/racking, axial and curvature deformations. The ovaling/racking deformation is caused primarily by seismic waves propagating perpendicular to the tunnel longitudinal axis, causing deformations in the plane of the tunnel cross section (Refer to Figure 13-3, Wang, 1993; Owen and Scholl, 1981). Vertically propagating shear waves are generally considered the most critical type of waves for this mode of deformation. The axial and curvature deformations are induced by components of seismic waves that propagate along the longitudinal axis (Refer to Figure 13-14, Wang, 1993; Owen and Scholl, 1981).
Figure 13-13 Tunnel Transverse Ovaling and Racking Response to Vertically Propagating Shear Waves
FHWA-NHI-09-010 13-Seismic Considerations 13-20 Road Tunnel Manual March 2009

Figure 13-14 Tunnel Longitudinal Axial and Curvature Response to Traveling Waves
13.5.1 Evaluation of Transverse Ovaling/Racking Response of Tunnel Structures The evaluation procedures for transverse response of tunnel structures can be based on either (1) simplified analytical method, or (2) more complex numerical modeling approach, depending on the degree of complexity of the soil-structure system, subsurface conditions, the seismic hazard level, and the importance of the structures. The numerical modeling approach should be considered in cases where simplified analysis methods are less applicable, more uncertain, or inconclusive, or where a very important structure is located in a severe seismic environment or where case history data indicate relatively higher seismic vulnerability for the type of tunnel, such as rectangular cut-and-cover tunnels in seismically active areas. The numerical modeling approach is further discussed in Section 13.5.1.4. 13.5.1.1 Simplified Procedure for Ovaling Response of Circular Tunnels This section provides methods for quantifying the seismic ovaling effect on circular tunnel linings. The conventionally used simplified free-field deformation method, discussed first, ignores the soil-structure interaction effects. Therefore its use is limited to conditions where the tunnel structures can be reasonably assumed to deform according to the free-field displacements during earthquakes. A refined method is then presented in Section 13.5.1.2 that is equally simple but capable of eliminating the drawbacks associated with the free-field deformation method. This refined method - built from a theory that is familiar to most mining/underground engineers - considers the soil-structure interaction effects. Based on this method, a series of design charts are developed to facilitate the design process. Ovaling Effect: As mentioned earlier, ovaling of a circular tunnel lining is primarily caused by seismic waves propagating in planes perpendicular to the tunnel axis. The results are cycles of additional stress concentrations with alternating compressive and tensile stresses in the tunnel lining. These dynamic stresses are superimposed on the existing static state of stress in the lining. Several critical modes may result (Owen and Scholl, 1981):
• Compressive dynamic stresses added to the compressive static stresses may exceed the compressive capacity of the lining locally.
• Tensile dynamic stresses subtracted from the compressive static stresses reduce the lining’s moment capacity, and sometimes the resulting stresses may be tensile.
FHWA-NHI-09-010 13-Seismic Considerations
13-21 Road Tunnel Manual March 2009

Free-Field Shear Deformations: As mentioned previously, the shear distortion of ground caused by vertically propagating shear waves is probably the most critical and predominant mode of seismic motions. It causes a circular tunnel to oval and a rectangular underground structure to rack (sideways motion), as shown in Figure 13-13. Analytical procedures by numerical methods are often required to arrive at a reasonable estimate of the free-field shear distortion, particularly for a soil site with variable stratigraphy. Many computer codes with variable degree of sophistication are available (e.g., SHAKE, FLUSH, FLAC, PLAXIS, et al.). The most widely used approach is to simplify the site geology into a horizontally layered system and to derive a solution using one-dimensional wave propagation theory (Schnabel, Lysmer, and Seed, 1972). The resulting free-field shear distortion of the ground from this type of analysis can be expressed as a shear strain distribution or shear deformation profile versus depth. For a deep tunnel located in relatively homogeneous soil or rock and in the absence of detailed site response analyses, the simplified procedure by Newmark (1968) and Hendron (1985) may provide a reasonable estimate, noting, however, that this method tends to produce more conservative results particularly when the effect of ground motion attenuation with depth (refer to Table 13-1) is ignored. Here, the maximum free-field shear strain, γmax, can be expressed as
VSγ max = 13-3 Cse
Where: VS = Peak particle velocity Cse = Effective shear wave propagation velocity
The effective shear wave velocity of the vertically propagating shear wave, Cse, should be compatible with the level of the shear strain that may develop in the ground at the elevation of the tunnel under the design earthquake shaking. The values of Cse can be estimated by making proper reduction (to account for the strain-level dependent effect) from the small-strain shear wave velocity, Cs, obtained from in-situ testing (such as using the cross-hole, down-hole, and P-S logging techniques). For rock, the ratio of Cse/Cs can be assumed equal to 1.0. For stiff to very stiff soil, Cse/Cs may range from 0.6 to 0.9. Alternatively, site specific response analyses can be performed for estimating Cse. Site specific response analyses should be performed for estimating Cse for tunnels embedded in soft soils An equation relating the effective propagation velocity of shear waves to effective shear modulus, Gm, is expressed as:
GCse =m
13-4 ρ
Where: ρ = Mass density of the ground
An alternative simplified method for calculating the free-field ground shear strain, γmax, is by dividing the earthquake-induced shear stresses (τmax) by the shear stiffness (i.e., the strain-compatible effective shear modulus, Gm). This method is especially suitable for tunnels with shallow burial depths.
FHWA-NHI-09-010 13-Seismic Considerations
13-22 Road Tunnel Manual March 2009

In this simplified method the maximum free-field ground shear strain is calculated using the following equation:
τγ maxmax = 13-5
Gm
τmax = (PGA/g) σv Rd 13-6
σv = γt (H+D) 13-7 Where:
Gm = Effective strain-compatible shear modulus of ground surrounding tunnel (ksf) τmax = Maximum earthquake-induced shear stress (ksf) σv = Total vertical soil overburden pressure at invert elevation of tunnel (ksf) γt = Total soil unit weight (kcf) H = Soil cover thickness measured from ground surface to tunnel crown (ft) D = Height of tunnel (or diameter of circular tunnel) (ft) Rd = Depth dependent stress reduction factor; can be estimated using the following
relationships:
Rd = 1.0 - 0.00233z for z < 30 ft Rd = 1.174 - 0.00814z for 30 ft < z < 75 ft Rd = 0.744 - 0.00244z for 75 ft < z < 100 ft Rd = 0.5 for z > 100 ft
Where:
z = the depth (ft) from ground surface to the invert elevation of the tunnel and is represented by z = (H+D).
Lining Conforming to Free-Field Shear Deformations: When a circular lining is assumed to oval in accordance with the deformations imposed by the surrounding ground (e.g., shear), the lining’s transverse sectional stiffness is completely ignored. This assumption is probably reasonable for most circular tunnels in rock and in stiff soils, because the lining stiffness against distortion is low compared with that of the surrounding medium. Depending on the definition of “ground deformation of surrounding medium,” however, a design based on this assumption may be overly conservative in some cases and non-conservative in others. This will be discussed further below. Shear distortion of the surrounding ground, for this discussion, can be defined in two ways. If the non-perforated ground in the free-field is used to derive the shear distortion surrounding the tunnel lining, the lining is to be designed to conform to the maximum diameter change, ΔDfree-field, shown in the top of Figure 13-15.
FHWA-NHI-09-010 13-Seismic Considerations
13-23 Road Tunnel Manual March 2009

Figure 13-15 Shear Distortion of Ground – Free-Field Condition vs Cavity In-Place Condition
The maximum diametric change of the lining for this case can be derived as:
ΔDfree − field = ±(γ max / 2)D 13-8
Where: D = the diameter of the tunnel
γmax = the maximum free-field shear strain On the other hand, if the ground deformation is derived by assuming the presence of a cavity due to tunnel excavation (bottom of Figure 13-15, for perforated ground), then the lining is to be designed according to the diametric strain expressed as:
ΔDcavity = ±2γ max (1 −ν m )D 13-9
Where:
νm = the Poisson’s Ratio of the medium
FHWA-NHI-09-010 13-Seismic Considerations
13-24 Road Tunnel Manual March 2009

Equations 13-8 and 13-9 both assume the absence of the lining. In other words, tunnel-ground interaction is ignored. Comparison between Equations 13-8 and 13-9 shows that the perforated ground deformation would yield a much greater distortion than the free-field case (non-perforated ground). For a typical ground medium, the difference could be as much as three times. Based on the assumptions made, some preliminary conclusions can be drawn as follows: • Equation 13-9, for the perforated ground deformation, should provide a reasonable estimate for the
deformation of a lining that has little stiffness (against distortion) in comparison to that of the medium.
• Equation 13-8, for the free-field ground deformation, on the other hand, should provide a reasonable result for a lining with a distortion stiffness close or equal to the surrounding medium.
Based on the discussions above, it can be further suggested that a lining with a greater distortion stiffness than the surrounding medium should experience a lining distortion even less than the free-field deformation. This latest case may occur when a tunnel is built in soft to very soft soils. It is therefore clear that the relative stiffness between the tunnel and the surrounding ground (i.e., soil-structure interaction effect) plays an important role in quantifying tunnel response during the seismic loading condition. This effect will be discussed next. Importance of Lining Stiffness- Compressibility and Flexibility Ratios: To quantify the relative stiffness between a circular lining and the medium, two ratios designated as the compressibility ratio, C, and the flexibility ratio, F (Hoeg, 1968, and Peck et al., 1972) are defined by the following equations: Compressibility Ratio:
E m (1−ν2 l )R
C = l 13-10E l t(1+ν m )(1− 2ν m )
Flexibility Ratio:
E ( −ν 2 3
F = m 1 l )Rl 13-116El I l ,1 (1+ν m )
Where: Em = Strain-compatible elastic modulus of the surrounding ground
ν m = Poisson’s ratio of the surrounding ground
Rl = Nominal radius of the tunnel lining
ν l = Poisson’s ratio of the tunnel Lining
I l ,1 = Moment of inertia of lining per unit width of tunnel along the tunnel axis.
tl = The thickness of the lining
FHWA-NHI-09-010 13-Seismic Considerations
13-25 Road Tunnel Manual March 2009
Of these two ratios, it often has been suggested that the flexibility ratio is the more important because it is related to the ability of the lining to resist distortion imposed by the ground. As will be discussed later, the compressibility ratio also has a significant effect on the lining thrust response. For most circular tunnels encountered in practice, the flexibility ratio, F, is likely to be large enough (say, F>20) so that the tunnel-ground interaction effect can be ignored (Peck, 1972). It is to be noted that F > 20 suggests that the ground is about 20 times stiffer than the lining. In these cases, the distortions to be experienced by the lining can be reasonably assumed to be equal to those of the perforated ground (i.e., ΔDcavity). This rule of thumb procedure may present some design problems when a very stiff structure is surrounded by a very soft soil. A typical example would be to construct a very stiff immersed tube in a soft lake or river bed deposit. In this case the flexibility ratio is very low, and the stiff tunnel lining could not be realistically designed to conform to the deformations imposed by the soft ground. The tunnel-ground interaction effect must be considered in this case to achieve a more efficient design. In the following section a refined procedure taking into account the tunnel-ground interaction effect is presented to provide a more accurate assessment of the seismic ovaling effect on a circular lining. 13.5.1.2 Analytical Lining-Ground Interaction Solutions for Ovaling Response of Circular Tunnels Closed form analytical solutions have been proposed (Wang, 1993) for estimating ground-structure interaction for circular tunnels under the seismic loading conditions. These solutions are generally based on the assumptions that: • The ground is an infinite, elastic, homogeneous, isotropic medium. • The circular lining is generally an elastic, thin walled tube under plane strain conditions. • Full-slip or no-slip conditions exist along the interface between the ground and the lining. The expressions of these lining responses are functions of flexibility ratio and compressibility ratio as presented previously in Equations 13-10 and 13-11. The expressions for maximum thrust, Tmax, bending moment, Mmax, and diametric strain, ΔD/D, can be presented in the following forms:
1 EM = ± K m R2max 1 l γ max 13-12
6 (1+νm )
ET = ±K mmax 2 R l γ max 13-13
2(1+νm )
ΔD max/ D = ± 1 3 K 1 Fγ max 13-14
12(1−ν )K1 = m 13-15
2F + 5 − 6ν m
FHWA-NHI-09-010 13-Seismic Considerations 13-26 Road Tunnel Manual March 2009

F[(1− 2ν ) − (1− 2ν )C] − 1 (1− 2ν )2 C + 2m m 2 mK 2 = 1+ 2 13-16
F[(3 − 2ν ) + (1− 2ν )C] + C[ 5 − 8ν + 6ν ] + 6 − 8νm m 2 m m m
K1 and K2 are defined herein as lining response coefficients. The earthquake loading parameter is represented by the maximum shear strain induced in the ground (free-field), γmax, which may be obtained through a simplified approach (such as Equation 13-15 or 13-16), or by performing a site-response analysis. The resulting bending moment induced maximum fiber strain, εm , and the axial force (i.e., thrust)
induced strain, εT , can be derived as follows:
E 2 γ t1 m max lε m = ± 6 K1 Rl 13-17(1+ν ) 2E Im l l
E γm maxε = ±K R 13-18T 2 l2(1+ν ) E tm l l
To ease the design process, Figure 13-16 shows the lining response coefficient, K1, as a function of flexibility ratio and Poisson’s Ratio of the ground. The design charts showing the lining coefficient K2, primarily used for the thrust response evaluation, are presented in Figure 13-17, Figure 13-18, and Figure Figure 13-19 for Poisson’s Ratio values of 0.2, 0.35 and 0.5, respectively.
3
Re
sp
on
se
Co
eff
icie
nt,
K1 2.5
2
1.5
1
0.5
0
Poisson's Ratio 0.1 0.2 0.3 0.4 0.5
0 1 2 3 4 5 6 7 8 9 10
Flexibility Ratio, F
Figure 13-16 Lining Response Coefficient, K1 (Full-Slip Interface Condition)
FHWA-NHI-09-010 13-Seismic Considerations
13-27 Road Tunnel Manual March 2009

Thru
st R
esponse
Coef
fici
ent, K
2
1.5 Poisson's Ratio = 0.2
1.4
1.3
1.2 0.5
1.1 1
2
1 4
10 0.9
Flexibility Ratio 50
0.8 0 0.2 0.4 0.6 0.8 1 1.2 1.4 1.6 1.8 2
Compressibility Ratio, C
Figure 13-17 Lining Response Coefficient, K2, for Poisson’s Ratio = 0.2 (No-Slip Interface Condition)
1.6 Poisson's Ratio = 0.35
1.5
Thru
st R
esponse
Coef
fici
ent, K
2
1.4
1.3 0.5
1 1.2
2 1.1
4
1 10
50 0.9
Flexibility Ratio
0.8 0 0.2 0.4 0.6 0.8 1 1.2 1.4 1.6 1.8 2
Compressibility Ratio, C
Figure 13-18 Lining Response Coefficient, K2, for Poisson’s Ratio = 0.35 (No-Slip Interface Condition)
FHWA-NHI-09-010 13-Seismic Considerations
13-28 Road Tunnel Manual March 2009

0.6
0.8
1
1.2
1.4
1.6
1.8
2
0 0.2 0.4 0.6 0.8 1 1.2 1.4 1.6 1.8 2 C o mp ressib ility R atio , C
Thru
st R
esponse
Coef
fici
ent, K
2
P ois son's R atio = 0.5
Flexibility R a tio
50
10
4
2
1
0.5
Figure 13-19 Lining Response Coefficient, K2, for Poisson’s Ratio = 0.5 (No-Slip Interface Condition)
It should be noted that the solutions in terms of Mmax, ΔDmax, and εm provided herein are based on the full-slip interface assumption. For the maximum thrust response Tmax the interface conditions is assumed to be no-slip. These assumptions were adopted because full-slip condition produces more conservative results for Mmax and ΔDmax, while no-slip condition is more conservative for Tmax. During an earthquake, in general, slip at interface is a possibility only for tunnels in soft soils, or when seismic loading intensity is severe. For most tunnels, the condition at the interface is between full-slip and no-slip. In computing the forces and deformations in the lining, it is prudent to investigate both cases and the more critical one should be used in design. The conservatism described above is desirable to offset the potential underestimation of lining forces resulting from the use of equivalent static model in lieu of the dynamic loading condition. Previous studies suggest that a true dynamic solution would yield results that are 10 to 15 percent greater than an equivalent static solution, provided that the seismic wavelength is at least about 8 times greater than the width of the excavation (cavity). Therefore, the full-slip model is recommended in evaluating the moment and deflection response (i.e., Figure 13-16 and Equation 13-15) of a circular tunnel lining. Using the full-slip condition, however, would significantly underestimate the maximum thrust, Tmax, under the seismic simple shear condition. Therefore, it is recommended that the no-slip interface assumption be used in assessing the lining thrust response (Equation13-16). Effective Lining Stiffness: The results presented above are based on the assumption that the lining is a monolithic and continuous circular ring with intact, elastic properties. Many circular tunnels are constructed with bolted or unbolted segmental lining. Besides, a concrete lining subjected to bending and thrust often cracks and behaves in a nonlinear fashion. Therefore, in applying the results presented herewith, the effective (or, equivalent) stiffness of the lining should be used. Some simple and approximate methods accounting for the effect of joints on lining stiffness can be found in the literature
FHWA-NHI-09-010 13-Seismic Considerations
13-29 Road Tunnel Manual March 2009

• Monsees and Hansmire (1992) suggested the use of an effective lining stiffness that is one-half of the
stiffness for the full lining section. • Analytical studies by Paul, et al., (1983) suggested that the effective stiffness be from 30 to 95
percent of the intact, full-section lining. • Muir Wood (1975) and Lyons (1978) examined the effects of joints in precast concrete segmental
linings and showed that for a lining with “n” segments, the effective stiffness of the ring was:
⎛ 4 ⎞ 2
I = I + ⎜ ⎟ Ie j 13-19 ⎝ n ⎠
Where: Ie < I and n > 4 I = Lining stiffness of the intact, full-section Ij = Effective stiffness of lining at joint Ie = Effective stiffness of lining
13.5.1.3 Analytical Lining-Ground Interaction Solutions for Racking Response of Rectangular
Tunnels General: Shallow depth transportation tunnels are often of rectangular shape and are often built using the cut-and-cover method. Usually the tunnel is designed as a rigid frame box structure. From the seismic design standpoint, these box structures have some characteristics that are different from those of the bored circular tunnels, besides the geometrical aspects. The implications of three of these characteristics for seismic design are discussed below. First, cut-and-cover tunnels are generally built at shallow depths in soils where seismic ground deformations and the shaking intensity tend to be greater than at deeper locations, due to the lower stiffness of the soils and the site amplification effect. As discussed earlier, past tunnel performance data suggest that tunnels built with shallow soil overburden cover tend to be more vulnerable to earthquakes than deep ones. Second, a box frame usually does not transmit the static loads as efficiently as a circular lining, resulting in much thicker walls and slabs for the box frame. As a result, a rectangular tunnel structure is usually stiffer than a circular tunnel lining in the transverse direction and less tolerant to distortion. This characteristic, along with the potential large seismic ground deformations that are typical for shallow soil deposits, makes the soil-structure interaction effect particularly important for the seismic design of cutand-cover rectangular tunnels, including those built with the sunken/immersed tube method. Third, typically soil is backfilled above the structure and possibly between the in-situ medium and the structure. Often, the backfill soil may consist of compacted material having different properties than the in-situ soil. The properties of the backfill soil as well as the in-situ medium should be properly accounted for in the design and analysis. The effect of backfill, however, cannot be accounted for using analytical closed-form solutions. Instead, more complex numerical analysis is required for solving this problem if the effect of backfill is considered significant in evaluating seismic response of a cut-and-cover tunnel.
FHWA-NHI-09-010 13-Seismic Considerations
13-30 Road Tunnel Manual March 2009
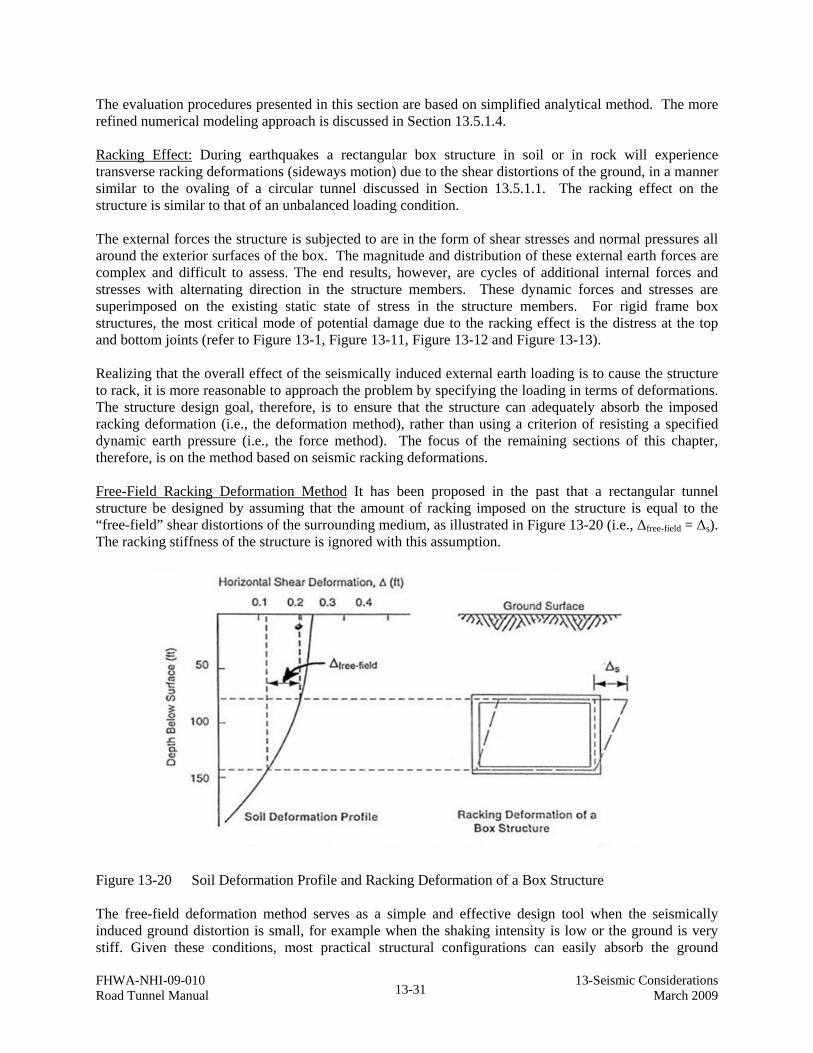
The evaluation procedures presented in this section are based on simplified analytical method. The more refined numerical modeling approach is discussed in Section 13.5.1.4.
Racking Effect: During earthquakes a rectangular box structure in soil or in rock will experience transverse racking deformations (sideways motion) due to the shear distortions of the ground, in a manner similar to the ovaling of a circular tunnel discussed in Section 13.5.1.1. The racking effect on the structure is similar to that of an unbalanced loading condition.
The external forces the structure is subjected to are in the form of shear stresses and normal pressures all around the exterior surfaces of the box. The magnitude and distribution of these external earth forces are complex and difficult to assess. The end results, however, are cycles of additional internal forces and stresses with alternating direction in the structure members. These dynamic forces and stresses are superimposed on the existing static state of stress in the structure members. For rigid frame box structures, the most critical mode of potential damage due to the racking effect is the distress at the top and bottom joints (refer to Figure 13-1, Figure 13-11, Figure 13-12 and Figure 13-13).
Realizing that the overall effect of the seismically induced external earth loading is to cause the structure to rack, it is more reasonable to approach the problem by specifying the loading in terms of deformations. The structure design goal, therefore, is to ensure that the structure can adequately absorb the imposed racking deformation (i.e., the deformation method), rather than using a criterion of resisting a specified dynamic earth pressure (i.e., the force method). The focus of the remaining sections of this chapter, therefore, is on the method based on seismic racking deformations.
Free-Field Racking Deformation Method It has been proposed in the past that a rectangular tunnel structure be designed by assuming that the amount of racking imposed on the structure is equal to the “free-field” shear distortions of the surrounding medium, as illustrated in Figure 13-20 (i.e., Δfree-field = Δs). The racking stiffness of the structure is ignored with this assumption.
Figure 13-20 Soil Deformation Profile and Racking Deformation of a Box Structure
The free-field deformation method serves as a simple and effective design tool when the seismically induced ground distortion is small, for example when the shaking intensity is low or the ground is very stiff. Given these conditions, most practical structural configurations can easily absorb the ground
FHWA-NHI-09-010 13-Seismic Considerations 13-31 Road Tunnel Manual March 2009

distortion without being distressed. The method is also a realistic one when the racking stiffness of the structure is comparable to that of its surrounding medium. It has been reported (Wang, 1993), however, that this simple procedure could lead to overly conservative design (i.e., when Δfree-field > Δs) or un-conservative design (i.e., when Δfree-field < Δs), depending on the relative stiffness between the ground and the structure. The overly conservative cases generally occur in soft soils. Seismically induced free-field ground distortions are generally large in soft soils, particularly when they are subjected to amplification effects. Ironically, rectangular box structures in soft soils are generally designed with stiff configurations to resist the static loads, making them less tolerant to racking distortions. Imposing free-field deformations on a structure in this situation is likely to result in unnecessary conservatism, as the stiff structure may deform less than the soft ground. On the other hand, the un-conservative cases arise when the shear stiffness of the ground is greater than the racking stiffness of the structures – a behavior similar to that described for the ovaling of circular tunnel (Section 13.5.1.1). To more accurately quantify the racking response of rectangular tunnel structures a rational procedure accounting for the tunnel-ground interaction effect is presented in the following section. Tunnel-Ground Interaction Analysis: Although closed-form solutions accounting for soil-structure interaction, such as those presented in Section 13.5.1.1, are available for deep circular lined tunnels, they are not readily available for rectangular tunnels due primarily to the highly variable geometrical characteristics typically associated with rectangular tunnels. Complex earthquake induced stress-strain conditions is another reason as most of the rectangular tunnels are built using the cut-and-cover method at shallow depths, where seismically induced ground distortions and stresses change significantly with depth. To develop a simple and practical design procedure, Wang (1993) performed a series of dynamic soil-structure interaction finite element analyses. In this study, the main factors that may potentially affect the dynamic racking response of rectangular tunnel structures were investigated. These factors include: • Relative Stiffness between Soil and Structure. Based on results derived for circular tunnels (see
13.5.1.1), it was anticipated that the relative stiffness between soil and structure is the dominating factor governing the soil/structure interaction. A series of analyses using ground profiles with varying properties and structures with varying racking stiffness was conducted for parametric study purpose. A special case where a tunnel structure is resting directly on stiff foundation materials (e.g., rock) was also investigated.
• Structure Geometry. Five different types of rectangular structure geometry were studied, including one-barrel, one-over-one two-barrel, and one-by-one twin-barrel tunnel structures.
• Input Earthquake Motions. Two distinctly different time-history accelerograms were used as input earthquake excitations.
• Tunnel Embedment Depth. Most cut-and-cover tunnels are built at shallow depths. Various embedment depths were used to evaluate the effect of the embedment depth effect.
A total number of 36 dynamic finite element analyses were carried out to account for the variables discussed above. Based on the results of the analyses, a simplified procedure incorporating soil-structure interaction for the racking analysis of rectangular tunnels was developed. The step-by-step procedure is outlined below (Wang, 1993).
FHWA-NHI-09-010 13-Seismic Considerations
13-32 Road Tunnel Manual March 2009

Step 1: Estimate the free-field ground strains γmax (at the structure elevation) caused by the vertically
propagating shear waves of the design earthquakes, see Section 13.5.1.1 in deriving the free-field ground strain using various methods. Determine Δ free-field, the differential free-field relative displacements corresponding to the top and the bottom elevations of the box structure (see Figure 13-20) by using the following expression:
Δ free − field = H ⋅γ max 13-20
Where:
H = height of the box structure Alternatively site-specific site response analysis may be performed to provide a more accurate assessment of Δ free-field. Site-specific site response analysis is recommended for tunnels embedded in soft soils. Step 2: Determine the racking stiffness, Ks, of the box structure from a structural frame analysis. The
racking stiffness should be computed using the displacement of the roof subjected to a unit lateral force applied at the roof level, while the base of the structure is restrained against translation, but with the joints free to rotate. The ratio of the applied force to the resulting lateral displacement yields Ks. In performing the structural frame analysis, appropriate moment of inertia values, taking into account the potential development of cracked section, should be used.
Step 3: Determine the flexibility ratio, Fr, of the box structure using the following equation:
Fr = (Gm / Ks) · (W/H) 13-21 Where:
W = Width of the box structure H = Height of the box structure Gm = Average strain-compatible shear modulus of the surrounding ground between
the top and bottom elevation of the structure Ks = Racking Stiffness of the box structure
The strain-compatible shear modulus can be derived from the strain-compatible effective shear wave velocity, Cse, see Equation 13-4). Detailed derivation of the flexibility ratio, Fr, is given by Wang (1993). Step 4: Based on the flexibility ratio obtained from Step 3 above, determine the racking coefficient, Rr,
for the proposed structure. The racking coefficient, Rr, is the ratio of the racking distortion of the structure embedded in the soil, Δs, to that of the free-field soil, Δfree-field, over the height of the structure (see Figure 13-20):
Rr = Δs / Δfree-field 13-22
From a series of dynamic finite element analyses, Wang (1993) presented results showing the relationship between the structure racking and the flexibility ratio, Fr. The values of Rr vs. Fr obtained from the dynamic finite element analyses are shown in Figure 13-21(a) and Figure 13-21(b). Also shown in these figures are curves from closed-form static solutions for circular tunnels (refer to Section 13.5.1.1). The solutions shown in the figures are from the full-slip solution presented by Wang (1993) and Penzien FHWA-NHI-09-010 13-Seismic Considerations
13-33 Road Tunnel Manual March 2009

(2000) and the no-slip solution presented by Penzien (2000). As can be seen in the figures, the curves from the closed-form solutions provide a good approximation of the finite element analysis results. These curves can therefore be used to provide a good estimate of the racking of a rectangular tunnel as a function of the flexibility ratio defined by Equation 13-21. The analytical expressions for the curves in Figure 13-21 are:
For no-slip interface condition: 4(1−ν )F
R = m r 13-23r 3 − 4ν m + Fr
For full-slip interface condition:
4(1−ν m )FrR = 13-24r 2.5 − 3ν m + Fr
Several observations can be made from Figure 13-21. When Fr is equal to zero, the structure is perfectly rigid, no racking distortion is induced, and the structure moves as a rigid body during earthquake loading. When Fr is equal to 1, the racking distortion of the structure is approximately the same as that of the soil (exactly equal to that of the soil for the no-slip interface condition). For a structure that is flexible relative to the surrounding ground, (Fr > 1), racking distortion of the structure is greater than that of the free-field. As noted by Penzien (2000), if the structure has no stiffness (i.e., Fr → ∞), Rr is approximately equal to 4(1- νm ), which is the case of an unlined cavity.
Figure 13-21 Racking Coefficient Rr for Rectangular Tunnels (MCEER-06-SP11, Modified from Wang, 1993, and Penzien, 2000)
Step 5: Determine the racking deformation of the structure, Δs, using the following relationship:
FHWA-NHI-09-010 13-Seismic Considerations
13-34 Road Tunnel Manual March 2009

Δ s =Rr · Δ free − field 13-25
Step 6: The seismic demand in terms of internal forces as well as material strains are calculated by imposing Δs upon the structure in a frame analysis as depicted in Figure 13-22 (MCEER-06SP11). Results of the analysis can also be used to determine the detailing requirements.
As indicated in Figure 13-22, two pseudo-static lateral force models are recommended. The more critical responses from the two models should be used for design. If the displacements are large enough to cause inelastic deformation of the structure, inelastic soil-structure interaction analyses should be performed to assess structural behavior and ensure adequate strength and displacement capacity of the tunnel structure.
Under the loading from the design earthquake, inelastic deformation in the structure may be allowed depending on the performance criteria and provided that overall stability of the tunnel is maintained. Detailing of the structural members and joints should provide for adequate internal strength, and ductility and energy absorption capability if inelastic deformation is anticipated.
Figure 13-22 Simplified Racking Frame Analysis of a Rectangular Tunnel (MCEER-06-SP11, Modified from Wang, 1993)
FHWA-NHI-09-010 13-Seismic Considerations
13-35 Road Tunnel Manual March 2009

Step 7: The effects of vertical seismic motions can be accounted for by applying a vertical pseudo-static
loading, equivalent to the product of the vertical seismic coefficient and the combined dead and design overburden loads used in static design. The vertical seismic coefficient can be reasonably assumed to be two-thirds of the design peak horizontal acceleration divided by the gravity. This vertical pseudo-static loading should be applied by considering both up and down direction of motions, whichever results in a more critical load case should govern.
Step 8: Seismic demands due to racking deformations and vertical seismic motions are then combined
with non-seismic loads using appropriate load combinations. A load factor of 1.0 is recommended in the load combination criteria.
13.5.1.4 Numerical Modeling Approach The analytical solutions presented in Sections 13.5.1.2 and 13.5.1.3 for transverse response of tunnel structures (i.e., ovaling for circular tunnels and racking for rectangular tunnels) have been developed based on ideal conditions and assumptions as follows: • The tunnel is of completely circular shape for ovaling response or rectangular shape for racking
response. • The material surrounding the tunnel is uniform and isotropic. • The tunnel is very deep, away from the surface so that no reflection/refraction of seismic wave from
the ground surface. • Only one single tunnel is considered. There is no interaction from other tunnel(s) or structure(s) in
proximity. The actual soil-structure system encountered in the field for underground structures are more complex than the ideal conditions described above and may require the use of numerical methods. This is particularly true in cases where a very important tunnel structure is located in a severe seismic environment.
For transverse ovaling/racking analysis, two-dimensional finite element or finite difference continuum method of analysis is generally considered adequate numerical modeling approach. The model needs to be developed with the capability of capturing SSI effects as well as appropriate depth-variable representations of the earth medium and the associated free-field motions (or ground deformations) obtained from site-response analyses of representative soil profiles.
There are three types of two-dimensional continuum method of analysis that have been used in engineering practice and they are described in the following sections.
Pseudo-Static Seismic Coefficient Deformation Method: In pseudo-static seismic coefficient deformation method, the ground deformations are generated (induced) by seismic coefficients and distributed in the finite element/finite difference domain that is being analyzed. The seismic coefficients can be derived from a separate one-dimensional, free-field site response analysis.
The pseudo-static seismic coefficient deformation method is suitable for underground structures buried at shallow depths. The general procedure in using this method is outlined below:
FHWA-NHI-09-010 13-Seismic Considerations
13-36 Road Tunnel Manual March 2009

• Perform one-dimensional free-field site response analysis (e.g., using SHAKE program). From the results of the analysis derive the maximum ground acceleration profile expressed as a function of depth from the ground surface.
• Develop the two-dimensional finite element (or finite difference) continuum model incorporating the entire excavation and soil-structure system, making sure the lateral extent of the domain (i.e., the horizontal distance to the side boundaries) is sufficiently far to avoid boundary effects. The geologic medium (e.g., soil) is modeled as continuum solid elements and the structure can be model either as continuum solid elements or frame elements. The side boundary conditions should be in such a manner that all horizontal displacements at the side boundaries are free to move and vertical displacements are prevented (i.e., fixed boundary condition in the vertical direction and free boundary condition in the horizontal direction). These side boundary conditions are considered adequate for a site with reasonably leveled ground surface subject to lateral shearing displacements due to horizontal excitations.
• The strain-compatible shear moduli of the soil strata computed from the one-dimensional site response analysis should be used in the two-dimensional continuum model.
• The maximum ground acceleration profile (expressed as a function of depth from the ground surface) derived from the one-dimensional site response analysis is applied to the entire soil-structure system in the horizontal direction in a pseudo-static manner.
• The analysis is executed with the tunnel structure in place using the prescribed horizontal maximum
acceleration profile and the strain-compatible shear moduli in the soil mass. It should be noted that this pseudo-static seismic coefficient approach is not a dynamic analysis and therefore does not involve displacement, velocity, or acceleration histories. Instead, it imposes ground shearing displacements throughout the entire soil-structure system (i.e., the two-dimensional continuum model) by applying pseudo-static horizontal shearing stresses in the ground. The pseudo-static horizontal shearing stresses increase with depth and are computed by analysis as the product of the total soil overburden pressures (representing the soil mass) and the horizontal seismic coefficients. The seismic coefficients represent the peak horizontal acceleration profile derived from the one-dimensional free-field site response analysis. The lateral extent of the domain in the two-dimension analysis system should be sufficiently far to avoid boundary effects. In this manner, the displacement profiles at the two side boundaries are expected to be very similar to that derived from the one-dimensional free-field site response analysis. However, in the focus area near the tunnel construction the displacement distribution will be different from that of the free field, reflecting the effects of soil-structure interaction (i.e., presence of the tunnel structure) as well as the effect that portion of the earth mass is removed for constructing the tunnel (i.e., a void in the ground).
Pseudo-Dynamic Time-History Analysis The procedure employed in pseudo-dynamic analysis is similar to that for the pseudo-static seismic coefficient deformation method, except that the derivation of the ground displacements and the manner in which the displacements are imposed to the two dimension continuum system are different. The pseudo-dynamic analysis consists of stepping the soil-structure system statically through displacement time-history simulations of free-field displacements obtained by a site response analysis performed using vertically propagating shear waves (e.g., SHAKE analyses). Under the pseudo-dynamic loading, the transverse section of a tunnel structure will be subject to these induced ground distortions. Figure 13-23 shows an example of a two-dimensional continuum finite element analysis performed for an immersed tube tunnel structure subject to static stepping of a pseudo-dynamic displacement time history. In this model both the geologic medium (e.g., soil) and the tunnel structure were modeled as continuum solid elements. As indicated in the figure, in addition to the natural in-situ soils, the model can also consider the effect of the backfill material (within the dredged trench) on the ovaling/racking response of the tunnel structure. If warranted, the inelastic behavior of the tunnel structure can also be accounted for and incorporated into the model. FHWA-NHI-09-010 13-Seismic Considerations
13-37 Road Tunnel Manual March 2009

Figure 13-23 Example of Two-dimensional Continuum Finite Element Model in Pseudo-Dynamic Displacement Time-History Analysis
The model shown in Figure 13-23 includes both the geologic medium and the structure in one model. Alternatively, the analysis can also be performed in a de-coupled manner, where the tunnel structure is analyzed separately from the surrounding geologic medium. This de-coupled analysis involves the following two general steps:
• Computing the scattered ground displacements at the perimeter of the tunnel cavity subject to the design earthquake, without the tunnel structure (note that these are the scattered motions and not the free-field motions, due to the presence of the cavity in the ground). A two-dimensional site response analysis is generally performed using continuum finite element/difference plane-strain model to derive these scattered ground displacements. The soil (continuum) models and the associated properties shall be consistent with the soil strain levels that are expected to develop during the earthquake excitations (i.e., using strain level compatible soil properties).
• Impose the displacements obtained at the perimeter of the tunnel cavity onto the tunnel structure (e.g., a frame model) through interaction soil springs to evaluate the seismic response of the tunnel structure. When appropriate, the interface conditions between the tunnel frame and the surrounding soil should allow for the formation of gaps as well as slippage.
FHWA-NHI-09-010 13-Seismic Considerations
13-38 Road Tunnel Manual March 2009

Dynamic Time History Analysis: Generally, the inertia of a tunnel is small compared to that of the surrounding geologic medium. Therefore, it is reasonable to perform the tunnel deformation analysis using pseudo-static or pseudo-dynamic analysis in which displacements or displacement time histories are statically applied to the soil-structure system. The dynamic time history analysis can be used to further refine the analysis when necessary, particularly when some portion(s) of the tunnel structure can respond dynamically under earthquake loading, i.e., in the case where the inertial effect of the tunnel structure is considered to be significant.
In a dynamic time history analysis, the entire soil-structure system is subject to dynamic excitations using ground motion time histories as input at the base of the soil-structure system. The ground motion time histories used for this purpose should be developed to match the target design response spectra and have characteristics that are representative of the seismic environment of the site and the site conditions (refer to Section 13.2.3).
Figure 13-24 shows a sample dynamic time history analysis using a two-dimensional continuum finite difference model for a cut-and-cover box structure. It should be noted in the figure that, the side boundary conditions in a dynamic time history analysis should be in such a manner that out-going seismic waves be allowed to pass through instead of being trapped within the soil-structure system being analyzed. Special energy absorbing boundaries should be incorporated into the model to allow radiation of the seismic energy rather than trapping it.
Figure 13-24 Sample Dynamic Time History Analysis Model
13.5.2 Evaluation of Longitudinal Response of Tunnel Structures Similar to the procedures discussed for the evaluation of transverse response of tunnel structures, the evaluation procedures for the longitudinal response of tunnel structures can also be based on either simplified analytical method or more complex numerical modeling approach, depending on the degree of complexity of the soil-structure system, the seismic hazard level, and the importance of the structures. Section 13.5.2.1 discusses the simplified free-field deformation method, which ignores the soil-structure interaction effects. A refined method is then presented in Section 13.5.2.2 that considers the soil-structure
FHWA-NHI-09-010 13-Seismic Considerations
13-39 Road Tunnel Manual March 2009

interaction effects based on analytical beam-on-elastic-foundation theory. The more comprehensive and complex method using numerical modeling approach is discussed in Section 13.5.2.3.
13.5.2.1 Free-field Deformation Procedure
This procedure assumes that the tunnel lining conforms to the axial and curvature deformations of the ground in the free-field (i.e., without the presence of the tunnel). While conservative, this assumption provides a reasonable evaluation because, in most cases, the tunnel lining stiffness is considered relatively flexible to that of the ground. This procedure requires minimum input, making it useful as an initial design tool and as a method of design verification.
The lining will develop axial and bending strains to accommodate the axial and curvature deformations imposed by the surrounding ground. St. John and Zahran (1987) developed solutions for these strains due to compression P-waves, shear S-waves, and Rayleigh R-waves.
The strains ε due to combined axial and curvature deformations can be obtained by combining the
longitudinal strains generated by axial and bending strains as follows:
For P-waves:
VP 2 AP 2ε = cos φ + Y
2 sinφ cos φ 13-26
CP CP
For S-waves:
V AS S 3ε = sinφ cosφ + Y
2 cos φ 13-27
CS CS
For R-waves:
2 2ε = R cos φ + Y R 2
sinφ cos φ 13-28CR CR
V A
Where: VP = Peak particle velocity of P-waves at the tunnel location
VS = Peak particle velocity of S-waves at the tunnel location
VR = Peak particle velocity of R-waves at the tunnel location
AP = Peak particle acceleration of P-waves at the tunnel location
AS = Peak particle acceleration of S-waves at the tunnel location
AR = Peak particle acceleration of R-waves at the tunnel location
CP = Apparent propagation velocity of P-waves
CS = Apparent propagation velocity of S-waves
CR = Apparent propagation velocity of R-waves
FHWA-NHI-09-010 13-Seismic Considerations
13-40 Road Tunnel Manual March 2009

Y = Distance from neutral axis of tunnel cross section to the lining extreme fiber φ = Angle at which seismic waves propagate in the horizontal plane with respect to the tunnel axis It should be noted that:
• S-waves generally cause the largest strains and are the governing wave type • The angle of wave propagation, φ, should be the one that maximizes the combined axial strains.
The horizontal propagation S-wave velocity, CS , in general, reflects the seismic shear wave propagation
through the deeper rocks rather than that of the shallower soils where the tunnel is located. In general, this velocity value varies from about 2 to 4 km/sec. Similarly, the P-wave propagation velocities, CP , generally vary between 4 and 8 km/sec. The designer should consult with experienced geologists/seismologists for determining CS and CP . In the absence of site-specific data, the horizontal
propagation S-wave and P-wave velocities can be assumed to be 2.5 km/sec and 5 km/sec, respectively. When the tunnel is located at a site underlain by deep deposits of soil sediments, the induced strains may be governed by the R-waves. In such deposits, detailed geological/seismological analyses should be performed to derive a reliable estimate of the apparent R-wave propagation velocity, CR .
The combined strains calculated from Equations 13-26, 13-27, and 13-28 represent the seismic loading effect only. To evaluate the adequacy of the structure under the seismic loading condition, the seismic loading component has to be added to the static loading components using appropriated loading combination criteria developed for the structures. The resulting combined strains are then compared against the allowable strain limits, which should be developed based on the performance goal established for the structures (e.g., the required service level and acceptable damage level). 13.5.2.2 Procedure Accounting for Soil-Structure Interaction Effects If a very stiff tunnel is embedded in a soft soil deposit, significant soil-structure interaction effects exist, and the free-field deformation procedure presented above may lead to an overly conservative design. In this case, a simplified beam-on-elastic-foundation procedure should be used to account for the soil-structure interaction effects. According to St. John and Zahran (1987), the effects of soil-structure interaction can be accounted for by applying reduction factors to the free-field axial strains and the free-field curvature strains, as follows: For axial strains:
E π ⎞2
R = 1+ l Al ⎛ 2⎜ ⎟ cos 2 φ 13-29 Ka ⎝ L ⎠
FHWA-NHI-09-010 13-Seismic Considerations
13-41 Road Tunnel Manual March 2009

For bending strains:
E I ⎛ 2π ⎞
4
l l 4R = 1+ ⎜ ⎟ cos φ 13-30 Kh ⎝ L ⎠
Where: El = Young’s modulus of tunnel lining
Al = Cross sectional area of the lining
K h = Transverse soil spring constant
K a = Longitudinal soil spring constant
L = Wave length of the P-, S-, or R-waves
I l = Moment of inertia of the lining cross section.
It should be noted that the axial strain calculated using the procedure presented above should not exceed the value that could be developed using the maximum frictional forces, Qmax , between the lining and the
surrounding soils. Q can be estimated using the following expression:
fLQmax = 13-314
max
Where: f = Maximum frictional force per unit length of the tunnel
13.5.2.3 Numerical Modeling Approach Numerical modeling approach for the evaluation of longitudinal response of a tunnel structure is desirable for cases where tunnels encounter abrupt changes in structural stiffness or run through highly variable subsurface conditions (where the effect of spatially varying ground motions due to local site effect becomes significant). These conditions include, but are not limited to, the following: • When a regular tunnel section is connected to a station end wall or a rigid, massive structure such as a
ventilation building. • At the junctions of two tunnels or at the tunnel/cross-passage interface. • When a tunnel traverses two distinct geological media with sharp contrast in stiffness, for example, a
tunnel passing through a soil/rock interface. • When a tunnel is locally restrained from movements by any means (i.e., “hard spots”).
Numerical analysis for the evaluation of longitudinal response of a tunnel structure is typically performed by a three-dimensional pseudo-dynamic time history analysis in order to capture the two primary modes of deformation: axial compression/extension and curvature deformations. As discussed previously, since the inertia of a tunnel is small compared to that of the surrounding geologic medium, the analysis is generally performed by using the pseudo-dynamic approach in which free-field displacement time histories are statically applied to soil springs connected to the model of the tunnel (to account for the soil-structure interaction effect). The general procedure for the pseudo-dynamic time history analysis in the longitudinal direction involves the following steps. FHWA-NHI-09-010 13-Seismic Considerations
13-42 Road Tunnel Manual March 2009

• The free-field deformations of the ground at the tunnel elevation are first determined by performing dynamic site-response analyses. For the longitudinal analysis, the three-dimensional effects of ground motions as well as the local site effect including its spatially varying effect along the tunnel alignment should be considered. The effect of wave travelling/phase shift should also be included in the analysis.
• Based on results from the site response analyses, the free-field ground displacement time histories are developed along the tunnel axis. The free-field displacement time histories at each point along the tunnel axis can be defined at the mid-height and mid-width of the tunnel, can be further defined in terms of three time-history displacements representing ground motions in the longitudinal, transverse and vertical directions.
• A three-dimensional finite element/difference structural model is then developed along the tunnel axis. In this model, the tunnel is discretized spatially along the tunnel axis, while the surrounding soil/ground is represented by discrete springs. If inelastic structural behaviour is expected, non-linear inelastic structural elements should be used to represent the tunnel structure in the model. Similar to the ground motions, the soil/ground springs are also developed in the longitudinal, transverse horizontal and transverse vertical directions. The properties of the springs shall be consistent with those used in the site response analysis in described above. If non-linear, the behaviour of the soil/ground should be reflected in the springs. As a minimum, the ultimate frictional (drag) resistance (i.e., the maximum frictional force) between the tunnel and the surrounding soil/ground should be accounted for in deriving the longitudinal springs to allow slippage mechanism, should it occur.
• The computed design displacement time-histories described above are then applied, in a statically stepping manner, at the support ends of the soil/ground springs to represent the soil-tunnel interaction. The resulting sectional forces and displacements in the structural elements (as well as in the tunnel joints if applicable) are the seismic demands under the axial/curvature deformation effect.
13.6 SEISMIC EVALUATION PROCEDURES - GROUND FAILURE EFFECTS As mentioned earlier, the greatest risk to tunnel structures is the potential for large ground movements as a result of unstable ground conditions (e.g., liquefaction and landslides) or fault displacements. In general, it is not feasible to design a tunnel structure to withstand large ground displacements. The proper design measures in dealing with the unstable ground conditions may consist of: • Ground stabilization • Removal and replacement of the problem soils • Re-route or deep burial to bypass the problem zone With regard to the fault displacements, the best strategy is to avoid any potential crossing of active faults. If this is not possible, then the general design philosophy is to accept and accommodate the displacements by either employing an oversized excavation, perhaps backfilled with compressible/collapsible material, or using ductile lining to minimize the instability potential of the lining. In cases where the magnitude of the fault displacement is limited or the width of the sheared fault zone is considerable such that the displacement is dissipated gradually over a distance, design of a strong lining to resist the displacement may be technically feasible. The structures, however, may be subject to large axial, shear and bending forces. Many factors need to be considered in the evaluation, including the stiffness of the lining and the ground, the angle of the fault plane intersecting the tunnel, the width of the fault, the magnitude as well as orientation of the fault movement. Analytical procedures are generally used for evaluating the effects of fault displacement on lining response. Some of these procedures were originally developed for buried pipelines (ASCE Committee on Gas and Liquid Fuel Lifelines, 1984). Continuum finite-element or finite-difference methods have also been used effectively for evaluating the tunnel-ground-faulting interaction effects.
FHWA-NHI-09-010 13-Seismic Considerations
13-43 Road Tunnel Manual March 2009

The following sections will discuss briefly the general considerations and methodology used in dealing with various types of ground failure effects.
13.6.1 Evaluation for Fault Rupture
General: Assessing the behavior of a tunnel that may be subject to the direct shear displacements along a fault includes, first, characterizing the free-field fault displacement (i.e., displacements in the absence of the tunnel) where the fault zone crosses the tunnel and, second, evaluating the effects of the characterized displacements on the tunnel.
Figure 13-25 is an example of such a relationship, which shows that the amount of displacement is strongly dependent on earthquake magnitude and can reach maximum values of several feet or even tens of feet for large-magnitude earthquakes.
Analyzing Tunnels for Fault Displacement: When subjected to fault differential displacements, a buried structure with shear and bending stiffness tends to resist the deformed configuration of the fault offset, which induces axial and shear forces and bending moments in the structure. The axial deformation is resisted by the frictional forces that develop at the soil-tunnel interface in the axial direction, while shear and curvature deformations are caused by the soil resistance normal to the tunnel lining or walls.
Figure 13-25 Maximum Surface Fault Displacement vs. Earthquake Moment Magnitude, Mw
(Wells and Coppersmith, 1994)
FHWA-NHI-09-010 13-Seismic Considerations
13-44 Road Tunnel Manual March 2009

In general, analytical procedures for evaluating tunnels subjected to fault displacements can follow those used for buried pipelines. Three analytical methods have been utilized in the evaluation and design of linear buried structures (ASCE Committee on Gas and Liquid Fuel Lifelines, 1984). They are: (1) Newmark-Hall procedure, (2) Kennedy et al. procedure, and (3) Finite element approach. For detailed evaluation of transportation tunnels at fault crossing, however, it is generally believed that finite element method is more appropriate than other methods. The finite element method is preferred because it can incorporate realistic models of the tunnel and surrounding geologic media. The tunnel is modeled using finite elements, which may incorporate nonlinear behavior (Figure 13-26).
Figure 13-26 Analytical Model of Tunnel at Fault Crossing (ASCE, 1984)
FHWA-NHI-09-010 13-Seismic Considerations 13-45 Road Tunnel Manual March 2009

Transverse and axial springs connected to the tunnel model soil normal pressures on the tunnel lining or walls and axial frictional resistance (Figure 13-27); these springs may also incorporate nonlinear behavior if applicable (Figure 13-28). Many commercially available finite element codes may be considered for analyzing the response of tunnels to fault displacement.
Figure 13-27 Tunnel-Ground Interaction Model at Fault Crossing (ASCE Committee on Gas and Liquid Fuel Lifelines, 1984)
FHWA-NHI-09-010 13-Seismic Considerations 13-46 Road Tunnel Manual March 2009

Figure 13-28 Analytical Model of Ground Restraint for Tunnel at Fault Crossing (ASCE Committee on Gas and Liquid Fuel Lifelines, 1984)
FHWA-NHI-09-010 13-Seismic Considerations
13-47 Road Tunnel Manual March 2009
13.6.2 Evaluation for Landsliding or Liquefaction If liquefiable soil deposits or unstable soil masses susceptible to landsliding are identified along the tunnel alignment, then more detailed evaluations may be required to assess whether liquefaction or landsliding would be expected to occur during the design earthquake and to assess impacts on the tunnel. If slope movements due to landsliding or lateral spreading movements due to liquefaction intersect a tunnel, the potential effects of these movements on the tunnel are similar to those of fault displacement. As is the case for fault displacements, tunnels generally would not be able to resist landsliding or lateral spreading concentrated displacements larger than a few inches without experiencing locally severe damage. If liquefaction were predicted to occur adjacent to a tunnel lining or wall, a potential consequence could be yielding of the lining or wall due to the increased lateral earth pressure in the liquefied zone. The pressure exerted by a liquefied soil may be as large as the total overburden pressure. The potential for liquefaction to cause uplift of a tunnel embedded in liquefied soil, or for the tunnel to settle into the soil, should also be checked.
FHWA-NHI-09-010 13-Seismic Considerations
13-48 Road Tunnel Manual March 2009