full year and fourth quarter 2012 results presentation · full year and fourth quarter 2012 results...
TRANSCRIPT

Delivering Growth and Returns
First Resources Limited
Full Year and Fourth Quarter 2012
Results Presentation
27 February 2013 | Singapore

2
Table of Contents
Executive Summary 3
Financial Performance 5
Operational Performance 13
Growth Strategy 19

3
Executive Summary
Record Financial Performance
Record-high EBITDA of US$322.8 million in FY2012, an increase of 9.5%
Record-high Underlying Net Profit of US$211.3 million, an increase of 25.5%
Driven mainly by higher sales volumes
Record Production Volumes and Yield
Record-high FFB and CPO production volumes, an increase of 14.2% and 16.3%
respectively
CPO yield reached a high of 5.4 tonnes per hectare
Increased Contributions by Refinery and Processing Business
Refinery and Processing segment contributed 32.5% and 9.3% of Group’s Sales and
EBITDA respectively (FY2011: 28.5% and 9.1%)
Record-Breaking Year

4
Executive Summary
Dividend
Proposing final dividend of 2.75 Singapore cents per share
Interim dividend of 1.25 Singapore cents per share paid in September 2012, bringing total
FY2012 dividend to 4.00 Singapore cents per share
Dividend Payout FY2012 FY2011 FY2010 FY2009 FY2008
Interim Dividend Per Share (Singapore cents) 1.25 1.00 1.00 1.00 1.40
Final Dividend Per Share (Singapore cents) 2.75 2.50 1.90 1.18 -
Total Dividend Per Share (Singapore cents) 4.00 3.50 2.90 2.18 1.40
% Growth 14% 21% 33% 56% n.a.
% of Underlying Net Profit 25% 25% 30% 30% 17%
Committed to dividend payout in line with Company’s performance
n.a. : not applicable

Financial Performance

6
Income Statement Highlights
US$ million FY2012 FY2011 Change 4Q2012 4Q2011 Change
Sales 603.4 494.6 22.0% 134.1 158.2 (15.2%)
Cost of sales (221.2) (148.7) 48.7% (41.9) (46.4) (9.6%)
Gross profit 382.2 345.9 10.5% 92.2 111.9 (17.6%)
Gains arising from changes in fair
value of biological assets 35.8 39.2 (8.7%) 35.8 39.2 (8.7%)
EBITDA(1) 322.8 294.7 9.5% 76.5 95.1 (19.6%)
Net profit(2) 237.1 196.4 20.7% 73.1 77.8 (6.1%)
Underlying net profit(3) 211.3 168.4 25.5% 47.3 49.8 (5.0%)
Gross profit margin 63.3% 69.9% 68.7% 70.7%
EBITDA margin 53.5% 59.6% 57.0% 60.1%
(1) Profit from operations adjusted for depreciation, amortisation and gains arising from changes in fair value of biological assets
(2) Profit attributable to owners of the Company
(3) Profit attributable to owners of the Company excluding net gains arising from changes in fair value of biological assets

7
Segmental Results
US$ million FY2012 FY2011 Change 4Q2012 4Q2011 Change
Sales
Plantations and Palm Oil Mills 504.4 441.1 14.4% 129.9 129.0 0.7%
• Crude Palm Oil 455.0 388.6 17.1% 120.2 118.8 1.2%
• Palm Kernel 49.4 52.5 (5.9%) 9.6 10.2 (5.1%)
Refinery and Processing 243.2 175.5 38.6% 36.8 66.4 (44.6%)
Inter-segment elimination (144.2) (122.0) 18.2% (32.6) (37.1) (12.3%)
603.4 494.6 22.0% 134.1 158.2 (15.2%)
EBITDA
Plantations and Palm Oil Mills 292.9 267.9 9.3% 73.1 83.3 (12.3%)
Refinery and Processing 29.9 26.8 11.4% 3.4 11.8 (71.4%)
322.8 294.7 9.5% 76.5 95.1 (19.6%)

8
Segmental Sales and EBITDA – FY2012
Plantations and Palm Oil Mills – 67.5%
Refinery and Processing – 32.5%
Plantations and Palm Oil Mills – 90.7%
Refinery and Processing – 9.3%
Sales(1)
EBITDA
(1) Sales by business segment is stated before inter-segment elimination
The Plantations and Palm Oil Mills segment remains the Group’s main earnings driver.

9
Segmental Sales Volume
Tonnes FY2012 FY2011 Change 4Q2012 4Q2011 Change
Sales Volume
Plantations and Palm Oil Mills(1)
• Crude Palm Oil 516,012 422,598 22.1% 142,861 129,463 10.3%
• Palm Kernel 123,774 96,177 28.7% 32,469 26,989 20.3%
Refinery and Processing 223,809 141,690 58.0% 37,403 53,128 (29.6%)
Overall increase in sales volumes of CPO and PK in tandem with increase in production volumes
Significant increase in sales of processed palm based products in 2012 due to the ramping up of operations
at the Group’s processing plants and increase in purchases of third-party palm oil products
(1) Sales volume include inter-segment sales

10
Review of Key Performance Metrics
Performance Metrics FY2012 FY2011 Change
Unit Cash Cost of Production, Ex-Mill(1)
- Per tonne of nucleus CPO produced US$238 US$221
Unit EBITDA(2)
- Per tonne of nucleus CPO produced US$653 US$658
Unit EBITDA(2)
- Per hectare of mature nucleus plantation(3)
U$3,570 US$3,586
(1) Cash cost of production is derived using total cash costs of producing nucleus CPO and PK (before selling and distribution expenses and general and
administrative expenses), divided by the production volume of nucleus CPO
(2) EBITDA refers to EBITDA contribution from Plantations and Palm Oil Mills segment and not Group EBITDA
(3) Data excludes hectarage from PT Gerbang Sawit Indah (GSI), which was acquired in October 2012

11
Balance Sheet Highlights
US$ million 31 Dec 2012 31 Dec 2011
Total Assets 1,930.9 1,500.1
Cash and bank balances 404.7 210.4
Total Liabilities 773.3 571.7
Borrowings and debt securities(1) 538.2 349.6
Total Equity 1,157.6 928.4
Net Debt(2) 133.5 139.2
Net Debt(2)/Total Equity 0.12x 0.15x
Net Debt(2)/EBITDA 0.41x 0.47x
EBITDA/Interest Expense(3) 12.5x 9.9x
(1) Sum of bonds payable, Islamic MTNs, liability component of convertible bonds and borrowings from financial institutions
(2) Borrowings and debt securities less cash and bank balances
(3) Total interest/profit distribution paid/payable on borrowings and debt securities

12
Biological Assets
Biological assets increased by US$88.1 million to US$844.0 million
Increase in biological assets due to new plantings, the acquisition of PT Gerbang Sawit
Indah and fair valuation gains in 2012
Total nucleus planted area of 125,805 hectares of oil palm
Average value per nucleus hectare ~ US$6,700
Assumptions in valuer’s discounted cash flow model include :
Long term projected selling prices of CPO
Discount rate
Average yield of oil palm trees

Operational Performance

14
FY2012 FY2011 Change 4Q2012 4Q2011 Change
Production
FFB Total (tonnes) 2,168,983 1,898,565 14.2% 587,158 555,616 5.7%
• Nucleus 1,924,743 1,725,374 11.6% 517,677 503,125 2.9%
• Plasma 244,240 173,191 41.0% 69,481 52,491 32.4%
CPO (tonnes) 525,831 452,113 16.3% 145,201 133,062 9.1%
PK (tonnes) 123,129 103,993 18.4% 34,195 30,926 10.6%
Efficiency
FFB Yield (tonnes/ha) 23.0 22.2 6.2 6.5
CPO (tonnes/ha) 5.4 5.2 1.4 1.5
CPO Extraction Rate (%) 23.3 23.6 23.2 23.6
PK Extraction Rate (%) 5.5 5.4 5.5 5.5
Operational Highlights
Note : Data excludes production contribution and mature hectarage from PT Gerbang Sawit Indah (GSI), which was acquired in October 2012.
Strong production due to increase in mature hectarage and yield improvements
Maintained a credible oil extraction rate of 23.3%

15
Production Trends
271 299
436 442
338 374
510 503
411 427
569 518
27 28 41 42 36 38 47 52 46 56 73 69
0
100
200
300
400
500
600
1Q2010 2Q2010 3Q2010 4Q2010 1Q2011 2Q2011 3Q2011 4Q2011 1Q2012 2Q2012 3Q2012 4Q2012
’000 tonnes
FFB Nucleus FFB Plasma
71 78
111 116
88 99
132 133
110 115
155 145
0
25
50
75
100
125
150
175
1Q2010 2Q2010 3Q2010 4Q2010 1Q2011 2Q2011 3Q2011 4Q2011 1Q2012 2Q2012 3Q2012 4Q2012
’000 tonnes
FFB Production
CPO Production
Note : Data excludes production contribution from PT Gerbang Sawit Indah (GSI), which was acquired in October 2012.
16
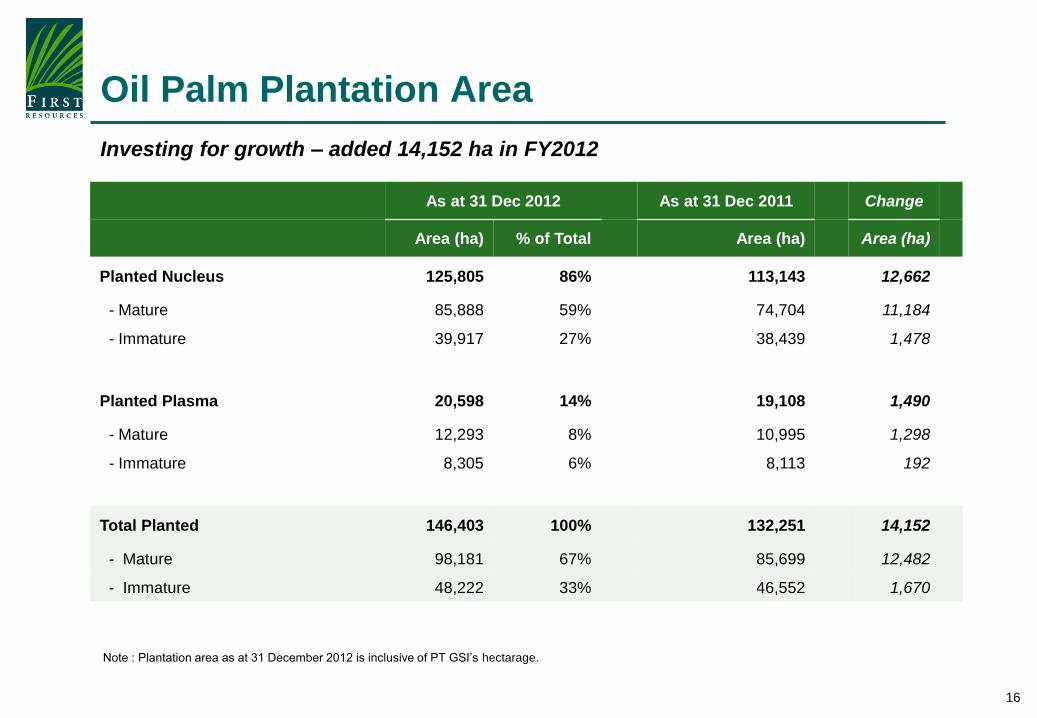
Oil Palm Plantation Area
Investing for growth – added 14,152 ha in FY2012
Note : Plantation area as at 31 December 2012 is inclusive of PT GSI’s hectarage.
As at 31 Dec 2012 As at 31 Dec 2011 Change
Area (ha) % of Total Area (ha) Area (ha)
Planted Nucleus 125,805 86% 113,143 12,662
- Mature 85,888 59% 74,704 11,184
- Immature 39,917 27% 38,439 1,478
Planted Plasma 20,598 14% 19,108 1,490
- Mature 12,293 8% 10,995 1,298
- Immature 8,305 6% 8,113 192
Total Planted 146,403 100% 132,251 14,152
- Mature 98,181 67% 85,699 12,482
- Immature 48,222 33% 46,552 1,670

17
Plantation Age Profile
Age As at 31 Dec 2012
Area (ha) % of Total
0-3 years (Immature) 48,222 33%
4-7 years (Young) 35,069 24%
8-17 years (Prime) 55,081 38%
≥ 18 years (Old) 8,031 5%
Total 146,403 100%
Immature33%
Young24%
Prime38%
Old5%
Age Profile
Weighted average age of ~ 8 years

18
Consistent and Disciplined Expansion
Total Planted Area
0
20
40
60
80
100
120
140
2004 2005 2006 2007 2008 2009 2010 2011 2012
’000 hectares
Strategy of consistent and disciplined planting
a key driver to sustainable production growth
CPO Production
0
100
200
300
400
500
600
2007 2008 2009 2010 2011 2012
’000 tonnes

Growth Strategy
20
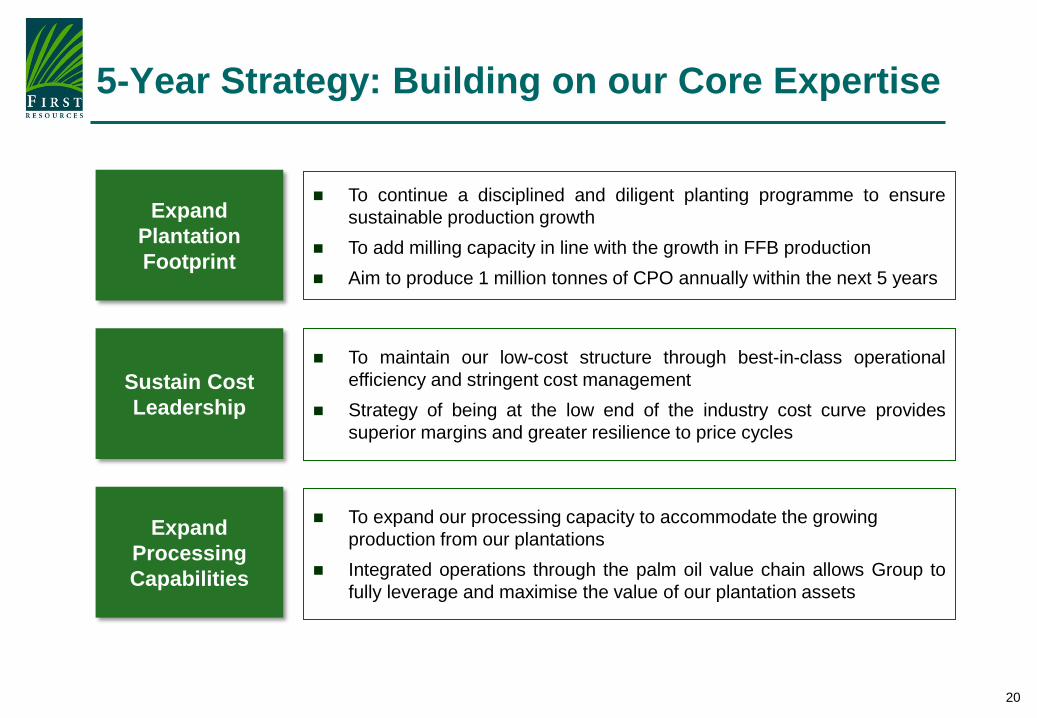
Expand
Plantation
Footprint
Sustain Cost
Leadership
Expand
Processing
Capabilities
To maintain our low-cost structure through best-in-class operational
efficiency and stringent cost management
Strategy of being at the low end of the industry cost curve provides
superior margins and greater resilience to price cycles
To expand our processing capacity to accommodate the growing
production from our plantations
Integrated operations through the palm oil value chain allows Group to
fully leverage and maximise the value of our plantation assets
5-Year Strategy: Building on our Core Expertise
To continue a disciplined and diligent planting programme to ensure
sustainable production growth
To add milling capacity in line with the growth in FFB production
Aim to produce 1 million tonnes of CPO annually within the next 5 years

21
To be a Leading Plantation Group with Integrated
Operations Throughout the Value Chain
Plantations Milling Processing
Fresh Fruit Bunches RBDPO
PFAD
RBD Olein
RBD Stearin
Biodiesel
Crude
Glycerine
PKE
PKO
Crude Palm Oil
Palm Kernel
Ac
tivit
y
As
se
ts
Pro
du
cts
Current
146,403 ha
(including plasma)
Expansion Plans
To add 15-20,000 ha per
year
Target to reach 200,000 ha
within next 5 years
Current
11 CPO mills
Capacity of 3.78 million
tonnes of FFB p.a.
Expansion Plans
2 additional mills by 2014
To add milling capacity in
line with FFB production
growth
Current
Refinery, fractionation &
biodiesel plants
Capacity of 250,000 tonnes
p.a.
Expansion Plans
To add kernel crushing
capability
To increase refinery &
fractionation capacity
Note: Data as at 31 December 2012

22
Operational Updates
Plantation Assets
Achieved new plantings of 10,125 ha of oil palm and 844 ha of rubber
Majority of new plantings carried out at the East and West Kalimantan provinces
Acquired 4,027 ha of nucleus palm oil plantation
CPO Mills
Commissioned two new mills (10th and 11th) in 2012
Raised the Group’s aggregate milling capacity to 630 tonnes of FFB per hour (3.78 million
tonnes p.a.)
Integrated Processing Complex in Riau
Private jetty with bulking facility commissioned in 2012
Kernel crushing plant expected to be operational by 1H2013
New refinery expected to be operational by 2H2013
Completed acquisition of Lynhurst(1)
Added 8,634 ha of oil palms and 11,500 ha of unplanted land bank
Added another CPO mill in West Kalimantan (i.e. the Group’s 12th CPO mill)
(1) Operational statistics as at 31 December 2012 excludes hectarage from Lynhurst Investment Pte. Ltd.

23
Plantation Development
New plantings of ~ 15,000 to 20,000 ha of oil palms and 4,000 ha of rubber
Maintenance of existing immature oil palms
Property, Equipment and Others
Infrastructure for plantation management
CPO Mills
Construction of two new mills (13th and 14th), one in Riau and one in West Kalimantan
Processing Facilities
Completion of Integrated Processing Complex
Expected capital expenditure ~ US$200 million
Capital Investments in FY2013

24
Disclaimer
This presentation has been prepared by First Resources Limited (“Company”) for informational
purposes, and may contain projections and forward-looking statements that reflect the Company’s
current views with respect to future events and financial performance. These views are based on
current assumptions which are subject to various risks and which may change over time. No
assurance can be given that future events will occur, that projections will be achieved, or that the
Company’s assumptions are correct.
The information is current only as of its date and shall not, under any circumstances, create any
implication that the information contained therein is correct as of any time subsequent to the date
thereof or that there has been no change in the financial condition or affairs of the Company since
such date. Opinions expressed herein reflect the judgement of the Company as of the date of this
presentation and may be subject to change. This presentation may be updated from time to time and
there is no undertaking by the Company to post any such amendments or supplements on this
presentation.
The Company will not be responsible for any consequences resulting from the use of this
presentation as well as the reliance upon any opinion or statement contained herein or for any
omission.

25
Contact Information
For further information, please contact:
Investor Relations
First Resources Limited 8 Temasek Boulevard
#36-02 Suntec Tower Three
Singapore 038988
Tel: +65 6602 0200
Fax: +65 6333 6711
Website: www.first-resources.com