fourth quarter & full year 2017 earnings call q4 2017... · fourth quarter & full year 2017...
TRANSCRIPT

1
Fourth Quarter & Full Year 2017 Earnings CallAlan KestenbaumExecutive Chairman and CEO
February 22, 2018
Don NewmanChief Financial Officer

DisclaimerCaution Regarding Forward-Looking Statements
From time to time, we make written or oral forward-looking statements within the meaning of applicable securities laws. We may make forward-looking statements in this presentation, in other filings withCanadian securities regulators, in other reports to shareholders and in other communications. In some cases, forward-looking statements can be identified by the use of forward-looking terminology suchas ‘‘plans’’, ‘‘targets’’, ‘‘expects’’ or ‘‘does not expect’’, ‘‘is expected’’, ‘‘an opportunity exists’’, ‘‘budget’’, ‘‘scheduled’’, ‘‘estimates’’, ‘‘outlook’’, ‘‘forecasts’’, ‘‘projection’’, ‘‘prospects’’, ‘‘strategy’’, ‘‘intends’’,‘‘anticipates’’, ‘‘does not anticipate’’, ‘‘believes’’, or variations of such words and phrases or state that certain actions, events or results ‘‘may’’, ‘‘could’’, ‘‘would’’, ‘‘might’’, ‘‘will’’, ‘‘will be taken’’, ‘‘occur’’ or‘‘be achieved’’. In addition, any statements that refer to expectations, intentions, projections or other characterizations of future events or circumstances may be forward-looking statements. Forward-looking statements are not historical facts but instead represent management’s expectations, estimates and projections regarding future events or circumstances. The forward-looking statementscontained in this document are presented for the purpose of assisting the holders of our securities and financial analysts in understanding our financial position and results of operations as at and for theperiods ended on the dates presented, as well as our financial performance objectives, vision and strategic goals, and may not be appropriate for other purposes.
This presentation includes forward-looking statements relating to, among other things: our ability to attract new customers and further develop and maintain existing customers; expectations surroundingour expansion into advanced steels; expectations concerning optimization of our assets; expectations regarding enhancing relationships with automotive customers; expectations regarding upgrades toour facilities and their effect on our revenue and costs; expectations associated with enhancements to our LEW dock facility; our ability to access a wider range of steel markets.
Forward-looking statements are based on our opinions, estimates and assumptions in light of our experience and perception of historical trends, current conditions and expected future developments, aswell as other factors that we currently believe are appropriate and reasonable in the circumstances. Despite a careful process to prepare and review the forward-looking statements, there can be noassurance that the underlying opinions, estimates and assumptions will prove to be correct. Certain assumptions in respect of the utilization of and access to our excess capacity; capital expendituresassociated with accessing such excess capacity; upgrades to our facilities and equipment; our research and development activities associated with advanced steel grades; our ability to source rawmaterials and other inputs; our ability to supply to new customers and markets; our ability to effectively manage costs; our ability to attract and retain key personnel and skilled labour; our ability to obtainand maintain existing financing on acceptable terms; currency exchange and interest rates; the impact of competition; changes in laws, rule, and regulations, including international trade regulations; andgrowth in steel markets and industry trends are material factors made in preparing the forward-looking statements and management’s expectations contained in this presentation.
Undue reliance should not be placed on forward-looking statements. Whether actual results, achievements, or performance will conform to our expectations and predictions is subject to a number ofknown and unknown uncertainties and risks which could cause actual results to differ materially from our expectations. Such risks and uncertainties include and are not limited to: risks inherent in acyclical and highly competitive industry; cash flow volatility; the strength of economies in North America, particularly the automotive sector; changes in the automotive market; global steel capacity growth;existing and new trade laws and regulations; competition from other producers, imports, or alternative materials; ability to secure commitments or future orders from new or existing customers; ability torealize higher margins on products we produce; changes in availability and cost of raw materials, electricity, and natural gas; contractual counterparty’s exercise of termination option upon change ofcontrol or default; maintenance of proper inventory levels; disruption of operations due to unforeseen circumstances such as power outages, explosions, fires, floods, accidents, and severe weatherconditions; the loss of leased property on which operating facilities are located; and other unforeseen conditions or events that could impact Stelco’s business.
The preceding lists are not exhaustive of all opinions, estimates and assumptions underlying our forward-looking statements or of all possible risk factors and other factors could also adversely affect ourresults. Additional information on these and other factors that could affect our business, operations or financial results are included in reports on file with applicable securities regulatory authorities,including but not limited to the information under the headings “Risk Factors” in our management’s discussion and analysis of financial condition and results of operations for the period ended December31, 2017 and Stelco Inc.’s management discussion and analysis of financial condition and results of operations for the year ended December 31, 2017, which may be accessed on Stelco’s SEDARprofile at www.sedar.com. The forward-looking statements contained in this presentation are made as of the date hereof. Stelco undertakes no obligation to update publicly or revise any forward-lookingstatements, whether written or oral, whether as a result of new information, future events or otherwise, except as required by law.
Information contained in or otherwise accessible through the websites mentioned herein does not form part of this presentation.
Non-IFRS Measures
This presentation makes reference to non-IFRS measures, including “Adjusted EBITDA”, “Adjusted net income”, “Adjusted EBITDA per net ton”, “Average Selling Price per net ton”, and “ShippingVolume”] [NTD: To be updated for final non-IFRS measures actually included in the presentation. These measures are not recognized measures under IFRS, do not have a standardized meaningprescribed by IFRS and therefore may not be comparable to similar measures presented by other companies. Rather, these measures are provided as additional information to complement those IFRSmeasures by providing further understanding of our results of operations from management’s perspective. Accordingly, these measures should not be considered in isolation nor as a substitute foranalysis of our financial information reported under IFRS.
Reconciliations of IFRS to non-IFRS measures as well as the rationale for their use can be found on pages 7-8, 11-12 and 22-23 of Stelco Inc.’s Management Discussion and Analysis for the year endedDecember 31, 2017, which may be accessed on Stelco Holdings’ SEDAR profile at www.sedar.com.
2

3
Earnings Call Agenda
• Q4 & FY 2017 Highlights - Alan Kestenbaum
• Financial Highlights - Don Newman
• Questions & AnswersAlan Kestenbaum
Executive Chairman & CEO
Don NewmanChief Financial Officer

4
Financial Highlights• Fourth Quarter Highlights:
• Revenue of $452 million in fourth quarter of 2017, up 45% from $312 million in fourth quarter of 2016
• Adjusted EBITDA of $69 million in fourth quarter of 2017, up 245% from $20 million in fourth quarter of 2016
• Adjusted EBITDA per nt of $117 in fourth quarter of 2017, up 172% from $43 in fourth quarter of 2016
• Shipping volume of 592 thousand tons in fourth quarter of 2017, up 28% from fourth quarter of 2016
• Full Year Highlights:
• Revenue of $1.6 billion in 2017, up 23% from $1.3 billion in 2016
• Adjusted EBITDA of $216 million in 2017, up 145% from $88 million 2016
• Adjusted EBITDA per nt of $108 in 2017, up 140% from $45 in 2016
• Balance Sheet and Liquidity:
• $519 million of liquidity as at December 31, 2017, with $250 million* of cash and $269 million of undrawn ABL revolver capacity
• No long-term debt
• Quarterly cash dividend of $0.10 per share payable March 12 to shareholders of record as of March 7
* Includes Stelco Holdings cash of $205 million and Stelco cash of $45 million.

5
Key Achievements In Past Six MonthsSa
les
Prod
uctio
n an
d Sa
les
Gro
wth
Re-established relationships with automotive OEM customers for the production and sale of higher margin coated and AHSS products
Repurposing the dock at Lake Erie to allow greater access to the US and international markets as well as increasing our flexibility to receive raw steel imports (slabs)
Secured interest from new overseas customers to expand export potential beyond the traditional North American market
Capitalized on organic growth opportunity to increase the production of steel at our Lake Erie facility. Recent maintenance on our blast furnace has resulted in a 38% improvement in the production of steel, from 2 mm tons to approximately 2.8 mm tons
Logi
stic
s Im
prov
emen
ts

6
Q4 & FY 2017 Financial Metrics & Comparisons
* See "Non-IFRS measures" below for a reconciliation of Non-IFRS measures; see also “Non-IFRS Measures” as outlined in Stelco Inc.’s Management’s Discussion & Analysis for the period ended December 31, 2017.
Fourth Quarter Full Year
($ in millions, except volume and per nt figures) 4Q ’17 4Q ‘16 Change 2017 2016 Change
Revenue 452 312 45% 1,601 1,302 23%
Operating income 54 (17) N/A 115 (9) N/A
Net income 16 (83) N/A 3,579 (236) N/A
Adjusted EBITDA * 69 20 245% 216 88 145%
Adjusted net income * 49 (47) N/A 45 (137) N/A
Adjusted EBITDA/nt * 117 43 172% 108 45 140%
Average selling price per nt * 764 674 13% 799 659 21%
Shipping volume (in thousands of nt) * 592 463 28% 2,003 1,976 1%

7
Historical Financial Results
Selling price ($/nt):
* Q3 ‘17 - conducted a planned blast furnace outage at Lake Erie Works Note: Shipping volume figures may not add due to rounding.
Sales ($ mm) Shipping Volume (knt)
Adjusted EBITDA ($ mm) Adjusted EBITDA Margin (%)
Q1 2017 Q2 2017 Q3 2017 Q4 2017 FY 2017
$386 $427 $336 $452
$1,601$774 $851 $818 $764
Q1 2017 Q2 2017 Q3 2017 Q4 2017 FY 2017
$64 $76
$7 *
$69
$216
Q1 2017 Q2 2017 Q3 2017 Q4 2017 FY 2017
17%
2%*
15%13%
18%
340 359 299 4731471121 103 78
77
3795895
499 501 411 *592
2003
Q1 2017 Q2 2017 Q3 2017 Q4 2017 FY 2017Hot Rolled Coated Cold Rolled Other

Financial Position (selected items)($ millions)
8
Stelco Holdings Stelco Inc.
As at: December 31, 2017
December 31, 2017
December 31,2016
Cash $250 $45 $188
Accounts receivable $204 $203 $237Inventories $448 $448 $314
Property, plant & equipment $279 $305 $378
Trade and other payables $309 $310 $457
Other liabilities $68 $67 $893
Long-term debt $0 $0 $1,822
Pension / OPEB $0 $0 $1,310
Employee benefit commitments $344 $344 $0
Total equity (deficiency) $497 $309 ($3,287)
9
Non-IFRS Measures*
* For further information, see “Non-IFRS Measures” above.
10
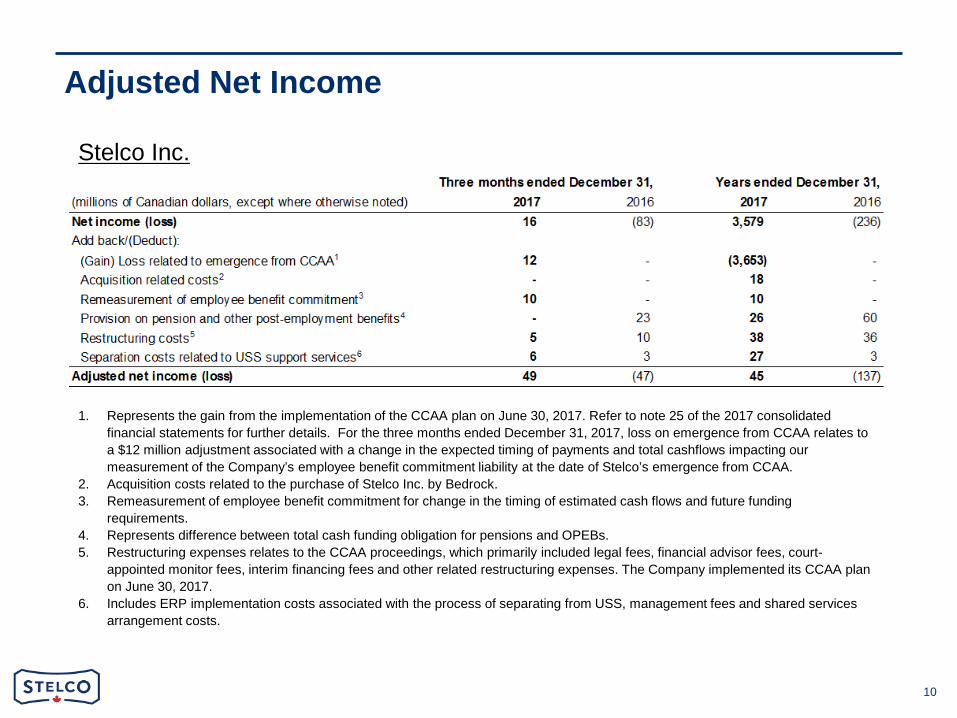
Adjusted Net Income
Stelco Inc.
1. Represents the gain from the implementation of the CCAA plan on June 30, 2017. Refer to note 25 of the 2017 consolidated financial statements for further details. For the three months ended December 31, 2017, loss on emergence from CCAA relates to a $12 million adjustment associated with a change in the expected timing of payments and total cashflows impacting our measurement of the Company’s employee benefit commitment liability at the date of Stelco’s emergence from CCAA.
2. Acquisition costs related to the purchase of Stelco Inc. by Bedrock. 3. Remeasurement of employee benefit commitment for change in the timing of estimated cash flows and future funding
requirements.4. Represents difference between total cash funding obligation for pensions and OPEBs.5. Restructuring expenses relates to the CCAA proceedings, which primarily included legal fees, financial advisor fees, court-
appointed monitor fees, interim financing fees and other related restructuring expenses. The Company implemented its CCAA plan on June 30, 2017.
6. Includes ERP implementation costs associated with the process of separating from USS, management fees and shared services arrangement costs.
11
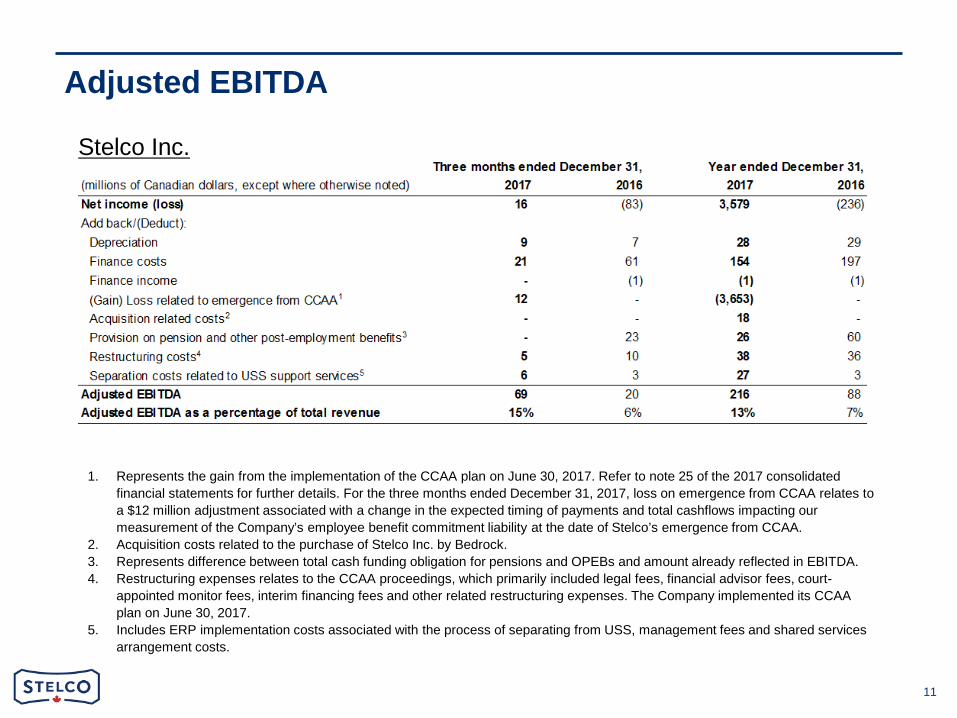
Adjusted EBITDA
1. Represents the gain from the implementation of the CCAA plan on June 30, 2017. Refer to note 25 of the 2017 consolidated financial statements for further details. For the three months ended December 31, 2017, loss on emergence from CCAA relates to a $12 million adjustment associated with a change in the expected timing of payments and total cashflows impacting our measurement of the Company’s employee benefit commitment liability at the date of Stelco’s emergence from CCAA.
2. Acquisition costs related to the purchase of Stelco Inc. by Bedrock. 3. Represents difference between total cash funding obligation for pensions and OPEBs and amount already reflected in EBITDA.4. Restructuring expenses relates to the CCAA proceedings, which primarily included legal fees, financial advisor fees, court-
appointed monitor fees, interim financing fees and other related restructuring expenses. The Company implemented its CCAA plan on June 30, 2017.
5. Includes ERP implementation costs associated with the process of separating from USS, management fees and shared services arrangement costs.
Stelco Inc.

1212