full year 2015 results - vivendi · assassin’s creed, far cry, rayman, watch dogs, rainbow six,...
TRANSCRIPT

F Y 2 0 1 5 R e s u l t s – F e b r u a r y 1 8 , 2 0 1 6
IMPORTANT NOTICE:
Financial results for the fiscal year ended December 31, 2015
Financial statements audited and prepared under IFRS
Investors are strongly urged to read the important disclaimer at the end of this presentation
FULL YEAR 2015 RESULTS
Feb. 18, 2016

F Y 2 0 1 5 R e s u l t s – F e b r u a r y 1 8 , 2 0 1 6
2
2015 HIGHLIGHTS STRATEGIC UPDATE
ARNAUD DE PUYFONTAINE Chairman of the Management Board Chief Executive Officer

F Y 2 0 1 5 R e s u l t s – F e b r u a r y 1 8 , 2 0 1 6
3
HIGHLIGHTS
* At constant currency and perimeter ** € 1/share in April 2015, € 1/share in June 2015 and € 1/share in February 2016 *** As of February 17, 2016
■ 2015 Financial outlook met
With strong increase in both UMG’s streaming and subscription services and Canal+’s
international operations, total Revenue reached €10,762m, up 1.4%*;
Despite tougher environment, Income from operations reached €1,061m, a 10.2% margin, at
constant currency and perimeter;
Adjusted Net Income of €697m, up 11.3%.
■ Good timing / value for the sale of our stakes
20% stake in Numericable-SFR;
GVT and exit of Brazil.
■ Announced return to Shareholders
€4bn** already paid;
Buyback of 73m*** shares for a total amount of €1,386m***.
■ Execution of our strategy outlined in 2014.

F Y 2 0 1 5 R e s u l t s – F e b r u a r y 1 8 , 2 0 1 6
4
■ Vivendi: a leading European content and media group
■ Investments in content
■ Interests in content production companies
■ Gameloft
■ Investments in media and distribution
■ Investments in digital platforms
■ Partnerships with telcos
■ Canal+ France channels
■ Proposed agreement with beIN Sports in France

F Y 2 0 1 5 R e s u l t s – F e b r u a r y 1 8 , 2 0 1 6
42%
24%
22%
12%
47%53%
1%
31%
13%
2%5%
41%
7%
VIVENDI TODAY: A CONTENT AND MEDIA GROUP
5
Pay TV
Recorded
Music &
Publishing
Videos
production
and distri.
Talent and
Events
■ 11.2 million subscribers of which 5.5m outside
mainland France.
■ #1 worldwide in recorded music with 34%* of market share.
■ #2 in music publishing with 23%* of market share.
■ Canal+ Group invested c. €800m in 2015 in the cinema
industry.
■ Studiocanal: the #1 European studio.
■ Talent.
■ Ticketing & Venues (Olympia, Théatre de l’Œuvre,
CanalOlympia).
Recorded
music and
merchandising
Revenues by activity
Revenues by geography
Digital
Distribution
■ World-class platforms with international footprint:
Dailymotion, Radionomy and Watchever.
■ Partnerships with telcos.
Distribution
Content
Music
publishing Other activities
PayTv
mainland
France
PayTv
international FTA TV
Films / Series production
and distribution
Rest of the
World
North America
Rest of
Europe
France
* In 2014, source: Music & Copyright

F Y 2 0 1 5 R e s u l t s – F e b r u a r y 1 8 , 2 0 1 6
■ UMG is the world leader in recorded music.
■ UMG’s labels recognized as top-of-the-class in scouting,
developing and supporting artists.
■ Laser-focused on breaking new artists and optimizing existing talent
7 Albums in the Top 10 in the USA* in 2015, including 2 of the top 3 with Taylor Swift’s “1989” and Justin
Bieber’s “Purpose”, and 9 of the Top 20 albums for the year in the UK;
The Weeknd, the biggest industry wide breakthrough around the World in 2015;
UMG also broke six artists in the U.S.: Sam Hunt, Nick Jonas, Tove Lo, Shawn Mendes, Rae Sremmurd
and Chris Stapleton. Sam Hunt was the top selling 2015 breakout artist in the U.S;
James Bay, the winner of the UK’s prestigious BBC Sound of 2015 poll, was the biggest breakthrough
artist in the UK for 2015;
In Germany, Helene Fischer was the best-selling artist of the year for the third time in four years.
6
INVESTING IN CONTENT: CONTINUOUS INVESTMENT IN OUR ARTISTS TO STRENGTHEN OUR LEADING POSITION
* 2015 Nielsen Music U.S. Report
** Scope: 59 countries
65%** of UMG sales generated by local artists in their own country
RECORDED MUSIC

F Y 2 0 1 5 R e s u l t s – F e b r u a r y 1 8 , 2 0 1 6
7
INVESTING IN CONTENT: UMG, AS THE WORLD LEADER, IS LEADING THE TRANSITION TO SUBSCRIPTION SERVICES
MUSIC INDUSTRY IN TRANSITION
■ From the sale of a product to a service, enhancing
the perceived value of music:
Playlists;
Recommendations;
30+m tracks available.
■ Multiplicity of platforms with different positioning
Competition on features and on innovation.
■ Strong growth in Streaming and Subscription sales,
which has more than offset the decline in physical
sales and downloads, accounting for 24% of UMG
recorded music revenue in H2 2015.
12%
27%
3% 42%
16% 24%
18%
3%
38%
17%
Streaming & subscription Download
Other digital Physical
Licensing and other
H2 2015
FY 2013
UMG
■ UMG is enabling successful platforms that fairly
compensate its artists.

F Y 2 0 1 5 R e s u l t s – F e b r u a r y 1 8 , 2 0 1 6
8
INVESTING IN CONTENT: INVESTING IN NEW TERRITORIES IN ORDER TO CREATE A FAVORABLE ENVIRONMENT FOR MUSIC
■ Today, the music industry is very concentrated
c. 75% of UMG revenues generated in 5
countries.
■ Music is not well monetized in non-traditional
markets
BRICS account for c. 3% of UMG revenues
only.
■ Improving trends, paving the way to future growth:
Launch of streaming services from global and
local players;
Favorable evolution of copyright protection in
some countries.
c. 75% in 5
countries
c. 3% in the
BRICS
Rest of the
World
WORLDWIDE OPPORTUNITY
UMG revenues by geography

F Y 2 0 1 5 R e s u l t s – F e b r u a r y 1 8 , 2 0 1 6
■ Studiocanal: the #1 European Studio. An average of 50 films released yearly in its three European territories*
Some 2015 successes and nominations
■ Canal+: Number 1 financer of French movie industry
Canal+ Mainland France invest c. €200m per year in European cinema.
■ UMG also invests in movies with success
“Amy”: BAFTA 2016 for best documentary, nominated at the Academy awards (Oscars)
INVESTING IN CONTENT: CINEMA AND SERIES
9
CINEMA
SERIES
■ Canal+ original programming well recognized:
Versailles, Le Bureau des Légendes, Happy Valley (2015 BAFTA for Best
Drama Series), Engrenages (Spiral - 2015 International Emmy Award for
Best Drama Series)
$ 100m+ global B.O.
Best start in UK for a SC
movie
$ 250m+ global B.O.
Academy Awards
(Oscars) 2016
18 nominations
including Best Animated
Feature: Shaun The Sheep
The Movie
Golden Globes 2016
12 nominations
Césars 2016
19 nominations
* France, UK and Germany

F Y 2 0 1 5 R e s u l t s – F e b r u a r y 1 8 , 2 0 1 6
INVESTING IN CONTENT: INTERESTS IN PRODUCTION COMPANIES
10
■ Investing in production companies in order to reinforce its value proposition in terms of content.
■ Banijay-Zodiak (26.2% interest in the combined
company): one of the most successful creators of
scripted and non-scripted programs for television and
multimedia platforms.
■ Mars Films (30% interest): a leading French feature
film producer and distributor.
■ Guilty Party*: Creation of a new UK film and TV
series production company.
■ And also, acquisition in H1 2015 of Flab Prod,
Studio+ (La Parisienne d’images) and Can’t Stop.
■ Ubisoft (14.9%** of the share capital): the 3rd worldwide independent publisher with strong franchises:
Assassin’s Creed, Far Cry, Rayman, Watch Dogs, Rainbow Six, The Crew, Just Dance…
■ Gameloft (29.8%** of the share capital): a leading company in mobile games.
VIDEOS
GAMES
* 25% interest through Studiocanal, alongside its subsidiary RED Production Company.
** As of February 10, 2016

F Y 2 0 1 5 R e s u l t s – F e b r u a r y 1 8 , 2 0 1 6
#2 world-leader in terms of
downloads
The only developer with a strong
presence on all the continents
Agreement with all the platforms
Internal advertising production entity
Agreements with more than 200 telecom
operators in more than 100 countries –
The largest distribution network
In-house franchises recognized worldwide: Asphalt, Order &
Chaos, Modern Combat, Dungeon Hunter, Dragon Mania Legends
In-house franchises account for c. 2/3 of the revenues
Partnerships with important licenses right owners: Despicable Me,
Ice Age, Brothers in Arms, My Little Pony, Spider Man, etc…
Quality recognized – several awards
c. 20 development studios
A large and diversified Portfolio :165
games intended for Smartphones and
tablets, available in 16 languages
11
GAMELOFT – A LEADING PLAYER IN ONE OF THE MOST ATTRACTIVE SEGMENT IN ENTERTAINMENT
■ Videogame is already one of the biggest segments of the media industry
■ Mobile games already account for 1/3 of the videogame industry, with the highest expected growth
■ Mobile games reach broader audience both in terms of demographics and in terms of geographical penetration
■ Gameloft has built a strong position based on a rare combination of key assets
Creative know-how
Content widely distributed Gameloft has a large number of users worldwide
164 170 181 163 173
147
20 21 23 19 22 19
Q3 14 Q4 14 Q1 15 Q2 15 Q3 15 Q4 15
Number of monthly active user
Number of daily active user
EMEA 30%
North America
25%
APAC 30%
LATAM 15%
Number of users (in millions)
Quality of the portfolio of franchises
2015 Revenues breakdown
(€256m)

F Y 2 0 1 5 R e s u l t s – F e b r u a r y 1 8 , 2 0 1 6
12
GAMELOFT AND VIVENDI COOPERATION SHOULD BENEFIT BOTH AND SHOULD BOLSTER GAMELOFT’S DEVELOPMENT
2
• Development of franchises
• Partnerships with important
right owners
• Creativity is the DNA of Vivendi
businesses
• Ability to develop new concepts
Creativity and Talent Franchises
1
3 4
• International presence
• Dailymotion, #2 world-leading
video-sharing platform with a
strong presence in Asia
• International presence
• Partnerships with Telcos
• Internal advertising production,
with an international footprint
Distribution Community - Audience

F Y 2 0 1 5 R e s u l t s – F e b r u a r y 1 8 , 2 0 1 6
Investing in African content
Launch of A+ (Oct. 2014);
25 new channels launched in 2015.
Partnership with iRoko to launch a SVOD platform.
Easy TV: DTT offer (launched in January 2016).
A strong presence of Canal+ in Africa which benefits
the whole group
Island Africa (UMG office in Abidjan);
CanalOlympia.
INVESTING IN DISTRIBUTION & MEDIA: PAY-TV INTERNATIONAL, A GROWTH OPPORTUNITY
13
706
1,083
1,552
2,073
2012 2013 2014 2015
Canal+ subscribers in Africa
Fast growing territory
Subscribers*: 2,073k
Revenues**: € 400m
Subscribers*: 2,119k
Revenues**: € 500m
POLAND
Subscribers*: 804k
Revenues**: € 51m
VIETNAM
Subscribers*: 499k
Revenues**: € 413m
OVERSEAS
AFRICA
* As of December 31, 2015
** Full year 2015
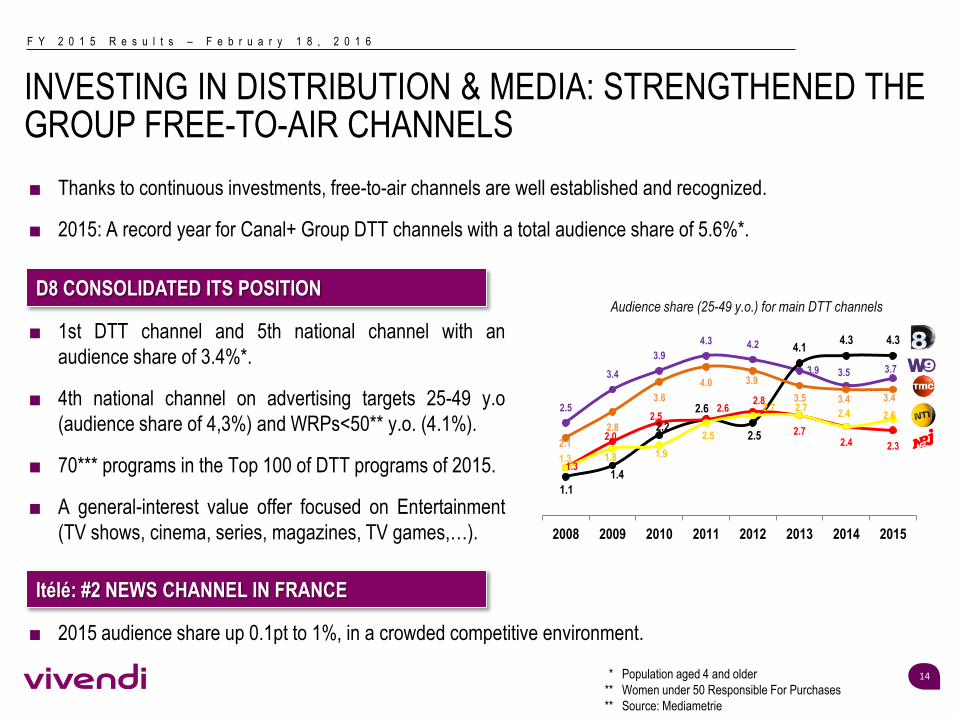
F Y 2 0 1 5 R e s u l t s – F e b r u a r y 1 8 , 2 0 1 6
■ 1st DTT channel and 5th national channel with an
audience share of 3.4%*.
■ 4th national channel on advertising targets 25-49 y.o
(audience share of 4,3%) and WRPs<50** y.o. (4.1%).
■ 70*** programs in the Top 100 of DTT programs of 2015.
■ A general-interest value offer focused on Entertainment
(TV shows, cinema, series, magazines, TV games,…).
INVESTING IN DISTRIBUTION & MEDIA: STRENGTHENED THE GROUP FREE-TO-AIR CHANNELS
14 * Population aged 4 and older
** Women under 50 Responsible For Purchases
** Source: Mediametrie
■ Thanks to continuous investments, free-to-air channels are well established and recognized.
■ 2015: A record year for Canal+ Group DTT channels with a total audience share of 5.6%*.
■ 2015 audience share up 0.1pt to 1%, in a crowded competitive environment.
D8 CONSOLIDATED ITS POSITION
Itélé: #2 NEWS CHANNEL IN FRANCE
Audience share (25-49 y.o.) for main DTT channels
2.5
3.4
3.9
4.3 4.2
3.9 3.5 3.7
1.1
1.4
2.2
2.6
2.5
4.1 4.3 4.3
2.1
2.8
3.6
4.0 3.9
3.5 3.4 3.4
1.3
2.0
2.5 2.6
2.8
2.7 2.4 2.3
1.3 1.8 1.9
2.5
2.7 2.7 2.4 2.6
0.0
1.0
2.0
3.0
4.0
5.0
2008 2009 2010 2011 2012 2013 2014 2015

F Y 2 0 1 5 R e s u l t s – F e b r u a r y 1 8 , 2 0 1 6
INVESTING IN DISTRIBUTION & MEDIA: A WORLD CLASS LEADER IN DIGITAL DISTRIBUTION
15
DAILYMOTION
■ One of the largest aggregation and digital distribution platform: 3.5bn videos viewed per month.
■ International footprint with strong audience in Asia and Latam.
■ Joint development of original and distinctive content and formats (e.g. short formats) together with the Universal
Music Group and Canal+ Group teams.
RADIONOMY
■ #1 worldwide internet radio network, with more than 123m* active listeners in December 2015.
■ Unique tools to develop and monetize FM radio’s digital audience.
■ Over 57k radio stations are currently using Radionomy tools.
WATCHEVER
■ Re-launch of Watchever in Germany, with a new design and SVOD channels in partnership with BBC First,
Disney movies on demand, CBS, MTV and UMG.
■ Vivendi became a world class leader in digital distribution through in-house platforms and bolt-on acquisitions
* Source ACPM

F Y 2 0 1 5 R e s u l t s – F e b r u a r y 1 8 , 2 0 1 6
16
■ Vivendi is an industrial and long-term investor in Telecom Italia…
21.4%* of the ordinary shares;
4 new members to Telecom Italia Board of Directors appointed in December, including 3
Vivendi representatives and 1 independent member.
■ … in order to realize ambitious projects together
Support Telecom Italia development, bringing our expertise;
Opportunity for Vivendi to expand the distribution of its content.
TELECOM ITALIA
TELEFONICA
■ Increase the distribution footprint of Vivendi content.
■ Advanced discussions to launch innovative mobile first video services across Latam this autumn.
* As of December 31, 2015
PARTNERSHIPS WITH TELCOS

F Y 2 0 1 5 R e s u l t s – F e b r u a r y 1 8 , 2 0 1 6
Canal+ channels* in France increasing negative
impact on Canal+ Group results:
ONE CHALLENGE TO ADDRESS: CANAL+ CHANNELS* IN FRANCE
17
An erosion of the subscription base
Deterioration of the value perception
Price increase for premium content rights
PAY-TV MAINLAND FRANCE IS FACING
CHALLENGES… …AND GENERATING LARGER LOSSES
Subscription base** Revenue (€ m)
* Include Canal+, Canal+ Cinema, Canal+ Sport, Canal+ Family, Canal+ Décalé, Canal+ Series
** Subscriptions with commitment only
Canal+ Group - EBITA (€ m)
Need to stop the losses at the Canal+ channels* in France which have lasted for many
years with the implementation of a transformation plan
663 611 583454
2012 2013 2014 2015
Canal+ channels in France -
EBITA (€ m)
-21 -130-188
-264
2012 2013 2014 2015
9,563 9,199 8,864 8,459
2012 2013 2014 2015
3,593 3,544 3,454 3,383
2012 2013 2014 2015

F Y 2 0 1 5 R e s u l t s – F e b r u a r y 1 8 , 2 0 1 6
ONE CHALLENGE TO ADDRESS: CANAL+ CHANNELS* IN FRANCE - IMPLEMENTATION OF A TRANSFORMATION PLAN
18
■ A tough situation, but we know what has to be done: regain perceived value by investing in what
matters to our clients.
■ Continue to invest in premium content, including
sport rights, cinema and series.
■ Increase investment in original programming
Reduce dependency on external content while
creating IPs.
■ Partnerships with European peers and telcos.
CONTENT CUSTOMER EXPERIENCE
■ Technology: investment to regain our place at the
forefront of new consumer behavior trends:
New set-top boxes with additional features;
OTT services with MyCanal;
Interface evolution.
ESSENTIAL COST SAVING AND COST EFFICIENCY
* Include Canal+, Canal+ Cinema, Canal+ Sport, Canal+ Family, Canal+ Décalé, Canal+ Series

F Y 2 0 1 5 R e s u l t s – F e b r u a r y 1 8 , 2 0 1 6
19
ONE CHALLENGE TO ADDRESS: CANAL+ CHANNELS* IN FRANCE - IMPLEMENTATION OF A TRANSFORMATION PLAN
BUSINESS: RESUME TO GROWTH
IN TERMS OF SUBSCRIBER BASE
AND REVENUES
1
BEST IN CLASS IN CUSTOMER
EXPERIENCE
2
INCREASE OUR OPERATIONAL
EFFICIENCY: TO SIMPLIFY, TO
IMPROVE, TO CHOOSE
3
Development of entry-level segment
Brand architecture redesigning
Optimization of promotional strategy
Anti-churn plan
Overhauling set-top box strategy
Digitalization of customer path
Merger of web sites
By value steering systematization
Harmonization of technical infrastructures
PRIORITIES
* Include Canal+, Canal+ Cinema, Canal+ Sport, Canal+ Family, Canal+ Décalé, Canal+ Series

F Y 2 0 1 5 R e s u l t s – F e b r u a r y 1 8 , 2 0 1 6
20
ONE CHALLENGE TO ADDRESS: CANAL+ CHANNELS* IN FRANCE - IMPLEMENTATION OF A TRANSFORMATION PLAN
CANAL+ focused on
DIGITAL, SIMPLICITY and
our SUBSCRIBERS’S SATISFACTION,
in order to deliver them
the BEST EXPERIENCE
on the market
Set-top box
Multiroom, fast zapping 4k, start
over…
Offers
Address all market segments and
consumption patterns
Services (mycanal…)
Maximize usage of our best
services
Forum
Make our customers our best
ambassadors
Customer relationship
Support our customers to offer
them the best of pay TV
Web site
Responsive, unified, audience in
the Top 15 in France
Commercial relationship
Best in class on our own
platforms
Customer service
Premium end-to-end relationship
■ The need to address all market segments and consumption patterns and redesign the customer
experience
* Include Canal+, Canal+ Cinema, Canal+ Sport, Canal+ Family, Canal+ Décalé, Canal+ Series

F Y 2 0 1 5 R e s u l t s – F e b r u a r y 1 8 , 2 0 1 6
21
PROPOSED AGREEMENT WITH BEIN SPORTS IN FRANCE
■ A 5-year agreement for the distribution of beIN Sports offers by Canal+ in France
Agreement covering all technical platforms (ADSL, DTH, OTT);
Consideration comprised of an annual minimum guaranteed amount and a revenue sharing
beyond the minimum guaranteed;
BeIN Sports committed to retain key sport rights or replacement by equivalent rights.
■ Next steps:
Review by the Antitrust Authority;
Information and consultation with the employee representative bodies of Canal+ Group.

F Y 2 0 1 5 R e s u l t s – F e b r u a r y 1 8 , 2 0 1 6
22
OUTLOOK
■ We continue to see positive momentum in the business, driven by ongoing growth in streaming
and subscription and tempered by continued declines in download and physical, leading to a
reasonable increase in results this year – and enhanced results from 2017 and onwards.
UNIVERSAL MUSIC GROUP
■ To stop the losses at the Canal+ channels* in France which could lead to a significant decline in
the operating results in 2016, we will implement a transformation plan with the objective, for the
Canal+ channels* in France, of reaching breakeven in 2018 and of achieving a level of profitability
similar to that of the best European players in the sector in the medium term.
CANAL+ GROUP
* Include Canal+, Canal+ Cinema, Canal+ Sport, Canal+ Family, Canal+ Décalé, Canal+ Series

F Y 2 0 1 5 R e s u l t s – F e b r u a r y 1 8 , 2 0 1 6
FINANCIALS
HERVE PHILIPPE Member of the Management Board Chief Financial Officer

F Y 2 0 1 5 R e s u l t s – F e b r u a r y 1 8 , 2 0 1 6
SCOPE OF CONSOLIDATION AND MAIN CURRENCIES
24
In compliance with IFRS 5, GVT qualifies as a discontinued operation from 3Q 2014, SFR from 1Q 2014 and Maroc
Telecom group from 2Q 2013 hence their earnings are reported as “Earnings from discontinued operations”.
This classification retrospectively applies to Statements of Earnings and Cash Flows.
Vivendi deconsolidated GVT, SFR and Maroc Telecom group as from May 28, 2015, November 27, 2014 and May 14, 2014,
respectively.
Constant perimeter takes into account the following:
■ the impacts of Thema at Canal+ Group in Q4/FY 2015 are excluded. As a reminder, Thema has been consolidated by Canal+
Group since October 28, 2014;
■ the 2014 impacts of l’Olympia were reclassified from UMG to Vivendi Village (following the transfer of l’Olympia from UMG to
Vivendi Village as from January 1, 2015);
■ the impacts of Dailymotion in Q4/FY 2015 are excluded. As a reminder, Dailymotion has been consolidated since June 30,
2015.
USD / EUR: 1.12 1.34 + 16.7 %
GBP / EUR: 0.73 0.81 + 9.9 %
JPY / EUR: 135 140 + 4.0 %
FY 2014
average
% Change (impact on 2015 earnings)
FY 2015
average
F Y 2 0 1 5 R e s u l t s – F e b r u a r y 1 8 , 2 0 1 6
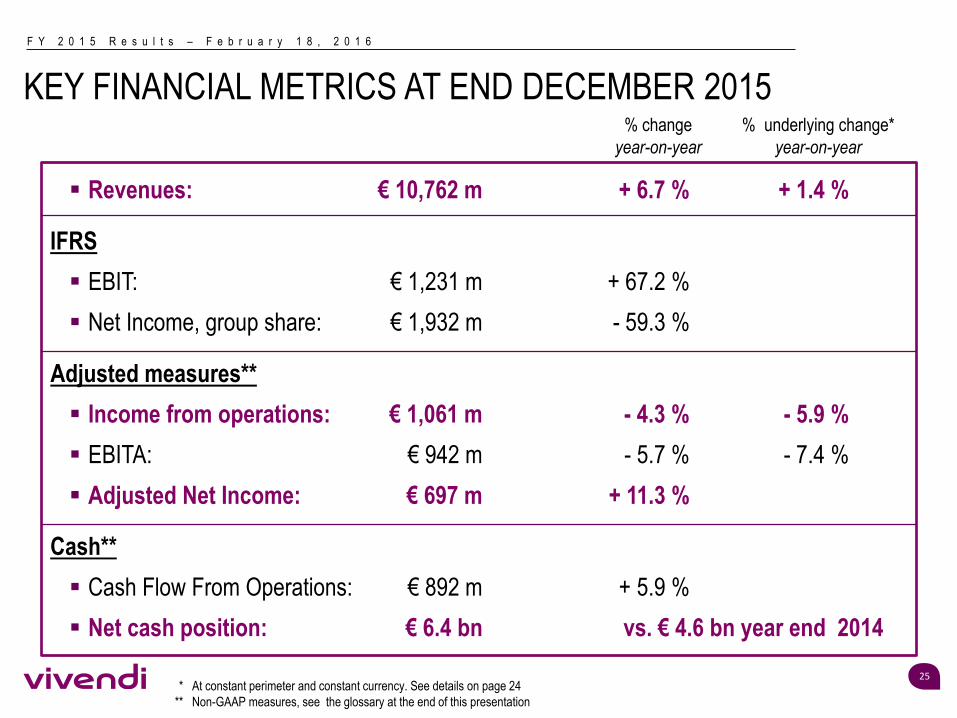
KEY FINANCIAL METRICS AT END DECEMBER 2015
25 * At constant perimeter and constant currency. See details on page 24
** Non-GAAP measures, see the glossary at the end of this presentation
Revenues: € 10,762 m + 6.7 % + 1.4 %
IFRS
EBIT: € 1,231 m + 67.2 %
Net Income, group share: € 1,932 m - 59.3 %
Adjusted measures**
Income from operations: € 1,061 m - 4.3 % - 5.9 %
EBITA: € 942 m - 5.7 % - 7.4 %
Adjusted Net Income: € 697 m + 11.3 %
Cash**
Cash Flow From Operations: € 892 m + 5.9 %
Net cash position: € 6.4 bn vs. € 4.6 bn year end 2014
% change
year-on-year
% underlying change*
year-on-year

F Y 2 0 1 5 R e s u l t s – F e b r u a r y 1 8 , 2 0 1 6
26 * At constant currency and perimeter. See details on page 24
** 2015 OTIs correspond to legal settlements included in Revenues for €56m but excluded from Income from operations and 2014 OTI
corresponds to a reversal of provisions included in Income from operations for €19m
HIGHLIGHTS
■ Revenues up 2.7%* driven by growth in all
segments.
■ Recorded music revenues up 2.4%* thanks to
growth in subscription and streaming:
■ Significant growth in subscription and streaming
revenues more than offset decline in physical and
download revenues;
■ Subscription and streaming up c. 43%* in 2015,
accounting for c. 52% of digital revenues in H2
2015, while download revenues down c. 13%* in
2015;
■ Subscription and streaming accounted for c. 52%
of digital revenues in H2 2015;
■ Revenues also benefitted from legal settlements.
■ Music publishing grew by 3.0%* largely thanks to
streaming and subscription growth, while
performance and synchronization revenue also
grew.
■ Income from operations slightly down 0.6%*.
■ As % of revenues, Income from operations margin
up +0.1pt* excluding one time items**.
■ Restructuring charges of €51m in 2015.
In euro millions - IFRS 2014 2015 Change
Constant
perimeter
and constant
currency *
Revenues 4,557 5,108 + 12.1% + 2.7%
Recorded music 3,688 4,113 + 11.5% + 2.4%
Music Publishing 673 756 + 12.4% + 3.0%
Merchandising & Other 232 276 + 19.1% + 3.5%
Intercompany Elimination (36) (37)
Income from operations 606 626 + 3.2% - 0.6%
Income from operations margin 13.3% 12.3% -1.0pt -0.4pt
Charges related to equity-settled
share-based compensation plans(2) (5)
Other special items excluded from
income from operations (including
transition and restructuring costs)
(39) (28)
EBITA 565 593 + 5.0% + 1.0%
F Y 2 0 1 5 R e s u l t s – F e b r u a r y 1 8 , 2 0 1 6
27
* At constant currency and perimeter. See details on page 24
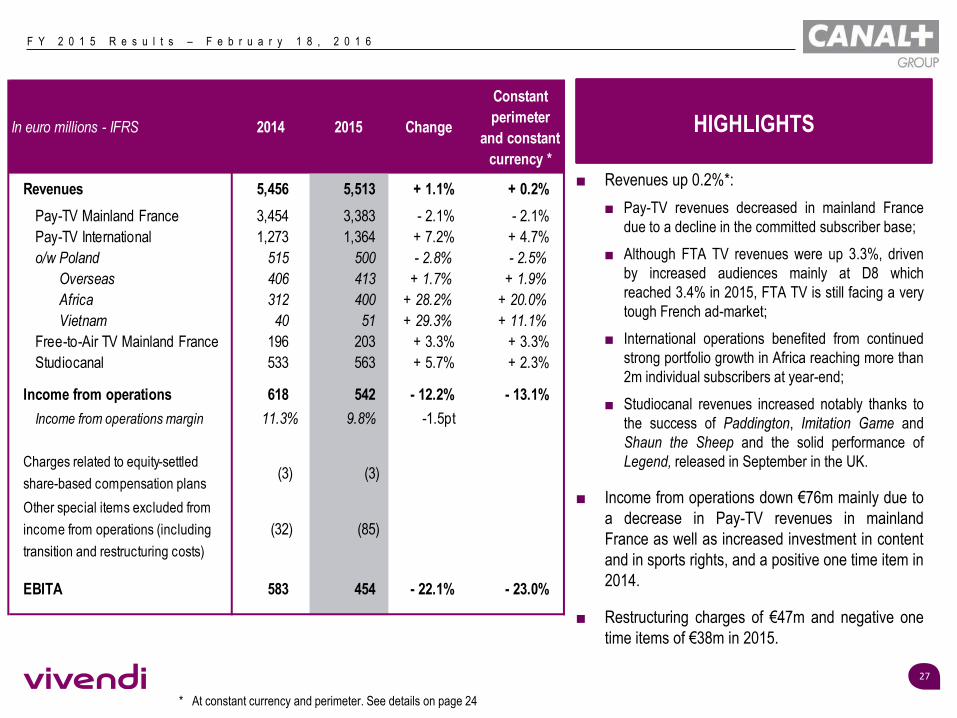
HIGHLIGHTS
■ Revenues up 0.2%*:
■ Pay-TV revenues decreased in mainland France
due to a decline in the committed subscriber base;
■ Although FTA TV revenues were up 3.3%, driven
by increased audiences mainly at D8 which
reached 3.4% in 2015, FTA TV is still facing a very
tough French ad-market;
■ International operations benefited from continued
strong portfolio growth in Africa reaching more than
2m individual subscribers at year-end;
■ Studiocanal revenues increased notably thanks to
the success of Paddington, Imitation Game and
Shaun the Sheep and the solid performance of
Legend, released in September in the UK.
■ Income from operations down €76m mainly due to
a decrease in Pay-TV revenues in mainland
France as well as increased investment in content
and in sports rights, and a positive one time item in
2014.
■ Restructuring charges of €47m and negative one
time items of €38m in 2015.
In euro millions - IFRS 2014 2015 Change
Constant
perimeter
and constant
currency *
Revenues 5,456 5,513 + 1.1% + 0.2%
Pay-TV Mainland France 3,454 3,383 - 2.1% - 2.1%
Pay-TV International 1,273 1,364 + 7.2% + 4.7%
o/w Poland 515 500 - 2.8% - 2.5%
Overseas 406 413 + 1.7% + 1.9%
Africa 312 400 + 28.2% + 20.0%
Vietnam 40 51 + 29.3% + 11.1%
Free-to-Air TV Mainland France 196 203 + 3.3% + 3.3%
Studiocanal 533 563 + 5.7% + 2.3%
Income from operations 618 542 - 12.2% - 13.1%
Income from operations margin 11.3% 9.8% -1.5pt
Charges related to equity-settled
share-based compensation plans(3) (3)
Other special items excluded from
income from operations (including
transition and restructuring costs)
(32) (85)
EBITA 583 454 - 22.1% - 23.0%

F Y 2 0 1 5 R e s u l t s – F e b r u a r y 1 8 , 2 0 1 6
28
* At constant currency and perimeter. See details on page 24
HIGHLIGHTS
VIVENDI VILLAGE
In euro millions - IFRS 2014 2015 Change
Constant
perimeter
and constant
currency *
Revenues 96 100 + 3.5% - 9.6%
Income from operations (34) 10 na na
EBITA (79) 9 na na
NEW INITIATIVES
In euro millions - IFRS 2014 2015 Change
Constant
perimeter
and constant
currency *
Revenues - 43 + 0.0% + 0.0%
Income from operations - (18) + 0.0% + 0.0%
EBITA - (20) + 0.0% + 0.0%
CORPORATE
In euro millions - IFRS 2014 2015 Change
Constant
perimeter
and constant
currency *
Income from operations (82) (99) + 0.0% + 0.0%
EBITA (70) (94) + 0.0% + 0.0%
Vivendi Village
■ Improvement in Income from operations and EBITA
largely as a result of the Watchever transformation plan
initiated in 2014 and satisfactory performances of the
other activities.
New Initiatives
■ Start up costs for new projects.
■ New Initiatives business segment brings together:
■ Vivendi Contents which acquired 100% of Flab Prod
and la Parisienne d’Images (renamed Studio+) during
the first half of 2015;
■ Dailymotion (as from June 30, 2015).
Corporate
■ FY 2015 EBITA impacted by:
■ Lower management fees received as a result of the
divestiture of SFR and Maroc Telecom;
■ Stable recurring personnel costs;
■ Higher legal fees, share-based compensation charges
and new businesses set-up costs.

F Y 2 0 1 5 R e s u l t s – F e b r u a r y 1 8 , 2 0 1 6
ADJUSTED P&L
29
* At constant currency and perimeter. See details on page 24
■ Lower interest charges mainly due to lower average outstanding borrowings (€2.2bn in FY 2015 vs. €9.7bn in
FY 2014) partially offset by lower interest received by Vivendi SA on the financing granted to SFR and to GVT.
■ Adjusted effective tax rate of 20.6% in FY 2015.
In euro millions - IFRS 2014 2015 Change %
Constant
perimeter
and constant
currency*
Revenues 10,089 10,762 + 673 + 6.7% + 1.4%
Income from operations 1,108 1,061 - 47 - 4.3% - 5.9%
Income from operations margin 11.0% 9.9% - 1.1pt - 0.8pt
Equity settled share-based compensation plans (9) (16) - 7
Special items excluded from Income from operations (including
transition/integration costs, and restructuring costs)(100) (103) - 3
EBITA 999 942 - 57 - 5.7% - 7.4%
Income from equity affiliates (18) (10) + 8
Income from investments 3 52 + 49
Interest (96) (30) + 66
Provision for income taxes (200) (199) + 1
Non-controlling interests (62) (58) + 4
Adjusted Net Income 626 697 + 71 + 11.3%

F Y 2 0 1 5 R e s u l t s – F e b r u a r y 1 8 , 2 0 1 6
CONSOLIDATED P&L
30
In euro millions - IFRS 2014 2015 Change %
Revenues 10,089 10,762 + 673 + 6.7%
Cost of revenues (6,121) (6,555)
Selling, general and administrative expenses excluding amortization
of intangible assets acquired through business combinations(2,865) (3,163)
Restructuring charges (104) (102)
Amortization and depreciation on intangible assets acquired through business
combinations(436) (411)
Other income & charges 173 700
EBIT 736 1,231 + 495 + 67.2%
Income from equity affiliates (18) (10)
Interest (96) (30)
Income from investments 3 52
Other financial income and charges (732) (57)
Provision for income taxes (130) (441)
Earnings from discontinued operations 5,262 1,233
Non-controlling interests (281) (46)
Earnings attributable to Vivendi SA shareowners 4,744 1,932 - 2,812 - 59.3%
of which earnings from continuing operations attributable to Vivendi SA
shareowners(290) 699 + 989 na

F Y 2 0 1 5 R e s u l t s – F e b r u a r y 1 8 , 2 0 1 6
31
CONSOLIDATED BALANCE SHEET
In euro millions
* Including non-controlling interests
Goodwill 9,329 10,177 Consolidated equity * 22,988 21,086
Intangible and tangible assets 4,631 4,335 Provisions 3,178 3,042
Financial investments 6,360 7,543 Working capital requirements and other 3,143 4,266
Net deferred tax assets 53 - Net deferred tax liabilities - 83
Net cash position 4,637 6,422
Net assets held for sale 4,299 -
Total 29,309 28,477 Total 29,309 28,477
Assets Equity and LiabilitiesDecember 31,
2014
December 31,
2015
December 31,
2014
December 31,
2015

F Y 2 0 1 5 R e s u l t s – F e b r u a r y 1 8 , 2 0 1 6
32
CASH FLOW FROM OPERATIONS (CFFO)
2014 2015 Change In euro millions - IFRS 2014 2015 Change
471 620 + 31.5% Universal Music Group 425 567 + 33.3%
721 653 - 9.4% Canal+ Group 531 472 - 11.1%
(37) (3) + 92.8% Vivendi Village (44) (10) + 78.6%
- (18) + 0.0% New Initiatives - (22) + 0.0%
(69) (114) + 0.0% Corporate (69) (115) + 0.0%
1,086 1,138 + 4.8% Total Vivendi 843 892 + 5.9%
CFFO before capex, net CFFO

F Y 2 0 1 5 R e s u l t s – F e b r u a r y 1 8 , 2 0 1 6
NET CASH AT YEAR END 2015
33
Including
Interest paid: €(30)m
Taxes paid: €(1,037)m
In euro billions
Including
GVT: €4.2bn
20% of Numericable-SFR: €3.8bn*
4% of Vivo: €0.8bn
TVN: €0.3bn
**
Including
Telecom Italia: €2.0bn
Dailymotion: €0.3bn
SECP: €0.5bn
Gameloft: €0.1bn
Ubisoft: €0.4bn
* Including the price adjustment of € -116m
** Of which €193m linked to the commitment related to the mandate given on share buyback until Jan. 13, 2016
4.6
6.4
+1.1 +9.1
-0.2
-1.0
-3.3 -0.7
-2.7 -0.5
Net Cash Dec. 31, 2014
CFFO before Capex Capex, net
Interest & taxes paid and other Disposals
Acquisitions investments Share buyback
Distribution to shareholders Other
Net Cash Dec. 31, 2015

F Y 2 0 1 5 R e s u l t s – F e b r u a r y 1 8 , 2 0 1 6
#2 of the European media sector (Jan. 2015)
#10 French company and the only French media company included in the 2016 ranking of the Global
100 Most Sustainable Companies (Jan. 2016)
CS
R In
dic
es
#3 of the CAC 40 on the Children’s Rights* (Oct. 2013)
* Based on compliance with the guidelines on Children’s Rights adopted in March 2012 by Unicef, The United Nations Global
Compact and the NGO ‘’Save the Children’’
Global Index Europe Index
CRI Europe ESG Index
Integration of Vivendi in “SICAV Libertés et solidarité“ of the FIDH managed by Banque Postale
AM (Nov. 2014)
Recognition of Vivendi’s positioning in The Global Diversity List compiled for the 1st time by The
Economist (Oct. 2015)
RECOGNITION OF OUR CSR POLICY
34

F Y 2 0 1 5 R e s u l t s – F e b r u a r y 1 8 , 2 0 1 6
APPENDICES
Details of Business Operations: slides 36-37
Detailed Vivendi Financial Results: slides 39-44
Glossary & Disclaimer: slides 46-47

F Y 2 0 1 5 R e s u l t s – F e b r u a r y 1 8 , 2 0 1 6
36
* At constant currency and perimeter. See details on page 24
** By value (source MusicMart)
*** This is a selected release schedule, subject to change
2016 RELEASES ***
Jack Garratt
Kanye West
Nick Jonas
Nolwenn Leroy (France)
Rihanna
Utada Hikaru (Japan)
Will.I.Am
Ariana Grande
Beck
Drake
Elton John
Florent Pagny (France)
Gwen Stefani
Recorded Music Revenues 2014 2015
Europe 41% 38%
North America 39% 42%
Asia 11% 11%
Rest of the world 9% 9%
In euro millions - IFRS 2015
Constant
perimeter and
constant
currency *
Recorded music 4,113 + 2.4%
Physical sales 1,410 - 6.7%
Digital music sales 1,975 + 8.6%
o/w Streaming and subscription 954 + 43.2%
License and Other 728 + 7.1%
Music Publishing 756 + 3.0%
Merchandising and Other 276 + 3.5%
Intercompany elimination (37)
Total Revenues 5,108 + 2.7%
Recorded music: Best Sellers**
2014
Frozen OST
Taylor Swift
Sam Smith
Ariana Grande
Katy Perry Fifty Shades Of Grey OST
2015
Taylor Swift
Justin Bieber
Sam Smith
The Weeknd

F Y 2 0 1 5 R e s u l t s – F e b r u a r y 1 8 , 2 0 1 6
37
* Individual and collective subscriptions with commitment and without commitment (Canal+, CanalSat, CanalPlay)
** Churn per individual subscriber with commitment
*** Net ARPU per individual subscriber with commitment
**** Source: Médiamétrie - Population four years and older
In '000December 31,
2014
December 31,
2015Change
individual subscribers 11,048 11,241 + 193
Mainland France 6,062 5,746 - 316
International 4,986 5,495 + 509
Poland 2,146 2,119 - 27
Overseas 494 499 + 5
Africa 1,552 2,073 + 521
Vietnam 794 804 + 10
In '000December 31,
2014
December 31,
2015Change
subscriptions 15,349 15,749 + 400
Mainland France* 9,463 9,072 - 391
o/w CanalPlay 599 613 + 14
International 5,886 6,677 + 791
Mainland France 2014 2015 Change
Churn per subscriber (%)** 14.5% 14.9% + 0.4pt
ARPU per subscriber (€)*** 44.0 € 44.7 € + 0.7 €
FTA-TV audience share **** 2014 2015 Change
D8 3.3% 3.4% + 0.1pt
D17 1.2% 1.2% + 0.0pt
iTele 0.9% 1.0% + 0.1pt
Total 5.4% 5.6% + 0.2pt

F Y 2 0 1 5 R e s u l t s – F e b r u a r y 1 8 , 2 0 1 6
APPENDICES Detailed Vivendi Financial Results

F Y 2 0 1 5 R e s u l t s – F e b r u a r y 1 8 , 2 0 1 6
39
REVENUES / EBITDA / EBITA
* At constant currency and perimeter. See details on page 24
Q4 2014 Q4 2015 ChangeConstant
currency
Constant
perimeter
and constant
currency *
Revenues
In euro millions - IFRS 2014 2015 Change
Constant
currency
Constant
perimeter
and constant
currency *
1,460 1,616 + 10.7% + 3.7% + 4.0% Universal Music Group 4,557 5,108 + 12.1% + 2.5% + 2.7%
1,489 1,479 - 0.7% - 1.1% - 1.2% Canal+ Group 5,456 5,513 + 1.1% + 0.5% + 0.2%
27 27 - 1.5% - 4.8% - 15.2% Vivendi Village 96 100 + 3.5% - 0.2% - 9.6%
- 25 + 0.0% + 0.0% + 0.0% New Initiatives - 43 + 0.0% + 0.0% + 0.0%
(5) - + 0.0% + 0.0% + 0.0% Intercompany elimination (20) (2) + 0.0% + 0.0% + 0.0%
2,971 3,147 + 5.9% + 2.2% + 1.4% Total Vivendi 10,089 10,762 + 6.7% + 2.0% + 1.4%
Q4 2014 Q4 2015 ChangeConstant
currency
Constant
perimeter
and constant
currency *
EBITDA
In euro millions - IFRS 2014 2015 Change
Constant
currency
Constant
perimeter
and constant
currency *
339 370 + 9.0% + 3.7% + 4.0% Universal Music Group 688 711 + 3.3% - 1.8% - 1.5%
34 (13) na na na Canal+ Group 841 735 - 12.6% - 12.7% - 13.4%
5 3 - 44.9% - 46.9% - 56.7% Vivendi Village (29) 13 na na na
- (9) + 0.0% + 0.0% + 0.0% New Initiatives - (17) + 0.0% + 0.0% + 0.0%
(14) (25) + 0.0% + 0.0% + 0.0% Corporate (57) (109) + 0.0% + 0.0% + 0.0%
364 326 - 10.6% - 15.6% - 15.2% Total Vivendi 1,443 1,333 - 7.7% - 10.0% - 10.0%
Q4 2014 Q4 2015 ChangeConstant
currency
Constant
perimeter
and constant
currency *
EBITA
In euro millions - IFRS 2014 2015 Change
Constant
currency
Constant
perimeter
and constant
currency *
291 334 + 14.9% + 9.8% + 10.2% Universal Music Group 565 593 + 5.0% + 0.8% + 1.0%
(43) (96) x 2.2 x 2.2 x 2.2 Canal+ Group 583 454 - 22.1% - 22.2% - 23.0%
8 1 - 90.1% - 92.6% - 93.4% Vivendi Village (79) 9 na na na
- (10) + 0.0% + 0.0% + 0.0% New Initiatives - (20) + 0.0% + 0.0% + 0.0%
(22) (22) + 0.0% + 0.0% + 0.0% Corporate (70) (94) + 0.0% + 0.0% + 0.0%
234 207 - 11.8% - 18.1% - 16.9% Total Vivendi 999 942 - 5.7% - 7.9% - 7.4%

F Y 2 0 1 5 R e s u l t s – F e b r u a r y 1 8 , 2 0 1 6
40
REVENUES / INCOME FROM OPERATIONS / EBITA
* At constant currency and perimeter. See details on page 24
Q4 2014 Q4 2015 ChangeConstant
currency
Constant
perimeter
and constant
currency *
Revenues
In euro millions - IFRS 2014 2015 Change
Constant
currency
Constant
perimeter
and constant
currency *
1,460 1,616 + 10.7% + 3.7% + 4.0% Universal Music Group 4,557 5,108 + 12.1% + 2.5% + 2.7%
1,489 1,479 - 0.7% - 1.1% - 1.2% Canal+ Group 5,456 5,513 + 1.1% + 0.5% + 0.2%
27 27 - 1.5% - 4.8% - 15.2% Vivendi Village 96 100 + 3.5% - 0.2% - 9.6%
- 25 + 0.0% + 0.0% + 0.0% New Initiatives - 43 + 0.0% + 0.0% + 0.0%
(5) - + 0.0% + 0.0% + 0.0% Intercompany elimination (20) (2) + 0.0% + 0.0% + 0.0%
2,971 3,147 + 5.9% + 2.2% + 1.4% Total Vivendi 10,089 10,762 + 6.7% + 2.0% + 1.4%
Q4 2014 Q4 2015 ChangeConstant
currency
Constant
perimeter
and constant
currency *
Income from operations
In euro millions - IFRS 2014 2015 Change
Constant
currency
Constant
perimeter
and constant
currency *
316 348 + 9.9% + 4.9% + 5.2% Universal Music Group 606 626 + 3.2% - 0.9% - 0.6%
(15) (12) + 19.1% + 13.2% + 9.9% Canal+ Group 618 542 - 12.2% - 12.3% - 13.1%
3 1 - 68.8% - 75.0% - 81.0% Vivendi Village (34) 10 na na na
- (8) + 0.0% + 0.0% + 0.0% New Initiatives - (18) + 0.0% + 0.0% + 0.0%
(27) (25) + 0.0% + 0.0% + 0.0% Corporate (82) (99) + 0.0% + 0.0% + 0.0%
277 304 + 9.4% + 3.6% + 4.6% Total Vivendi 1,108 1,061 - 4.3% - 6.3% - 5.9%
Q4 2014 Q4 2015 ChangeConstant
currency
Constant
perimeter
and constant
currency *
EBITA
In euro millions - IFRS 2014 2015 Change
Constant
currency
Constant
perimeter
and constant
currency *
291 334 + 14.9% + 9.8% + 10.2% Universal Music Group 565 593 + 5.0% + 0.8% + 1.0%
(43) (96) x 2.2 x 2.2 x 2.2 Canal+ Group 583 454 - 22.1% - 22.2% - 23.0%
8 1 - 90.1% - 92.6% - 93.4% Vivendi Village (79) 9 na na na
- (10) + 0.0% + 0.0% + 0.0% New Initiatives - (20) + 0.0% + 0.0% + 0.0%
(22) (22) + 0.0% + 0.0% + 0.0% Corporate (70) (94) + 0.0% + 0.0% + 0.0%
234 207 - 11.8% - 18.1% - 16.9% Total Vivendi 999 942 - 5.7% - 7.9% - 7.4%

F Y 2 0 1 5 R e s u l t s – F e b r u a r y 1 8 , 2 0 1 6
41
INTEREST & INCOME TAX
In euro millions (except where noted) – IFRS 2014 2015
Interest (96) (30)
Interest expense on borrowings (283) (65)
Average interest rate on borrowings (%) 2.94% 2.91%
Average outstanding borrowings (in euro billions) 9.7 2.2
Interest income from Vivendi S.A. loan to SFR 159 na
Interest income from Vivendi S.A. loan to GVT 13 4
Interest income from cash and cash equivalents 15 31
Average interest income rate (%) 0.70% 0.35%
Average amount of cash equivalents (in euro billions) 2.1 8.8
In euro millions – IFRS Adjusted Net
Income
Net income Adjusted Net
Income
Net income
Tax savings / (charges) related to Vivendi SA's French Tax
Group and to the Consolidated Global Profit Tax Systems147 110 100 (129)
Other tax components (347) (240) (299) (312)
Provision for income taxes (200) (130) (199) (441)
Effective tax rate 22.0% 20.6%
Tax (payment) / reimbursement
2015 2014
(1,037)280

F Y 2 0 1 5 R e s u l t s – F e b r u a r y 1 8 , 2 0 1 6
42
CAPEX, NET
In euro millions - IFRS 2014 2015 Change
Universal Music Group 46 53 + 15.2%
Canal+ Group 190 181 - 4.7%
Vivendi Village 7 7 -
New Initiatives - 4
Corporate - 1
Total Vivendi 243 246 + 1.2%

F Y 2 0 1 5 R e s u l t s – F e b r u a r y 1 8 , 2 0 1 6
43
RECONCILIATION OF EARNINGS ATTRIBUTABLE TO VIVENDI SA SHAREOWNERS TO ADJUSTED NET INCOME
* As reported in the Consolidated Statement of Earnings
In euro millions - IFRS 2014 2015
Earnings attributable to Vivendi SA shareowners (*) 4,744 1,932
Amortization and depreciation of intangible assets acquired through business
combinations (*) 436 411
Other income & charges (*) (173) (700)
Other financial income & charges (*) 732 57
Earnings from discontinued operations (*) (5,262) (1,233)
Change in deferred tax asset related to Vivendi SA's French Tax Group and to the
Consolidated Global Profit Tax Systems37 229
Non-recurring items related to provision for income taxes 5 145
Provision for income taxes on adjustments (112) (132)
Non-controlling interests on adjustments 219 (12)
Adjusted net income 626 697

F Y 2 0 1 5 R e s u l t s – F e b r u a r y 1 8 , 2 0 1 6
44
RECONCILIATION OF EBIT TO INCOME FROM OPERATIONS
In euro millions - IFRS 2014 2015
EBIT 736 1,231
Amortization and depreciation of intangible assets acquired through business
combinations436 411
Other income & charges (173) (700)
EBITA 999 942
Equity settled share-based compensation plans 9 16
Special items excluded from Income from operations (including transition
costs, and restructuring costs)100 103
Income from operations 1,108 1,061

F Y 2 0 1 5 R e s u l t s – F e b r u a r y 1 8 , 2 0 1 6
APPENDICES Glossary & Disclaimer

F Y 2 0 1 5 R e s u l t s – F e b r u a r y 1 8 , 2 0 1 6
46
GLOSSARY
The non-GAAP measures defined below should be considered in addition to, and not as a substitute for, other GAAP measures of operating and financial performance and Vivendi considers this to be relevant indicators of the group’s operating and financial performance. Moreover, it should be noted that other companies may have different definitions and calculations for these indicators from Vivendi thereby affecting comparability.
Adjusted earnings before interest and income taxes (EBITA): As defined by Vivendi, EBITA corresponds to EBIT (defined as the difference between income and charges that do not result from financial activities, equity affiliates, discontinued operations and tax) before the amortization of intangible assets acquired through business combinations and the impairment losses on goodwill and other intangibles acquired through business combinations, and other income and charges related to financial investing transactions and to transactions with shareowners (except if directly recognized in equity).
Income from operations: As defined by Vivendi, income from operations is calculated as EBITA before share-based compensation costs related to equity-settled plans, and special items due to their unusual nature or particular significance.
Adjusted net income (ANI) includes the following items: EBITA, income from equity affiliates, interest, income from investments, as well as taxes and non-controlling interests related to these items. It does not include the following items: the amortization of intangible assets acquired through business combinations, the impairment losses on goodwill and other intangible assets acquired through business combinations, other income and charges related to financial investing transactions and to transactions with shareowners (except if directly recognized in equity), other financial charges and income, earnings from discontinued operations, provisions for income taxes and adjustments attributable to non-controlling interests, as well as non-recurring tax items (notably the changes in deferred tax assets pursuant to the Vivendi SA’ s tax group and Consolidated Global Profit Tax Systems and reversal of tax liabilities relating to risks extinguished over the period).
Cash flow from operations (CFFO): Net cash provided by operating activities after capital expenditures net, dividends received from equity affiliates and unconsolidated companies and before income taxes paid.
Capital expenditures net (Capex, net): Cash used for capital expenditures, net of proceeds from sales of property, plant and equipment, and intangible assets.
Net Cash Position: Net Cash Position is calculated as the sum of cash and cash equivalents, cash management financials assets, as well as derivative financial instruments in assets and cash deposits backing borrowings, less long-term and short-term borrowings and other financial liabilities.
The percentages of change are compared to the same period of the previous accounting year, unless otherwise stated.
F Y 2 0 1 5 R e s u l t s – F e b r u a r y 1 8 , 2 0 1 6
47
IMPORTANT LEGAL DISCLAIMER / CONTACTS
Cautionary Note Regarding Forward-Looking Statements
This presentation contains forward-looking statements with respect to Vivendi's financial condition, results of operations, business, strategy, plans, and
outlook of Vivendi, including the impact of certain transactions and the payment of dividends and distributions as well as share repurchases. Although
Vivendi believes that such forward-looking statements are based on reasonable assumptions, such statements are not guarantees of future performance.
Actual results may differ materially from the forward-looking statements as a result of a number of risks and uncertainties, many of which are outside
Vivendi’s control, including, but not limited to, the risks related to antitrust and other regulatory approvals as well as any other approvals which may be
required in connection with certain transactions and the risks described in the documents of the group filed by Vivendi with the Autorité des Marchés
Financiers (French securities regulator) and its press releases, if any, which are also available in English on Vivendi's website (www.vivendi.com). Investors
and security holders may obtain a free copy of documents filed by Vivendi with the Autorité des Marchés Financiers at www.amf-france.org, or directly from
Vivendi. Accordingly, readers of this presentation are cautioned against relying on these forward-looking statements. These forward-looking statements are
made as of the date of this presentation. Vivendi disclaims any intention or obligation to provide, update or revise any forward-looking statements, whether
as a result of new information, future events or otherwise.
Unsponsored ADRs
Vivendi does not sponsor an American Depositary Receipt (ADR) facility in respect of its shares. Any ADR facility currently in existence is “unsponsored” and
has no ties whatsoever to Vivendi. Vivendi disclaims any liability in respect of any such facility.
Investor Relations Team
Laurent Mairot +33.1.71.71.35.13 [email protected]
Julien Dellys +33.1.71.71.13.30 [email protected]
For all financial or business information, please refer to our Investor Relations website at: http://www.vivendi.com