ft partners research: first data ipo - post quiet period review
TRANSCRIPT
Highly Confidential and proprietary information. Unauthorized distribution without prior consent from Financial Technology Partners LP or FTP Securities LLC (together “FT Partners”) is strictly prohibited.
This communication should not be regarded as an offer to sell or as a solicitation of an offer to buy any financial product or service, nor is it an official confirmation of any transaction, or representative of an official position or
statement of Financial Technology Partners LP, FTP Securities LLC or any other related entity. FTP Securities LLC is a FINRA registered broker-dealer. © 2015
www.ftpartners.com
The Only Investment Bank
Focused Exclusively on Financial Technology
Courtesy of:
First Data IPO: Post Quiet Period Review
Financial Technology Partners
555 Mission St., 23rd Floor
San Francisco, CA 94105
Tel: 415.512.8700
Steve McLaughlin
Managing Partner
Tel: 415.992.8880
FT Partners Research − Transaction Profile
Financial Technology Partners
November 16, 2015

First Data Post Quiet Period Review
2
Table of Contents
I. First Data Overview ….…..…………………………………………………………...…..3
Selected Acquisitions …………………………………………………………………...19
Industry Trends …………………………………………………………………………..26
II. Financial Overview …………................................................……………………….. 32
III. Public Comparables / Valuation .......………………………………………………… 48
IV. Overview of FT Partners ………………………………………………………………. 60

I. First Data Overview

4
Initial Public Offering Overview
First Data Post Quiet Period Review
Source: Company website, SEC filings, Capital IQ.
(1) Proceeds to the Company.
UNITED STATES
SECURITIES AND EXCHANGE COMISSION
Form S-1
First Data Corporation
Adam L. Rosman, Esq.
Executive Vice President, General Counsel and Secretary
225 Liberty Street, 29th Floor
New York, New York 10281
Key IPO Statistics
Description: First Data is the largest merchant acquirer, issuer
processor and independent network service provider in
the world, enabling businesses to accept electronic
payments, helping financial institutions issue credit, debit
and prepaid cards, and routing secure transactions
between them
Use of Proceeds: The Company plans to use the proceeds from the
offering to redeem all $510 mm aggregate principal
amount of its 11.25% senior unsecured notes due 2021,
approximately $2.0 bn aggregate principal amount of its
12.625% senior unsecured notes due 2021, and to pay
applicable premiums and related fees and expenses,
and for general corporate purposes.
Headquarters New York, New York
Ownership KKR and its affiliates own 74% of the Company
Founded 1989
Employees: 22,655
Initial Filing Date: July 20, 2015
Trading Date October 15, 2015
Ticker: FDC
Initial Filing Range: $18-20
Shares Offered 160 mm
IPO Date: 10/15/15
Offer Price: $16
Proceeds (1): $2,560 mm
NYSE: FDC
First Data has
returned to the
public markets
after being
acquired by
KKR through an
LBO in 2007
and originally
being spun off
from American
Express as a
public company
in 1992

5
Initial Performance and Selected Analyst Commentary
First Data Post Quiet Period Review
Source: Capital IQ, Wall Street research.
$15
$16
$17
$18
10/15/15 10/19/15 10/23/15 10/27/15 10/31/15 11/04/15 11/08/15 11/12/15
11/12/15
$17.67
“We are initiating coverage on First Data (FDC), a leading global merchant acquirer and issuer processor with significant scale,
global reach and eCommerce presence, with a Buy rating and $20 TP. After under-investing and failing to execute on its leading
market share position, FDC has undergone a significant transformation over the past few years. FDC has revamped its
management team (2/3rd of C suite hired since May ’13), restructured go-to market strategy, invested in next-gen commerce
solutions (acquired Clover, 5 other commerce tech start-ups), and strengthened its balance sheet. As a result, revenue growth
has accelerated from flat y/y growth in 2013 to 7% cc in 3Q15. Given the new products, large customer base for cross-sell
opportunities, EMV liability shift, EU regulation benefits, as well as lower interest expense from debt pay down and refinancing,
we feel comfortable with FDC’s ability to sustain mid single digit revenue growth and accelerated EPS growth, which could drive
multiple expansion.”
“We are initiating FDC with a Positive rating and $19 price target, applying a 12x multiple to our 2016E EBITDA. Merchant
acquiring and issuer processing are attractive areas of payments, with steady growth and sticky clients. Slower revenue growth
and high leverage will weigh on valuation near term, however we expect FDC to deleverage below 5x the next few years, which
should flow through to equity holders. Slower growth and high leverage is a concern, but solid FCF generation makes for an
encouraging de-leveraging story.”
“We are initiating research coverage of FDC with a Buy rating. FDC is well positioned to capitalize on long-term global trends
within eCommerce and the payment solutions space. We think FDC is unique in that it has a large existing customer base, yet it
also has the opportunity to expand that base through innovative new eCommerce applications. This innovation will be the key to
unlocking future shareholder value and we think that FDC’s recent acquisitions have the potential to become transformative for
the company over the long term.”
Rating: Buy
Price Target: $20.00
Rating: Positive
Price Target: $19.00
Rating: Buy
Price Target: na
IPO Price: $16.00
At $17.67, FDC is currently
trading 10.4% above the
$16.00 IPO price
NYSE: FDC

First Data Post Quiet Period Review
Company Overview
6Source: Company website, SEC filings.
CEO: Frank Bisignano
Headquarters: New York, NY
Founded: 1989
■ First Data is a global provider of electronic and payment
solutions for merchants, financial institutions and card
issuers
■ The Company is organized through three primary lines of
business: Global Business Solutions; Global Financial
Solutions; and Network & Security Solutions
■ First Data has operations in 36 countries, serving
approximately 6.2 million merchant locations
Large Scale Global Footprint
Countries with First Data Clients118
Owner-Associates Worldwide23,000
Countries with First Data Operations36
Years Global Operating Experience24
Business Locations6 Million
STAR Locations1 Million
2014 Global Transactions74 Billion
Financial Institutions4,000
Overview
■ On September 24, 2007, First Data was acquired by
Kohlberg Kravis Roberts & Co. becoming a privately held
corporation
■ In 2014, the Company processed 74 billion transactions
globally and processed 28% of the world’s e-commerce
volume
■ In the US, First Data acquired $1.7 tn of payment volume in
2014, accounting for nearly 10% of US GDP
2014 US Payment Volume$1.7 Trillion Of Segment Revenue Generated
Outside of the US25%
Frank
Bisignano,
formerly at J.P.
Morgan Chase,
was named CEO
of First Data in
April 2013

Guy ChiarelloPresident
Michael K. NeborakEVP, Director of Finance
Adam L. RosmanEVP, General Counsel
and Secretary
Cynthia A. Armine-
KleinEVP, Chief Control
Officer
Christine E. LarsenEVP, Chief Operations
Officer
First Data Post Quiet Period Review
7
■ Ms. Larsen has served as EVP and COO since June 2013
■ Prior to her time at First Data, Ms. Larsen was EVP of JPMorgan Chase & Co. since
January 2012
■ Ms. Armine-Klein became EVP and Chief Control Officer in May 2014
■ Previously, Ms. Armine-Klein was EVP and Chief Compliance Officer for JPMorgan
Chase & Co. from July 2012 to May 2014
Mr. Rosman has served as EVP, General Counsel and Secretary since October 2014
Before joining First Data Mr. Rosman held positions with several companies
including Willis Group Holdings, Cablevision Systems, and Zuckerman Spaeder; he
also served as an assistant United States Attorney
■ Mr. Neborak has been EVP, Director of Finance since July 2014
■ Previously, Mr. Neborak was CFO of Willis Group Holdings and CFO of MSCI
■ Guy Chiarello has served as President since July 2013
■ Prior to his time at First Data, Mr. Chiarello was the CIO of JPMorgan Chase & Co.
■ In May 2014, Mr. Plumeri started as Vice Chairman and has served as a Board
Member since August 2013
■ Before First Data, Mr. Plumeri served as CEO of Willis Group Holdings from October
2000 to January 2013
■ Mr. Bisignano has served as Chairman since March 2014 and CEO since April 2013
■ Previously, Mr. Bisignano served as Co-COO for JPMorgan Chase & Co. from July
2012 to April 2013 and held several executive roles within the Company starting in
2005
Frank J. BisignanoChairman &
Chief Executive Officer
Joseph J. PlumeriVice Chairman
Management Team
Source: SEC filings.
First Data Post Quiet Period Review
8
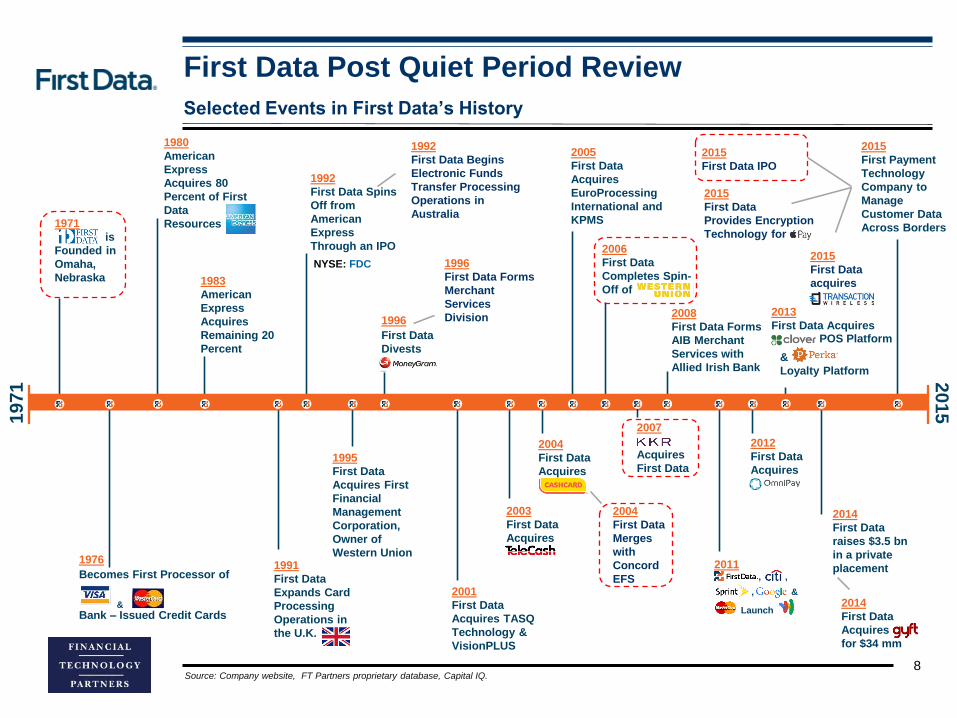
Selected Events in First Data’s History
Source: Company website, FT Partners proprietary database, Capital IQ.
1976
Becomes First Processor of
Bank – Issued Credit Cards
1971
is
Founded in
Omaha,
Nebraska
1980
American
Express
Acquires 80
Percent of First
Data
Resources
1992
First Data Spins
Off from
American
Express
Through an IPO
1995
First Data
Acquires First
Financial
Management
Corporation,
Owner of
Western Union1991
First Data
Expands Card
Processing
Operations in
the U.K.
1971
2015
NYSE: FDC
1996
First Data
Divests
1992
First Data Begins
Electronic Funds
Transfer Processing
Operations in
Australia
2003
First Data
Acquires
2004
First Data
Acquires
2004
First Data
Merges
with
Concord
EFS
2005
First Data
Acquires
EuroProcessing
International and
KPMS
2006
First Data
Completes Spin-
Off of
2015
First Payment
Technology
Company to
Manage
Customer Data
Across Borders
2014
First Data
raises $3.5 bn
in a private
placement
2013
First Data Acquires
2012
First Data
Acquires
2015
First Data
Provides Encryption
Technology for
2007
Acquires
First Data
2008
First Data Forms
AIB Merchant
Services with
Allied Irish Bank
2001
First Data
Acquires TASQ
Technology &
VisionPLUS
1996
First Data Forms
Merchant
Services
Division
&
1983
American
Express
Acquires
Remaining 20
PercentPOS Platform
&
Loyalty Platform
2011
Launch
, ,
, &
2015
First Data IPO
2014
First Data
Acquires
for $34 mm
2015
First Data
acquires
First Data Post Quiet Period Review
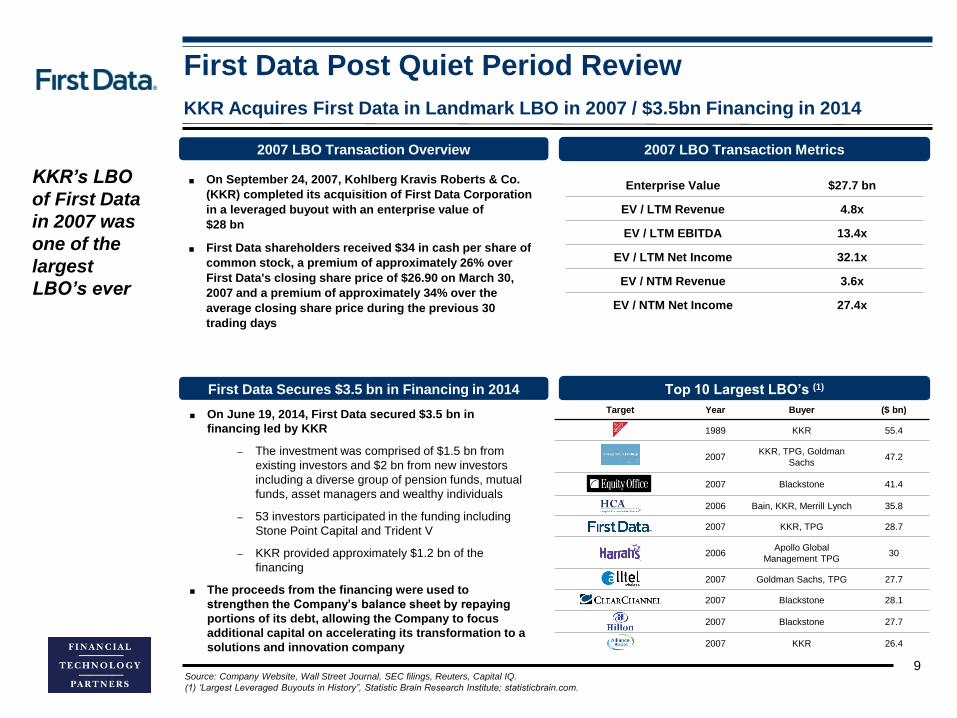
KKR Acquires First Data in Landmark LBO in 2007 / $3.5bn Financing in 2014
9Source: Company Website, Wall Street Journal, SEC filings, Reuters, Capital IQ.
(1) ‘Largest Leveraged Buyouts in History”, Statistic Brain Research Institute; statisticbrain.com.
■ On September 24, 2007, Kohlberg Kravis Roberts & Co.
(KKR) completed its acquisition of First Data Corporation
in a leveraged buyout with an enterprise value of
$28 bn
■ First Data shareholders received $34 in cash per share of
common stock, a premium of approximately 26% over
First Data's closing share price of $26.90 on March 30,
2007 and a premium of approximately 34% over the
average closing share price during the previous 30
trading days
2007 LBO Transaction Overview 2007 LBO Transaction Metrics
Enterprise Value $27.7 bn
EV / LTM Revenue 4.8x
EV / LTM EBITDA 13.4x
EV / LTM Net Income 32.1x
EV / NTM Revenue 3.6x
EV / NTM Net Income 27.4x
■ On June 19, 2014, First Data secured $3.5 bn in
financing led by KKR
‒ The investment was comprised of $1.5 bn from
existing investors and $2 bn from new investors
including a diverse group of pension funds, mutual
funds, asset managers and wealthy individuals
‒ 53 investors participated in the funding including
Stone Point Capital and Trident V
‒ KKR provided approximately $1.2 bn of the
financing
■ The proceeds from the financing were used to
strengthen the Company’s balance sheet by repaying
portions of its debt, allowing the Company to focus
additional capital on accelerating its transformation to a
solutions and innovation company
First Data Secures $3.5 bn in Financing in 2014
KKR’s LBO
of First Data
in 2007 was
one of the
largest
LBO’s ever
Target Year Buyer ($ bn)
1989 KKR 55.4
2007KKR, TPG, Goldman
Sachs47.2
2007 Blackstone 41.4
2006 Bain, KKR, Merrill Lynch 35.8
2007 KKR, TPG 28.7
2006Apollo Global
Management TPG30
2007 Goldman Sachs, TPG 27.7
2007 Blackstone 28.1
2007 Blackstone 27.7
2007 KKR 26.4
Top 10 Largest LBO’s (1)

First Data Post Quiet Period Review
Overview of KKR
10Source: Capital IQ, Pitchbook.
Date Company Amount (mm)
04/21/15 $15
01/28/15 35
01/13/15 na
10/30/14 na
10/16/14 55
10/01/14 na
07/07/14 3,500
09/05/13 1,100
Selected Recent Investments
Exits
Date Company Amount (mm)
02/26/15 TASC (Engility) $1,300
12/31/14Alliance Boots Holdings
(Walgreen Co.)15,931
12/11/14 Fotolia (Adobe Systems) 800
08/07/14Ipreo (Goldman Sachs, The
Blackstone Group) 975
06/01/13 IT-Informatik (BWK) na
03/26/13 Intelligence (Temp
Holdings)
720
Investment Preferences
Location(s)
About
■ Kohlberg Kravis Roberts & Co. (KKR), is a global investment
firm founded in 1976 with 21 offices across 15 countries
■ KKR has $96.1 bn in assets under management and $4.9 bn
in committed capital as of September 2014
■ Seeks to acquire industry leading companies and partner
with the management teams to accelerate portfolio
companies’ growth
Henry R. Kravis
Co-Chairman,
Co-CEO
Michael Michelson Member
Richard Sarnoff Managing Director
Steffen Pauls Managing Director
Max Alper Director
Scott Cullerton Director
Brandon Brahm Principal
Tim Caflisch Principal
Investment Criteria
Fund Sizes: $9,000 mm (North America
Fund XI)
$6,000 mm (Asian Fund II)
$7,923 mm (European
Fund III)General Preferences
Control: Majority (preferred),
Minority
Transaction Type: Growth, Buyout, LBO,
Spin-offs, PIPE,
Secondary
Industry Focus: Chem., Consumer, Edu.,
Fin. Srvcs., Forestry, HC,
Hotels, Indus.,
Infrastructure,
Media/Comm, Oil & Gas,
Real Estate, Retail,
Technology
George R. Roberts
Co-Chairman,
Co-CEO
■ New York, NY (HQ) ■ France ■ Spain
■ Australia ■ India ■ S. Korea
■ Brazil ■ Japan ■ UAE
■ Canada ■ Saudi Arabia ■ UK
■ China ■ Singapore
$5
$10
$15
$20
$25
$30
2010 2011 2012 2013 2014 2015
Stock Performance History
Overview

First Data Post Quiet Period Review
Source: Company SEC filings.(1) Adjusted EBITDA = Net Income or loss attributable to First Data plus interest expense, income tax (benefit) expense, D&A, stock-based
compensation and other adjustments.
11
Business Segment Overview
59%21%
20%
2014 Segment Revenue
Network & Security
Solutions
Global Financial
Solutions
Global
Business
Solutions 60%18%
22%
2014 Segment Adjusted EBITDA (1)
Network & Security
Solutions
Global Financial
Solutions
Global
Business
Solutions
Provides retail point-of-sale merchant acquiring and ecommerce services as well as next-generation offerings including mobile payment services, webstore-in-a-box solutions
Provides Clover, a cloud-based point-of-sale operating system, which includes a marketplace for proprietary and third-party apps
Provides credit solutions for bank and non-bank issuers; these include credit and retail private-label card processing within the United States and international markets, as well as licensed financial software systems including VisionPLUS bank processing application and lending solutions
Also offers financial institutions with a suite of related services including card personalization and embossing, statement print, client service and remittance processing
Provides a wide range of value-added solutions that are sold to the other two segments, smaller financial institutions and other enterprise clients
Solutions include electronic funds transfer network solutions (STAR network), debit card processing solutions, stored-value network solutions including Money Network, ValueLink, Gyft and Transaction Wireless, as well as security and fraud solutions including TransArmor and TeleCheck
Also supports other digital strategies including online and mobile banking and mobile wallets
Global Business Solutions
Global Financial Solutions
Network & Security Solutions
First Data
divides its
business
into three
segments

First Data Post Quiet Period Review
$1,700
$529 $608
60%
19% 21%
0
0.1
0.2
0.3
0.4
0.5
0.6
0.7
0.8
0.9
1
-100
400
900
1400
1900
2400
GlobalBusinessSolutions
GlobalFinancialSolutions
Network &Security
Solutions
Businesses and business
owners of all types and sizes
Financial institutions and other
issuers of all sizes
GBS and GFS clients, small
banks and other enterprises
To help businesses grow
commerce at the retail, online
and mobile POS channels
To help issuers empower their
customers to transact
To help connect, manage,
protect and secure clients’
data
Merchant Acquiring
eCommerce
Clover POS
Business Software
Marketing / Loyalty
Credit / Retail Private Label
Issuer Processing
Output Services
VisionPLUS Software
Marketing / Loyalty
EFT Network Solutions
(STAR, debit processing)
Stored Value Network
Solutions (Valuelink,
MoneyNetwork, Gyft)
Security / Risk Management
$4 bn, up 3% from 2013 $1.5 bn, up 8% from 2013 $1.4 bn, up 1% from 2013
$1.7 bn, up 3% from 2013
43% adjusted EBITDA margin
$529 mm, up 31% from 2013
35% adjusted EBITDA margin
$608 mm, up 11% from 2013
43% adjusted EBITDA margin
12
Business Segment Overview
Global Business Solutions
(GBS)
Global Financial Solutions
(GFS)
Network & Security
Solutions
(NSS)
Clients
Goals
Key Solutions
2014 Segment
Revenue
Adjusted
EBITDA (1)
Source: Company SEC filings.(1) Adjusted EBITDA = Net Income or loss attributable to First Data plus interest expense, income tax (benefit) expense, D&A, stock-based
compensation and other adjustments.
$4.0
$1.5 $1.4
58%
22% 20%
0
0.1
0.2
0.3
0.4
0.5
0.6
0.7
0.8
0.9
1
0
0.5
1
1.5
2
2.5
3
3.5
4
4.5
5
GlobalBusinessSolutions
GlobalFinancialSolutions
Network &Security
Solutions
2014 Segment Revenue / % of Total 2014 Segment Adjusted EBITDA / % of Total (1)
($ in bn) ($ in mm)
First Data Post Quiet Period Review
13
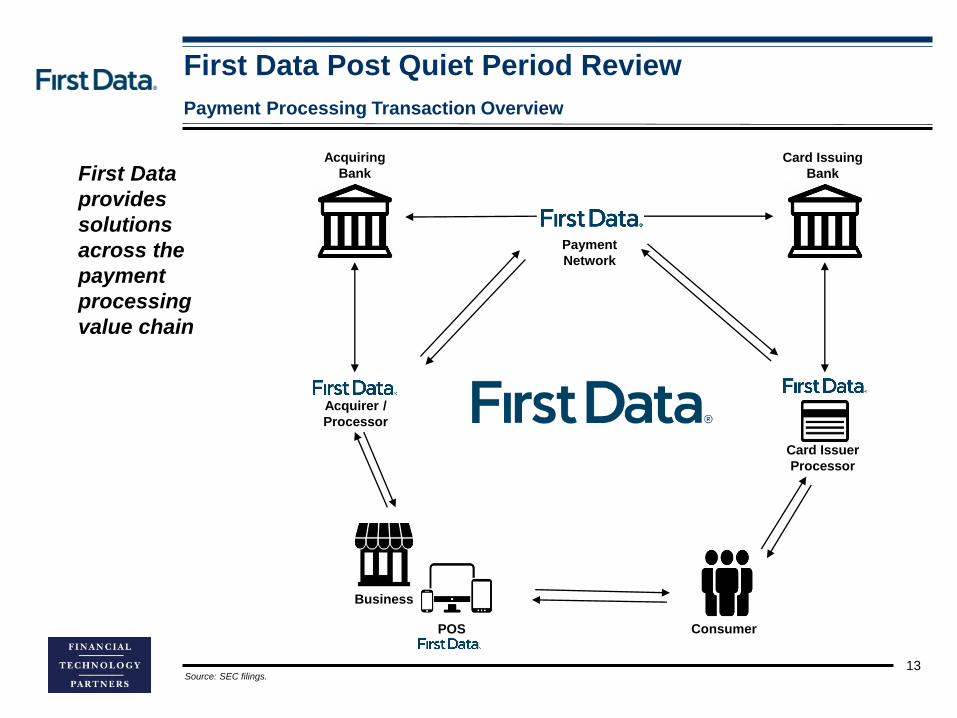
Payment Processing Transaction Overview
Acquiring
Bank
Card Issuing
Bank
ConsumerPOS
Business
Card Issuer
Processor
Payment
Network
Acquirer /
Processor
First Data
provides
solutions
across the
payment
processing
value chain
Source: SEC filings.

14
Industry Background and Trends
First Data Post Quiet Period Review
■ Global commercial activities and transactions continue a steady migration toward electronic forms
■ From 2013 to 2018, cash purchase volumes are projected to decline by 34% and check purchase volumes are
projected to decline 46%, according to The Nilson Report
Shift to Electronic
Commerce
Migration to Online
Channels
■ The past 20 years have seen Internet growth, decreased technology costs and increased electronic payment
adoption combine to drive traffic online to eCommerce and mobile commerce channels
■ Newer generations of Internet and mobile smartphone users are projected to continue the migration to online
channels
Globalization of
Commerce
■ Larger addressable markets are being made available as population growth rates increase and socio-
economic demographic changes take place in developing markets
■ Financial institutions and large businesses continue their expansion across geographic borders as they see
their operations grow to serve international customers
Adoption of New
Technologies
■ Over the past 10 years, technology has become more accessible to consumers and smaller enterprises as
costs of technology products and services have steadily decreased
■ Increased adoption of these technology products and services has also increased spending on commerce-
enabling solutions such as POS systems and business management software
Increasing Use of
Data and Analytics
Convergence of
Commerce Channels
■ Whether consumers are engaged at a physical site, online, or through a mobile device, they are increasingly
looking for commercial information, incentives and engagement
■ As a result of these consumer demands, businesses and financial institutions are seeking ways to integrate
technology solutions that function across all channels of their operations
Rise in Security
Breaches
■ The growth of electronic commerce has lead to the increase of sensitive information that is electronically
stored and transmitted
■ This information is placed at risk of exposure and compromise, resulting in an augmentation of security
breaches, or 42.8 mm incidents in 2014
■ Increased use of online channels and new technologies has generated more access and use of data to the
benefit of both consumers and businesses
■ Spending on big data analytics is projected to reach $125 bn in 2015 in the United States, according to IDC,
and the number of large organizations that purchase external data are projected to increase from 70% to 100%
Source: SEC filings.

First Data Post Quiet Period Review
Competitive Strengths
15
Large Scale
■ First Data’s size and global outreach services millions of large and small scale business and
financial institutions around the world, resulting in 74 bn processed global transactions in 2014
■ This large scale global outreach creates opportunities for development, acquisition and
commercialization of advanced technologies within the industry
Global Merchant
Acquiring
■ First Data serviced approximately 6 mm business globally in 2014, 4 mm in the United States, and
was reported as the largest merchant acquirer in the world by The Nilson Report
■ In 2014, First Data acquired 11% of the credit and debt purchase volume globally and 39% of the
credit and debit volume in the United States
Global Issuer
Processing
■ Over 4,000 financial institutions maintain direct relationships with First Data, making the Company
one of the largest card issuer processers for credit, debit, prepaid and private-label cards in the
world
■ In 2014, First Data recorded 785 million card accounts on file in the United States, with 938 million
accounts globally
Independent
Network Services
■ STAR Network, an independent payment network owned by First Data, is accepted in over 1 million
POS and ATM locations in the United States
■ In 2014, STAR Network processed 3.6 billion PIN debit and ATM transactions
World Leader in
eCommerce
■ First Data provides large enterprise clients, SMBs and third-party payment processors with
eCommerce capabilities around the globe
■ In 2014, the Company processed $418 bn in eCommerce volume world-wide, 28% of the global
eCommerce volume reported by eMarketer
Source: SEC filings.

First Data Post Quiet Period Review
Competitive Strengths (cont.)
16
Integrated Solutions■ First Data offers clients a complete array of integrated solutions in the industry covering
commerce technology, merchant acquiring, issuing and network solutions
Large and Diverse
Distribution
Platform
■ The Company sells its commerce-enabling solutions to approximately 6 million business locations
and over 4,000 financial institutions through a combination of channels that enable First Data to
reach clients of all types and sizes
■ Wide network of bank relationships that exclusively provide First Data with referrals to their
customers and access to their combined global branch network of over 36,000 locations
Global Footprint
■ Operations in 36 countries and serve clients in 118 countries around the world directly and
indirectly
■ Have made strategic investments and developed key partnerships in fast-growing emerging
markets where the penetration of electronic payments is lower
Powerful,
Proprietary
Technology
Platform
■ Own and operate proprietary platforms which are strategically positioned around the world to meet
the different technical needs of the First Data’s large, diversified client base and support global
operations
■ Technology platform provides a range of functions including: hosting and management of
software solutions; end-to-end processing; risk management functions; and data management
functions
■ Develop and maintain platforms in-house, which enables them to be highly stable, secure and
scalable with substantial excess capacity to expand capabilities without the need for material new
investment
Source: SEC filings.
First Data Post Quiet Period Review
17
Growth Strategies
Greater Focus on
Innovation
Enhanced Client-
Facing Teams
Expanded Solution
Set
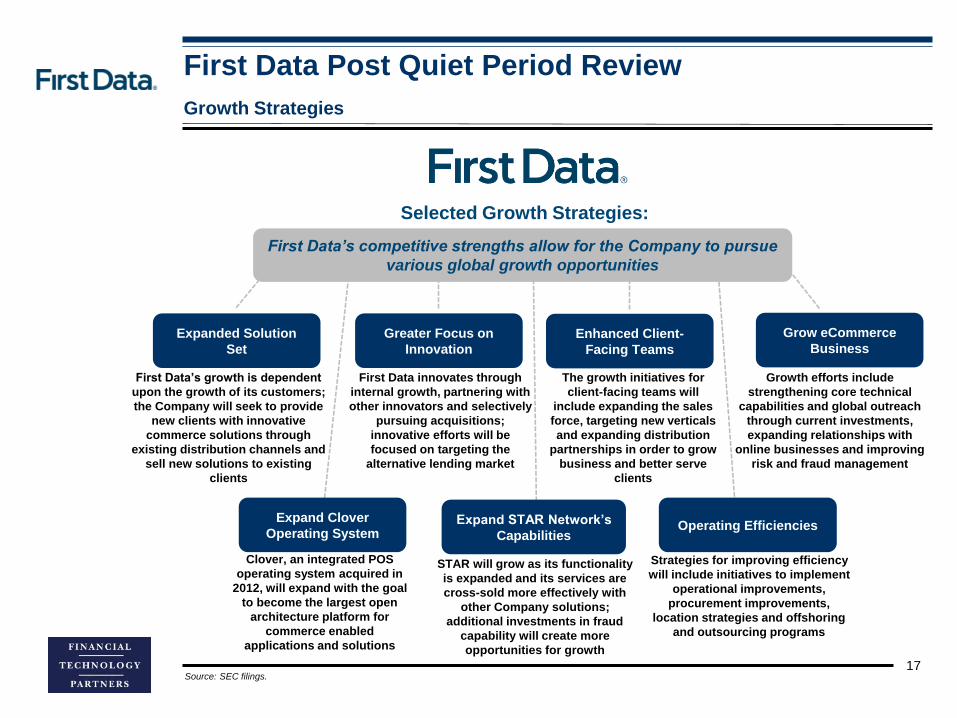
First Data’s competitive strengths allow for the Company to pursue
various global growth opportunities
Expand Clover
Operating SystemExpand STAR Network’s
CapabilitiesOperating Efficiencies
First Data’s growth is dependent
upon the growth of its customers;
the Company will seek to provide
new clients with innovative
commerce solutions through
existing distribution channels and
sell new solutions to existing
clients
First Data innovates through
internal growth, partnering with
other innovators and selectively
pursuing acquisitions;
innovative efforts will be
focused on targeting the
alternative lending market
The growth initiatives for
client-facing teams will
include expanding the sales
force, targeting new verticals
and expanding distribution
partnerships in order to grow
business and better serve
clients
Selected Growth Strategies:
Clover, an integrated POS
operating system acquired in
2012, will expand with the goal
to become the largest open
architecture platform for
commerce enabled
applications and solutions
STAR will grow as its functionality
is expanded and its services are
cross-sold more effectively with
other Company solutions;
additional investments in fraud
capability will create more
opportunities for growth
Strategies for improving efficiency
will include initiatives to implement
operational improvements,
procurement improvements,
location strategies and offshoring
and outsourcing programs
Growth efforts include
strengthening core technical
capabilities and global outreach
through current investments,
expanding relationships with
online businesses and improving
risk and fraud management
Grow eCommerce
Business
Source: SEC filings.

First Data Post Quiet Period Review
18
Selected Risk Factors
Revenues are generated by the level of consumer, business and government spending; a decline in
economic conditions, especially in the United States and Europe could potentially have adverse
effects on the Company’s performance
Global Economic
Trends
Security Breaches First Data processes and stores consumers’ personal, sensitive information for which the Company
is responsible; cyber criminal activity is an increased risk for a security breach of this information
Acquisition
Integration Various risks are assumed when First Data acquires a business; valuation, integration, regulation,
diligence and management of and for these acquisitions provide areas for potential risk
Substantial Leverage First Data’s high levels of leverage, $21.1 bn of total debt, could increase vulnerability to adverse
economic conditions, require a large portion of cash flow for repayment of principal, restrict future
acquisitions and limit further financing
Increased Interest
Rates
Laws and Regulations
First Data and its clients are subject to laws and regulation that globally affect the electronic
payment industry; failure to comply with these laws and regulation could result in suspension,
limitation or penalties
Credit Card Standards The Company is subject to card association rules and regulations that could potentially result in
fines or penalties, increased costs and a negative impact on the ability to provide transactions
Portions of the Company’s borrowings are subject to variable rates of interest; an increase in
interest rates would increase interest expense and negatively impact business operations
First Data’s operational and financial performance may be affected by the following risk factors:
Source: SEC filings.
First Data Post Quiet Period Review
19
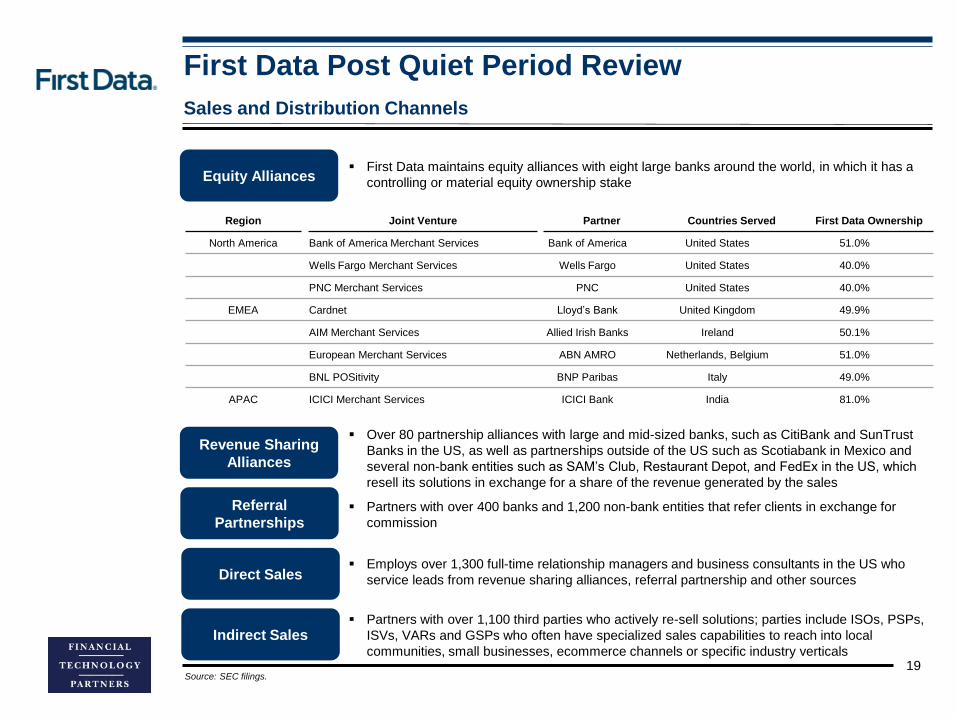
Sales and Distribution Channels
Region Joint Venture Partner Countries Served First Data Ownership
North America Bank of America Merchant Services Bank of America United States 51.0%
Wells Fargo Merchant Services Wells Fargo United States 40.0%
PNC Merchant Services PNC United States 40.0%
EMEA Cardnet Lloyd’s Bank United Kingdom 49.9%
AIM Merchant Services Allied Irish Banks Ireland 50.1%
European Merchant Services ABN AMRO Netherlands, Belgium 51.0%
BNL POSitivity BNP Paribas Italy 49.0%
APAC ICICI Merchant Services ICICI Bank India 81.0%
First Data maintains equity alliances with eight large banks around the world, in which it has a
controlling or material equity ownership stake
Source: SEC filings.
Equity Alliances
Revenue Sharing
Alliances
Referral
Partnerships
Direct Sales
Indirect Sales
Over 80 partnership alliances with large and mid-sized banks, such as CitiBank and SunTrust
Banks in the US, as well as partnerships outside of the US such as Scotiabank in Mexico and
several non-bank entities such as SAM’s Club, Restaurant Depot, and FedEx in the US, which
resell its solutions in exchange for a share of the revenue generated by the sales
Partners with over 400 banks and 1,200 non-bank entities that refer clients in exchange for
commission
Employs over 1,300 full-time relationship managers and business consultants in the US who
service leads from revenue sharing alliances, referral partnership and other sources
Partners with over 1,100 third parties who actively re-sell solutions; parties include ISOs, PSPs,
ISVs, VARs and GSPs who often have specialized sales capabilities to reach into local
communities, small businesses, ecommerce channels or specific industry verticals

Selected Acquisitions

First Data Post Quiet Period Review
Source: FT Partners proprietary database, Capital IQ.
Selected Acquisitions
21
Announce Date Target
EV
($ in mm) Commentary
07/14/15 naComplements acquisition of Gyft and expands prepaid gift card
solution offerings
07/30/14 30Gyft provides digital platform enabling consumers to buy, send,
manage and redeem gift cards using mobile devices
10/29/13 34Acquired Perka, mobile marketing and consumer loyalty platform
for small to medium-sized merchants
03/19/13 56 Acquired mobile payments provider, Clover, for $56.1 mm
08/10/10 naAcquired full ownership of Merchant Solutions joint venture from
Standard Chartered Bank
04/30/11 naAcquired the remaining equity stake of Omnipay; purchased
majority stake in August 2005
09/23/08 na Acquired 50% of the interbank processing business of EuFISERV
10/15/07 Deecal naAcquired Deecal, a provider of commercial card software
solutions for banks
11/01/07Check Forte
Processamentona
Acquisition was part of First Data’s strategy to grow presence in
Brazil
04/16/07 naFundsXpress expands First Data’s offerings of products for
secure electronic commerce and internet banking transactions
02/21/07 naAcquired the assets of Datawire, a web-based transaction
delivery provider
Date TargetValue
($ in mm)Commentary
First Data Post Quiet Period Review
22
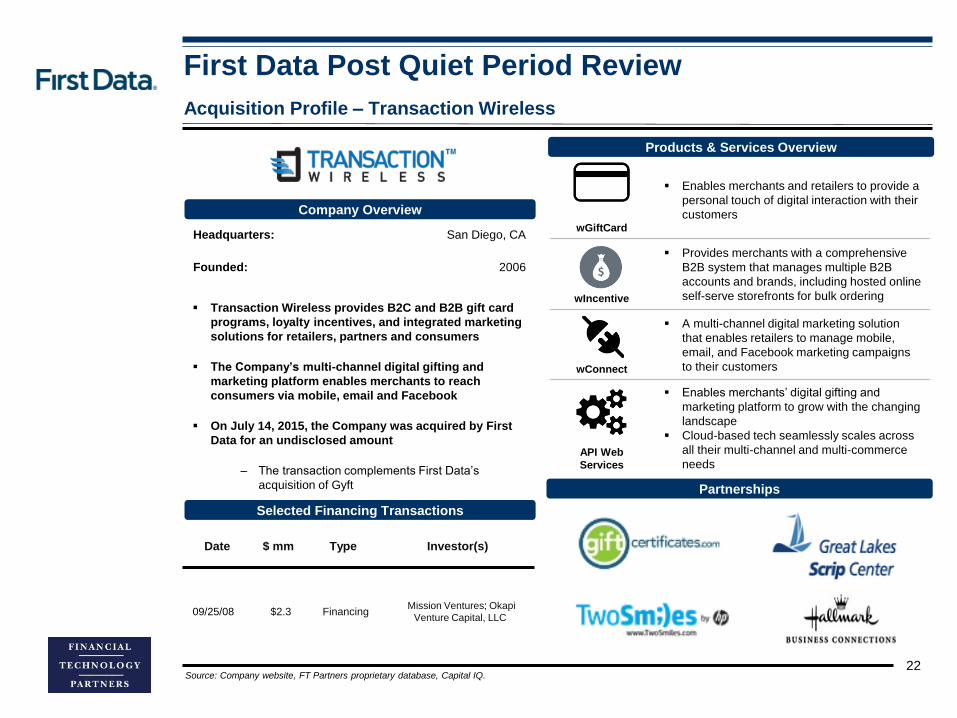
Acquisition Profile – Transaction Wireless
Company Overview
Selected Financing Transactions
Headquarters: San Diego, CA
Founded: 2006
Date $ mm Type Investor(s)
09/25/08 $2.3 FinancingMission Ventures; Okapi
Venture Capital, LLC
Transaction Wireless provides B2C and B2B gift card
programs, loyalty incentives, and integrated marketing
solutions for retailers, partners and consumers
The Company’s multi-channel digital gifting and
marketing platform enables merchants to reach
consumers via mobile, email and Facebook
On July 14, 2015, the Company was acquired by First
Data for an undisclosed amount
‒ The transaction complements First Data’s
acquisition of Gyft
Source: Company website, FT Partners proprietary database, Capital IQ.
Products & Services Overview
Partnerships
wGiftCard
Enables merchants and retailers to provide a
personal touch of digital interaction with their
customers
wIncentive
Provides merchants with a comprehensive
B2B system that manages multiple B2B
accounts and brands, including hosted online
self-serve storefronts for bulk ordering
wConnect
A multi-channel digital marketing solution
that enables retailers to manage mobile,
email, and Facebook marketing campaigns
to their customers
API Web
Services
Enables merchants’ digital gifting and
marketing platform to grow with the changing
landscape
Cloud-based tech seamlessly scales across
all their multi-channel and multi-commerce
needs

First Data Post Quiet Period Review
23
Acquisition Profile - Gyft
Company Overview
Selected Financing Transactions
Products & Services Overview
Headquarters: San Francisco
Founded: 2012
Date $ mm Type Investor(s)
09/04/13 $1.4 Financing Undisclosed
08/31/13 5.0 FinancingA-Grade Investments; Karlin
Ventures, LLC; The
Social+Capital Partnership
12/13/12 na Financing Karlin Ventures, LLC
09/10/12 1.3 Financing500 Startups; Founder
Collective; Google Ventures;
Romulus Capital
Gyft is a gift card platform that enables users to upload
physical gift cards into a mobile wallet, buy e-gift cards
and redeem gift cards directly from the mobile wallet at
the point-of-sale
Enables integration with Facebook so users can send
gift cards to their friends around special events
On July 30, 2014, the Company was acquired by First
Data for $30.3 mm
Source: Company website, FT Partners proprietary database, Capital IQ.
Selected Retailers Offered
Gyft for
Consumers
Users can carry their gift cards everywhere
with an app that is compatible on iOS,
Android and the web
Users can earn Gyft points which are
redeemable for purchases
Gyft for
Businesses
Enables businesses to issue gift cards
straight from their register
Gyft for
Developers
Developers can utilize the Gyft API to
provide the basis of their customized gift
cards
Their API makes it easier to send gift cards
First Data Post Quiet Period Review
24
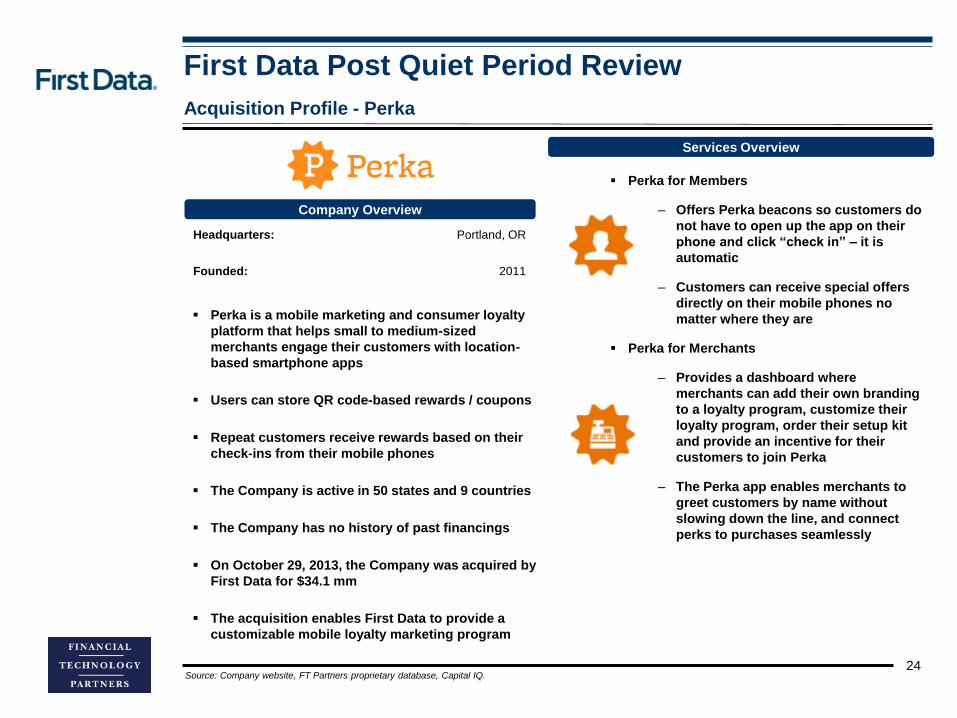
Acquisition Profile - Perka
Company Overview
Services Overview
Headquarters: Portland, OR
Founded: 2011
Perka is a mobile marketing and consumer loyalty
platform that helps small to medium-sized
merchants engage their customers with location-
based smartphone apps
Users can store QR code-based rewards / coupons
Repeat customers receive rewards based on their
check-ins from their mobile phones
The Company is active in 50 states and 9 countries
The Company has no history of past financings
On October 29, 2013, the Company was acquired by
First Data for $34.1 mm
The acquisition enables First Data to provide a
customizable mobile loyalty marketing program
Source: Company website, FT Partners proprietary database, Capital IQ.
Perka for Members
‒ Offers Perka beacons so customers do
not have to open up the app on their
phone and click “check in” – it is
automatic
‒ Customers can receive special offers
directly on their mobile phones no
matter where they are
Perka for Merchants
‒ Provides a dashboard where
merchants can add their own branding
to a loyalty program, customize their
loyalty program, order their setup kit
and provide an incentive for their
customers to join Perka
‒ The Perka app enables merchants to
greet customers by name without
slowing down the line, and connect
perks to purchases seamlessly

First Data Post Quiet Period Review
25
Acquisition Profile - Clover
Company Overview
Selected Financing Transactions
Products & Services Overview
Headquarters: Mountain View, CA
Founded: 1995
Date $ mm Type Investor(s)
12/27/12 $3.0 Financing Undisclosed
03/08/12 5.8 FinancingAndreessen Horowitz LLC;
Sutter Hill Ventures
11/01/10 5.5 Financing Undisclosed
Clover provides an all-in-one customizable point-of-sale
systems and merchant account solutions
Enables small businesses to accept in-person and in-app
payments of credit cards, EMV, and Apple Pay
Clover is cloud-based, enabling merchants to access
and analyze data remotely
On March 19, 2013, the Company was acquired by First
Data for $56.1 mm
Hardware
Software
Merchant Account
Provides integrated solutions designed specifically for point of
sale; includes tabletop and mobile systems
Source: Company website, FT Partners proprietary database, Capital IQ.
Cloud-based system can manage information from merchants’
Clover POS systems and provides management tools for tips, tabs
and authorizations
The Company partnered with over 3,000 financial institutions and
small business service provides to give merchants tons of options
when it comes getting a Clover account

Industry Trends

First Data Post Quiet Period Review
27
Announce
Date
Size
($ mm) Company
04/18/13 $230
05/02/13 213
12/16/14 200
05/05/15 195
07/14/14 169
04/14/15 131
02/14/13 101
03/21/14 80
06/30/14 75
Announce
Date
Size
($ mm) Company
06/18/14 $1,300
12/11/14 870
03/31/15 627
12/30/14 600
06/30/15 573
09/12/13 506
12/23/14 479
09/23/13 414
04/06/15 314
Source: FT Partners proprietary database, SEC filings.
Selected Recent FinTech IPOs Sorted by Size

First Data Post Quiet Period Review
28
Largest US IPOs
Company Offer Date Exchange Sector Underwriter Deal Size (mm)
09/18/2014 NYSE Technology Credit Suisse $21,767
03/18/2008 NYSE Financial J.P. Morgan 17,864
11/01/1999 NYSE Utilities Merrill Lynch 16,452
05/17/2012 NASDAQ Technology Morgan Stanley 16,007
11/17/2010 NYSE Capital Goods &
Services
Morgan Stanley 15,774
11/17/1996 NYSE Communications Goldman Sachs 13,034
04/26/2000 NYSE Communications Goldman Sachs 10,620
06/12/2001 NYSE Consumer Credit Suisse 8,680
10/17/1997 NYSE Communications Merrill Lynch 7,289
11/17/1997 NYSE Communications Credit Suisse 5,646
10/04/1998 NYSE Communications Warburg Dillon Read 5,582
11/09/1999 NYSE Transportation Morgan Stanley 5,470
03/12/2000 NYSE Technology Goldman Sachs 5,230
Source: Renaissance Capital.

First Data Post Quiet Period Review
29
Largest US IPOs (cont.)
Company Offer Date Exchange Sector Underwriter Deal Size (mm)
06/16/2000 NYSE Communications Morgan Stanley $4,916
07/01/2002 NYSE Financial Goldman Sachs 4,600
10/21/1998 NYSE Energy Morgan Stanley 4,403
06/21/2007 NYSE Financial Morgan Stanley 4,133
10/06/2009 NYSE Financial Santander Investment 4,025
10/15/1997 NYSE Communications Goldman Sachs 3,965
03/21/2002 NYSE Financial Citi 3,885
03/09/2011 NYSE Healthcare BofA Merrill Lynch 3,786
07/07/1999 NYSE Communications Merrill Lynch 3,758
06/19/1998 NYSE Technology Credit Suisse 3,732
05/03/1999 NYSE Financial Goldman Sachs 3,657
03/27/2001 NYSE Technology Morgan Stanley 3,600
Source: Renaissance Capital.
First Data Post Quiet Period Review
30
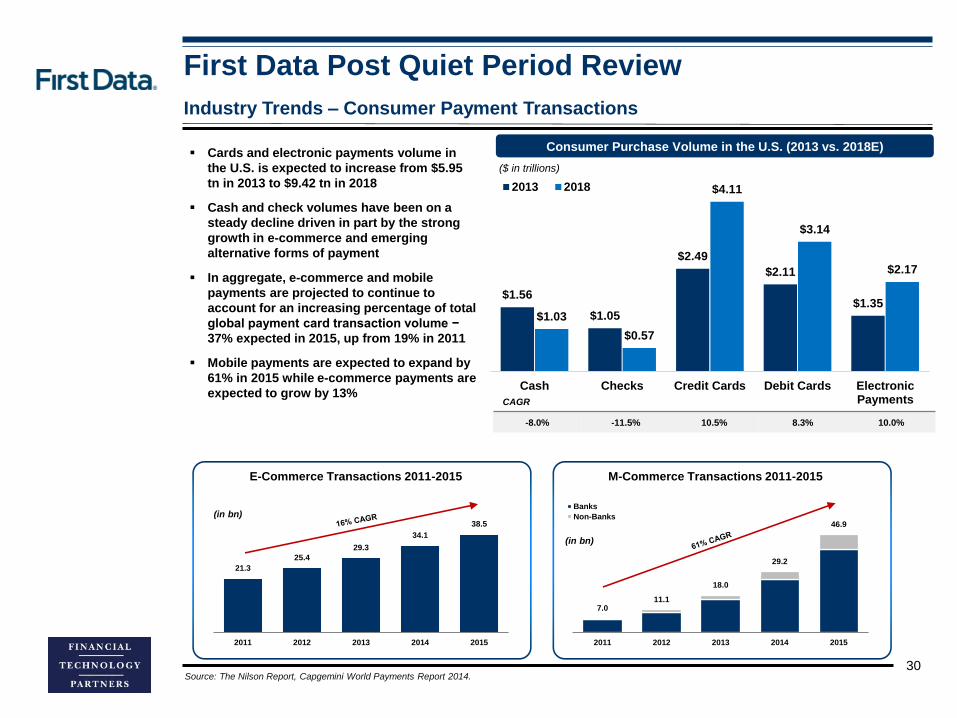
Industry Trends – Consumer Payment Transactions
Source: The Nilson Report, Capgemini World Payments Report 2014.
Consumer Purchase Volume in the U.S. (2013 vs. 2018E)
$1.56
$1.05
$2.49
$2.11
$1.35 $1.03
$0.57
$4.11
$3.14
$2.17
Cash Checks Credit Cards Debit Cards ElectronicPayments
2013 2018
($ in trillions)
CAGR
-8.0% -11.5% 10.5% 8.3% 10.0%
7.011.1
18.0
29.2
46.9
2011 2012 2013 2014 2015
Banks
Non-Banks
M-Commerce Transactions 2011-2015
(in bn)
21.3
25.4
29.3
34.1
38.5
2011 2012 2013 2014 2015
E-Commerce Transactions 2011-2015
(in bn)
Cards and electronic payments volume in
the U.S. is expected to increase from $5.95
tn in 2013 to $9.42 tn in 2018
Cash and check volumes have been on a
steady decline driven in part by the strong
growth in e-commerce and emerging
alternative forms of payment
In aggregate, e-commerce and mobile
payments are projected to continue to
account for an increasing percentage of total
global payment card transaction volume −
37% expected in 2015, up from 19% in 2011
Mobile payments are expected to expand by
61% in 2015 while e-commerce payments are
expected to grow by 13%

First Data Post Quiet Period Review
Rank Volume Change # of Trans.
'14 '13 ($ mm) (%) (mm)
1 1 Chase Paymentech $ 617,162.6 15% 10,874.2
2 2 Bank of America Merchant Services 518,441.7 0% 10,328.7
3 3 First Data 432,971.0 0% 6,421.0
4 4 Vantiv 369,696.9 33% 8,176.4
5 5 Elavon 248,850.1 8% 2,994.2
6 6 Wells Fargo Merchant Services 192,726.9 17% 2,248.6
7 7 Citi Merchant Services 161,934.8 5% 6,784.2
8 8 Global Payments 130,485.1 15% 2,255.2
9 9 Heartland Payment Systems 103,657.8 6% 2,680.3
10 10 Worldpay 90,254.7 11% 2,161.5
11 11 TSYS Merchant Services 45,046.4 12% 580.8
12 12 Transfirst 44,548.3 13% 419.2
13 13 PNC Merchant Services 41,148.2 8% 610.6
14 14 SunTrust Merchant Services 37,335.5 5% 450.9
15 16 Merrick Bank 24,681.2 2% 391.6
16 17 Intuit 23,822.7 1% 143.9
17 19 EVO Payments 23,302.4 4% 303.6
18 20 Moneris Solutions 22,223.4 1% 208.1
19 18 iPayment 22,018.7 -3% 333.9
20 38 Priority Payment Systems 19,795.2 175% 232.4
Company
31
Industry Trends - Merchant Acquirer Volumes
Source: The Nilson Report, Splice Software.
2.5
2.8
3.3
3.5
3.8
13.5
14.2
15.5
17.8
Global
Wells Fargo
WorldPay
Elavon
Heartland
Chase Commerce Solutions
Bank of America Merchant Services
Vantiv
First Data
Purchase Transaction Volume at Top U.S. Acquirers (2014)(# in billions)
Merchant Acquirers in the U.S. Ranked by Visa / MasterCard Volume
$86.56
$81.29
$126.04
$120.02
$196.61
$315.13
$657.44
$377.81
$666.66
$133.23
$137.38
$147.91
$247.56
$294.23
$678.85
$714.45
$782.26
$814.86
Heartland
Worldpay
Global Pymt
Wells
Elavon
Vantiv
BofA
Chase
First Data
2014
2009
Purchase Volume on General Purpose Cards (2014 vs 2009)
+22%
+107%
+9%
+115%
+50%
+106%
+17%
+69%
+54%
($ in billions)

II. Financial Summary

First Data Post Quiet Period Review
33
Financial Overview
Source: SEC filings, Company press releases.
$5,609
$6,284 $6,711 $6,586
$6,991 $7,182 $7,319 $7,302 $7,548
7.0%
12.0%
6.8%
(1.9%)
6.2% 2.7% 1.9%
(0.2%)3.4%
(25.0%)
(15.0%)
(5.0%)
5.0%
15.0%
25.0%
35.0%
45.0%
$0
$1,000
$2,000
$3,000
$4,000
$5,000
$6,000
$7,000
$8,000
2006 2007 2008 2009 2010 2011 2012 2013 2014
($ in mm)
Total Revenues (including reimbursable items) / % Growth
Total Net Revenues (excluding reimbursable items) / % Growth
$7,076
$8,051
$8,811$9,314
$10,380$10,714 $10,680 $10,809
$11,152
8%
14%
9%6%
11%
3%0%
1%3%
-10%
0%
10%
20%
30%
40%
50%
$0
$2,000
$4,000
$6,000
$8,000
$10,000
$12,000
2006 2007 2008 2009 2010 2011 2012 2013 2014
($ in mm)

First Data Post Quiet Period Review
34
Financial Overview (cont.)
Source: SEC filings, Company press releases.
Note: Total Revenue excludes reimbursable debit network fees, postage and other charges.
$2,676 $2,525
$2,787 $3,047
$3,521 $3,693
$3,896 $3,988 $4,061
48%
40%42%
46%
50% 51%53%
55% 54%
30%
35%
40%
45%
50%
55%
60%
65%
70%
$0
$500
$1,000
$1,500
$2,000
$2,500
$3,000
$3,500
$4,000
$4,500
2006 2007 2008 2009 2010 2011 2012 2013 2014
($ in mm)
Check Services Revenue / % Total Revenue
Merchant Related Services Revenue / % Total Revenue
$335
$418$386
$364 $379
$338$314
$287$2646%
7%6% 6% 5%
5% 4% 4%4%
-1%
1%
3%
5%
7%
9%
11%
13%
15%
$0
$100
$200
$300
$400
$500
2006 2007 2008 2009 2010 2011 2012 2013 2014
($ in mm)
% Growth
11.6% (5.6%) 10.4% 9.3% 15.6% 4.9% 5.5% 2.4% 1.8%
% Growth
1.7% 24.9% (7.5%) (5.8%) 4.0% (10.7%) (7.2%) (8.7%) (7.8%)

First Data Post Quiet Period Review
35
Financial Overview (cont.)
Source: SEC filings, Company press releases.
Note: Total Revenue excludes reimbursable debit network fees, postage and other charges.
$1,683
$1,983 $2,036
$1,842 $1,736 $1,751 $1,738 $1,687
$1,817
30% 32% 30%28%
25% 24% 24% 23% 24%
0%
10%
20%
30%
40%
50%
60%
70%
$0
$500
$1,000
$1,500
$2,000
$2,500
2006 2007 2008 2009 2010 2011 2012 2013 2014
($ in mm)
Other Services Revenue / % Total Revenue
Card Services Revenue / % Total Revenue
$345
$594 $576$536 $546 $548
$504 $502 $514
6%
9%9% 8% 8% 8%
7% 7% 7%
0%
2%
4%
6%
8%
10%
12%
14%
16%
18%
20%
$0
$100
$200
$300
$400
$500
$600
$700
$800
2006 2007 2008 2009 2010 2011 2012 2013 2014
($ in mm)
% Growth
5.5% 17.8% 2.7% (9.5%) (5.7%) 0.9% (0.7%) (2.9%) 7.7%
% Growth
2.3% 72.4% (3.0%) (7.0%) 1.8% 0.5% (8.1%) (0.4%) 2.2%
First Data Post Quiet Period Review
36
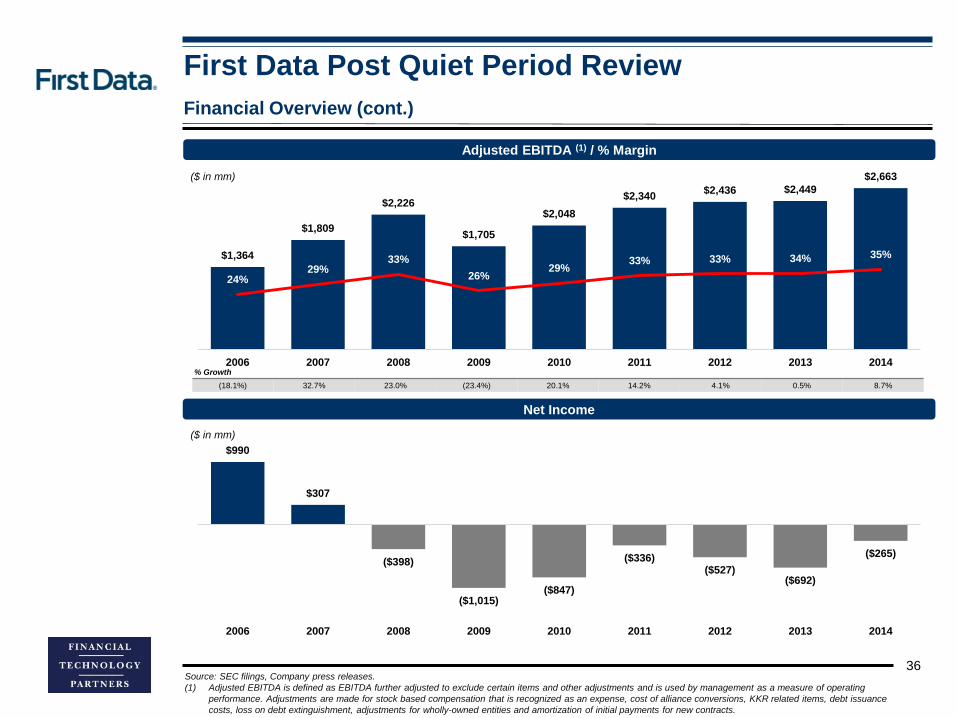
Financial Overview (cont.)
Source: SEC filings, Company press releases.
(1) Adjusted EBITDA is defined as EBITDA further adjusted to exclude certain items and other adjustments and is used by management as a measure of operating
performance. Adjustments are made for stock based compensation that is recognized as an expense, cost of alliance conversions, KKR related items, debt issuance
costs, loss on debt extinguishment, adjustments for wholly-owned entities and amortization of initial payments for new contracts.
$1,364
$1,809
$2,226
$1,705
$2,048
$2,340 $2,436 $2,449
$2,663
24%29%
33%
26%29%
33% 33% 34% 35%
0%
10%
20%
30%
40%
50%
60%
70%
80%
$0
$500
$1,000
$1,500
$2,000
$2,500
$3,000
2006 2007 2008 2009 2010 2011 2012 2013 2014
($ in mm)
Net Income
Adjusted EBITDA (1) / % Margin
$990
$307
($398)
($1,015)($847)
($336)($527)
($692)
($265)
($1,500)
($1,000)
($500)
$0
$500
$1,000
$1,500
2006 2007 2008 2009 2010 2011 2012 2013 2014
($ in mm)
% Growth
(18.1%) 32.7% 23.0% (23.4%) 20.1% 14.2% 4.1% 0.5% 8.7%
First Data Post Quiet Period Review
37
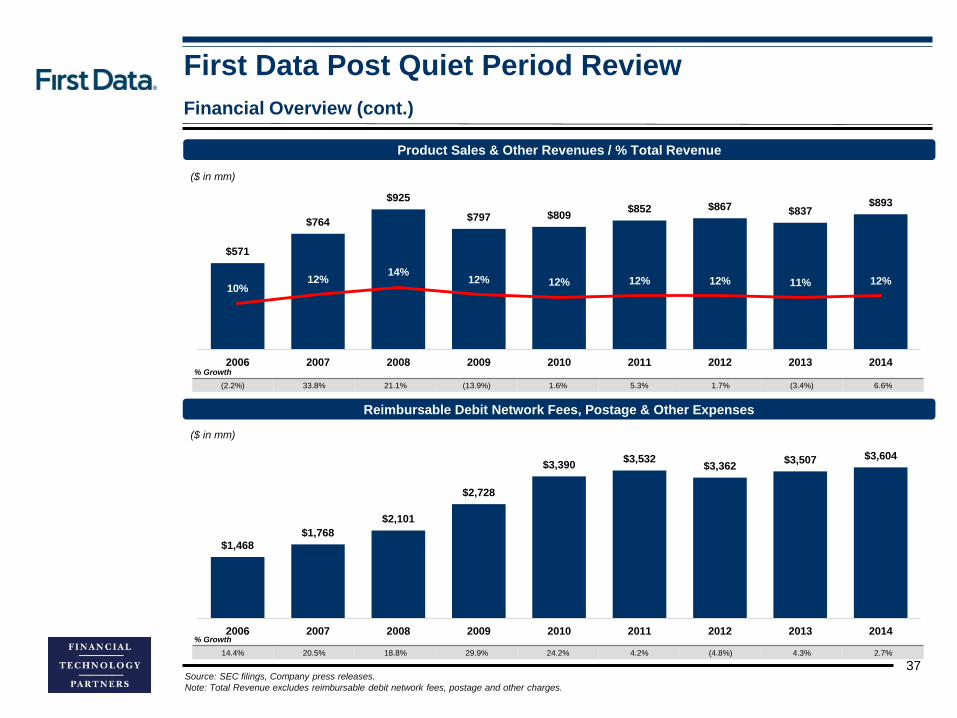
Financial Overview (cont.)
Source: SEC filings, Company press releases.
Note: Total Revenue excludes reimbursable debit network fees, postage and other charges.
$571
$764
$925
$797 $809 $852 $867 $837
$893
10%12%
14%12% 12% 12% 12% 11% 12%
0%
5%
10%
15%
20%
25%
30%
35%
40%
$0
$200
$400
$600
$800
$1,000
$1,200
2006 2007 2008 2009 2010 2011 2012 2013 2014
($ in mm)
Reimbursable Debit Network Fees, Postage & Other Expenses
Product Sales & Other Revenues / % Total Revenue
$1,468
$1,768
$2,101
$2,728
$3,390$3,532
$3,362$3,507 $3,604
$0
$500
$1,000
$1,500
$2,000
$2,500
$3,000
$3,500
$4,000
$4,500
2006 2007 2008 2009 2010 2011 2012 2013 2014
($ in mm)
% Growth
(2.2%) 33.8% 21.1% (13.9%) 1.6% 5.3% 1.7% (3.4%) 6.6%
% Growth
14.4% 20.5% 18.8% 29.9% 24.2% 4.2% (4.8%) 4.3% 2.7%
First Data Post Quiet Period Review
38
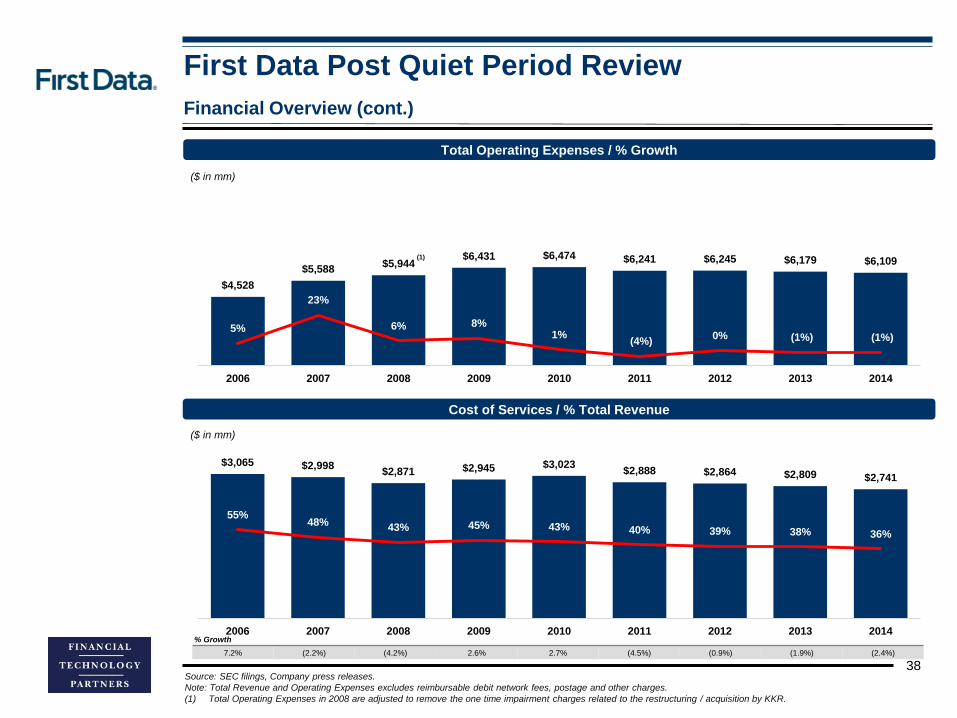
Financial Overview (cont.)
Source: SEC filings, Company press releases.
Note: Total Revenue and Operating Expenses excludes reimbursable debit network fees, postage and other charges.
(1) Total Operating Expenses in 2008 are adjusted to remove the one time impairment charges related to the restructuring / acquisition by KKR.
$4,528
$5,588 $5,944
$6,431 $6,474 $6,241 $6,245 $6,179 $6,109
5%
23%
6% 8% 1%
(4%)0% (1%) (1%)
(10%)
10%
30%
50%
70%
90%
110%
$0
$2,000
$4,000
$6,000
$8,000
$10,000
$12,000
2006 2007 2008 2009 2010 2011 2012 2013 2014
($ in mm)
Cost of Services / % Total Revenue
Total Operating Expenses / % Growth
$3,065 $2,998$2,871 $2,945 $3,023
$2,888 $2,864 $2,809 $2,741
55%48%
43% 45% 43% 40% 39% 38% 36%
-30%
-10%
10%
30%
50%
70%
90%
110%
130%
150%
$0
$500
$1,000
$1,500
$2,000
$2,500
$3,000
$3,500
$4,000
2006 2007 2008 2009 2010 2011 2012 2013 2014
($ in mm)
% Growth
7.2% (2.2%) (4.2%) 2.6% 2.7% (4.5%) (0.9%) (1.9%) (2.4%)
(1)

First Data Post Quiet Period Review
39
Financial Overview (cont.)
Source: SEC filings, Company press releases.
Note: Total Revenue excludes reimbursable debit network fees, postage and other charges.
$301 $297 $317 $306
$375 $370
$336 $334 $337
5%5% 5% 5%
5% 5% 5% 5% 4%
0%
2%
4%
6%
8%
10%
12%
14%
16%
18%
20%
$0
$50
$100
$150
$200
$250
$300
$350
$400
$450
2006 2007 2008 2009 2010 2011 2012 2013 2014
($ in mm)
Selling, General & Administrative / % Total Revenue
Cost of Products Sold / % Total Revenue
$1,158
$1,427 $1,375$1,438
$1,580$1,694
$1,825$1,889
$1,962
21% 23% 20% 22% 23% 24% 25% 26% 26%
0%
10%
20%
30%
40%
50%
60%
70%
80%
90%
$0
$500
$1,000
$1,500
$2,000
2006 2007 2008 2009 2010 2011 2012 2013 2014
($ in mm)
% Growth
10.6% (1.5%) 6.8% (3.6%) 22.8% (1.5%) (9.0%) (0.7%) 1.0%
% Growth
10.6% 23.3% (3.6%) 4.6% 9.8% 7.2% 7.8% 3.5% 3.9%
First Data Post Quiet Period Review
40
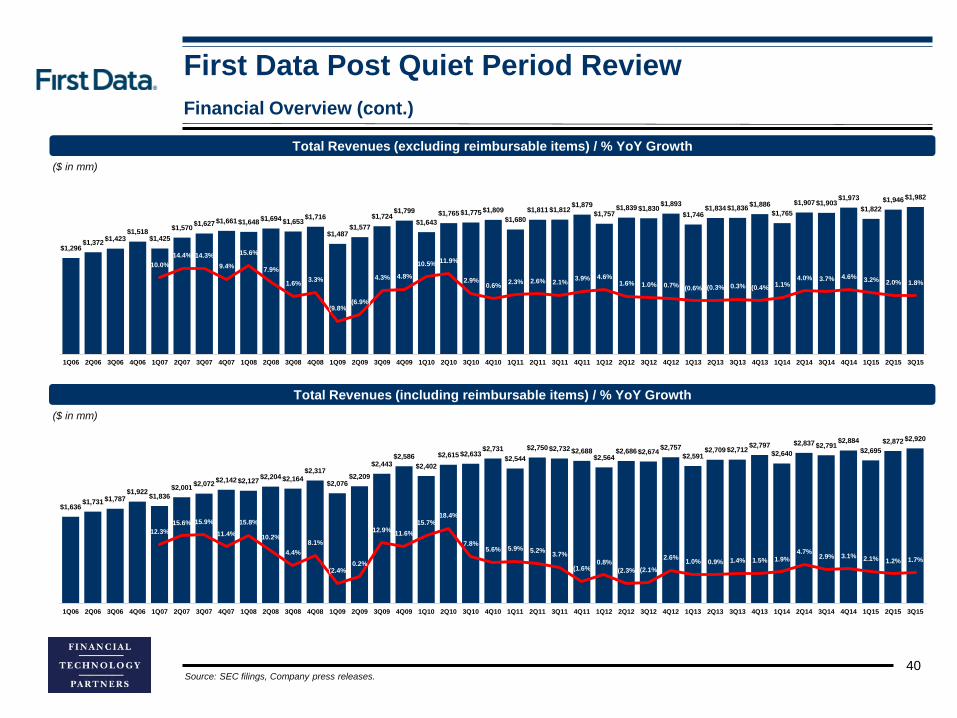
Financial Overview (cont.)
Source: SEC filings, Company press releases.
$1,296 $1,372
$1,423 $1,518
$1,425
$1,570 $1,627 $1,661 $1,648
$1,694 $1,653 $1,716
$1,487 $1,577
$1,724 $1,799
$1,643
$1,765 $1,775 $1,809
$1,680
$1,811 $1,812 $1,879
$1,757 $1,839 $1,830
$1,893
$1,746 $1,834 $1,836
$1,886
$1,765
$1,907 $1,903 $1,973
$1,822
$1,946 $1,982
10.0%
14.4% 14.3%
9.4%
15.6%
7.9%
1.6% 3.3%
(9.8%)(6.9%)
4.3% 4.8%
10.5% 11.9%
2.9% 0.6%
2.3% 2.6% 2.1% 3.9% 4.6%
1.6% 1.0% 0.7% (0.6%) (0.3%) 0.3% (0.4%)1.1%
4.0% 3.7% 4.6% 3.2% 2.0% 1.8%
-0.25
-0.15
-0.05
0.05
0.15
0.25
0.35
0.45
0.55
$0
$500
$1,000
$1,500
$2,000
$2,500
1Q06 2Q06 3Q06 4Q06 1Q07 2Q07 3Q07 4Q07 1Q08 2Q08 3Q08 4Q08 1Q09 2Q09 3Q09 4Q09 1Q10 2Q10 3Q10 4Q10 1Q11 2Q11 3Q11 4Q11 1Q12 2Q12 3Q12 4Q12 1Q13 2Q13 3Q13 4Q13 1Q14 2Q14 3Q14 4Q14 1Q15 2Q15 3Q15
($ in mm)
Total Revenues (including reimbursable items) / % YoY Growth
Total Revenues (excluding reimbursable items) / % YoY Growth
($ in mm)
$1,636 $1,731 $1,787
$1,922 $1,836
$2,001 $2,072
$2,142 $2,127 $2,204 $2,164
$2,317
$2,076 $2,209
$2,443 $2,586
$2,402
$2,615 $2,633 $2,731
$2,544
$2,750 $2,732 $2,688 $2,564
$2,686 $2,674 $2,757
$2,591 $2,709 $2,712
$2,797
$2,640
$2,837 $2,791 $2,884
$2,695
$2,872 $2,920
12.3%
15.6% 15.9%
11.4%
15.8%
10.2%
4.4%
8.1%
(2.4%)0.2%
12.9% 11.6%
15.7% 18.4%
7.8% 5.6% 5.9% 5.2%
3.7%
(1.6%)0.8%
(2.3%) (2.1%)
2.6% 1.0% 0.9% 1.4% 1.5% 1.9%
4.7% 2.9% 3.1% 2.1% 1.2% 1.7%
-0.1
0
0.1
0.2
0.3
0.4
0.5
0.6
$0
$500
$1,000
$1,500
$2,000
$2,500
$3,000
$3,500
1Q06 2Q06 3Q06 4Q06 1Q07 2Q07 3Q07 4Q07 1Q08 2Q08 3Q08 4Q08 1Q09 2Q09 3Q09 4Q09 1Q10 2Q10 3Q10 4Q10 1Q11 2Q11 3Q11 4Q11 1Q12 2Q12 3Q12 4Q12 1Q13 2Q13 3Q13 4Q13 1Q14 2Q14 3Q14 4Q14 1Q15 2Q15 3Q15
First Data Post Quiet Period Review
41
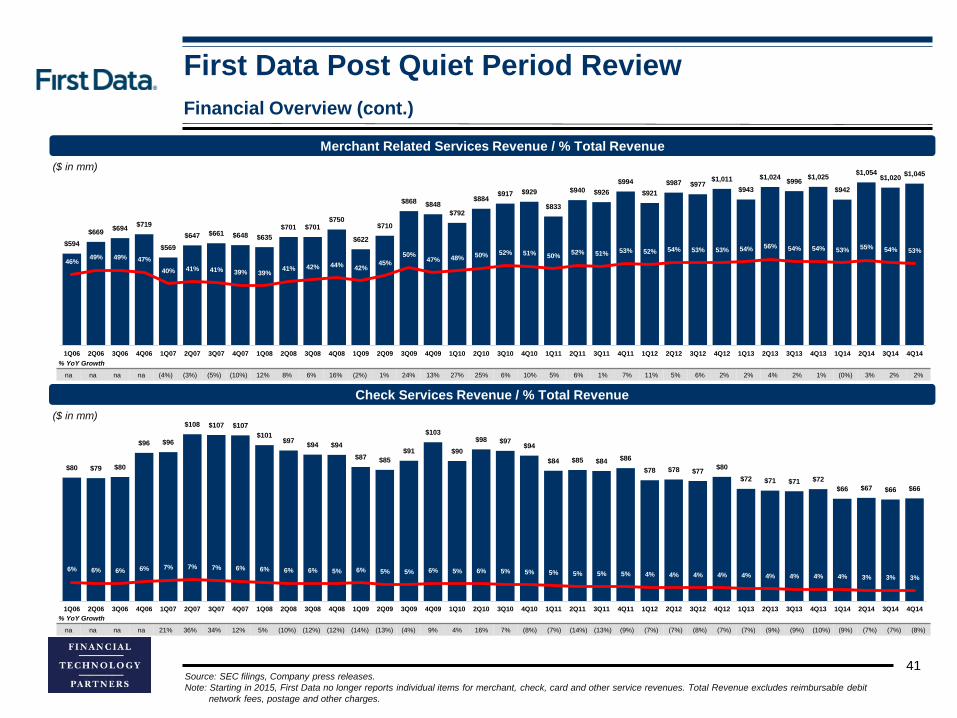
Financial Overview (cont.)
Source: SEC filings, Company press releases.
Note: Starting in 2015, First Data no longer reports individual items for merchant, check, card and other service revenues. Total Revenue excludes reimbursable debit
network fees, postage and other charges.
$594
$669 $694
$719
$569
$647 $661 $648 $635
$701 $701 $750
$622
$710
$868 $848
$792
$884 $917 $929
$833
$940 $926
$994
$921
$987 $977 $1,011
$943
$1,024 $996
$1,025
$942
$1,054 $1,020
$1,045
46% 49% 49% 47%
40% 41% 41% 39% 39% 41% 42% 44% 42%
45%
50% 47% 48% 50% 52% 51% 50%
52% 51% 53% 52% 54% 53% 53% 54% 56% 54% 54% 53% 55% 54% 53%
-
20%
40%
60%
80%
100%
120%
$0
$200
$400
$600
$800
$1,000
$1,200
1Q06 2Q06 3Q06 4Q06 1Q07 2Q07 3Q07 4Q07 1Q08 2Q08 3Q08 4Q08 1Q09 2Q09 3Q09 4Q09 1Q10 2Q10 3Q10 4Q10 1Q11 2Q11 3Q11 4Q11 1Q12 2Q12 3Q12 4Q12 1Q13 2Q13 3Q13 4Q13 1Q14 2Q14 3Q14 4Q14
($ in mm)
Check Services Revenue / % Total Revenue
Merchant Related Services Revenue / % Total Revenue
$80 $79 $80
$96 $96
$108 $107 $107
$101 $97
$94 $94
$87 $85
$91
$103
$90
$98 $97 $94
$84 $85 $84 $86
$78 $78 $77 $80
$72 $71 $71 $72
$66 $67 $66 $66
6% 6% 6% 6% 7% 7% 7% 6% 6% 6% 6% 5% 6% 5% 5% 6% 5% 6% 5% 5% 5% 5% 5% 5% 4% 4% 4% 4% 4% 4% 4% 4% 4% 3% 3% 3%
-
10%
20%
30%
40%
50%
60%
$0
$20
$40
$60
$80
$100
$120
1Q06 2Q06 3Q06 4Q06 1Q07 2Q07 3Q07 4Q07 1Q08 2Q08 3Q08 4Q08 1Q09 2Q09 3Q09 4Q09 1Q10 2Q10 3Q10 4Q10 1Q11 2Q11 3Q11 4Q11 1Q12 2Q12 3Q12 4Q12 1Q13 2Q13 3Q13 4Q13 1Q14 2Q14 3Q14 4Q14
% YoY Growth
na na na na (4%) (3%) (5%) (10%) 12% 8% 6% 16% (2%) 1% 24% 13% 27% 25% 6% 10% 5% 6% 1% 7% 11% 5% 6% 2% 2% 4% 2% 1% (0%) 3% 2% 2%
% YoY Growth
na na na na 21% 36% 34% 12% 5% (10%) (12%) (12%) (14%) (13%) (4%) 9% 4% 16% 7% (8%) (7%) (14%) (13%) (9%) (7%) (7%) (8%) (7%) (7%) (9%) (9%) (10%) (9%) (7%) (7%) (8%)
($ in mm)
First Data Post Quiet Period Review
42
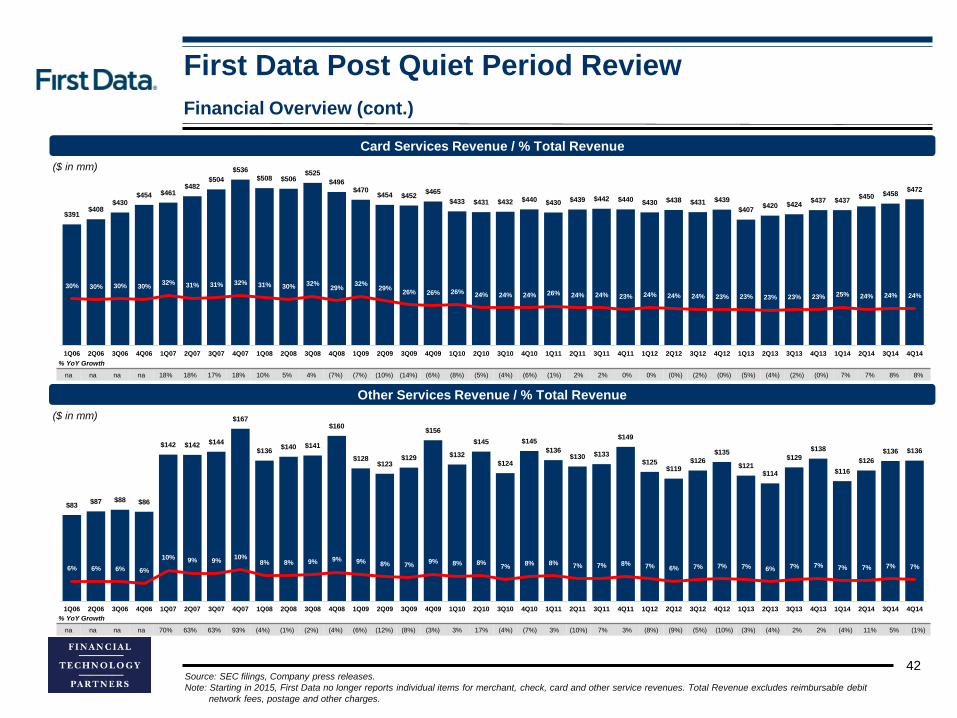
Financial Overview (cont.)
Source: SEC filings, Company press releases.
Note: Starting in 2015, First Data no longer reports individual items for merchant, check, card and other service revenues. Total Revenue excludes reimbursable debit
network fees, postage and other charges.
$391 $408
$430 $454 $461
$482 $504
$536
$508 $506 $525
$496 $470
$454 $452 $465
$433 $431 $432 $440 $430 $439 $442 $440 $430 $438 $431 $439
$407 $420 $424
$437 $437 $450 $458
$472
30% 30% 30% 30% 32% 31% 31% 32% 31% 30% 32%
29% 32%
29% 26% 26% 26% 24% 24% 24% 26% 24% 24% 23% 24% 24% 24% 23% 23% 23% 23% 23% 25% 24% 24% 24%
-
20%
40%
60%
80%
100%
120%
$0
$100
$200
$300
$400
$500
$600
1Q06 2Q06 3Q06 4Q06 1Q07 2Q07 3Q07 4Q07 1Q08 2Q08 3Q08 4Q08 1Q09 2Q09 3Q09 4Q09 1Q10 2Q10 3Q10 4Q10 1Q11 2Q11 3Q11 4Q11 1Q12 2Q12 3Q12 4Q12 1Q13 2Q13 3Q13 4Q13 1Q14 2Q14 3Q14 4Q14
($ in mm)
Other Services Revenue / % Total Revenue
Card Services Revenue / % Total Revenue
$83 $87 $88 $86
$142 $142 $144
$167
$136 $140 $141
$160
$128 $123
$129
$156
$132
$145
$124
$145
$136 $130 $133
$149
$125 $119
$126
$135
$121 $114
$129
$138
$116
$126
$136 $136
6% 6% 6% 6%
10% 9% 9% 10%
8% 8% 9% 9% 9% 8% 7% 9% 8% 8%
7% 8% 8% 7% 7% 8% 7% 6% 7% 7% 7% 6% 7% 7% 7% 7% 7% 7%
-
10%
20%
30%
40%
50%
60%
$0
$20
$40
$60
$80
$100
$120
$140
$160
$180
1Q06 2Q06 3Q06 4Q06 1Q07 2Q07 3Q07 4Q07 1Q08 2Q08 3Q08 4Q08 1Q09 2Q09 3Q09 4Q09 1Q10 2Q10 3Q10 4Q10 1Q11 2Q11 3Q11 4Q11 1Q12 2Q12 3Q12 4Q12 1Q13 2Q13 3Q13 4Q13 1Q14 2Q14 3Q14 4Q14
% YoY Growth
na na na na 18% 18% 17% 18% 10% 5% 4% (7%) (7%) (10%) (14%) (6%) (8%) (5%) (4%) (6%) (1%) 2% 2% 0% 0% (0%) (2%) (0%) (5%) (4%) (2%) (0%) 7% 7% 8% 8%
% YoY Growth
na na na na 70% 63% 63% 93% (4%) (1%) (2%) (4%) (6%) (12%) (8%) (3%) 3% 17% (4%) (7%) 3% (10%) 7% 3% (8%) (9%) (5%) (10%) (3%) (4%) 2% 2% (4%) 11% 5% (1%)
($ in mm)

First Data Post Quiet Period Review
43
Financial Overview (cont.)
Source: SEC filings, Company press releases.
Note: Total Revenue excludes reimbursable debit network fees, postage and other charges.
$147
$129 $132
$163 $158
$192
$211 $204
$268
$250
$191
$216
$180
$205
$184
$228
$195 $208 $205 $202 $197
$217 $228
$210 $203
$217 $218 $229
$202 $205 $216 $214
$204 $211
$224
$254
$217
$279
$309
11% 9% 9% 11% 11% 12% 13% 12% 16% 15%
12% 13% 12% 13% 11% 13% 12% 12% 12% 11% 12% 12% 13% 11% 12% 12% 12% 12% 12% 11% 12% 11% 12% 11% 12% 13% 12%
14% 16%
-
20%
40%
60%
80%
100%
120%
$0
$50
$100
$150
$200
$250
$300
$350
1Q06 2Q06 3Q06 4Q06 1Q07 2Q07 3Q07 4Q07 1Q08 2Q08 3Q08 4Q08 1Q09 2Q09 3Q09 4Q09 1Q10 2Q10 3Q10 4Q10 1Q11 2Q11 3Q11 4Q11 1Q12 2Q12 3Q12 4Q12 1Q13 2Q13 3Q13 4Q13 1Q14 2Q14 3Q14 4Q14 1Q15 2Q15 3Q15
($ in mm)
Reimbursable Debit Network Fees, Postage & Other Expenses
Product Sales & Other Revenues / % Total Revenue
$340 $359 $364 $405 $411
$431 $445 $481 $479
$511 $511
$600 $590 $632
$720
$787 $759
$850 $859
$922
$864
$939 $920
$808 $807 $846 $844 $864 $845
$875 $876 $911
$875
$930 $888
$911 $873
$926 $938
$0
$200
$400
$600
$800
$1,000
1Q06 2Q06 3Q06 4Q06 1Q07 2Q07 3Q07 4Q07 1Q08 2Q08 3Q08 4Q08 1Q09 2Q09 3Q09 4Q09 1Q10 2Q10 3Q10 4Q10 1Q11 2Q11 3Q11 4Q11 1Q12 2Q12 3Q12 4Q12 1Q13 2Q13 3Q13 4Q13 1Q14 2Q14 3Q14 4Q14 1Q15 2Q15 3Q15
% YoY Growth
na na na na 7% 49% 60% 25% 70% 30% (9%) 6% (33%) (18%) (4%) 5% 8% 1% 12% (11%) 1% 5% 11% 4% 3% (0%) (4%) 9% (0%) (6%) (1%) (6%) 1% 3% 4% 18% 6% 32% 38%
% YoY Growth
na na na na 21% 20% 22% 19% 17% 19% 15% 25% 23% 24% 41% 31% 29% 34% 19% 17% 14% 10% 7% (12)% (7%) (10%) (8%) 7% 5% 3% 4% 5% 4% 6% 1% (0%) (0%) (0%) 6%
($ in mm)

First Data Post Quiet Period Review
44
Financial Overview (cont.)
Source: SEC filings, Company press releases.
Note: Total Revenue and Operating Expenses excludes reimbursable debit network fees, postage and other charges.
(1) Total Operating Expenses in 2008 are adjusted to remove the one time impairment charges related to the restructuring / acquisition by KKR.
$1,083 $1,098 $1,128 $1,219 $1,230
$1,290
$1,555 $1,514
$1,451 $1,487 $1,529 $1,511
$1,456 $1,459
$1,609
$1,908
$1,573 $1,618 $1,634 $1,649
$1,573 $1,599 $1,519 $1,550 $1,540 $1,571 $1,578 $1,556 $1,555 $1,563 $1,532 $1,529
$1,480 $1,525 $1,550 $1,554 $1,562 $1,537
$1,580
14% 17%
38%
24% 18% 15%
(2%) (0%) 0% (2%)5%
26%
8% 11%
2%
(14%)
0% (1%)(7%) (6%)
(2%) (2%)4% 0% 1% (1%) (3%) (2%) (5%) (2%)
1% 2% 6%
1% 2%
-0.3
0.2
0.7
1.2
1.7
$0
$500
$1,000
$1,500
$2,000
1Q06 2Q06 3Q06 4Q06 1Q07 2Q07 3Q07 4Q07 1Q08 2Q08 3Q08 4Q08 1Q09 2Q09 3Q09 4Q09 1Q10 2Q10 3Q10 4Q10 1Q11 2Q11 3Q11 4Q11 1Q12 2Q12 3Q12 4Q12 1Q13 2Q13 3Q13 4Q13 1Q14 2Q14 3Q14 4Q14 1Q15 2Q15 3Q15
($ in mm)
Cost of Services / % Total Revenue
Total Operating Expenses / % Growth
$732 $743 $781
$809
$691 $720
$844
$742 $757
$709 $722 $682
$714 $673
$757 $801
$756 $753 $743 $772
$717 $720 $746
$707 $695 $713 $729 $726 $719
$692 $709 $690
$646 $687 $692
$716 $734
$655 $686
56% 54% 55% 53%
49% 46%
52%
45% 46% 42% 44%
40%
48% 43% 44% 45% 46%
43% 42% 43% 43% 40% 41%
38% 40% 39% 40% 38% 41%
38% 39% 37% 37% 36% 36% 36% 40%
34% 35%
-
20%
40%
60%
80%
100%
120%
$0
$100
$200
$300
$400
$500
$600
$700
$800
$900
$1,000
1Q06 2Q06 3Q06 4Q06 1Q07 2Q07 3Q07 4Q07 1Q08 2Q08 3Q08 4Q08 1Q09 2Q09 3Q09 4Q09 1Q10 2Q10 3Q10 4Q10 1Q11 2Q11 3Q11 4Q11 1Q12 2Q12 3Q12 4Q12 1Q13 2Q13 3Q13 4Q13 1Q14 2Q14 3Q14 4Q14 1Q15 2Q15 3Q15
% YoY Growth
na na na na (5%) (3%) 8% (8%) 9% (2%) (14%) (8%) (6%) (5%) 5% 17% 6% 12% (2%) (4%) (5%) (4%) 0% (8%) (3%) (1%) (2%) 3% 3% (3%) (3%) (5%) (10%) (1%) (2%) 4% 14% (5%) (1%)
($ in mm)
(1)
First Data Post Quiet Period Review
45
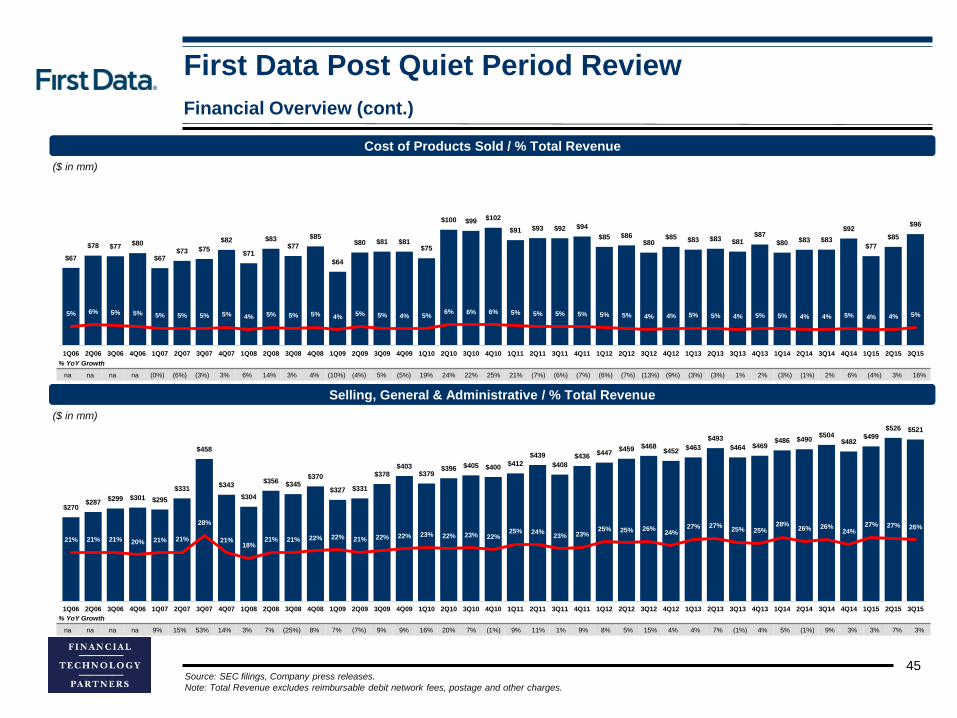
Financial Overview (cont.)
Source: SEC filings, Company press releases.
Note: Total Revenue excludes reimbursable debit network fees, postage and other charges.
$67
$78 $77 $80
$67 $73 $75
$82
$71
$83 $77
$85
$64
$80 $81 $81 $75
$100 $99 $102
$91 $93 $92 $94
$85 $86 $80
$85 $83 $83 $81 $87
$80 $83 $83
$92
$77
$85
$96
5% 6% 5% 5% 5% 5% 5% 5% 4% 5% 5% 5% 4% 5% 5% 4% 5% 6% 6% 6% 5% 5% 5% 5% 5% 5% 4% 4% 5% 5% 4% 5% 5% 4% 4% 5% 4% 4% 5%
-
5%
10%
15%
20%
25%
30%
35%
40%
45%
50%
$0
$20
$40
$60
$80
$100
$120
$140
$160
1Q06 2Q06 3Q06 4Q06 1Q07 2Q07 3Q07 4Q07 1Q08 2Q08 3Q08 4Q08 1Q09 2Q09 3Q09 4Q09 1Q10 2Q10 3Q10 4Q10 1Q11 2Q11 3Q11 4Q11 1Q12 2Q12 3Q12 4Q12 1Q13 2Q13 3Q13 4Q13 1Q14 2Q14 3Q14 4Q14 1Q15 2Q15 3Q15
($ in mm)
Selling, General & Administrative / % Total Revenue
Cost of Products Sold / % Total Revenue
$270 $287
$299 $301 $295
$331
$458
$343
$304
$356 $345 $370
$327 $331
$378 $403
$379 $396 $405 $400
$412
$439
$408
$436 $447
$459 $468 $452
$463
$493
$464 $469 $486 $490
$504 $482
$499
$526 $521
21% 21% 21% 20% 21% 21%
28%
21% 18%
21% 21% 22% 22% 21% 22% 22% 23% 22% 23% 22% 25% 24%
23% 23% 25% 25% 26%
24% 27% 27%
25% 25% 28%
26% 26% 24%
27% 27% 26%
-
10%
20%
30%
40%
50%
60%
70%
80%
$0
$100
$200
$300
$400
$500
$600
1Q06 2Q06 3Q06 4Q06 1Q07 2Q07 3Q07 4Q07 1Q08 2Q08 3Q08 4Q08 1Q09 2Q09 3Q09 4Q09 1Q10 2Q10 3Q10 4Q10 1Q11 2Q11 3Q11 4Q11 1Q12 2Q12 3Q12 4Q12 1Q13 2Q13 3Q13 4Q13 1Q14 2Q14 3Q14 4Q14 1Q15 2Q15 3Q15
% YoY Growth
na na na na (0%) (6%) (3%) 3% 6% 14% 3% 4% (10%) (4%) 5% (5%) 19% 24% 22% 25% 21% (7%) (6%) (7%) (6%) (7%) (13%) (9%) (3%) (3%) 1% 2% (3%) (1%) 2% 6% (4%) 3% 16%
% YoY Growth
na na na na 9% 15% 53% 14% 3% 7% (25%) 8% 7% (7%) 9% 9% 16% 20% 7% (1%) 9% 11% 1% 9% 8% 5% 15% 4% 4% 7% (1%) 4% 5% (1%) 9% 3% 3% 7% 3%
($ in mm)
First Data Post Quiet Period Review
46
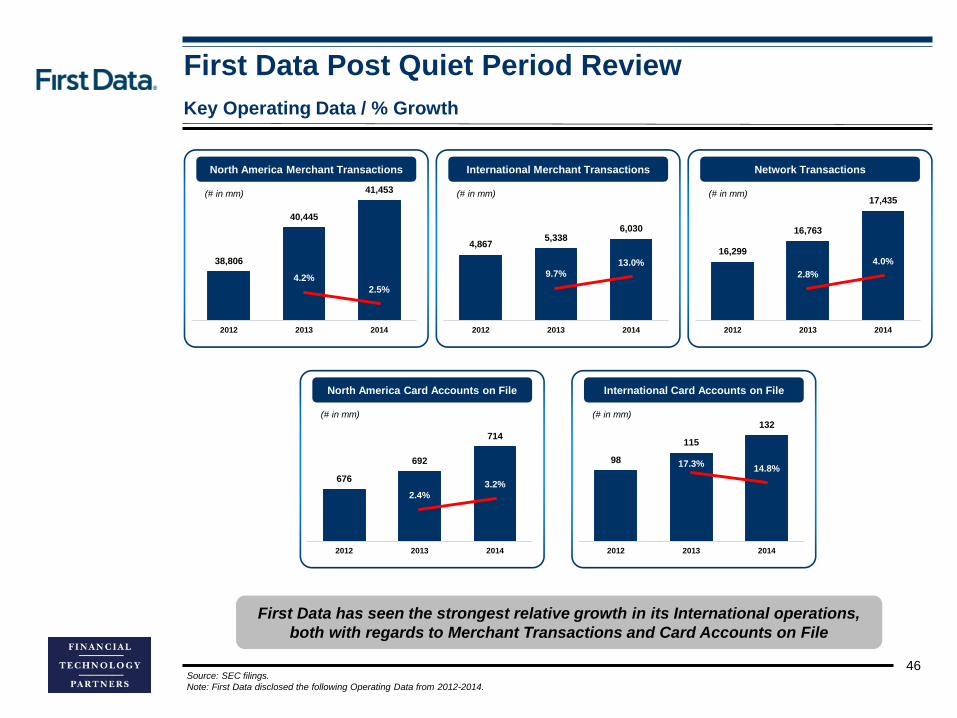
Key Operating Data / % Growth
Source: SEC filings.
Note: First Data disclosed the following Operating Data from 2012-2014.
38,806
40,445
41,453
4.2%
2.5%
-
2.0%
4.0%
6.0%
8.0%
10.0%
12.0%
14.0%
16.0%
18.0%
20.0%
37000
37500
38000
38500
39000
39500
40000
40500
41000
41500
42000
2012 2013 2014
North America Merchant Transactions
(# in mm)
4,8675,338
6,030
9.7%
13.0%
-
5.0%
10.0%
15.0%
20.0%
25.0%
30.0%
35.0%
40.0%
0
1000
2000
3000
4000
5000
6000
7000
8000
9000
10000
2012 2013 2014
International Merchant Transactions
(# in mm)
676
692
714
2.4%
3.2%
-
1.0%
2.0%
3.0%
4.0%
5.0%
6.0%
7.0%
8.0%
9.0%
10.0%
630
650
670
690
710
730
750
2012 2013 2014
North America Card Accounts on File
(# in mm)
16,299
16,763
17,435
2.8%
4.0%
-
2.0%
4.0%
6.0%
8.0%
10.0%
12.0%
15000
15500
16000
16500
17000
17500
18000
2012 2013 2014
Network Transactions
(# in mm)
98
115
132
17.3% 14.8%
-
5.0%
10.0%
15.0%
20.0%
25.0%
30.0%
30
50
70
90
110
130
150
2012 2013 2014
International Card Accounts on File
(# in mm)
First Data has seen the strongest relative growth in its International operations,
both with regards to Merchant Transactions and Card Accounts on File

First Data Post Quiet Period Review
Cash and Cash Equivalents $368Short-term borrowings
Foreign lines of credit and other arrangements $33Senior secured revolving credit facility 260
Total Short-term borrowing 293
Current portion of long-term borrowingCapital lease obligations 68
Total Current portion of long-term borrowing 68Total Short-term and current portio of long-term borrowing 361
Long-term borrowingSenior secured term loan facility due March 2017, net of unamortized discount of $3 and $4 1,456Senior secured term loan facility due March 2018, net of unamortized discount of $29 and $38 4,918Senior secured term loan facility due September 2018, net of unamortized discount of $16 and $21 992Senior secured term loan facility due March 2021, net of unamortized discount of $9 and $11 1,167Senior secured term loan facility due July 2022, net of unamortized discount of $16 9887.375% Senior secured first lien notes due 2019, net of unamortized discount of $0 and $19 -8.875% Senior secured first lien notes due 2020, net of unamortized discount of $0 and $10 -6.75% Senior secured first lien notes due 2020, net of unamortized discount of $12 and $14 1,3855.375% Senior secured first lien notes due 2023, net of unamortized discount of $12 1,1988.25% Senior secured second lien notes due 2021, net of unamortized discount of $10 and $11 1,9908.75% Senior secured second lien notes due 2022, net of unamortized discount of $5 and $6 99512.625% Senior unsecured notes due 2021, net of unamortized discount of $14 and $16 2,98610.625% Senior unsecured notes due 2021, net of unamortized discount of $14 and $16 52911.25% Senior unsecured notes due 2021, net of unamortized discount of $8 and $10 50211.75% Senior unsecured subordinate notes due 2021, net of unamortized discount of $1 1,608Capital lease obligation 102
Total Long-term borrowings 20,816Toal Borrowings $21,177Net Debt $20,809
LTM Interest Expense ($1,630)LTM Adjusted EBITDA 2,425
LTM Adjusted EBITDA / LTM Interest Expense 1.5xTotal Debt / LTM Adjusted EBITDA 8.7xNet Debt / LTM Adjusted EBITDA 8.6x
$545
$913
$574 $479
$705 $774
400
600
800
1000
1200
1400
2010 2011 2012 2013 2014 LTMSep-2015
47
Debt Overview
First Data Debt Breakdown (in mm) As of Sept. 2015
Source: SEC filings.
(1) Free Cash Flow is calculated as Operating Cash Flows from Continuing Operations less Capital Expenditures.
$1,797 $1,833 $1,898 $1,881 $1,753
$1,630
1000
1200
1400
1600
1800
2000
2200
2400
2600
2800
3000
2010 2011 2012 2013 2014 LTMSep-2015
Historical Interest Expense
$210 $203 $193 $194
$308 $309
100
150
200
250
300
350
400
450
2010 2011 2012 2013 2014 LTMSep-2015
Historical CAPEX
Free Cashflow (1)
($ in mm)
($ in mm)
($ in mm)

III. Public Comparables / Valuation

First Data Post Quiet Period Review
Market Enterprise Multiples Growth Rates Margins
Price % MTD % LTM Value Value Price / Earnings EV / EBITDA EV / Revenue Revenue EPS EBITDA P / E / G
Company Name 11/12/15 Change High ($ mm) ($ mm) LTM CY 15E CY 16E LTM CY 15E CY 16E LTM CY 15E CY 16E CY 15E CY 16E LT CY 15E CY 16E CY 15E
49
Public Comparables
Source: Company filings, Capital IQ.
Merchant Acquiring / Processing
First Data $ 17.67 12 % 98 % $ 15,856 $ 37,222 26.2 x 25.6 x 12.7 x 14.3 x 13.9 x 12.9 x 5.0 x 4.9 x 4.7 x 1 % 4 % 22 % 35 % 36 % 1.1 x
Cielo 9.74 1 80 18,356 22,514 18.8 19.2 16.5 18.0 15.8 14.0 8.4 7.6 6.9 47 11 14 48 49 1.3
TSYS 53.07 1 96 9,907 10,908 29.1 21.7 20.1 16.7 13.1 12.2 4.0 4.0 3.7 13 7 9 30 30 2.3
Vantiv 50.54 1 96 7,467 10,739 nm 22.7 19.4 15.7 13.3 12.0 3.5 6.4 5.9 19 9 14 49 49 1.6
Global Payments 68.89 1 98 8,984 10,606 38.4 25.2 22.0 17.3 17.3 15.4 3.8 4.4 4.9 (9) (10) 12 25 32 2.0
Worldpay 4.20 (1) 94 8,392 10,481 3.0 na na 19.2 na na 7.5 na na na na na na na na
Heartland 75.33 2 96 2,781 3,236 34.6 26.0 22.4 16.0 14.7 12.9 4.1 4.0 3.6 23 9 16 27 28 1.7
Worldline 24.77 4 98 3,277 2,993 29.2 24.5 22.4 13.5 11.9 10.9 2.3 2.3 2.1 6 7 11 19 20 2.3
EVERTEC 16.54 (9) 72 1,276 1,907 23.3 9.8 9.4 12.2 10.5 9.9 5.1 5.1 5.0 3 3 16 49 50 0.6
Median 1 % 96 % 27.7 x 23.6 x 19.8 x 16.0 x 13.6 x 12.5 x 4.1 x 4.6 x 4.8 x 10 % 7 % 14 % 33 % 34 % 1.6 x
Mean 1 92nana 25.3 21.8 18.1 15.9 13.8 12.5na 4.9 4.8 4.6na 13 5na 14 35 37 1.6
Pure Play Card Associations
Visa $ 78.31 1 % 98 % $ 191,433 $ 186,711 33.8 x 30.6 x 26.3 x 19.5 x 19.3 x 17.1 x 13.5 x 13.3 x 12.0 x 9 % 10 % 17 % 69 % 70 % 1.8 x
MasterCard 98.28 (1) 97 111,080 107,497 35.4 29.2 25.2 19.6 19.0 16.6 11.2 11.1 9.9 3 12 18 58 60 1.6
Median 0 % 97 %nana 29.9 x 25.7 x na 19.6 x 19.1 x 16.9 x na 12.3 x 12.2 x 11.0 xna 6 % 11 % 17 % 64 % 65 % 1.7 x
Mean 0 97nana 29.9 25.7na 19.6 19.1 16.9na 12.3 12.2 11.0na 6 11 17 64 65 1.7
Online Focused Payments
PayPal $ 35.57 (1)% 84 % $ 43,223 $ 38,924 47.0 x 28.1 x 23.7 x 20.5 x 15.9 x 13.5 x 4.4 x 4.2 x 3.6 x 15 % 16 % 18 % 27 % 27 % 1.6 x
Wirecard 49.50 (2) 94 6,113 5,318 nm 36.5 28.8 25.5 22.0 17.5 7.1 6.5 5.3 26 24 28 30 30 1.3
PaySafe (fka Optimal Payments) 5.34 14 61 2,599 2,637 32.7 20.4 14.8 34.4 18.9 11.0 6.2 4.5 3.1 54 46 na 24 28 na
SafeCharge 5.61 38 90 860 684 36.9 21.7 17.6 16.6 14.5 11.8 4.9 4.4 3.6 38 20 na 30 31 na
OzForex 1.87 (7) 88 449 405 30.9 24.0 19.7 16.8 15.6 12.9 5.1 5.3 4.4 28 20 na 34 34 na
Pushpay 5.09 9 93 255 255 nm na na nm na na nm na na na na na na na na
Earthport 0.57 (4) 78 254 205 nm nm nm nm nm 17.8 7.0 5.5 3.5 64 58 na (1) 19 na
JetPay 2.87 1 83 40 84 nm nm nm 24.8 21.9 17.0 2.0 2.0 1.8 32 7 na 9 11 na
Median (0)% 86 % 34.8 x 24.0 x 19.7 x 22.7 x 17.4 x 13.5 x 5.1 x 4.5 x 3.6 x 32 % 20 % 23 % 27 % 28 % 1.4 x
Mean 6 84 36.9 26.1 20.9 23.1 18.1 14.5 5.2 4.6 3.6 37 27 23 22 26 1.4

First Data Post Quiet Period Review
B2B Payment Solutions
FleetCor $ 150.63 4 % 91 % $ 14,288 $ 16,954 37.1 x 24.2 x 21.0 x 19.6 x 18.6 x 16.4 x 10.3 x 9.9 x 9.3 x 43 % 7 % 15 % 53 % 57 % 1.6 x
Edenred 18.32 2 63 4,196 5,163 19.9 19.3 18.5 14.7 12.4 11.8 4.7 4.5 4.4 3 3 9 37 37 2.1
WEX 89.23 (1) 75 3,450 4,167 25.0 18.7 17.1 12.4 12.4 10.4 4.9 4.9 4.4 4 12 15 40 42 1.2
Median 2 % 75 % 25.0 x 19.3 x 18.5 x 14.7 x 12.4 x 11.8 x 4.9 x 4.9 x 4.4 x 4 % 7 % 15 % 40 % 42 % 1.6 x
Mean 2 76 27.3 20.7 18.9 15.6 14.4 12.9 6.6 6.5 6.0 16 7 13 43 45 1.6
Prepaid / Debit Payments
Blackhawk $ 44.65 5 % 95 % $ 2,589 $ 2,854 nm 19.3 x 17.0 x 18.1 x 14.8 x 12.6 x 6.4 x 3.1 x 2.5 x 37 % 21 % 18 % 21 % 20 % 1.1 x
Green Dot 16.35 (12) 72 882 636 19.5 12.5 12.0 5.5 4.2 4.1 0.9 0.9 0.9 15 2 12 22 22 1.1
Higher One 3.08 5 67 147 187 nm 7.5 8.9 8.1 3.8 6.1 0.9 0.9 1.0 (9) (10) 17 24 16 0.4
Median 5 % 72 % 19.5 x 12.5 x 12.0 x 8.1 x 4.2 x 6.1 x 0.9 x 0.9 x 1.0 x 15 % 2 % 17 % 22 % 20 % 1.1 x
Mean (1) 78 19.5 13.1 12.6 10.6 7.6 7.6 2.7 1.6 1.5 14 5 16 22 19 0.9
Other Financial Transaction Processors / Services
Qiwi $ 1,154.28 5 % 49 % $ 66,387 $ 66,134 15.4 x nm nm 13.0 x nm nm 3.9 x nm nm 23 % 37 % 25 % 56 % 53 % na
Alliance Data Systems 290.82 (2) 93 17,823 32,377 32.6 19.3 16.9 20.1 17.6 15.5 5.2 5.0 4.4 22 12 15 28 29 1.3
Euronet 78.41 (2) 95 4,350 4,291 47.7 23.6 20.4 16.2 14.5 12.0 2.4 2.4 2.1 10 12 15 16 18 1.6
Deluxe 55.57 (7) 80 2,764 3,221 13.2 12.2 11.5 8.1 7.3 6.8 1.8 1.8 1.7 6 4 9 25 26 1.4
Cardtronics 34.61 0 86 1,557 2,171 21.7 12.0 10.7 8.1 7.2 6.6 1.8 1.8 1.7 14 6 14 25 26 0.9
Everi Holdings 3.89 (17) 46 257 1,301 nm 4.4 3.8 7.7 6.4 6.3 1.7 1.6 1.6 41 1 20 25 25 0.2
NIC 19.97 5 96 1,310 1,188 31.7 31.2 29.0 16.0 16.3 12.8 4.1 4.1 3.8 7 8 18 25 29 1.7
PayPoint 15.05 0 89 1,024 957 21.8 17.4 15.2 11.8 11.3 10.5 2.9 2.9 2.8 1 3 5 25 26 3.6
De La Rue 6.77 (4) 74 685 862 12.5 12.0 11.9 6.3 6.7 6.6 1.2 1.2 1.2 (8) 1 na 18 18 na
Valid 11.60 0 84google 750 792 20.3 17.2 14.3 11.8 9.8 7.8 1.9 1.9 1.5 22 23 13 19 19 1.3
Eckoh 0.69 2 95 175 173 nm 29.9 28.8 36.2 22.0 18.1 6.6 6.6 5.5 19 21 na 30 30 na
MOL Global 2.10 (17) 5 142 127 nm na na nm na na 0.6 na na na na na na na na
Median (1)% 85 % 21.7 x 17.3 x 14.8 x 11.8 x 10.5 x 9.2 x 2.2 x 2.1 x 1.9 x 14 % 8 % 15 % 25 % 26 % 1.3 x
Mean (3) 74 24.1 17.9 16.3 14.1 11.9 10.3 2.9 2.9 2.6 14 12 15 27 27 1.5
50
Public Comparables (cont.)
Source: Company filings, Capital IQ, Wall Street research.
Market Enterprise Multiples Growth Rates Margins
Price % MTD % LTM Value Value Price / Earnings EV / EBITDA EV / Revenue Revenue EPS EBITDA P / E / G
Company Name 11/12/15 Change High ($ mm) ($ mm) LTM CY 15E CY 16E LTM CY 15E CY 16E LTM CY 15E CY 16E CY 15E CY 16E LT CY 15E CY 16E CY 15E
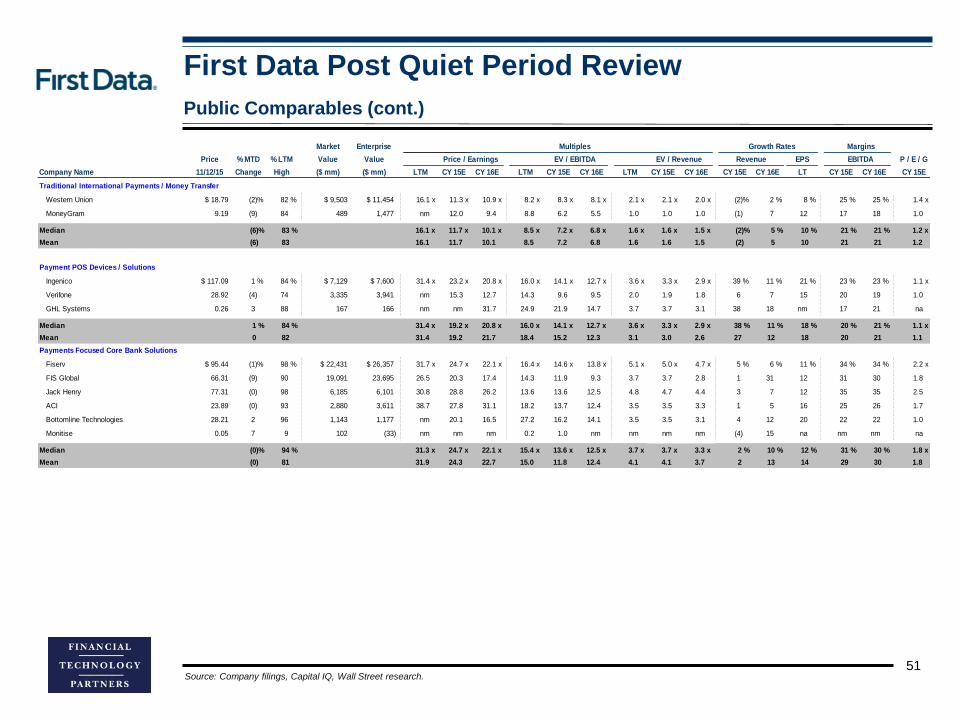
First Data Post Quiet Period Review
Traditional International Payments / Money Transfer
Western Union $ 18.79 (2)% 82 % $ 9,503 $ 11,454 16.1 x 11.3 x 10.9 x 8.2 x 8.3 x 8.1 x 2.1 x 2.1 x 2.0 x (2)% 2 % 8 % 25 % 25 % 1.4 x
MoneyGram 9.19 (9) 84 489 1,477 nm 12.0 9.4 8.8 6.2 5.5 1.0 1.0 1.0 (1) 7 12 17 18 1.0
Median (6)% 83 % 16.1 x 11.7 x 10.1 x 8.5 x 7.2 x 6.8 x 1.6 x 1.6 x 1.5 x (2)% 5 % 10 % 21 % 21 % 1.2 x
Mean (6) 83 16.1 11.7 10.1 8.5 7.2 6.8 1.6 1.6 1.5 (2) 5 10 21 21 1.2
Payment POS Devices / Solutions
Ingenico $ 117.09 1 % 84 % $ 7,129 $ 7,600 31.4 x 23.2 x 20.8 x 16.0 x 14.1 x 12.7 x 3.6 x 3.3 x 2.9 x 39 % 11 % 21 % 23 % 23 % 1.1 x
Verifone 28.92 (4) 74 3,335 3,941 nm 15.3 12.7 14.3 9.6 9.5 2.0 1.9 1.8 6 7 15 20 19 1.0
GHL Systems 0.26 3 88 167 166 nm nm 31.7 24.9 21.9 14.7 3.7 3.7 3.1 38 18 nm 17 21 na
Median 1 % 84 % 31.4 x 19.2 x 20.8 x 16.0 x 14.1 x 12.7 x 3.6 x 3.3 x 2.9 x 38 % 11 % 18 % 20 % 21 % 1.1 x
Mean 0 82 31.4 19.2 21.7 18.4 15.2 12.3 3.1 3.0 2.6 27 12 18 20 21 1.1
Payments Focused Core Bank Solutions
Fiserv $ 95.44 (1)% 98 % $ 22,431 $ 26,357 31.7 x 24.7 x 22.1 x 16.4 x 14.6 x 13.8 x 5.1 x 5.0 x 4.7 x 5 % 6 % 11 % 34 % 34 % 2.2 x
FIS Global 66.31 (9) 90 19,091 23,695 26.5 20.3 17.4 14.3 11.9 9.3 3.7 3.7 2.8 1 31 12 31 30 1.8
Jack Henry 77.31 (0) 98 6,185 6,101 30.8 28.8 26.2 13.6 13.6 12.5 4.8 4.7 4.4 3 7 12 35 35 2.5
ACI 23.89 (0) 93 2,880 3,611 38.7 27.8 31.1 18.2 13.7 12.4 3.5 3.5 3.3 1 5 16 25 26 1.7
Bottomline Technologies 28.21 2 96 1,143 1,177 nm 20.1 16.5 27.2 16.2 14.1 3.5 3.5 3.1 4 12 20 22 22 1.0
Monitise 0.05 7 9 102 (33) nm nm nm 0.2 1.0 nm nm nm nm (4) 15 na nm nm na
Median (0)% 94 % 31.3 x 24.7 x 22.1 x 15.4 x 13.6 x 12.5 x 3.7 x 3.7 x 3.3 x 2 % 10 % 12 % 31 % 30 % 1.8 x
Mean (0) 81 31.9 24.3 22.7 15.0 11.8 12.4 4.1 4.1 3.7 2 13 14 29 30 1.8
51
Public Comparables (cont.)
Source: Company filings, Capital IQ, Wall Street research.
Market Enterprise Multiples Growth Rates Margins
Price % MTD % LTM Value Value Price / Earnings EV / EBITDA EV / Revenue Revenue EPS EBITDA P / E / G
Company Name 11/12/15 Change High ($ mm) ($ mm) LTM CY 15E CY 16E LTM CY 15E CY 16E LTM CY 15E CY 16E CY 15E CY 16E LT CY 15E CY 16E CY 15E
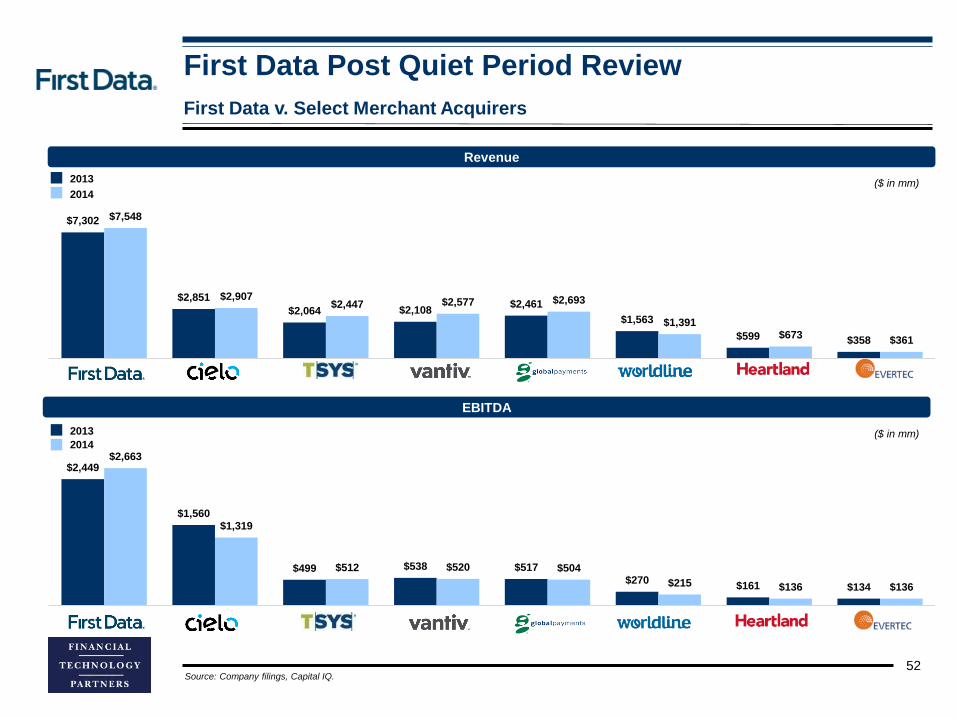
First Data Post Quiet Period Review
$2,449
$1,560
$499 $538 $517
$270$161 $134
$2,663
$1,319
$512 $520 $504
$215 $136 $136
0
500
1,000
1,500
2,000
2,500
3,000
FD CIEL3 TSS VNTV GPN WLN HPY EVTC
52
First Data v. Select Merchant Acquirers
Source: Company filings, Capital IQ.
$7,302
$2,851
$2,064 $2,108$2,461
$1,563
$599 $358
$7,548
$2,907$2,447 $2,577 $2,693
$1,391$673
$361
0
1,000
2,000
3,000
4,000
5,000
6,000
7,000
8,000
9,000
FD CIEL3 TSS VNTV GPN WLN HPY EVTC
Revenue
EBITDA
2013
2014
2013
2014
($ in mm)
($ in mm)
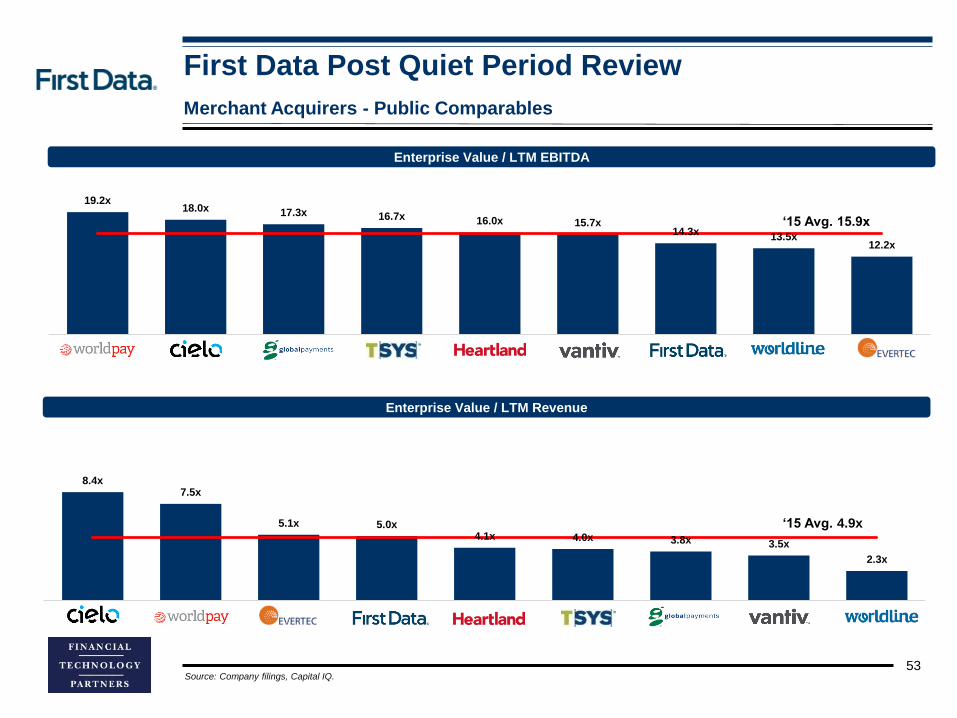
First Data Post Quiet Period Review
53
Merchant Acquirers - Public Comparables
19.2x18.0x 17.3x 16.7x 16.0x 15.7x
14.3x13.5x
12.2x
-3
2
7
12
17
22
(3.0)x
2.0 x
7.0 x
12.0 x
17.0 x
22.0 x
Cielo Global TSYS Heartland Vantiv FDC Worldline Evertec
Enterprise Value / LTM EBITDA
8.4x7.5x
5.1x 5.0x4.1x 4.0x 3.8x 3.5x
2.3x
0
2
4
6
8
10
12
0.0 x
2.0 x
4.0 x
6.0 x
8.0 x
10.0 x
12.0 x
Worldpay Evertec FDC Heartland TSYS Global Vantiv Worldline
Enterprise Value / LTM Revenue
Source: Company filings, Capital IQ.
‘15 Avg. 15.9x
‘15 Avg. 4.9x

First Data Post Quiet Period Review
54
Merchant Acquirers - Public Comparables
13.9x
15.8x
13.1x 13.3x
17.3x
11.9x
14.7x
12.2x12.9x14.0x
12.2x 12.0x
15.4x
10.9x
12.9x
10.5x
0
5
10
15
20
0.0 x
5.0 x
10.0 x
15.0 x
20.0 x
FDC Cielo TSYS Vantiv Global Worldline Heartland Evertec
Enterprise Value / EBITDA
25.6x
19.2x
21.7x22.7x
25.2x 26.0x 26.0x
9.8x
12.7x
16.5x
20.1x 19.4x
22.0x 22.4x 22.4x
9.4x
0.0 x
5.0 x
10.0 x
15.0 x
20.0 x
25.0 x
30.0 x
0.0 x
5.0 x
10.0 x
15.0 x
20.0 x
25.0 x
30.0 x
FDC Cielo TSYS Vantiv Global Worldline Heartland Evertec
Price / Earnings
2015
2016
2015
2016
‘15 Avg. 14.0x
‘15 Avg. 22.0x
Source: Company filings, Capital IQ.
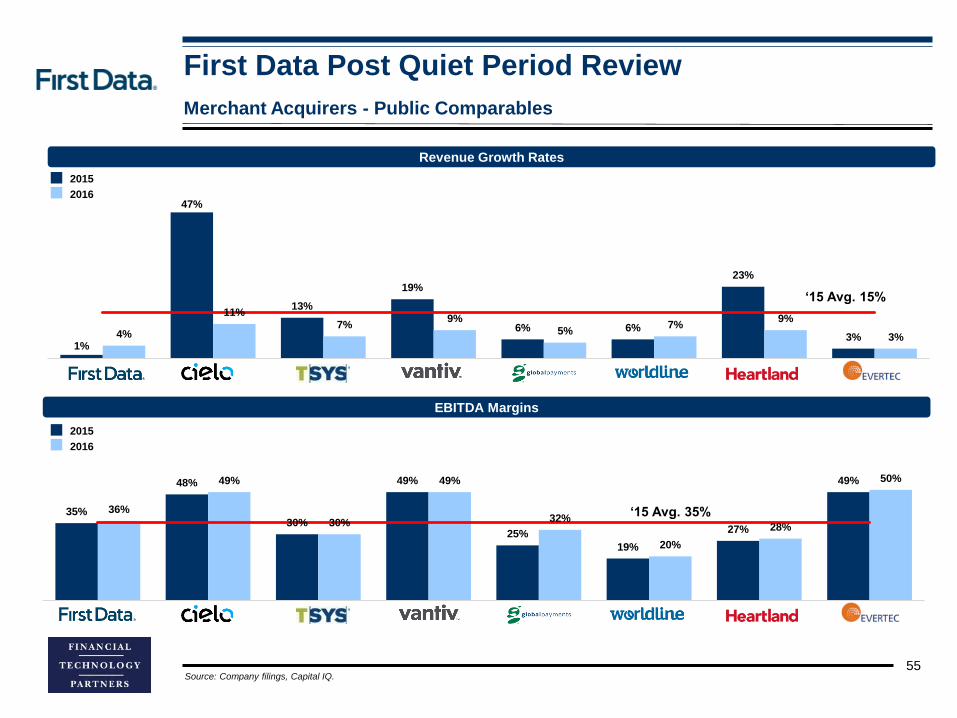
First Data Post Quiet Period Review
55
Merchant Acquirers - Public Comparables
Source: Company filings, Capital IQ.
1%
47%
13%
19%
6% 6%
23%
3%4%
11%7%
9%5%
7%9%
3%
0%
5%
10%
15%
20%
25%
30%
35%
40%
45%
50%
0%
5%
10%
15%
20%
25%
30%
35%
40%
45%
50%
FDC Cielo TSYS Vantiv Global Worldline Heartland Evertec
Revenue Growth Rates
2015
2016
35%
48%
30%
49%
25%
19%
27%
49%
36%
49%
30%
49%
32%
20%
28%
50%
0%
10%
20%
30%
40%
50%
60%
70%
0%
10%
20%
30%
40%
50%
60%
70%
FDC Cielo TSYS Vantiv Global Worldline Heartland Evertec
EBITDA Margins
2015
2016
‘15 Avg. 15%
‘15 Avg. 35%

First Data Post Quiet Period Review
Historical Forward P / E of Selected Merchant Acquirers
0x
10x
20x
30x
40x
50x
60x
70x
1999 2000 2001 2002 2003 2004 2005 2006 2007 2008 2009 2010 2011 2012 2013 2014 2015
Concord EFS Inc. (NYSE:CE) iPayment Inc. (NasdaqGM:IPMT)
First Data Corporation (NYSE:FDC) Heartland Payment Systems, Inc. (NYSE:HPY)
Global Payments Inc. (NYSE:GPN) Vantiv, Inc. (NYSE:VNTV)
Total System Services, Inc. (NYSE:TSS)
Source: Capital IQ, updated as of November 3, 2015.
Note: There is note enough underlying estimates available to calculate NTM EPS for TSS for 7/1/2000 – 7/5/2000.
56
Concord EFS was acquired by First Data on April 2, 2003
First Data was acquired by KKR on September 24, 2007
iPayment was acquired through a management buyout on
December 27, 2005
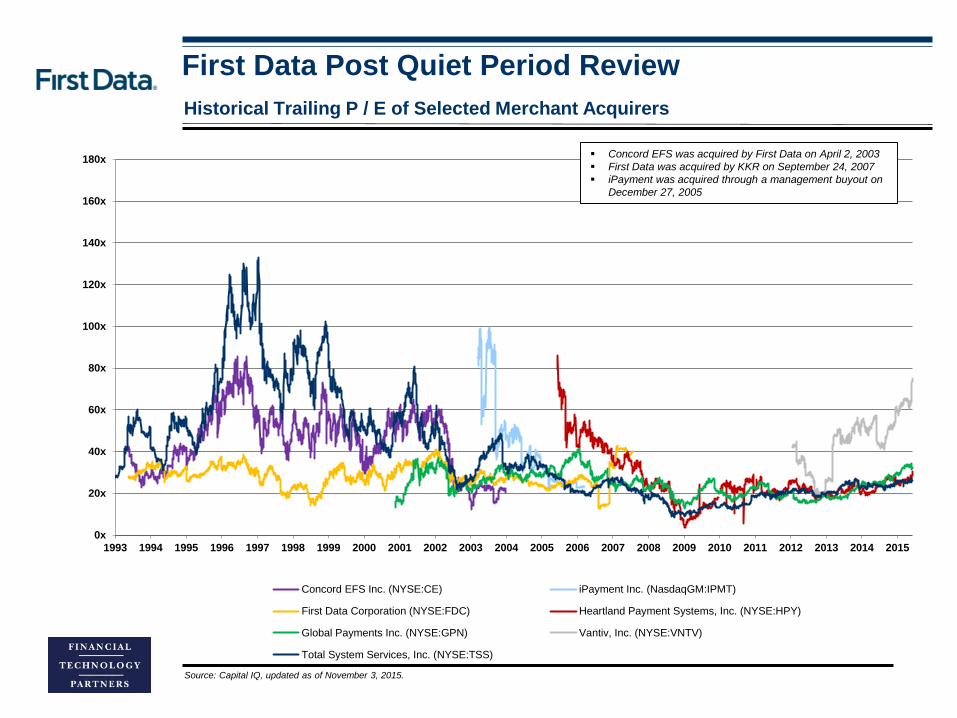
First Data Post Quiet Period Review
Historical Trailing P / E of Selected Merchant Acquirers
0x
20x
40x
60x
80x
100x
120x
140x
160x
180x
1993 1994 1995 1996 1997 1998 1999 2000 2001 2002 2003 2004 2005 2006 2007 2008 2009 2010 2011 2012 2013 2014 2015
Concord EFS Inc. (NYSE:CE) iPayment Inc. (NasdaqGM:IPMT)
First Data Corporation (NYSE:FDC) Heartland Payment Systems, Inc. (NYSE:HPY)
Global Payments Inc. (NYSE:GPN) Vantiv, Inc. (NYSE:VNTV)
Total System Services, Inc. (NYSE:TSS)
Source: Capital IQ, updated as of November 3, 2015.
Concord EFS was acquired by First Data on April 2, 2003
First Data was acquired by KKR on September 24, 2007
iPayment was acquired through a management buyout on
December 27, 2005
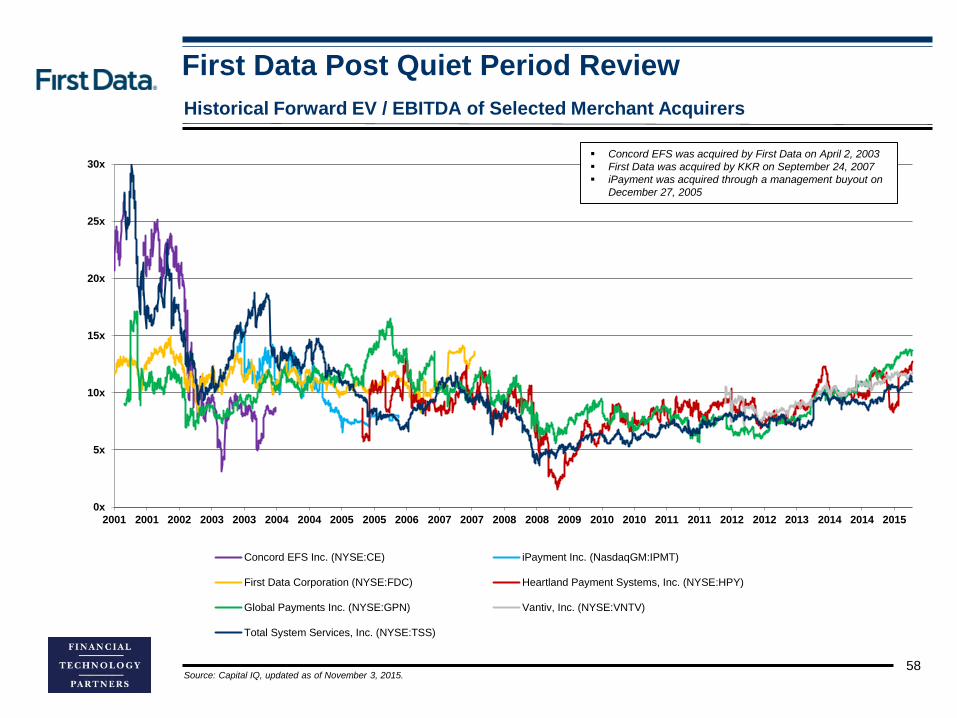
First Data Post Quiet Period Review
Historical Forward EV / EBITDA of Selected Merchant Acquirers
0x
5x
10x
15x
20x
25x
30x
2001 2001 2002 2003 2003 2004 2004 2005 2005 2006 2007 2007 2008 2008 2009 2010 2010 2011 2011 2012 2012 2013 2014 2014 2015
Concord EFS Inc. (NYSE:CE) iPayment Inc. (NasdaqGM:IPMT)
First Data Corporation (NYSE:FDC) Heartland Payment Systems, Inc. (NYSE:HPY)
Global Payments Inc. (NYSE:GPN) Vantiv, Inc. (NYSE:VNTV)
Total System Services, Inc. (NYSE:TSS)
Source: Capital IQ, updated as of November 3, 2015.58
Concord EFS was acquired by First Data on April 2, 2003
First Data was acquired by KKR on September 24, 2007
iPayment was acquired through a management buyout on
December 27, 2005

0x
10x
20x
30x
40x
50x
60x
1993 1994 1995 1996 1997 1998 1999 2000 2001 2002 2003 2004 2005 2006 2007 2008 2009 2010 2011 2012 2013 2014 2015
Concord EFS Inc. (NYSE:CE) iPayment Inc. (NasdaqGM:IPMT)
First Data Corporation (NYSE:FDC) Heartland Payment Systems, Inc. (NYSE:HPY)
Global Payments Inc. (NYSE:GPN) Vantiv, Inc. (NYSE:VNTV)
Total System Services, Inc. (NYSE:TSS)
First Data Post Quiet Period Review
Historical Trailing EV / EBITDA of Selected Merchant Acquirers
59Source: Capital IQ, updated as of November 3, 2015.
Concord EFS was acquired by First Data on April 2, 2003
First Data was acquired by KKR on September 24, 2007
iPayment was acquired through a management buyout on
December 27, 2005

IV. Overview of FT Partners

Overview of FT Partners
Selected FT Partners’ Research (click to view)
61
FT Partners regularly publishes research highlighting the most important transactions, trends and insights impacting the
global Financial Technology landscape. Our unique insight into FinTech is a direct result of executing hundreds of
transactions in the sector combined with over 13 years of exclusive focus on Financial Technology. Please visit our
subscription form to subscribe to our exclusive monthly newsletter and receive our research reports.
Visa Acquires Visa Europe
Research Report: Transaction Security Research Report: PayPal
Spin-off Overview
Research Report: Global Money Transfer Research Report: Apple Unveils Apple Pay
CPI Card Group Files for Its IPOWorldpay Files for its IPOSquare Files for its IPO

Overview of FT Partners
The Only Investment Bank
Focused Exclusively on Financial Technology
Financial Technology Partners LP
FTP Securities LLC
is pleased to announce its exclusive role as
sole strategic and financial advisor to
$310,000,000+
in its sale to
for a total consideration of
62
FT Partners is the Leader in Financial Technology Investment Banking
The Only Investment Bank
Focused Exclusively on Financial Technology
Financial Technology Partners LP
FTP Securities LLC
is pleased to announce its exclusive role as
strategic and financial advisor to
$ 20,000,000
in its Series B financing led by
for approximately
The Only Investment Bank
Focused Exclusively on Financial Technology
$ 369,000,000for total consideration of approximately
in its cash sale to
Financial Technology Partners LP
FTP Securities LLC
is pleased to announce its exclusive role as
sole strategic and financial advisor to
The Only Investment Bank
Focused Exclusively on Financial Technology
$ 525,000,000for cash consideration of approximately
in its sale to
Financial Technology Partners LP
FTP Securities LLC
is pleased to announce its exclusive role as
sole strategic and financial advisor to
The Only Investment Bank
Focused Exclusively on Financial Technology
Financial Technology Partners LP
FTP Securities LLC
is pleased to announce its exclusive role as
sole strategic and financial advisor to
The Only Investment Bank
Focused Exclusively on Financial Technology
$ 325,000,000for cash consideration of approximately
in its sale to
Financial Technology Partners LP
FTP Securities LLC
is pleased to announce its exclusive role as
sole strategic and financial advisor to
The Only Investment Bank
Focused Exclusively on Financial Technology
$ 300,000,000
for total consideration of approximately
In its acquisition of
Financial Technology Partners LP
FTP Securities LLC
is pleased to announce its exclusive role as
sole debt capital advisor to
The Only Investment Bank
Focused Exclusively on Financial Technology
$ 650,000,000valuing the equity at approximately
in its
Financial Technology Partners LP
FTP Securities LLC
is pleased to announce its exclusive role as
sole strategic and financial advisor to
$177,000,000
Initial Public Offering
The Only Investment Bank
Focused Exclusively on Financial Technology
Financial Technology Partners LP
FTP Securities LLC
is pleased to announce its exclusive role as
sole strategic and financial advisor to
$ 200,000,000
The Only Investment Bank
Focused Exclusively on Financial Technology
in its Strategic Investment by
Financial Technology Partners LP
FTP Securities LLC
is pleased to announce its exclusive role as
sole strategic and financial advisor to
$ 100,000,000+
A$480,000,000
valuing the equity at approximately
in its
Initial Public Offering
The Only Investment Bank
Focused Exclusively on Financial Technology
Financial Technology Partners LP
FTP Securities LLC
is pleased to announce its exclusive role as
sole strategic and financial advisor to
The Only Investment Bank
Focused Exclusively on Financial Technology
in its sale to
Financial Technology Partners LP
FTP Securities LLC
is pleased to announce its exclusive role as
sole strategic and financial advisor to
$ 100,000,000+
The Only Investment Bank
Focused Exclusively on Financial Technology
in its approximately 60% majority sale to
Financial Technology Partners LP
FTP Securities LLC
is pleased to announce its exclusive role as
sole strategic and financial advisor to
$ 900,000,000for aggregate consideration of approx.
The Only Investment Bank
Focused Exclusively on Financial Technology
Financial Technology Partners LP
FTP Securities LLC
is pleased to announce its role as
strategic and financial advisor to
in its cash sale to
$1,650,000,000for total consideration of approximately
The Only Investment Bank
Focused Exclusively on Financial Technology
Financial Technology Partners LP
FTP Securities LLC
is pleased to announce its exclusive role as
sole strategic and financial advisor to
The Only Investment Bank
Focused Exclusively on Financial Technology
Financial Technology Partners LP
FTP Securities LLC
is pleased to announce its exclusive role as advisor to
in its strategic investment in
$70,000,000
with additional participation from
The Only Investment Bank
Focused Exclusively on Financial Technology
Financial Technology Partners LP
FTP Securities LLC
is pleased to announce its role as
strategic and financial advisor to
in its cash sale to
from
$1,500,000,000
The Only Investment Bank
Focused Exclusively on Financial Technology
$ 370,000,000
For total cash consideration of approximately
In its sale to
Financial Technology Partners LP
FTP Securities LLC
is pleased to announce its exclusive role as
sole strategic and financial advisor to
in its growth investment by
for a total valuation of nearly
in its Series E minority financing from
$ 225,000,000
for total consideration of
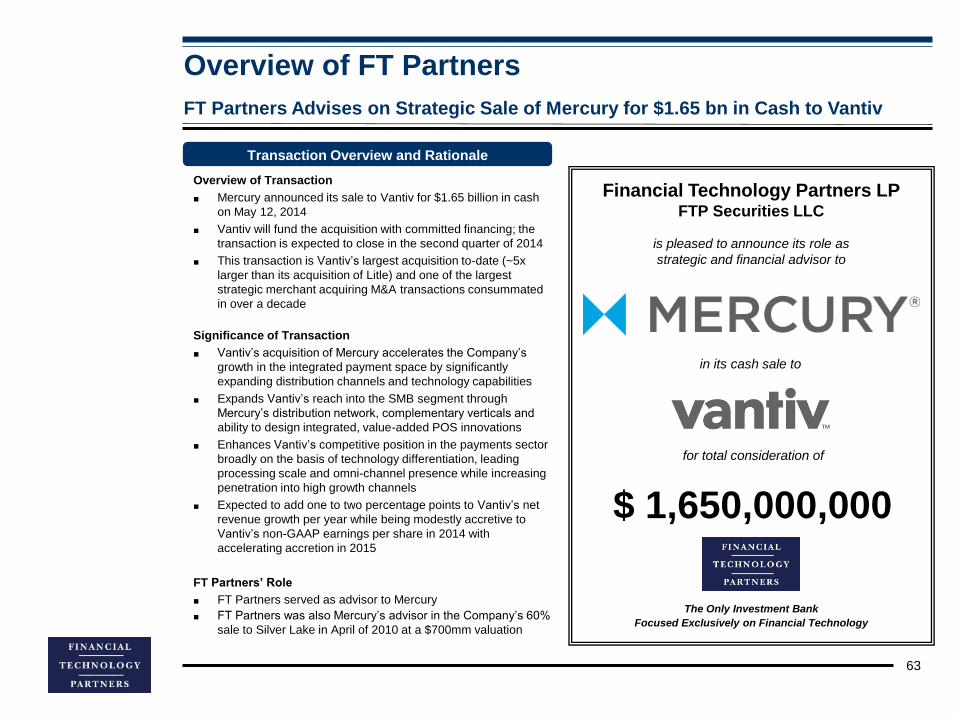
Overview of FT Partners
63
FT Partners Advises on Strategic Sale of Mercury for $1.65 bn in Cash to Vantiv
Transaction Overview and Rationale
Financial Technology Partners LPFTP Securities LLC
in its cash sale to
is pleased to announce its role as
strategic and financial advisor to
The Only Investment Bank
Focused Exclusively on Financial Technology
for total consideration of
$ 1,650,000,000
Overview of Transaction
■ Mercury announced its sale to Vantiv for $1.65 billion in cash
on May 12, 2014
■ Vantiv will fund the acquisition with committed financing; the
transaction is expected to close in the second quarter of 2014
■ This transaction is Vantiv’s largest acquisition to-date (~5x
larger than its acquisition of Litle) and one of the largest
strategic merchant acquiring M&A transactions consummated
in over a decade
Significance of Transaction
■ Vantiv’s acquisition of Mercury accelerates the Company’s
growth in the integrated payment space by significantly
expanding distribution channels and technology capabilities
■ Expands Vantiv’s reach into the SMB segment through
Mercury’s distribution network, complementary verticals and
ability to design integrated, value-added POS innovations
■ Enhances Vantiv’s competitive position in the payments sector
broadly on the basis of technology differentiation, leading
processing scale and omni-channel presence while increasing
penetration into high growth channels
■ Expected to add one to two percentage points to Vantiv’s net
revenue growth per year while being modestly accretive to
Vantiv’s non-GAAP earnings per share in 2014 with
accelerating accretion in 2015
FT Partners’ Role
■ FT Partners served as advisor to Mercury
■ FT Partners was also Mercury’s advisor in the Company’s 60%
sale to Silver Lake in April of 2010 at a $700mm valuation

Overview of FT Partners
64
FT Partners Advises on the Sale of TransFirst to Vista Equity Partners
Overview of Transaction
■ On October 13, 2014, Vista Equity Partners announced that it
will acquire TransFirst, a leading provider of secure transaction
processing services, from Welsh, Carson, Anderson & Stowe
(“WCAS”)
■ Similar to the May 2014 acquisition of Mercury by Vantiv,
TransFirst had filed for an IPO prior to the transaction
■ Vista Equity Partners is a U.S.-based private equity firm with
over $13.5 bn in cumulative capital commitments that focuses
on software, data and technology-enabled businesses
■ WCAS originally acquired TransFirst in June 2007
Significance of Transaction
■ Vista’s acquisition of TransFirst is one of the largest private
equity-lead LBO’s in the merchant acquiring space
■ With over 200,000 merchants and more than 1,300 partners,
the acquisition will allow TransFirst to solidify its position as a
leading provider of payment processing solutions in the SMB
space
■ TransFirst intends to leverage Vista Equity Partners’ expertise
in helping its portfolio companies achieve operational, product
and customer service excellence by contributing professional
expertise and proven best practices
FT Partners’ Role
■ FT Partners served as a strategic and financial advisor to
TransFirst in its sale process
■ FT Partners has previously worked with TransFirst, including
the Company’s $675 mm debt recap transaction in 2012
Transaction Overview and Rationale
Financial Technology Partners LPFTP Securities LLC
The Only Investment Bank
Focused Exclusively on Financial Technology
in its sale to
is pleased to announce its role as
a strategic and financial advisor to
from
$ 1,500,000,000

Overview of FT Partners
65
FT Partners Advises CIBC on its Investment in Dynamics’ $70 mm Series C Capital Raise
Transaction Overview and Rationale
Overview of Transaction
■ On December 8, 2014, Dynamics announced it closed a $70 million
Series C round of financing that included new investors CIBC and
MasterCard along with existing investors Bain Capital Ventures and
Adams Capital Management
■ The investment by CIBC follows the successful launch with Dynamics of
the marquee CIBC Tim Hortons Double Double Card, which combines a
no-fee CIBC credit card with a Tim Card, all in one
■ Dynamics designs and manufactures integrated payment cards and
advanced payment platforms; the company has currently launched
products with banks in the United States and Canada
■ CIBC is a leading Canadian-based global financial institution with a
market capitalization of $41 billion and a Basel III Common Equity Tier 1
ratio of 10.3%; through its three major businesses, Retail and Business
Banking, Wealth Management and Wholesale Banking, CIBC provides
a full range of financial products and services to 11 million clients in
Canada and around the world
Significance of Transaction
■ CIBC has a strong history of innovation and this investment further
strengthens its relationship with Dynamics as the two continue to work
together to bring new payment products to market
■ The transaction demonstrates the continued relevance of the physical
card as a means of payment and the increasing importance of
innovative payment solutions that create value for consumers in new,
differentiated ways while upholding the highest security standards
■ The additional capital will help Dynamics to continue to meet global
demand for its “Interactive Payment Card” technology platform by
increasing the Company’s ability to scale its manufacturing operations
and extend its technical capabilities and product lines
FT Partners’ Role
■ FT Partners served as a strategic and financial advisor to CIBC on its
investment
■ Highlights FT Partners' continued success in advising a broad range of
top-tier strategic investors across the financial technology landscape
Financial Technology Partners LPFTP Securities LLC
The Only Investment Bank
Focused Exclusively on Financial Technology
is pleased to announce its role as advisor to
with additional participation from
for approximately
$ 70,000,000
in its strategic investment in

Overview of FT Partners
66
FT Partners Advises on $310,000,000+ Sale of Currencies Direct
Transaction Overview and Rationale
Financial Technology Partners LPFTP Securities LLC
The Only Investment Bank
Focused Exclusively on Financial Technology
Overview of Transaction
On August 11, 2015 Currencies Direct Holdings Ltd (“CDH” or the “Company”) announced its sale for $310+mm to a buyer consortium formed by Corsair Capital and Palamon Capital Partners
– Prior to the transaction, CDH was owned by the AziboGroup
Headquartered in London, CDH is a leading, privately-owned, non-bank provider of non-cash foreign exchange and payments solutions to private and corporate clients
– Comprehensive international payment offering is available to clients both online and offline
Corsair Capital and Palamon Capital Partners are leading, global private equity firms focused on financial services and European growth services, respectively
The transaction is expected to close by the end of calendar year 2015 and is subject to applicable regulatory approvals and other conditions
Significance of Transaction
Enables CDH to continue to accelerate its growth strategy in the international payments market
Combined resources and expertise of CDH and the buyer consortium group position the Company extraordinarily well to further its leadership in the marketplace
FT Partners’ Role
FT Partners served as exclusive strategic and financial advisor to Currencies Direct and its Board
Developed extensive marketing materials and financial analyses to highlight the unique aspects of the business, and led all aspects of transaction execution
Transaction highlights FT Partners’ continued success advising leading companies and generating highly successful outcomes in the international payments space
is pleased to announce its exclusive role as
sole strategic and financial advisor to
for a total consideration of
in its sale to
$310,000,000+
Overview of FT Partners
67
FT Partners Advises Azimo on its $20mm Series B Investment
Transaction Overview and Rationale
Overview of Transaction
■ On June 15, 2015, Azimo announced the completion of its $20
mm Series B financing led by Frog Capital
■ Azimo is a world leader in online and smartphone-based
money transfers – providing a fast, secure and low-cost
alternative to legacy high street remittance services
■ The Company, headquartered in London with additional offices
in Poland, has the most comprehensive network of any digital
player, sending money to over 200 countries, reaching 5 billion
people with more than 80 different currencies
■ Frog Capital is a leading growth capital investor focused on
technology-led business in Europe
Significance of Transaction
■ This investment signifies the ongoing disruption of the $600 bn
global remittance market in which Azimo generated a five-fold
increase in the number of facilitated money transfers from the
year prior
■ Azimo will use the proceeds from the investment to continue
its Pan-European growth and to target new markets in North
America and Asia
FT Partners’ Role
■ FT Partners served as exclusive strategic and financial advisor
to Azimo and its Board of Directors
■ Azimo’s capital raise demonstrates FT Partners' continued
ability to establish strong relationships with top international
financial technology firms and assist them in achieving their
long-term strategic goals
■ This transaction also builds upon FT Partners’ expertise in
money transfer, having advised several clients previously in
the space
Financial Technology Partners LPFTP Securities LLC
The Only Investment Bank
Focused Exclusively on Financial Technology
is pleased to announce its exclusive role as
strategic and financial advisor to
$ 20,000,000for approximately

Overview of FT Partners
68
FT Partners Advises OzForex on its A$480 Million Sale & IPO
Transaction Overview and Rationale
Overview of Transaction
■ OzForex Group (“OzForex”) completed its Sale & Initial Public
Offering and began to trade on the Australian Stock Exchange
(“ASX”) under the ticker symbol OFX
■ Stock closed first day of trading up ~30%
■ OzForex is an online, global payments provider that offers
individuals and SMBs a platform to purchase foreign currency
to facilitate international transactions
■ Prior to the offering, OzForex was owned by Accel Partners,
The Carlyle Group, Macquarie Bank and other founder /
private investors
Significance of Transaction
■ Transaction was a sale of ~100% of the equity of the company
to a “club” of institutional investors, followed by an IPO (one of
the largest IPOs of an Australian company)
■ Highly innovative “club-deal” structure allowed for reduced risk
and certainty for existing investors
■ Investors given the ability to sell ~100% of their interests in the
Company; certain investors chose to retain a small portion of
their ownership
FT Partners’ Role
■ FT Partners served as exclusive Financial, Strategic and IPO
Advisor to OzForex and its Board of Directors
■ FT Partners managed the very unique dual-track M&A / sale
and IPO process, effectively achieving an “M&A” outcome for
shareholders in the public markets (~100% liquidity)
■ FT Partners’ advisory role simplified and expedited the “time-
to-market” period due to the significant amount of up-front
work completed prior to the engagement of potential M&A sale
buyers and underwriters
Financial Technology Partners LPFTP Securities LLC
The Only Investment Bank
Focused Exclusively on Financial Technology
in its
A$ 480,000,000
is pleased to announce its exclusive role as
sole financial, strategic and IPO advisor to
valuing the equity at
Initial Public Offering
Overview of FT Partners
69
FT Partners Advises Custom House on its $370 Million Sale to Western Union
Transaction Overview and Rationale
in its sale to
$ 370,000,000
is pleased to announce its exclusive role as
sole strategic and financial advisor to
for cash consideration of approximately
Overview of Transaction
■ Custom House, Ltd. (“Custom House”) announced its sale to
Western Union (NYSE: WU) for US$370 million in cash
■ Custom House is the largest independent, international B2B
payments provider in the world
■ Western Union is the world’s largest money transfer business
■ Custom House was backed by Great Hill Partners, one of the
leading private equity firms across the financial technology
sector; transaction represents one of Great Hill Partners’ most
successful exits to date
Significance of Transaction
■ Transaction represents the one of the largest, independent
private equity-backed payments transactions
■ This acquisition allows Custom House to leverage its extensive
online and offline international B2B payments solutions with
Western Union’s global footprint, strong brand and balance
sheet to rapidly build market share and penetrate new
opportunities around the globe
■ Custom House expected to provide a strong, diversified growth
engine for Western Union outside of its core remittance
business and will strengthen Western Union’s presence in the
SME segment globally
■ The acquisition of Custom House supports Western Union’s
strategic plan by entering a new growth market and
diversifying its product portfolio
FT Partners’ Role
■ Demonstrates FT Partners’ ability to consummate transactions
with strong valuations, despite an incredibly challenging
economic environment
The Only Investment Bank
Focused Exclusively on Financial Technology
Financial Technology Partners LPFTP Securities LLC

Overview of FT Partners
FT Partners has Significant Experience Advising Large Financing Rounds and “Unicorns”
70Note: FT Partners represented investors in Dynamics (CIBC) and Credit Karma (Google Capital); some transactions include a combination of equity and smaller amount of debt financing.
FT Partners has
a history of
advising on
some of the
largest financing
transactions in
the FinTech
space
Representing
numerous
FinTech
“Unicorns”
above $1 billion
valuations
Company Amount Raised Selected Prominent Investors in FT Partners Led Rounds
$420,000,000+
300,000,000+
250,000,000
238,000,000
225,000,000
150,000,000+
135,000,000
110,000,000+
100,000,000
85,000,000
70,000,000
60,000,000
50,000,000

Overview of FT Partners
71
Consistent Record of Representing Leading Private Equity Investors
Overview of FT Partners
Award-Winning Investment Banking Franchise Focused on Superior Client Results
Source: Bold represents awards that FT Partners has won, italics represents nominations.
M&A Advisor
Awards
Middle Market
Financing Awards
■ Equity Financing Deal of the Year
■ Professional Services Deal of the Year, Above $100mm
■ Dealmaker of the Year
■ Professional Services Deal of the Year, Above $100 mm
■ Boutique Investment Bank of the Year
■ Deal of the Decade
■ 10 Deal of the Year Nominations Across 9 Categories
■ Upper Middle Market Deal of the Year, Above $500 mm
■ IT Services Deal of the Year, Below $500mm
■ Cross-Border Deal of the Year, Below $500mm
■ Dealmaker of the Year – Steve McLaughlin
■ Business to Business Services Deal of the Year
■ Computer and Information Technology Deal of the Year, Above $100mm
■ Financial Services Deal of the Year, Above $100mm
2012
2011
2010
2007
■ Steve McLaughlin consecutively ranked (2006, 2007 and 2008) among
the top Bankers in Financial Technology2006-2008
Institutional Investor
Annual Ranking
FT Partners has
been recognized
as Investment
Banking Firm of
the Year and
regularly achieves
Merger and
Financing Deal of
the Year
recognition
2014
■ Equity Financing Dealmaker of the Year – Steve McLaughlin
■ Information Technology Deal of the Year
■ Financial Services Deal of the Year
■ Financing Professional of the Year – Steve McLaughlin
■ Financing Deal of the Year - Equity
■ Financing Deal of the Year - Debt
2008
2006
72

Overview of FT Partners
73
Platform of Choice for Clients and Bankers Alike
Avg Years of Director / MD Experience
6 7 8 9 10 11 12 13 14 15 16 13 14 16 17
12
4 5 6
1314
17
21
27
31
35
39
46
63
3 35 5 6 611 12 13 14
4548
6772
95101
2001 2002 2003 2004 2005 2006 2007 2008 2009 2010 2011 2012 2013 2014 2015
Employees Number of Directors / MDs Total Exp. Of Directors / MDs (Years)
~10x Number of resources
~10x Total senior banker experience
~2x Average senior banker experience
~6x Number of senior bankers
FT Partners’ Last Decade

Overview of FT Partners
74
The FT Partners Senior Banking Team
Name / Position Prior Background Experience / Education Years of Experience
Steve McLaughlin
Founder, CEO and
Managing Partner
■ Formerly with Goldman, Sachs & Co. in New York and
San Francisco from 1995-2002
■ Formerly Co-Head of Goldman Sachs’ Financial
Technology Group (#1 market share)
■ Wharton M.B.A.
20
Larry Furlong
Managing Director■ Formerly with Goldman, Sachs & Co. in New York, London
and Los Angeles beginning in 1995
■ Wharton M.B.A.
20
Greg Smith
Managing Director
■ Formerly award winning Equity Research Analyst at Merrill
Lynch / J.P. Morgan / Sterne Agee
■ Recent coverage included V, MA,TSS, GPN, HPY, FIS,
FISV, JKHY & DST among others
19
Tim Wolfe
Managing Director■ Formerly with Goldman, Sachs & Co. beginning in 2000
■ 40 Under 40 M&A Advisor Award Winner 2013
■ Harvard M.B.A.
13
Andrew McLaughlin
Managing Director, Research &
Business Development
■ Leads FT Partners’ Research and Business Development
Team
■ Formerly with Deloitte Consulting
9