françois lozes, abderrahim elmoataz, and olivier lézoray … · · 2016-01-213-d color scanning...
TRANSCRIPT

1053-5888/15©2015IEEE IEEE SIGNAL PROCESSING MAGAZINE [103] JULY 2015
© G
HE
NT, K
ATHE
DR
ALE
KE
RK
FAB
RIE
K; P
HO
TO C
OU
RTE
SY
OF K
IK-IR
PA ,
BR
US
SE
LS. M
AG
NIFY
ING
GLA
SS
—IM
AG
E LIC
EN
SE
D BY
ING
RA
M P
UB
LISH
ING
.
Digital Object Identifier 10.1109/MSP.2015.2408631
Date of publication: 15 June 2015
ith the advance of three-dimensional (3-D) scanning technology, the cultural heritage
community is increasingly interested in 3-D scans of cultural objects such as antiques, artifacts, and heritage sites. Digitization of
these objects is commonly aimed at heritage preservation. Since 3-D color scanning has the potential to tackle a variety of tradi-tional documentation challenges, the use of signal processing techniques on such data can be expected to yield new applications
that are feasible for the first time with the aid of captured 3-D color point clouds. Our contributions are twofold. First, we pro-pose a simple method to solve partial differential equations (PDEs) on point clouds using the framework of partial difference equa-tions (PdEs) on graphs. Second, we survey several applications of 3-D color point cloud processing on real examples for which signal processing researchers can develop tools that can be valuable for museum specialists. The results of these methods have been reviewed by experts in the arts and found promising.
INTRODUCTIONHistorians, archaeologists, and museum curators are interested in the preservation of pieces of art and want to make them available
[François Lozes, Abderrahim Elmoataz, and Olivier Lézoray]
[Opportunities for cultural heritage]
PDE-Based Graph Signal Processing for
3-D Color Point Clouds
W

IEEE SIGNAL PROCESSING MAGAZINE [104] JULY 2015
to as wide an audience as possible. While direct encounters with the material pieces of art will always have an essential value for museum spe-cialists, one important concern for museum curators is the preparation of catalogs for the purpose of object identification and examination. Tra-ditionally, museum specialists have used two-dimensional (2-D) imaging techniques such as hand drawings, photographs, or document scans; see [1] and [2]. Unfortunately, these standard formats have the limitation of being selective and insufficient to record nuanced information about the complete shape, color, and texture of the object. In addition, some objects might undergo important
changes over time, and in this case, the preservation of the object state (at a given temporal snapshot) is important. These issues can now be addressed by using 3-D color scan-ning, which has the ability to record the complete object in great detail. The production of digital 3-D copies of pieces of art has therefore gained considerable attention from the cul-
tural heritage community [3]. The recent proliferation of com-mercial 3-D digital scanning devices has led to the establishment of 3-D scanning as a practical reality in the field of cultural heri-tage preservation [4]. The interest is evident: it provides a high-precision digital reference of a cultural object and makes possible mass distribution and consultation.
Most traditional signal processing methods in art investiga-tion, such as filtering, PDE-based processing, and wavelets, are designed for data defined on regular Euclidean grids; see [2] and [5]. With 3-D color point clouds, the data takes the form of unstructured raw point samples without any attached geometry. Traditional signal processing tools cannot be directly applied on raw 3-D color point clouds since there is no structuring informa-tion. In addition, it is not desirable to transform point clouds to meshes since this requires sampling points with a loss of accu-racy and this is not compatible with the goal of high-fidelity conservation. Therefore it is essential to investigate a frame-work for the adaptation of signal processing tools for 3-D point cloud processing.
Our contributions are twofold. First, we propose a simple method for adapting and solving PDEs on point clouds. This method relies on the framework of PdEs on weighted graphs [6] as shown in Figure 1. Second, we survey several applications in 3-D color point cloud processing where signal processing tools can be applied to images of interest to art and museum specialists. From a signal processing point of view, most of these problems can be formulated as inverse problems for graph signals [7] (signals living on graphs representing 3-D color point clouds as in Figure 1).
3-D COLOR POINT CLOUDSThis section details how 3-D images of historic or art items can be acquired. We first provide a review of the benefits and disadvan-tages of each of the current technologies. In cultural heritage, two main approaches are used to digitize a 3-D object.
The first approach is photogrammetry. This is an image-based modeling technique where multiple photos are taken to retrieve 3-D data coordinates. Photogrammetry requires only cameras and is the least expensive approach. However, it works only with small objects that have regular geometric shapes. The second approach is laser scanning. In this approach, the scanner acquires many 3-D points of the object to digitize. The precision is much better but both the cost and the acquisition time are greater. In this article, we focus on this latter type of 3-D raw point clouds.
Figure 2 shows the acquisition of several World War II items, acquired by a Konica Minolta VIVID-9i noncontact 3-D laser
3-D ColorsPoint Clouds
Graph Construction
Graph Weighting
Inverse Problems SolvingRestoration, Filtering, Interpolation,
Inpainting, Colorization, Segmentation
Continuous Formulationof Inverse Problems
with PDEs
Transcription with thePdEs Framework
on Graphs
[FIG1] The PdEs framework on weighted graphs can be applied to solve PDEs on 3-D point clouds.
(a) (b) (c)
[FIG2] Some objects from World War II acquired with our 3-D scanner at the Mémorial of Caen. (a) A lamp. (b) A canteen. (c) Part of a destroyed church.
WITH THE ADVANCE OF 3-D SCANNING TECHNOLOGY, THE
CULTURAL HERITAGE COMMUNITY IS INCREASINGLY INTERESTED IN
3-D SCANS OF CULTURAL OBJECTS SUCH AS ANTIQUES, ARTIFACTS,
AND HERITAGE SITES.

IEEE SIGNAL PROCESSING MAGAZINE [105] JULY 2015
scanner with a lens of f 25= -mm focal length at a distance of 0.6 m. According to the specification of the scanner, this corresponds to an accuracy of digitizing of
.0 05! mm. A point cloud is composed of raw data { , ..., } .d dD n1= One
associates to each d Di ! a 3-D coordinate vector { , ..., }p pP n1= with ( , , ) ,p p p p Ri i
xiy
iz T 3! and a color vector { , ..., }c cC n1= with
( , , ) .c c c c Ri iR
iG
iB T 3! We define for a given point cloud a function
: ,f RD* 3" which is either :f D P* " or : .f D C* " The func-tion f * is difficult to process and to analyze with classical signal processing techniques because the underlying point cloud lacks of any topological structure. Therefore, classical 2-D signal processing techniques cannot be considered and new dedicated graph signal processing techniques are needed.
GRAPH CONSTRUCTION FROM POINT CLOUDSThe proposed approach to process point clouds starts by creat-ing a weighted graph from a given point cloud. This section explains how to build such a graph. This latter method is com-posed of two parts: first the topology of the graph is defined and then the edges of the graph are weighted.
GRAPH CONSTRUCTIONThis section discusses how to build a weighted graph from 3-D point clouds. The creation of a graph requires several steps.
1) Vertices are created from the raw data. 2) The vertices are connected with edges to build a proxim-ity graph based on geometrical structure of the point cloud. 3) Weights associated with each edge are calculated.
Weights of edges are deduced from values associated to verti-ces (the graph signal) and patches can be used to compute a better similarity value that takes account of local neighbor-hood similarities.
Graph creation from point clouds is challenging. Indeed, the structuring information is lacking, and the data is not naturally orga-nized in a manifold. Therefore, the set of edges cannot be easily determined. Given a point cloud P with associated coordinates { ,, , }p p Rn1
3f ! there are many ways of associating a graph to such a data set. Since point clouds data exhibit a geometrical struc-ture, proximity graphs are preferable: if two data points satisfy certain geometric requirements, the corresponding vertices in the graph are connected by an edge. To each raw data point ,d Di ! one associates a vertex of a proximity graph G to define a set of vertices
{ , , , } .v v vV n1 2 f= Then, determining the edge set f of the prox-imity graph G requires defining the neighbors of each vertex vi according to its embedding pi using the Euclidean distance. Among many possible choices, we choose to consider the symmetric k-near-est neighbor graph. An undirected edge ( , )v vi j is added between two vertices vi and v j if the distance between pi and p j is among the k smallest distances from either pi or p j to all the other data points. The construction of such a graph being compu-tationally expensive for large point clouds, a k-dimensional tree is used [8] to speed up the k-nearest neighbor search.
GRAPH WEIGHTSOnce the graph has been created, it has to be weighted. If one wants to ignore the vertex similarities, the weight function w can be set to ( , ) , ( , ) .w v v v v1i j i j6 ! f= To
account for the similarities between the graph signals associ-ated with the vertices, it is possible to use similarity functions based on distances to define the edge weights. Given an initial function ,:f RV m0 " computing distances between vertices consists of comparing their features (as a function of ) .f 0 To this end, each vertex vi is associated with a feature vector
.( )P v Riq! From this, a usual similarity measure is provided
by the Gaussian kernel
( , )||
.( ) ( ) | |P P
expw v vv v
i ji j
222
v= -
-f p (1)
Traditionally, one has simply ( ) ( ) .fP v vi i0= However, in
image processing an important feature vector is provided by image patches [9]. In [10], we have proposed a new definition of patches that can be used with any graph representation asso-ciated to meshes or point clouds. We detail the latter.
PATCH DEFINITIONAround each vertex we build a 2-D grid (the patch) describing the neighborhood. This grid is defined on the tangent plane of the point (i.e., the vertex). The patch is oriented and finally filled in with a weighted average of the graph-signal values in the local neighborhood. We detail these two steps next.
OrientationThe first step consists of estimating the orientation of each patch. The algorithm first deduces a tangent vector ( )t vi1 from the normal vector ) .(n vi We use a local principal component analysis on the coordinates pi to estimate this normal vector:
( ) ) .(t nv vi i0 = Let x y z, , be the three axes of a 3-D space, the first tangent vector ( )t vi1 is computed with
( ) ( )( ) ( )
| ( ) |tt x tt z z t v v vv v
1otherwiseifi i i
i i1 0
1 0 0
#
# $
=
= =Y) (2)
with # the cross product and $ the dot product. The condition on the first line of (2) checks if the t1 and z axis vector are col-linear. If they are not collinear, t1 is calculated from the z axis, otherwise the x axis is used. Then a bitangent vector ( )t vi2 is computed by ( ) ( ) ( ) .t t tv v vi i i2 0 1#= The orientation vectors
( ), ( ), ( )o o ov v vi i i0 1 2 are then respectively assigned to ( ),t vi1 ( ), ( ) .t tv vi i2 0
Patch Construction The second step consists of constructing the patches. Given a point ,pi a patch is defined for this point by constructing a
IN CULTURAL HERITAGE, TWO MAIN APPROACHES ARE USED
TO DIGITIZE A 3-D OBJECT.
IEEE SIGNAL PROCESSING MAGAZINE [106] JULY 2015
square grid around pi on its tangent plane in the orientation of the patch defined by ) .( ,o o0 1 We fix the patch length l manu-ally. Let n be the number of cells on a row of the patch. A square lattice of n2 cells is constructed around pi with respect to the basis obtained from the orientation computation. Each cell has a side length of / .l n A local graph is then considered that connects the vertex vi to all the vertices v j contained in a sphere of diameter .l 2 Then, all the neighbors v j of vi are projected on the tangent plane of pi giving rise to projected points .pil To fill the patch with values, these projected points pil are associated with the cells with the closest center. The value of the cell is then deduced from a weighted average of the values ( )f v j0 associated with the vertices v j that were pro-jected onto the patch cell. This value is a spectral value (the point’s colors). The set of values inside the patch of the vertex vi are denoted ( ) .P vi Let ( )C vk i denote the k th cell of the constructed patch around vi with [ , ] .k n1 2! With the pro-posed patch construction process, define the set
( ) { | ( )}pV v v C vk i j j k i!= l as the set of vertices v j that were associated with the k th patch cell of .vi Then, the patch vector is defined as :
( )( , )
( , ) ( ),
c p
c pP v
w
w f v
( )
( )
[ , ]
ip
v V vk j
pv V v
k j j
k n
T0
1j k i
j k i
2
=
!
!
!
J
L
KKKK
N
P
OOOO/
/ (3)
with ( /, ) ( )c p c pexpwp k i k i 22 2v= - - l where the ck are the
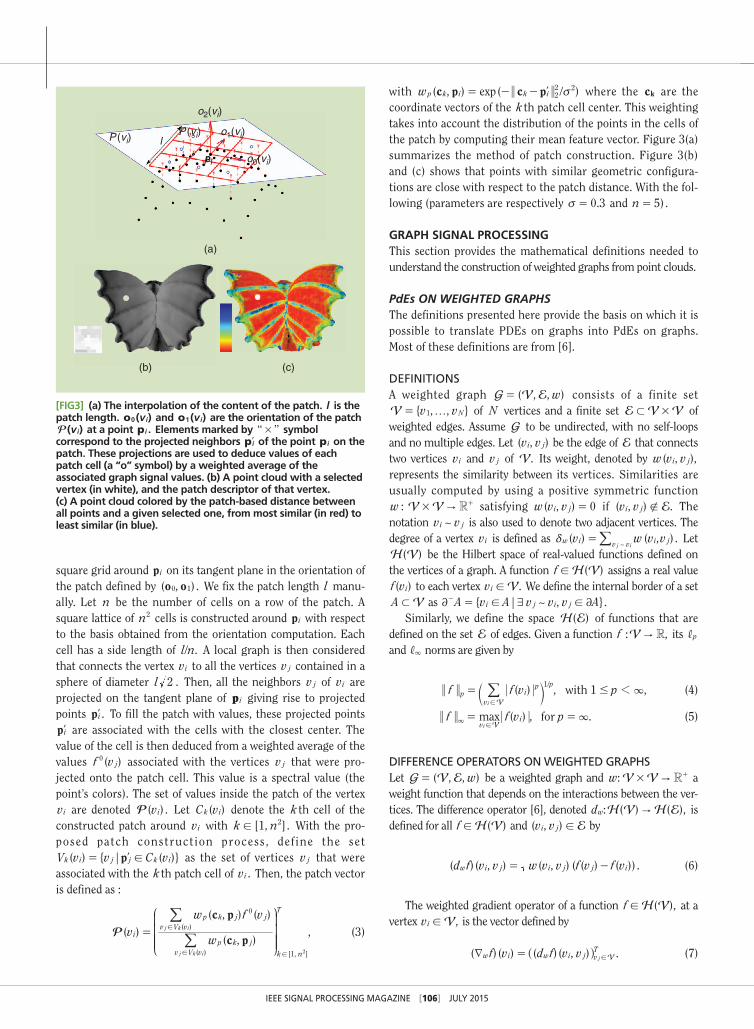
coordinate vectors of the k th patch cell center. This weighting takes into account the distribution of the points in the cells of the patch by computing their mean feature vector. Figure 3(a) summarizes the method of patch construction. Figure 3(b) and (c) shows that points with similar geometric configura-tions are close with respect to the patch distance. With the fol-lowing (parameters are respectively .0 3v = and ) .n 5=
GRAPH SIGNAL PROCESSINGThis section provides the mathematical definitions needed to understand the construction of weighted graphs from point clouds.
PdEs ON WEIGHTED GRAPHSThe definitions presented here provide the basis on which it is possible to translate PDEs on graphs into PdEs on graphs. Most of these definitions are from [6].
DEFINITIONSA weighted graph ( , , )wG V E= consists of a finite set
{ , , }v vV N1 f= of N vertices and a finite set V VE #1 of weighted edges. Assume G to be undirected, with no self-loops and no multiple edges. Let ( , )v vi j be the edge of E that connects two vertices vi and v j of .V Its weight, denoted by ( , ),w v vi j represents the similarity between its vertices. Similarities are usually computed by using a positive symmetric function
: w RV V "# + satisfying ( , )w v v 0i j = if ( , ) .v v Ei j " The notation ~v vi j is also used to denote two adjacent vertices. The degree of a vertex vi is defined as ( ) ( , ) .v w v v~w i i jv vj i
d =/ Let ( )H V be the Hilbert space of real-valued functions defined on
the vertices of a graph. A function ( )f H V! assigns a real value ( )f vi to each vertex .v Vi ! We define the internal border of a set
A V1 as { | ~ , } .A v A v v v Ai j i j2 7 2! !=-
Similarly, we define the space ( )H E of functions that are defined on the set E of edges. Given a function : ,f RV " its p, and ,3 norms are given by
( ) , ,f f v p1with/p i
p
v
p1
Vi
31#=!
c m/ (4)
( ) , .maxf f v pforv
iVi
3= =3!
(5)
DIFFERENCE OPERATORS ON WEIGHTED GRAPHSLet ( , , )wG V E= be a weighted graph and :w RV V "# + a weight function that depends on the interactions between the ver-tices. The difference operator [6], denoted : ( ) ( ),d H V H Ew " is defined for all ( )f H V! and ( , )v v Ei j ! by
( ) ( , ) ( , ) ( ( ) ( )) .d f v v w v v f v f vw i j i j j i= - (6)
The weighted gradient operator of a function ( ),f H V! at a vertex ,v Vi ! is the vector defined by
( ) ( ) ( ) ( , ) .f v d f v vw i w i j vTVjd = !^ h (7)
o2(vi)
o0(vi)
o1(vi)
pi
P (vi)P (vi)
l
(a)
(b) (c)
[FIG3] (a) The interpolation of the content of the patch. l is the patch length. ( )o vi0 and ( )o vi1 are the orientation of the patch
( )P vi at a point .pi Elements marked by #` _ symbol correspond to the projected neighbors pil of the point pi on the patch. These projections are used to deduce values of each patch cell (a “o” symbol) by a weighted average of the associated graph signal values. (b) A point cloud with a selected vertex (in white), and the patch descriptor of that vertex. (c) A point cloud colored by the patch-based distance between all points and a given selected one, from most similar (in red) to least similar (in blue).

IEEE SIGNAL PROCESSING MAGAZINE [107] JULY 2015
The p, norm of this vector is defined, for ,p 1$ as
( ) ( ) ( , ) ( ) ( ) .f v w v v f v f v~
/ /w i p
v vi j
pj i
p p2 1
j i
d = -c m/ (8)
The external and internal morphological directional difference operators are defined as in [11] to be ( ) ( , ) ,d f v vw i j
!^ h with ( ) ( , )maxx x 0=+ and ( ) ( , ) ( , ) ( ) .min maxx x x x0 0=- = - = -- + The corresponding discrete upwind weighted gradients are
( ) ( ) ( ) ( , ) .f v d f v vw i w i j v
T
Vjd =! !
!`^ h j (9)
The p, and the ,3 norms of these gradients are
( ) ( ) ( , ) ( ) ( ) ,f v w v v f v f v~
w i pv v
i jp
j ip p
2
1
j i
d = -! !`^ h j= G/ (10)
( ) ( ) ( , ) ( ( ) ( )) ) .maxf v w v v f v f v~w i v v i j j ij i
d = -! !3 (11)
p-LAPLACE OPERATORS ON WEIGHTED GRAPHSThe isotropic weighted p-Laplace operator, with [ , [,p 1 3! + at a vertex v Vi ! is defined on ( )H V by [6] as
( ) ( ) , ) ( ( ) ( ) ,f v v v f v f v, ,~
w pi
i w pi
v vi j i j
j i
}D = -^ h/ (12)
where
( , ) ( , ) ( ( ) ( ) ) .v v w v v f v f v21
,w pi
i j i j w ip
w jp
22
22d d} = +- - (13)
The 3-Laplacian is defined by [12] as
( ) ( ) ( ) ( ) ( ) ( ) | | .f v f v f v21
,w i w i w id dD = -3 3 3+ -8 B (14)
From the definitions of these discrete difference operators on graphs, we are now in position to translate any PDEs that involves gradient, p-Laplacian or 3-Laplacian in their continuous formula-tion onto Euclidean domains. In the sequel, we will consider directly the discrete formulation on graphs; see [6] for further details.
REGULARIZATION ON GRAPHSHere we present some PDEs on graphs and show a methodology to regularize the functions defined on the vertices of graphs. Let
( )f H V0 ! be a given function defined on the vertices of a weighted graph ( , , ) .G wV E= In a given context, this function represents an observation of a clean function ( )h H V! cor-rupted by an additive noise ( )n H V! such that .f h n0 = + Regularizing functions on graphs using either isotropic or aniso-tropic p-Laplacian, was proposed in [6] and [13]. Recently, a new family of p-Laplace operators based on a divergence formulation, which unifies both the isotropic and anisotropic p-Laplacian on graphs, has been proposed in [10].
To recover the uncorrupted function ,h the processing task is to remove the noise n from .f 0 A commonly used method is to seek a function ( ),f H V! which is regular enough on ,G and
also close enough to .f 0 This can be formalized by the minimiza-tion of an energy functional, that involves a regularization term (or penalty term) plus an approximation one (or fitting term). This article considers the following model:
( )argminh J f f f2:,
fw p
022
RV. m+ -
"
z (15)
( ) ( ( ) ( ) )J f f vwhere ,w p v w i pVidz=
!
z / (16)
is a gradient-based functional, and R!m is a regularization parameter, called the Lagrange multiplier, that controls the tradeoff between the penalty term and the fitting term. The function ( )$z is a positive convex function that penalizes large variations of f in the neighborhood of each vertex.
To solve (16), we consider the Euler–Lagrange equations
( )( )
( ( ) ( )) , ,f vJ f
f v f v v0 V,
i
w pi i i
0
22
6 !m+ - =z
(17)
where the first term denotes the variation of (16) with respect to f at a vertex .vi
In [10], we have proven that the solution of (17) can be obtained with the following iterative algorithm:
( )( ) ( )
f vf v f v
,, ,
~
,, ,
~ni
v vp f
v v
i v vp f
v v
nj
1
0
i j
j i
i j
j i
m b
m b
=+
+
z
z
+
//
(18)
with
( ) ( )f v f v,, ,
,, ,
v vp f
v vp f
j ip 2
i j i jb a= -z z - (19)
and
( , )( ) ( )( ( ) ( ) )
( ) ( )( ( ) ( ) )
.w v vf vf v
f vf v, , /
v vp f
i jp
w i pp
w i p
w j pp
w j p21 1i j
d
d
d
da
z z= +z
- -
l lf p (20)
Figure 4 shows such color filtering of a given 3-D colored point cloud (obtained from a laser scan of a Mayan temple wall).
APPLICATIONSThis section gives an overview of 3-D color point cloud applications. We illustrate the abilities of the proposed methods and algorithms
(a) (b)
[FIG4] The filtering of a noisy Mayan wall with a preservation of edges: (a) a noisy point cloud and (b) a denoised point cloud.

IEEE SIGNAL PROCESSING MAGAZINE [108] JULY 2015
for signal processing on point clouds. (All of the 3-D point clouds we used are available at https://lozes.users.greyc.fr/.) The typical graph signals are point (respectively vertices) coor-dinates or colors. Given a weighted graph ( , , )wG V E= associated to a point cloud, consider an initial graph signal :f RV m0 " with .m 3= This signal will be either the vertices’ coor-dinates, in which ,( )f pvi i
0 = or the vertices’ colors, in which ( ) ( ( ), ( ), ( ) ),f v f v f v f vi
Ri
Gi
BiT0 = where ( )f vX
i denotes the X color component of the color at the vertex .vi
The approach we developed can be interesting within a cul-tural heritage documentation, analysis, and dissemination per-spective (according to the evaluation done by art expert Livio De Luca, as mentioned in the “Acknowledgments” section). First,
the idea to introduce a method for structuring color/texture informa-tion within a point-based 3-D repre-sentation is particularly relevant within the 3-D digitization and doc-umentation purposes. Points clouds (especially if enriched by color information) include the essential geometric information useful for several applications scenarios
related to the heritage artifacts analysis (measurement, visual-ization, semantic annotation, etc.). The point clouds processing methods we suggest (colorization, filtering and simplification, and inpainting of missing data and segmentation) can find sev-eral effective applications within the digital driven process for documenting heritage buildings, archaeological sites, and museums’ objects.
(a) (b) (c) (d)
[FIG5] The colorization of the bishop castle (approximately 1.5 million points) and a Bas-relief (with 506,000 points): (a) the original point cloud with annotations, (b) the colored point cloud, (c) the colorless Bas-relief with annotations, and (d) the colorized Bas-relief.
(a) (b) (c) (d) (e) (f)
[FIG6] The colorization of some cultural heritage statues [sizes of point clouds: (a) and (b) 253,000, (c) and (d) 254,000, (e) and (f) 791,000 points]. (a) Scribbles, (b) result, (c) scribbles, (d) result, (e) scribbles, and (f) result.
THE USE OF ADAPTIVE GEOMETRICAL WEIGHTS RELYING ON A GEOMETRIC FEATURE MAPS
PATCHES ENABLES TO BETTER TAKE INTO ACCOUNT THE GEOMETRY
OF THE POINT CLOUD DURING THE COLOR DIFFUSION AND BLENDING.

IEEE SIGNAL PROCESSING MAGAZINE [109] JULY 2015
COLORIZATIONColorization is the process of adding colors on an uncolored object. Let :f V C0 " be a function that assigns colors to vertices. Let A V1 be the subset of vertices with unknown colors and A2 the subset of vertices with known values. The purpose of interpola-tion is to find a function ft approximating f 0 in V minimizing the following isotropic total variation energy for :v Ai !
( ) ( )min R f f v(
,) p
p
f Hw p w i
v AVi
d=! !
' 1/ (21)
with ( ) ( ),f v f vi i0= for .v Ai 2! This can again be solved using
the Euler–Lagrange equations
( ) ( ) ,
( ) ( ) .f v v A
f v f v v A0,w p
ii i
i i i0
66 2
!!
D ==
) (22)
The solution of (22) can be obtained with the iterative algo-rithm in (18) with , .v A0 i6 2!m = - The similarity function
:w RV V "# is computed from the comparison of patches of a geometric feature. This geometric feature is computed from the degree at a vertex using local height weights. These later weights are obtained from the similarity of height patches. Since the color-ization starts from initial color annotations, not all the points are considered simultaneously. The colorization starts from the points that are neighbors to the annotated colors and the set of points to be colorized grows as the algorithm iterates. The col-orization process stops when the set of vertices to colorize is empty and has converged to a stable solution. The use of adaptive geometrical weights relying on a geometric feature maps patches enables to better take into account the geometry of the point cloud during the color diffusion and blending.
Figure 5 shows the colorization of the bishop castle and of a Bas-relief (a type of sculpture in which shapes are carved). Figure 6 shows the colorization on some uncolored statues. Both cases show that the colorization allows restoration of col-ors not captured by the 3-D scanner (the bishop castle case), but also allows placement of colors on an initially uncolored object (statues cases) for a more realistic rendering.
FILTERING AND SIMPLIFICATIONModern 3-D scanners can generate large point clouds with several million or billion points. The processing of such data is difficult. Instead of downscaling the point clouds and losing details, we pro-pose a way to remove fine details without modify the appearance of the point cloud. It can be interesting to filter and simplify com-plex and redundant point clouds for Web publication purposes.
Let :f V P0 " be the vertices coordinates. The iterative algo-rithm of (18) allows filtering the geometry of 3-D objects using
.0m = Figure 7 shows the simplification of a point cloud of the Saint Eligius statue with a reduction in the number of points by 77.6% using parameters .p 0 1= and ( ) .s spz = With such a simplified point cloud, the processing of any data on this point cloud, like colors, becomes computationally feasible. Indeed, reducing the quantity of data to process makes algorithms and renderings faster. Finally, the simplification could be leveraged in
(a) (b)
(a) (b)
(c) (d)
[FIG7] The simplification of a point cloud of the Saint Eligius statue after 10,000 iterations. (a) The original point cloud (201,000 points) and (b) the point cloud simplified (45,000 points).
[FIG8] The restoration pipeline of a vase. The geometric part is first filled, then the missing color is inpainted: (a) the denoised vase, (b) the hole to fill in (boundary in yellow), (c) the filled-in hole, and (d) the inpainted hole.

IEEE SIGNAL PROCESSING MAGAZINE [110] JULY 2015
a meshing process by producing more regular polygons.
INPAINTING OF MISSING DATAInpainting consists of construct-ing new values for missing data in coherence with a set of known data. This can be the reconstruc-tion of deteriorated parts of a 3-D object represented as a point cloud. This can be of interest for extending color information to missing parts (e.g., for virtual restoration purposes). Recent inpainting work tends to unify local and nonlocal approaches under a variational formulation (see [14] and references therein for more details). We consider that data are defined on a general domain represented on a graph ( , , ) .wG V E= Let :f V C0 " be a function that assigns colors to vertices. Let A V1 be the subset of vertices with unknown values and A2 the subset of vertices with known values. The purpose of the interpolation is to find a function ft approximating f 0 in V and that corre-sponds to solving
( ) ( )
( ) ( ) .,f v v
f v f v v0 A
A,w i i
i i i0
66 2
!!
D ==3'
(23)
The infinity Laplacian is used here for interpolation since it provides better inpainting results than the isotropic p -Laplacian interpola-tion (see [15]). Works in [10] have shown that this interpolation prob-lem has a unique solution that can
be obtained using the iterative algorithm presented in [12]. At the end of each iteration the set A2 is updated by A( )n 12 +
,A A( ) ( )n n,2 2= - and A( )n 12- + is updated from .A( )n 12 + The algorithm stops when the set of vertices to inpaint is empty. Fig-ure 8 shows the restoration of a broken vase. The geometric part is corrected first, then the hole is filled; finally, the color is inpainted. One major objective of the cultural heritage is the preservation of an object. This inpainting algorithm provides a plausible virtual reconstruction of the original state of an object. The algorithm can also be used to remove and subvert parts of a damaged object, as in Figure 9.
SEGMENTATIONSegmentation is the process of partitioning a 3-D object into mul-tiple regions. Let :f RV " be the function on a graph
( , , )wG V E to segment. The segmentation problem can be for-mulated as a PDE to be solved on weighted graphs. This latter for-mulation is based on front propagation using the eikonal equation to compute general distances on graphs. Let { , ..., }L l ln1= be the set of labels and let ...S S Sn
010 0, ,= be the corresponding set of
labeled vertices. The goal of label propagation is to label each ver-tex u V! under the condition that u is a neighbor of .Si0 Such a label propagation can be formulated as solving the eikonal equa-tion on a graph G as
( ) ( , ) ( )( ) ( ) ,
v t P x vf v v x
V
Vw i p l i
i i
id !
! 1
z
z c
=
=
-) (24)
(a) (b) (c) (d)
[FIG10] Segmentation of a vase by resolving the eikonal equation on graphs [770,000 points for (a) and 200,000 points for (d)]: (a) a vase with labels, (b) the result, (c) a vase with labels, and (d) the result.
(a) (b) (c)
[FIG9] The inpainting of a part of a damaged wall: (a) the object to inpaint, (b) the inpainting marker, and (c) the inpainting result.
INPAINTING CONSISTS OF CONSTRUCTING NEW VALUES
FOR MISSING DATA IN COHERENCE WITH A SET OF KNOWN DATA.

IEEE SIGNAL PROCESSING MAGAZINE [111] JULY 2015
where :F RVl3
i " is a speed function, ( ) / ( ) ,P v F v1l i l ii i= ^ h and : RV "z represent the set of initials labels. The resolution of
the eikonal equation (24) on a weighted graph has been investi-gated in [16].
To segment a mesh or a point cloud according to the vertices colors, compute the similarity function :w RV V "# + by tak-ing into account the colorimetric distance as ,w e ( ) ( ) /f fv vi j
0 0 2= v- -
where :f V C0 " are the colors associated at the node .v Vi ! The function : RV "z associates an initial label to each vertex
.vi The parameters are set as follows: , ( ) ,p F v2 1l ii= = .v Vi6 ! Figure 10 shows some segmentation results on point
clouds after the resolution of the eikonal equation. Segmenta-tion results are 3-D subsets of the original points clouds. These subsets can then be processed by applying the previous graph signal techniques such as filtering, simplification, inpainting, and colorization.
CONCLUSIONSThis article has proposed an approach for the processing of functions on point clouds represented as graphs. We have shown how to translate PDEs using the framework of PdEs. The approach allows processing of signal data on point clouds (e.g., spectral data, colors, coordinates, and curvatures). We have applied this approach for cultural heritage purposes on examples aimed at restoration, denoising, hole-filling, inpaint-ing, object extraction, and object colorization. The results demonstrate the many potentials of the point cloud approach to the processing of cultural heritage 3-D scanned objects.
ACKNOWLEDGMENTSLivio De Luca is the director of the Models and Simulations for Architecture and Cultural Heritage Laboratory, a French research unit of the National Centre for Scientific Research and the Minis-try of Culture and Communication working on the application of informatics technologies for the study of architecture considered in its heritage, constructive, urban, and landscape dimensions. We thank him for his evaluation of the potential applications of these methods mentioned in the “Applications” section.
AUTHORSFrançois Lozes ([email protected]) received his Ph.D. degree in computer science at the Université de Caen Basse-Nor-mandie, France. His research mainly concerns the analysis of data on 3-D meshes and 3-D point clouds using graph signal processing.
Abderrahim Elmoataz ([email protected]) is a full professor of computer science at the Université de Caen Basse-Normandie, France. His research concerns partial differen-tial equations (PDEs) on 3-D surfaces and points clouds, PDEs on graphs of arbitrary topology with applications in image processing, and machine learning.
Olivier Lézoray ([email protected]) received the M.Sc. and doctoral degrees in computer science from the Universiteé de Caen Basse-Normandie, France, in 1996 and 2000, respectively. From 1999 to 2000, he was an assistant professor in the Computer Science Department at the same university. From 2000 to 2009, he was an associate professor at the Cherbourg Institute of Tech-nology in the Communication Networks and Services Depart-ment. Since 2010, he has been a full professor at the Cherbourg Institute of Technology. His research is focused on color image segmentation and filtering (graph-based variational and morpho-logical methods) and machine-learning techniques for image min-ing (neural networks and support vector machines).
REFERENCES[1] L. J. Van der Maaten and E. O. Postma, “Texton-based analysis of paintings,” in SPIE Optical Engineering+ Applications. International Society for Optics and Photonics, 2010, pp. 77980H–77980H.
[2] P. Abry, S. Jaffard, and H. Wendt, “When van Gogh meets Mandelbrot: Mul-tifractal classification of painting’s texture,” Signal Process., vol. 93, no. 3, pp. 554–572, 2013.
[3] M. Hess and S. Robson, “3D colour imaging for cultural heritage artefacts,” in ISPRS, vol. 5, 2010, pp. 288–292.
[4] Digital Imaging for Cultural Heritage Preservation: Analysis, Restoration, and Reconstruction of Ancient Artworks, (Digital Imaging and Computer Vision Series), F. Stanco, S. Battiato, and G. Gallo, Eds. New York: Taylor and Francis, 2011.
[5] B. Cornelis, T. Ružic, E. Gezels, A. Dooms, A. Pižurica, L. Platiša, J. Cornelis, M. Martens, M. D. Mey, and I. Daubechies, “Crack detection and in painting for virtual restoration of paintings: The case of the Ghent Altarpiece,” Signal Process., vol. 93, no. 3, pp. 605–619, 2013.
[6] A. Elmoataz, O. Lezoray, and S. Bougleux, “Nonlocal discrete regularization on weighted graphs: A framework for image and manifold processing,” IEEE Trans. Image Processing, vol. 17, no. 7, pp. 1047–1060, 2008.
[7] D. Shuman, S. Narang, P. Frossard, A. Ortega, and P. Vandergheynst, “The emerging field of signal processing on graphs: Extending high-dimensional data analysis to networks and other irregular domains,” IEEE Signal Processing Mag., vol. 30, no. 3, pp. 83–98, 2013.
[8] S. Arya, D. M. Mount, N. S. Netanyahu, R. Silverman, and A. Y. Wu, “An op-timal algorithm for approximate nearest neighbor searching fixed dimensions,” J. ACM, vol. 45, no. 6, pp. 891–923, Nov. 1998.
[9] A.Buades, B.Coll, and J.-M. Morel, “Image denoising methods. A new nonlocal principle,” SIAM Rev., vol. 52, no. 1, pp. 113–147, 2010.
[10] F. Lozes, A. Elmoataz, and O. Lezoray, “Partial difference operators on weight-ed graphs for image processing on surfaces and point clouds,” IEEE Trans. Image Processing, vol. 23, no. 9, pp. 3896–3909, Sept. 2014.
[11] V.-T. Ta, A. Elmoataz, and O. Lézoray, “Nonlocal PDEs-based morphology on weighted graphs for image and data processing,” IEEE Trans. Image Processing, vol. 26, no. 2, pp. 1504–1516, June 2011.
[12] A. Elmoataz, X. Desquesnes, and O. Lezoray, “Non-local morphological pdes and p-Laplacian equation on graphs with applications in image process-ing and machine learning,” IEEE J. Sel. Top. Signal, vol. 6, no. 7, pp. 764–779, 2012.
[13] O. Lezoray, V.-T. Ta, and A. Elmoataz, “Partial differences as tools for filtering data on graphs,” Pattern Recogn. Lett., vol. 31, no. 14, pp. 2201–2213, 2010.
[14] P. Arias, G. Facciolo, V. Caselles, and G. Sapiro, “A variational framework for exemplar-based image inpainting,” Int. J. Comput. Vision, vol. 93, no. 3, pp. 319–347, 2011.
[15] M. Ghoniem, A. Elmoataz, and O. Lézoray, “Discrete infinity harmonic func-tions: towards a unified interpolation framework on graphs,” in Proc. IEEE Int. Conf. Image Processing, 2011, pp. 1361–1364.
[16] X. Desquesnes, A. Elmoataz, and O. Lézoray, “Eikonal equation adaptation on weighted graphs: Fast geometric diffusion process for local and non-local image and data processing,” J. Math. Imaging Vis., vol. 46, no. 2, pp. 238–257, 2013.
[SP]