forums on issues and innovations in real estate global products and sources for real estate capital...
TRANSCRIPT

Forums on Issues and Innovations in Real Estate
Global Products and Sources for Real Estate Capital
October 2006

Tommy Brown
Agenda
Global real estate capital flows
Real estate products

Tommy Brown
Agenda
Global real estate capital flows
Real estate products
Tommy Brown
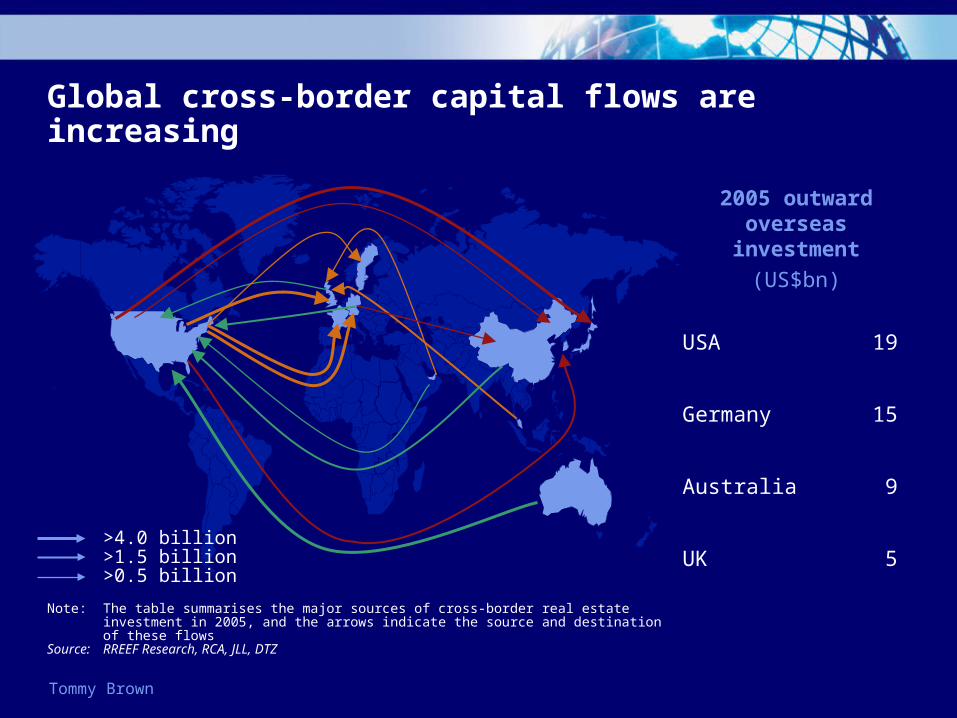
Global cross-border capital flows are increasing
Note: The table summarises the major sources of cross-border real estate investment in 2005, and the arrows indicate the source and destination of these flows
Source: RREEF Research, RCA, JLL, DTZ
>4.0 billion>1.5 billion>0.5 billion
2005 outward overseas investment
(US$bn)
USA 19
Germany 15
Australia 9
UK 5
Tommy Brown
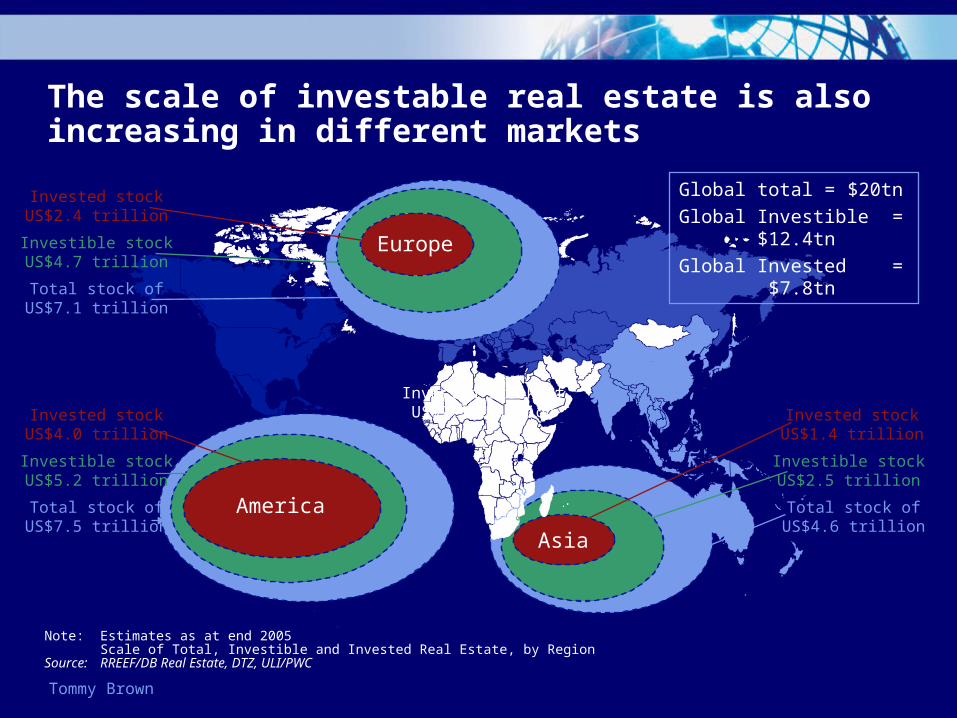
The scale of investable real estate is also increasing in different markets
Note: Estimates as at end 2005Scale of Total, Investible and Invested Real Estate, by Region
Source: RREEF/DB Real Estate, DTZ, ULI/PWC
Asia
America
Europe
Invested stockUS$2.4 trillion
Invested stock ofUS$7.1 trillion
Total stock ofUS$7.1 trillion
Investible stockUS$4.7 trillion
Invested stockUS$4.0 trillion
Total stock ofUS$7.5 trillion
Investible stockUS$5.2 trillion
Invested stockUS$1.4 trillion
Total stock ofUS$4.6 trillion
Investible stockUS$2.5 trillion
Global total = $20tn
Global Investible = $12.4tn
Global Invested = $7.8tn

Tommy Brown
Additionally, overall capital to real estate is increasing
Pubic equity Public debt
Private debt Private equity
Note: Size of global listed real estate marketSource: UBS
Note: Issuance of CMBSSource: Deutsche Bank Securitisation Research
Note: Bank lending to commercial real estateSource: RREEF Research, DTZ
Note: Direct real estate investment activitySource: RREEF, DTZ, JLL, RCA
0
400
800
2001 2002 2003 2004 2005
(US
$b
n)
REIT Non-REIT
0
150
300
2001 2002 2003 2004 2005
(US
$b
n)
US Non-USA
0
2,250
4,500
2001 2002 2003 2004 2005
(US
$b
n)
US Europe Asia-Pacific
0
250
500
2001 2002 2003 2004 2005
(US
$b
n)
US Europe Asia-Pacific
Tommy Brown
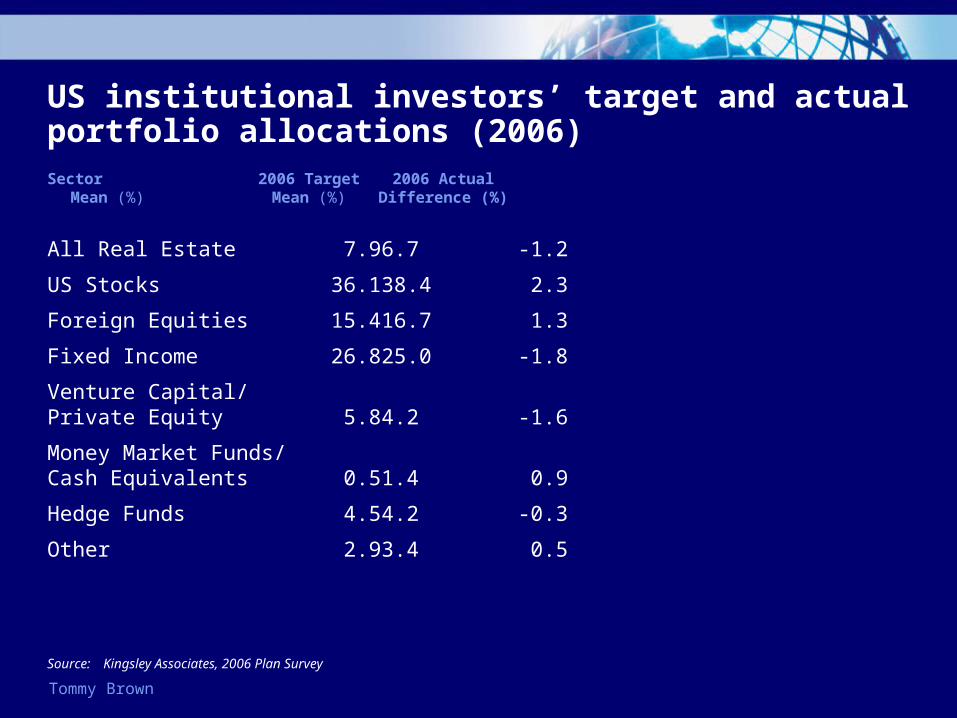
US institutional investors’ target and actual portfolio allocations (2006)
All Real Estate 7.9 6.7 -1.2
US Stocks 36.1 38.4 2.3
Foreign Equities 15.4 16.7 1.3
Fixed Income 26.8 25.0 -1.8
Venture Capital/Private Equity 5.8 4.2 -1.6
Money Market Funds/Cash Equivalents 0.5 1.4 0.9
Hedge Funds 4.5 4.2 -0.3
Other 2.9 3.4 0.5
Sector 2006 Target 2006 ActualMean (%) Mean (%) Difference (%)
Source: Kingsley Associates, 2006 Plan Survey

Tommy Brown
US institutional investors’ over/Under allocation
Source: Kingsley Associates, 2006 Plan Survey
1.5 1.4
-0.9-1.5
2.2
0.8
-1.3
0.7
-1.2
1.3
-1.8
-0.5
-1.7
-0.1
0.4
-0.7
-0.1
2.3
-1.6
-0.3
0.9
-2.5-2.0-1.5-1.0-0.50.00.51.01.52.02.53.0
All RealEstate
US Stocks ForeignEquities
All FixedIncome
VC/PrivateEquity
Cash HedgeFunds
% o
ver/
un
de
r ta
rge
t
2004 2005 2006
Investors remain challenged to
meet real estate targets.

Tommy Brown
Agenda
Global real estate capital flows
Real estate products
Tommy Brown
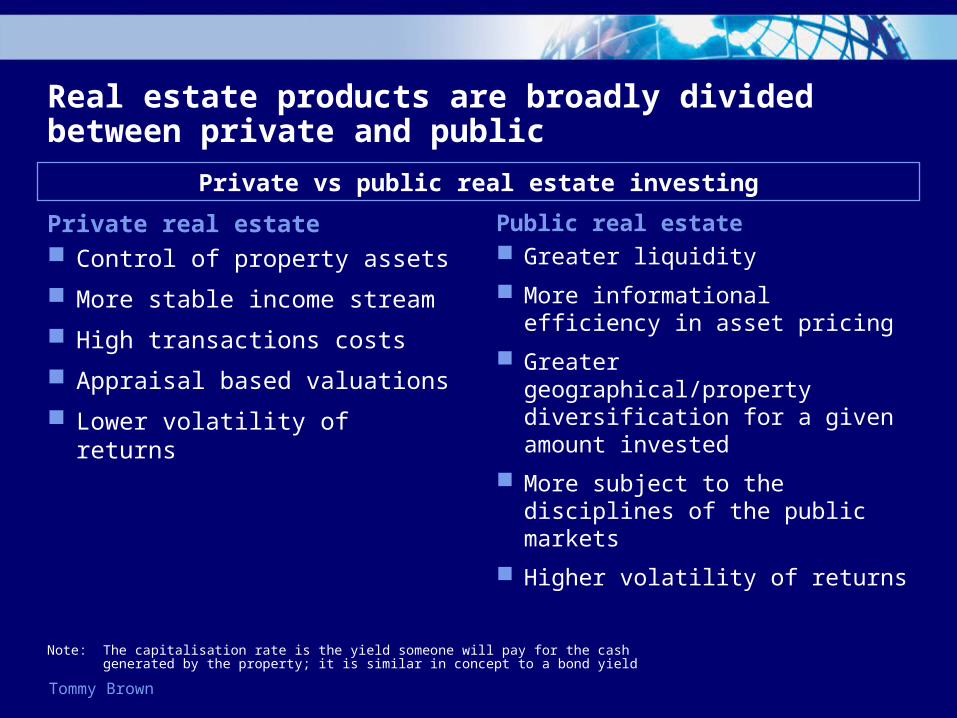
Real estate products are broadly divided between private and public
Private real estate Control of property assets
More stable income stream
High transactions costs
Appraisal based valuations
Lower volatility of returns
Public real estate Greater liquidity
More informational efficiency in asset pricing
Greater geographical/property diversification for a given amount invested
More subject to the disciplines of the public markets
Higher volatility of returns
Private vs public real estate investing
Note: The capitalisation rate is the yield someone will pay for the cash generated by the property; it is similar in concept to a bond yield

Tommy Brown
Several questions need to addressed when investing in real estate
Investment process
Strategic asset allocation
Real Estate
Equity
Debt
Cash
Other
How much to invest in Real Estate? Where to invest?
What’s The Risk/Reward balance?
What type of property?
What format? How much
liquidity is required?
Who is performing mgmt/ oversight of investment?
Str
ate
gic
ass
et
allo
catio
n
Geographic allocation
Domestic
Europe
US
Asia
Other
Investment strategy
Core
Core plus / Value add
Opportunistic
Sector allocation
Office
Retail
Industrial
Residential
Special property(1)
Investment vehicle
Private equity direct(2)
Private equity indirect(3)
Private debt
Public equity(4)
Public debt(5)
Real estate investment
(1) Includes self storage, care homes and medical labs(2) Real Private equity direct (buildings)(3) Private equity indirect (funds)(4) Public equity (REITS / Mutual funds)(5) Public debt (CMBS / Mezzanine)
Private real estate investing
Public real estate investing

Tommy Brown
The real estate universe has matured to provide an array of investment alternatives
Low Risk (and leverage) High
Breakdown of universe of real estate investment products
Private
Core Value-added returns Opportunistic(up to 8%) (up to 14%) (+18%)
Direct
Indirect
Note: The above illustration can be further segmented by geography and property type. The returns shown are for illustrative purposes only and are indicative IRRs (internal rate of return) without regard to the duration of the investment.
Source: Deutsche Bank
Public
Equity
Debt
Debt
Equity
Direct investments in existing assets
Funds
Real estate operating companies
Opportunity funds
Direct property development
Mortgage lending Mezzanine debt
CMBS
Unsecured debt of real estate companies
Real estate companies
Mutual funds
Structured products
Debt /Mezzfunds

Tommy Brown
European market for private real estate funds is achieving scale and positioned to increase substantially
Non-listed institutional real estate funds
Source: INREV, Quarterly Report, Issue No,12
0
50
100
150
200
250
300
350
Au
g 0
3
De
c 0
3
Ma
r 0
4
Jul 0
4
No
v 0
4
Jan
04
Ap
r 0
5
Jul 0
5
Oct
05
Jan
06
Ap
r 0
6
Jul 0
6Siz
e o
f E
uro
pe
an
ma
rke
t (€
bn
)
0
100
200
300
400
500
GAV (€bn) Number of funds

Tommy Brown
There has been significant new public real estate equity issuance
0
10,000
20,000
30,000
40,000
50,000
60,000
2001 2002 2003 2004 2005
De
al v
alu
e (
$m
)
US Non-US
Historical public real estate equity issuance
Source: Equityware
Tommy Brown
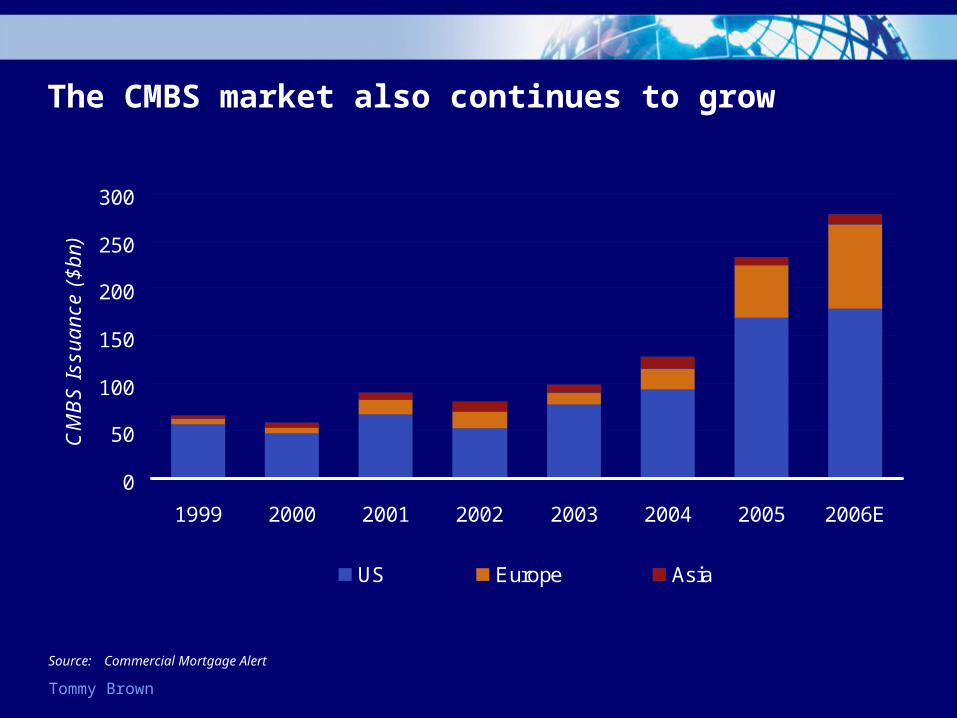
The CMBS market also continues to grow
0
50
100
150
200
250
300
1999 2000 2001 2002 2003 2004 2005 2006E
CM
BS
Iss
ua
nce
($
bn
)
US Europe Asia
Source: Commercial Mortgage Alert

Tommy Brown
Disclaimer
THIS PRESENTATION CONTAINS INFORMATION WHICH HAS BEEN PROVIDED BY A NUMBER OF SOURCES. WHILE THE INFORMATION HEREIN IS BELIEVED TO BE RELIABLE, NO REPRESENTATION IS MADE HEREIN BY DEUTSCHE BANK OR ANY OF ITS AFFILIATES, AS TO THE ACCURACY OR COMPLETENESS OF SUCH INFORMATION.
THIS PRESENTATION HAS BEEN PREPARED FOR INFORMATIONAL AND DISCUSSION PURPOSES ONLY AND DOES NOT CONSTITUTE AN OFFER, OR AN INVITATION TO OFFER, OR A RECOMMENDATION TO ENTER INTO ANY TRANSACTION. DEUTSCHE BANK IS NOT ACTING AS YOUR FINANCIAL ADVISOR OR IN A FIDUCIARY CAPACITY IN RESPECT OF ANY TRANSACTION WITH YOU UNLESS EXPRESSLY AGREED BY DEUTSCHE BANK IN WRITING. BEFORE ENTERING INTO ANY TRANSACTION YOU SHOULD TAKE STEPS TO ENSURE THAT YOU UNDERSTAND THE TRANSACTION AND HAVE MADE AN INDEPENDENT ASSESSMENT OF THE APPROPRIATENESS OF THE TRANSACTION IN THE LIGHT OF YOUR OWN OBJECTIVES AND CIRCUMSTANCES, INCLUDING THE POSSIBLE RISKS AND BENEFITS OF ENTERING INTO SUCH TRANSACTION. YOU SHOULD ALSO CONSIDER SEEKING ADVICE FROM YOUR OWN ADVISORS IN MAKING THIS ASSESSMENT. NEITHER DEUTSCHE BANK OR ANY OF ITS AFFILIATES ACCEPT ANY LIABILITY WHATSOEVER WITH RESPECT TO THE CONTENT OF THIS DOCUMENT, ITS USE OR ANY LOSS ARISING FROM IT.

Forums on Issues and Innovations in Real Estate
Global Products and Sources for Real Estate Capital
October 2006