forest service handbook washington fsh 2409.12 - timber
TRANSCRIPT
TIMBER CRUISING HANDBOOK
1
FOREST SERVICE HANDBOOKWASHINGTON
FSH 2409.12 - TIMBER CRUISING HANDBOOK
Amendment No.
Effective
POSTING NOTICE. Amendments are numbered consecutively by title andcalendar year. Post by document name. Remove entire document andreplace with this amendment. Retain this transmittal as the firstpage of this document. The last amendment to this Handbook was2409.12 the original handbook.
Superseded New Document Name (Number of Pages)
00-05 511-15.3 1521-23.22 2130.5-38.5 8441-43.6 1251-53.23 861-63.5 1271-73.2 581-81.2 3
Digest: Revises and updates entire handbook. Significant changes indirection are as follows:l
05 Adds new definitions.08 Adds reference section to zero code.13.28 Adds information on laser cruising equipment.21-23.22 Updates and adds instructions for volume estimators, addsreference to FSH 2409.12a, Timber Volume Estimators Handbook. 30.5 Adds definitions of statistical terms. 31-38.3 Adds example calculations of cruise statistics.41-43.6 Updates direction for selecting cruise methods, timber cruiseplanning, data recording and cruise records. 41.4-41.45 Adds direction on stratification of samples. 51-53.35 Adds direction for global positioning system traverses61-66.1 Updates and adds direction for certification of cruisers andcruises.72-72.2 Adds direction for marking to reduce likelihood of trespassand for use of tracer paint.81-81.2 Updates direction for trespass cruises.
F. DALE ROBERTSON

TIMBER CRUISING HANDBOOK
2
Chief

TIMBER CRUISING HANDBOOK
3

TIMBER CRUISING HANDBOOK
4
UNITED STATES DEPARTMENT OF AGRICULTUREFOREST SERVICE
FSH 2409.12
TIMBER CRUISING HANDBOOK

TIMBER CRUISING HANDBOOK
5
TIMBER CRUISING HANDBOOK
6
UNITED STATES DEPARTMENT OF AGRICULTUREFOREST SERVICE
TIMBER CRUISING HANDBOOK
Contents
ZERO CODE
CHAPTER
10 PRINCIPLES OF MEASURING TREES
20 ESTIMATING TREE VOLUME AND WEIGHT
30 CRUISING SYSTEMS
40 CRUISE PLANNING, DATA RECORDING, AND CRUISE REPORTING
50 AREA DETERMINATION
60 QUALITY CONTROL
70 DESIGNATING TIMBER FOR CUTTING
80 MISCELLANEOUS TIMBER CRUISING SUBJECTS
90 MISCELLANEOUS TABLES

TIMBER CRUISING HANDBOOK
7
TIMBER CRUISING HANDBOOK
8
ZERO CODE
Contents
01 AUTHORITY
02 OBJECTIVE
03 POLICY
04 RESPONSIBILITY
05 DEFINITIONS
08 REFERENCES

TIMBER CRUISING HANDBOOK
9
TIMBER CRUISING HANDBOOK
10
ZERO CODE
01 - AUTHORITY. Timber use laws are cited in Title 36 of the Code ofFederal Regulations (CFR), Part 223, Subpart A.
02 - OBJECTIVE. The objective of timber cruising is to providereliable estimates for timber appraisals. The timber volume estimateserves as the basis for payment on tree measurement sales or forbidding on scaled sales.
03 - POLICY. Regions and Forests shall use the procedures providedin this Handbook when cruising timber for sales, free use, exchange,or in trespass cases.
04 - RESPONSIBILITY. It is the responsibility of the RegionalForester to:
1. Issue direction, as needed, to accommodate specific Regionaland local conditions.
2. Approve the use of local and aerial volume estimates. Thisauthority may not be redelegated.
05 - DEFINITIONS. The following are special terms used throughoutthe text. See FSH 2409.14 for standards for data elements.
Bark--All the tissues, including the cambium, taken collectivelyand forming the exterior covering of the xylem of a tree.
Bole--A tree stem that has grown to substantial thickness;generally capable of yielding sawtimber, veneer logs, large poles, orpulpwood.
Bolt--Any short log cut to a specific length.
Butt end--The end of a tree length originally connected to thestump.
Butt log - The lowest log on a bole.
Butt rot - Any decay or rot developing in and sometimescharacteristically confined to the base or lower stem of a tree.
Butt swell - That part of a log outside its normal taper,extending from where the normal taper ends and the flare begins tothe large end of the log. It is usually manifest only in butt logs,due to the self-buttressing growth of the tree near its base.
Caliper - An instrument for determining tree and log diametersby measurement of their rectangular projection on a straightgraduated rule via two arms at right angles to (and one of themsliding along) the rule itself.
Catface - A defect on the surface of a tree or log resultingfrom a wound where healing has not reestablished the normal crosssection.
TIMBER CRUISING HANDBOOK
11
Charred wood - Wood converted to charcoal as a result ofincomplete combustion.
Conk - The fruiting body of a fungus denoting the presence ofrot. The conk may be of various shapes and sizes.
Cull log - A log not meeting the specified product requirementsdue to defect.
DBH - Abbreviation for Diameter Breast Height; diameter atbreast height is measured at 4.5 feet above the ground on the highside of the tree.
Decay - The decomposition of wood substance caused by the actionof wood-destroying fungi, resulting in softening, loss of strengthand mass, and often in change of texture and color. Examples ofdecay are:heart rot, sap rot, stump rot, and rotten knots.
Defect - Any imperfection occurring in and affecting thequantity of products for which the log is being scaled.
Diameter, small end - The average diameter, inside bark, at theupper end of the tree length or log segment.
Diameter tape - A circumference tape measure specially graduatedso the diameter may be read directly when the tape is placed arounda tree stem, bole, or piece of roundwood.
DIB - Abbreviation for Diameter Inside Bark, a measurement ofthe diameter at a point on a tree or log that includes the wood only.
DOB - Abbreviation for Diameter Outside Bark, a measurement ofthe diameter at a point on a tree or log that includes the wood andbark.
Fire scar - A healing or healed-over injury on a woody plant,caused or aggravated by fire.
Firm red heart - A form of incipient decay characterized by areddish color produced in the heartwood, which does not render thewood unfit for the majority of uses. Firm red heart contains none ofthe white pockets characterizing the more advanced stage of decay.
Flare - A rapid increase in the taper of a log at the butt enddue to swell (See "butt swell").
Fork - A division of a log or a stem of a tree into two or moreprongs.
Gross volume - Total volume including defects.
Heart check - A check or separation originating at the pith andextending across the annual rings.
Heart rot - Any rot characteristically confined to theheartwood. It generally originates in the living tree.
TIMBER CRUISING HANDBOOK
12
Height - The measured length of the bole from a specified pointat or near the ground to a specified point higher on the bole oftree. (FSH 2409.14)
Heartwood - The inner core of a woody stem wholly composed ofnonliving cells and usually differentiated from the outer envelopinglayer (sapwood) by its darker color.
Incipient decay - The early stage of decay in which thedecomposition has not proceeded far enough to soften or otherwisechange the hardness of the wood perceptibly. It is usuallyaccompanied by a slight discoloration of the wood. (See "firm redheart.")
Intermediate decay - A more advanced stage of decay thanincipient decay, characterized by a change in the color of the woodand some slight decomposition and loss of strength which does notrender the wood unfit for general purposes. (See "white specks.")
Knot - A portion of a branch enclosed in the xylem by thenatural growth of the tree.
Linear measure - A measure of length.
Log - A section of the bole of a felled tree, after trimming andcross-cutting.
Log rule - A table or equation that estimates product yieldcontained in logs of given length, form, and end diameter insidebark.
Merchantable Height - The measured length of the bole from aspecified point at or near the ground to a point higher on the bolewhere it is too small or defective to meet a specified productutilization standard, such as pulpwood or sawlog.
Missing wood - Wood absent from a log or part of a log thatotherwise would usually be regarded as naturally complete. It may becaused by advanced decay, fire, or the operation of a machine ortool.
Net volume - The volume remaining after all deductions fordefects from gross volume have been made.
Out of round - Describes a shape that departs from circular.
Ovendry - A condition in which the wood has ceased to losemoisture after being subjected to a temperature of 103 +2 C in ao
ventilated oven, for purposes of determining moisture content.
Piece - A part of a whole (as of a tree); it also means anobject regarded as a unit of a kind (as one of a number of productsof the group).
Pocket rot - In wood, any rot localized in small areas,generally forming round or lens-shaped cavities.
Product - A commodity manufactured from a portion of a tree.
TIMBER CRUISING HANDBOOK
13
Product estimator - A procedure, equation, or table used toestimate the product volume of a tree or tree segment. Potentialsawn lumber measured in board feet is the most common productestimated. Product estimators are frequently misclassified as volumeestimators.
Product Volume - A statement of the potential amount of amanufactured product; board feet, cubic feet, square feet, linealfeet and so forth.
Pulpwood - Wood cut and prepared primarily for manufacture intowood pulp.
Punky wood - A soft, weak, often spongy wood condition caused bydecay.
Ring rot - Any rot localized mainly in the earlywood of theannual rings, giving a concentric pattern of decayed wood incross-section.
Reference diameter - The specified bole diameter to which heightis measured.
Reference height - The height measured to a specified point onthe tree bole.
Ring shake - A shake that separates between the annual rings andpartially or completely encircles the pith.
Roundwood - Any section of the stem or of the thicker branches,of a tree of commercial value that has been felled or cut but has notbeen processed beyond removing the limbs, or bark, or both.
Sample - A subset of a population, being representative of thatpopulation.
Sample size - The number of sampling units included in a sample.
Sample tree - An individual tree included in a sample for thepurpose of measurement.
Sampling group - One of the units, groups or strata into which apopulation is subdivided for purposes of sampling.
Sap rot - Any rot characteristically confined to the sapwood.
Sapwood - The living wood of pale color near the outside of thelog.
Scale (verb) - To measure or estimate the quantity, expressed asthe volume, or area, or length, or mass, or number of productsobtained from trees after they are felled. See National Forest LogScaling Handbook, FSH 2409.11 and FSH 2409.11a for scaling practicesand procedure.
Scale stick - A graduated stick for measuring the end diametersof logs or felled trees inside bark.
TIMBER CRUISING HANDBOOK
14
Shake - A separation along the grain and occurring between oracross the annual rings, but not extending from one surface toanother.
Soundwood - Wood free from structural defect.
Stem - The principal axis of a plant from which buds and shootsdevelop. Larger tree stems are called boles.
Stem profile model - A mathematical respresentation of a tree'sprofile or shape. (Also referred to as a stem profile equation.)
Sweep - A gradual curve in the length of a log, as distinct froman abrupt bend or curvature.
Taper equation - See stem profile model.
Taper, log - The progressive change in the diameter of a logfrom one end, or point on its length, to another.
Taper, tree - The progressive decrease in the stem or bolediameter of a tree from the ground or a specified point on the lowerbole to the tip or a specified point on the upper bole.
Tarif - A word of Arabic origin meaning tabulated information;applied to a specific type of volume table.
Tree profile model - See stem profile model.
Tree volume, merchantable - The portion of tree volume that canbe sold and utilized in a manufacturing process.
Tree volume, total - The cubic content of a tree from ground totip. This might or might not include the cubic content of limbs.
Variable - A characteristic of a population that may vary fromone sampling unit to another. Variables are classed as:
Continuous variable is related to some numerical scale ofmeasurement, any interval of which may be subdivided intoan infinite number of values such as length, height,volume, mass.
or
Discrete variable can assume only a specified number ofvalues.
Variable of Interest - The variable used to develop an estimateof the average and the variation in the desired characteristic forthe population being sampled. The variation is used to estimate thereliability of the estimated characteristic for the population and todetermine how many members of a population must be sampled to achievea desired level of reliability. The variable of interest is relevantonly to the characteristic being sampled in a sample group or strata,and in the case of two-stage sampling, to the stage of the sample.
TIMBER CRUISING HANDBOOK
15
Volume estimator - An equation or series of equations used toestimate the average cubic content of a log or tree.
White specks - Small white pits or streaks in the wood,characteristic of the intermediate stage of Phellinus Pini (Fomes)decay.
Woodchip - A small, thin, and flat piece of wood cut from alarger piece of wood by knife action. A woodchip shall show twoknife cuts and its width is always greater than its thickness.
08 - REFERENCES. The following references contain additional detailand theoretical information used in the development of this handbook. Users seeking additional background on specific aspects of timbercruising may refer to the following:
Aho, Paul E. 1966. Defect estimation for grand fir, Engelmann spruce,Douglas-fir and western larch in the Blue Mountains of Oregon andWashington. U.S. Forest Service, Pac. N.W. For. and Range Exp. Sta.
Avery, Thomas Eugene and Harold E. Burkhart 1983. ForestMeasurements. McGraw Hill Book Co., New York. 3rd Edition 349p.
Beers, T. W. and C. I. Miller. 1964. Point Sampling: Researchresults, theory and applications. Purdue University Agr. Exp. Sta.Res. Bulletin 786.
Bitterlich, W. 1947. Die Winkelzahlmessung (Measurement of basal areaper hectare by means of angle measurement). Allg. Forst. Holzwirtsch.Ztg. 58:94-96.
Bruce, Donald. 1961. "Prism cruising in the western United Statesand volume tables for use therewith." Portland, Oregon: Mason, Bruceand Girard.
Dilworth, J. R. and J. F. Bell. 1980. Variable plot cruising. OregonState Univ. Book Stores, Inc. Corvallis, OR.
Freese, Frank. 1962. Elementary forest sampling. U.S.D.A. Agr.Handbook No. 232. U.S. Gov't Printing Office.
Freese, Frank. 1967. Elementary statistical methods for foresters.U.S.D.A. Agr. Handbook No. 317. U.S. Gov't Printing Office.
Gregoire, Timothy G. 1982. The unbiasedness of the mirage correctionprocedure for boundary overlap. Forest Sci. 28(3): 504-508.
Grosenbaugh, L. R. 1952. Plotless timber estimates--new, fast, easy.Jour. For. 50:32-37.
Grosenbaugh, L. R. 1958. Point-sampling and line-sampling:probability theory, geometric implications, synthesis. South. For.Exp. Sta. Occ. Paper 160.
Grosenbaugh, L. R. 1964. Some suggestions for bettersample-tree-measurement. Soc. Amer. Foresters Proc. 1963:36-42,illus.
TIMBER CRUISING HANDBOOK
16
Grosenbaugh, L. R. 1965. Three-pee sampling theory and program THRP.U.S. Forest Service, Pac. S.W. For. and Range Exp. Sta. Res. Paper.PSW-21.
Grosenbaugh, L. R. 1967. STX-Fortran-4 program for estimates of treepopulations from 3P sample tree measurements. U.S. Forest Service,Pac. S.W. For. and Range Exp. Sta. Res. Paper. PSW-13.
Grosenbaugh, L. R. 1974. STX 3-3-73: Tree content and valueestimation using various sample designs, dendrometry methods, andV-S-L conversion coefficients. U.S. Forest Service, S.E. For. Exp.Sta. Res. Paper. SE-117.
Husch, Bertram, Charles Miller and Thomas Beers. 1982. ForestMensuration. John Wiley and Sons, Inc., New York. 3rd Edition, 402p.
Johnson, Floyd A. 1965. Sample sizes for timber cruises. U.S. ForestService, Pac. N.W. For. and Range Exp. Sta. Res. Note. PNW-30.
Mesavage, Clement. 1964. Aids for using Barr and Stroud dendrometers.Soc. Amer. Foresters Proc. 1964:238-244, illus.
Mesavage, Clement. 1968. Revised calculator for Barr and Strouddendrometers. U.S. Forest Service, So. For. and Range Exp. Sta. Res.Note. S0-84.
Mesavage, Clement. 1971. STX timber estimating with 3P sampling anddendrometry. U.S.D.A. Agr. Handbook No. 415. U.S. Gov't PrintingOffice.
Turnbull, K. J. and G. H. Hoyer. 1965. Construction and Analysis ofComprehensive Tree-Volume Tarif Tables. State of Washington,Department of Natural Resources, Olympia, Washington. ResourceManagement ReportNo. 8.
Van Wagner, C. E. 1968. The line intersect method in forest fuelsampling. Forest Science 14(1): 20-26.

TIMBER CRUISING HANDBOOK
17
TIMBER CRUISING HANDBOOK
18
CHAPTER 10 - PRINCIPLES OF MEASURING TREES
Contents
11 SPECIES IDENTIFICATION
12 TREE MERCHANTABILITY SPECIFICATIONS
13 TREE MEASURING INSTRUMENTS13.1 Diameter Measuring Instruments13.11 Diameter Tape13.12 Tree Calipers13.13 Dendrometers13.13a Optical Fork (Relaskop, Telerelaskop)13.13b Optical Calipers (Wheeler penta-prism caliper)13.13c Short-Base Rangefinder Dendrometer13.2 Height Measuring Instruments13.21 Telescoping Measuring Rod13.22 Haga Altimeter13.23 Blume-Leiss Altimeter13.24 Clinometer13.25 Abney Level13.26 Spiegel-Relaskop13.27 Telerelaskop and Barr and Stroud Dendrometers13.28 Laser Measuring Devices
14 MEASURING THE TREE14.1 Measuring Tree Diameter14.11 Reading the Diameter Tape14.12 Measuring Tree Diameter At Breast Height (DBH)14.12a Leaning Trees14.12b Forked Trees14.12c Trees Growing Together14.12d Trees With Abnormalities at 4.5 Feet14.12e Trees Growing on Objects14.12f Coppice Growth14.12g Broken Trees14.12h Broken Off Trees14.12i Down Trees14.12j Severed, Down Trees14.12k Split Trees14.12l Trees Having a Large Catface14.12m Trees Without Bark14.2 Measuring Tree Heights14.21 Baseline Distance14.22 Vertical Trees14.23 Leaning Trees14.24 Forked Trees14.25 Trees Having a Broken or Missing Top14.26 When Measurement Point is Hidden14.3 Tree Form Class

TIMBER CRUISING HANDBOOK
19
TIMBER CRUISING HANDBOOK
20
CHAPTER 10 - PRINCIPLES OF MEASURING TREES
Timber cruising is the determination of the gross and net productvolume and value (timber quality) for a tract of timber. It involvesmeasuring tree diameters and heights, estimating defects, and makingother determinations, such as grade and form class, that may bespecified by the cruise plan. This chapter deals with the technicalaspects of making tree measurements and the tools required.
11 - SPECIES IDENTIFICATION. Each timber cruiser must properlyidentify tree species. Stumpage rates, merchantabilityspecifications, and many product volume references are speciesrelated. Species may be identified by bark characteristics, form,type of fruit, cones, needles, leaves, and other features.
12 - TREE MERCHANTABILITY SPECIFICATIONS. Develop the minimum treeand piece merchantability specifications in the cruise design phaseand document in the cruise plan. These specifications will beincluded in the Timber Sale Contract to identify material to beremoved. Knowledge of the minimum piece and tree specifications foreach end product category is required. The cruiser must recognizeand record the end product potential for cruised materials. Endproducts are subdivided into three categories:
1. Material suitable for the manufacture into lumber orveneer.
2. Material suitable for conversion into chips.3. Material suitable for conversion into other products such
as poles, pilings, rails, ties, and house logs.
The minimum piece specifications are described by:
1. Length.2. Diameter inside bark at the small end.3. Net product volume as a percent of gross product volume.4. Other timber sale specifications.
The minimum tree specifications are described by:
1. Minimum number of pieces a tree must contain to be merchantable.
2. Minimum diameter breast height.3. Piece net volume.
13 - TREE MEASURING INSTRUMENTS.
13.1 - Diameter Measuring Instruments.
13.11 - Diameter Tape. The diameter tape is the most common deviceused in measuring tree diameters. Tapes are either 20-feet or50-feet long, are made of steel, usually have a bark hook on the zeroend, and are graduated on the outside surface in inches and tenths ofinches of diameter equivalents (3.1416 inches) of circumference. Tapes may also have linear graduation in feet or meters on the insidesurface. Many logger's tapes are graduated, on the backside, indiameter equivalents of circumference.
TIMBER CRUISING HANDBOOK
21
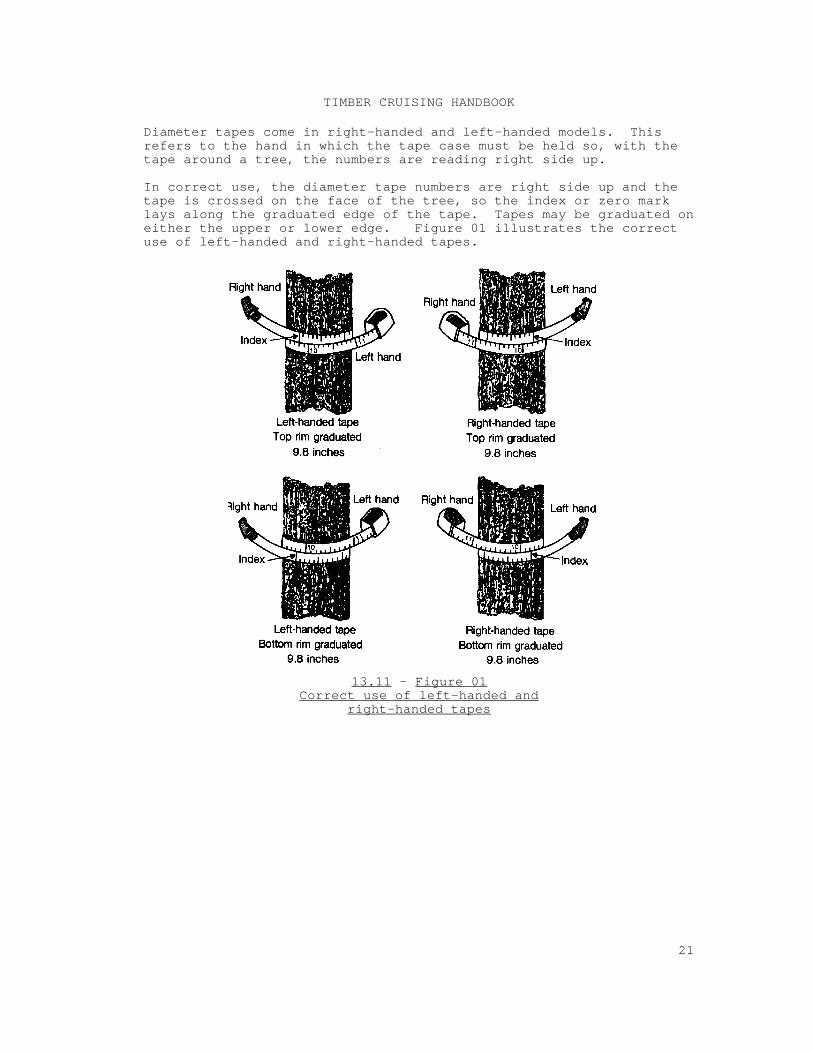
Diameter tapes come in right-handed and left-handed models. Thisrefers to the hand in which the tape case must be held so, with thetape around a tree, the numbers are reading right side up.
In correct use, the diameter tape numbers are right side up and thetape is crossed on the face of the tree, so the index or zero marklays along the graduated edge of the tape. Tapes may be graduated oneither the upper or lower edge. Figure 01 illustrates the correctuse of left-handed and right-handed tapes.
13.11 - Figure 01Correct use of left-handed and
right-handed tapes
TIMBER CRUISING HANDBOOK
22
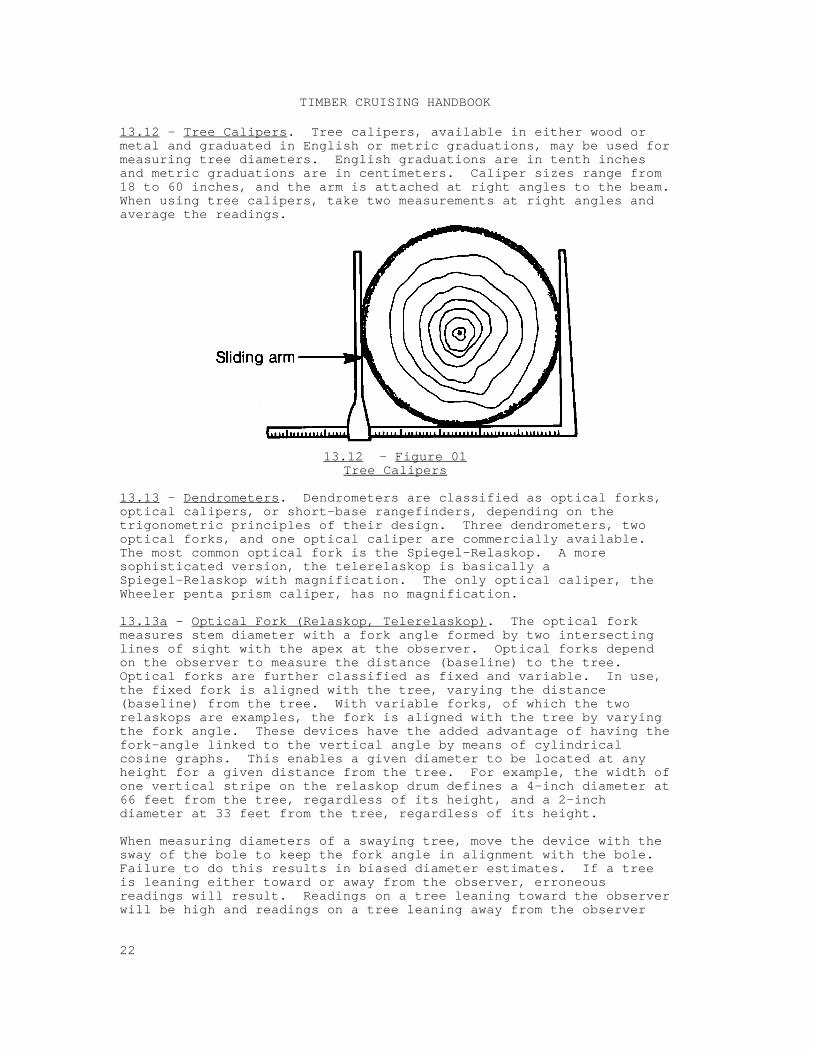
13.12 - Tree Calipers. Tree calipers, available in either wood ormetal and graduated in English or metric graduations, may be used formeasuring tree diameters. English graduations are in tenth inchesand metric graduations are in centimeters. Caliper sizes range from18 to 60 inches, and the arm is attached at right angles to the beam. When using tree calipers, take two measurements at right angles andaverage the readings.
13.12 - Figure 01Tree Calipers
13.13 - Dendrometers. Dendrometers are classified as optical forks,optical calipers, or short-base rangefinders, depending on thetrigonometric principles of their design. Three dendrometers, twooptical forks, and one optical caliper are commercially available. The most common optical fork is the Spiegel-Relaskop. A moresophisticated version, the telerelaskop is basically aSpiegel-Relaskop with magnification. The only optical caliper, theWheeler penta prism caliper, has no magnification.
13.13a - Optical Fork (Relaskop, Telerelaskop). The optical forkmeasures stem diameter with a fork angle formed by two intersectinglines of sight with the apex at the observer. Optical forks dependon the observer to measure the distance (baseline) to the tree. Optical forks are further classified as fixed and variable. In use,the fixed fork is aligned with the tree, varying the distance(baseline) from the tree. With variable forks, of which the tworelaskops are examples, the fork is aligned with the tree by varyingthe fork angle. These devices have the added advantage of having thefork-angle linked to the vertical angle by means of cylindricalcosine graphs. This enables a given diameter to be located at anyheight for a given distance from the tree. For example, the width ofone vertical stripe on the relaskop drum defines a 4-inch diameter at66 feet from the tree, regardless of its height, and a 2-inchdiameter at 33 feet from the tree, regardless of its height.
When measuring diameters of a swaying tree, move the device with thesway of the bole to keep the fork angle in alignment with the bole. Failure to do this results in biased diameter estimates. If a treeis leaning either toward or away from the observer, erroneousreadings will result. Readings on a tree leaning toward the observerwill be high and readings on a tree leaning away from the observer
TIMBER CRUISING HANDBOOK
23
will be low. Therefore, when measuring stem diameters of leaningtrees, make all sightings at right angles to the lean.
The instruments mentioned here should be mounted on a tripod or staffto facilitate accurate measurements. Failure to do so may increasemeasurement variation and increase the number of measurementsnecessary to attain the desired precision.
To avoid bias from the revolving drum of the relaskop being out ofalignment, periodically check the device against a target of knownwidth.
13.13b - Optical Calipers (Wheeler penta-prism caliper). The opticalcaliper measures stem diameter with two parallel lines of sightseparated by a sliding measurement scale at the observer. It is anoptical analog of the conventional mechanical tree caliper. There iscurrently no commercial optical caliper equipped with magnification. The commonly used Wheeler model is, however, equipped with aclinometer to measure height. This instrument requires a measuredbaseline from the observer to the tree when used with the clinometerto measure height. If only used for measuring diameters anywhere onthe stem, the distance to the tree (baseline distance) does not haveto be known.
The chief advantage of this instrument is that while tree lean in theline of sight affects height measurement, it does not affect diametermeasurement. This is an advantage over all other dendrometers. Treelean at right angles to the line of sight, however, does not affecteither height or diameter measurement if the instrument is properlytilted and sight lines are parallel to the lean.
Use of the penta-prism caliper requires focusing simultaneously onthe halving line of the prism and on the distant tree stem. Thistends to make the halving line appear fuzzy instead of sharp, makingaccurate alignment of the two vertical images difficult. Since theinstrument is in one-to-one correspondence with the diameter beingmeasured, the baseline of the instrument must be wide enough toaccommodate the working range of tree diameters. A 36-inch diameterseems to be the practical limit for a hand-held device; use a supportstaff or tripod for anything larger.
To avoid bias from the prism being out of alignment, periodicallycheck the instrument against a target of known width.
13.13c - Short-Base Rangefinder Dendrometer. This type of device isrepresented by Barr and Stroud Dendrometers, Models FP-12, FP-15. These are precision instruments but their manufacture has beendiscontinued. They are self-contained instruments producingcoincident images of tree stems by means of counter-rotating circularwedge prisms. The coincident image retains the same relation to thetree stem whether the tree is motionless or swaying in the breeze. The instrument setting in the coincident position is used to computethe distance (range), as well as the diameter outside bark (DOB), bymeans of complex trigonometric relationships applicable to thespecific instrument. The dendrometer is equipped with 8Xmagnification, enabling precise definition of coincidence byproviding a sharp halving line. An inclinometer with micrometrichead is used for readings of elevation and depression that are
TIMBER CRUISING HANDBOOK
24
translated into vertical height. The instrument weights about 5pounds.
The Barr and Stroud is not a direct-reading device. The user recordsinstrument readings in units that must be processed by a computerprogram like STX (Grosenbaugh, 1967). Mesavage (1964, 1968) deviseda slide rule-like field calculator to convert instrument readings tostandard units.
13.2 - Height Measuring Instruments.
13.21 - Telescoping Measuring Rod. Telescoping measuring rodsconsist of a number of progressively smaller sections which telescopeinside each other. One or multiple sections may be pulled out sinceeach section is locked in place independently. Rods are available inextended lengths of 17 to 50 feet. Rods are made of sturdyfiberglass and come graduated in either feet, inches, half inches;feet, tenths foot, hundredths foot; or meters, decimeters,centimeters. The height rod is an extremely useful instrument intimber less than 50 feet tall. It is also an excellent instrument touse as a standard when checking the calibrations of other heightmeasuring instruments such as Relaskops and clinometers.
13.22 - Haga Altimeter. The Haga altimeter is a hand-held instrumentused to measure vertical heights. The instrument has six differentscales. Its scale values indicate height directly for various knownbase length distances. The first four scales (15, 20, 25, and 30)may be used with base length distances in feet, meters, or yards. The fifth scale (%) indicates height as a percent of the baselinedistance. The sixth scale (topographic) indicates height directly infeet for a base length distance of 66 feet.
13.23 - Blume-Leiss Altimeter. The Blume-Leiss altimeter is ahand-held instrument used to measure vertical heights. Theinstrument has four different scales, each of which corresponds to aspecific baseline distance of 45, 60, 90 and 120 feet. All readingsare directly in feet. Height measurement range is up to 180 feet.
13.24 - Clinometer. The clinometer is a light, compact, and ruggedhand-held instrument. Its primary function is to measure verticalangles above and below the horizontal. The instrument is availablein either topographic or percent scales. Height measurements areeasily made with this instrument. Because of its relatively lowcost, it is probably the most common height instrument used by theForest Service timber cruiser.
13.25 - Abney Level. The Abney is a light, compact hand-heldinstrument. Its primary function is to measure vertical angles aboveand below the horizontal. The instrument has both topographic orpercent scales.
13.26 - Spiegel-Relaskop. The Spiegel-Relaskop described in 13.13a,is a versatile instrument. It is used to measure tree and limbdiameters, tree height, slope and horizontal distances, and as anangle gauge in point sampling. Used as a height measuringinstrument, the Relaskop indicates height in feet for knownhorizontal distances.
TIMBER CRUISING HANDBOOK
25
13.27 - Telerelaskop and Barr and Stroud Dendrometers. TheTelerelaskop and Barr and Stroud dendrometers described in section13.13 are used for making height measurements.
13.28 - Laser Measuring Devices. Laser measuring devices are being developed to measure heights and other characteristics of the treesas needed for timber cruising. Maintain awareness of the potentialand limitations of this equipment for improving accuracy and reducingcosts. 14 - MEASURING THE TREE. Measuring individual tree variables in aconsistent and prescribed manner is essential. All volume estimationprocedures require some or all of the following measurements:
1. Diameter breast height (DBH).
2. Reference height (measured to a specific diameter insidebark (DIB) or diameter outside bark (DOB)).
3. Total height.
4. Stump height.
5. Tree form class.
14.1 - Measuring Tree Diameter.
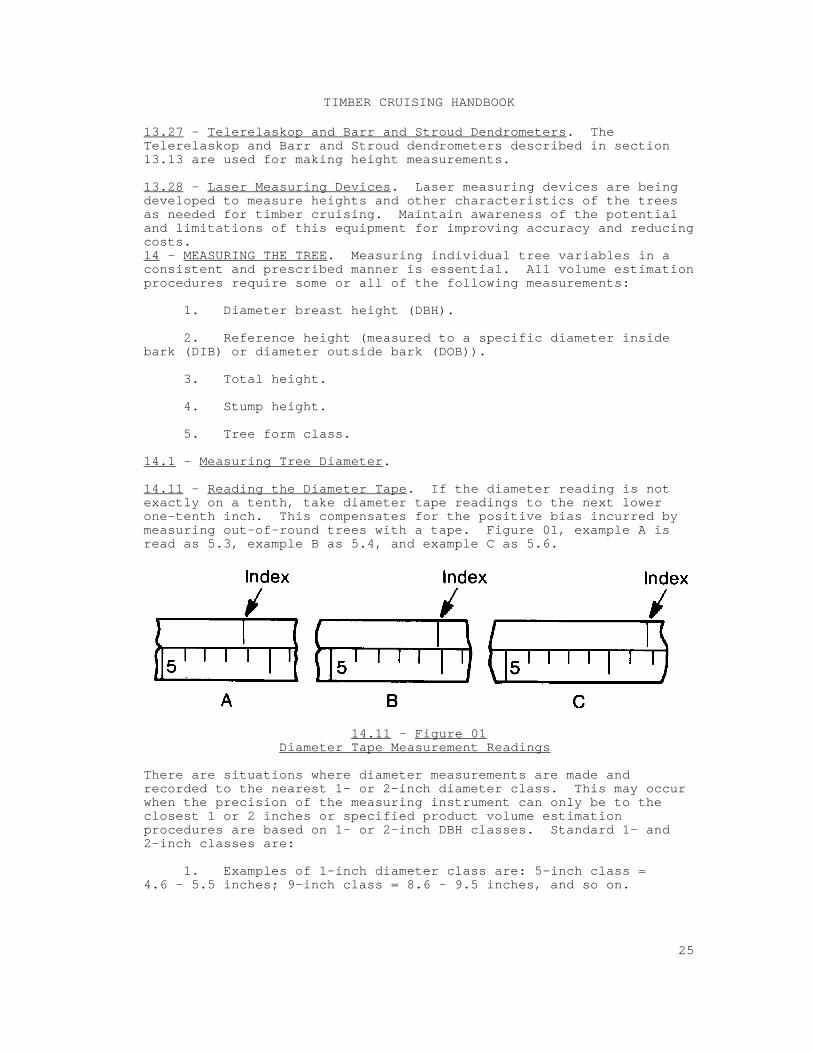
14.11 - Reading the Diameter Tape. If the diameter reading is notexactly on a tenth, take diameter tape readings to the next lowerone-tenth inch. This compensates for the positive bias incurred bymeasuring out-of-round trees with a tape. Figure 01, example A isread as 5.3, example B as 5.4, and example C as 5.6.
14.11 - Figure 01Diameter Tape Measurement Readings
There are situations where diameter measurements are made andrecorded to the nearest 1- or 2-inch diameter class. This may occurwhen the precision of the measuring instrument can only be to theclosest 1 or 2 inches or specified product volume estimationprocedures are based on 1- or 2-inch DBH classes. Standard 1- and2-inch classes are:
1. Examples of 1-inch diameter class are: 5-inch class =4.6 - 5.5 inches; 9-inch class = 8.6 - 9.5 inches, and so on.
TIMBER CRUISING HANDBOOK
26
2. Examples of 2-inch diameter class are: 12-inch class = 11.0- 12.9 inches; 14-inch class = 13.0 - 14.9 inches, and so on.
There are situations where diameter measurements are not rounded. This situation occurs when absolute measurements are specified. Timber sale contract minimum tree DBH and minimum piecespecifications are absolute.
Example:
1. Minimum tree DBH specification = 7.0 inches. This means6.95 would not be rounded to 7.0 inches.
2. Minimum piece specification = 7.6 inches DIB. This means7.55 would not be rounded up to 7.6 inches.
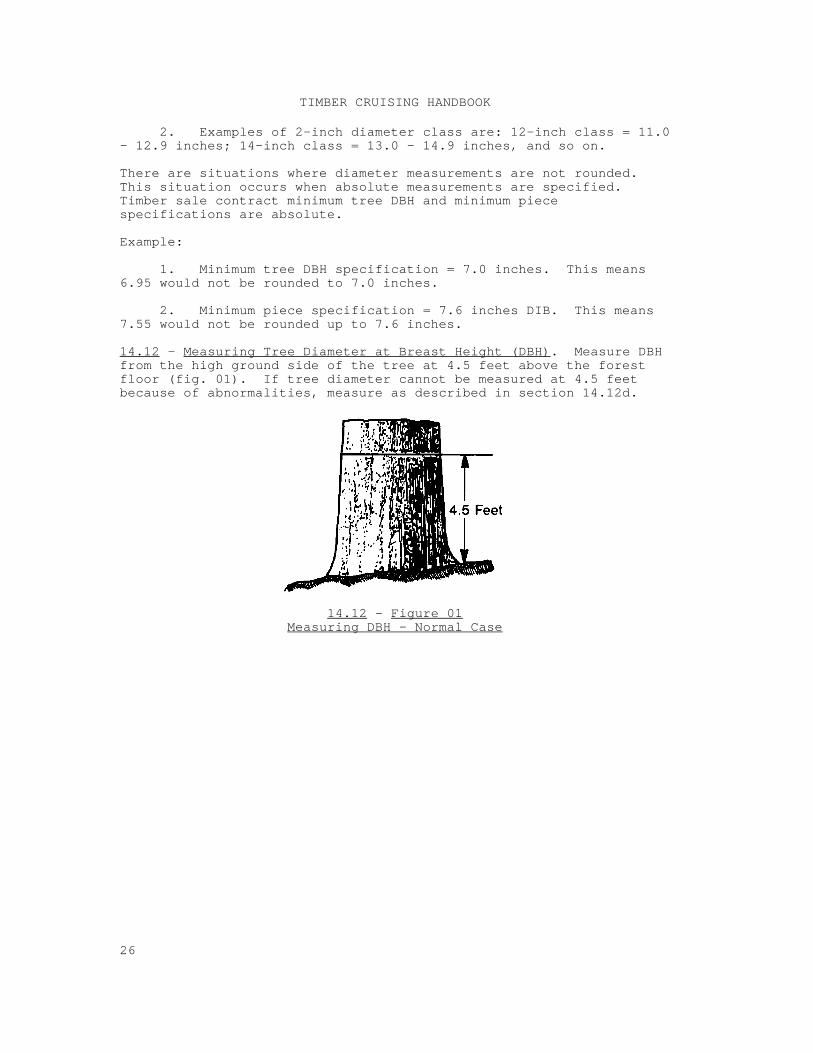
14.12 - Measuring Tree Diameter at Breast Height (DBH). Measure DBHfrom the high ground side of the tree at 4.5 feet above the forestfloor (fig. 01). If tree diameter cannot be measured at 4.5 feetbecause of abnormalities, measure as described in section 14.12d.
14.12 - Figure 01Measuring DBH - Normal Case
TIMBER CRUISING HANDBOOK
27
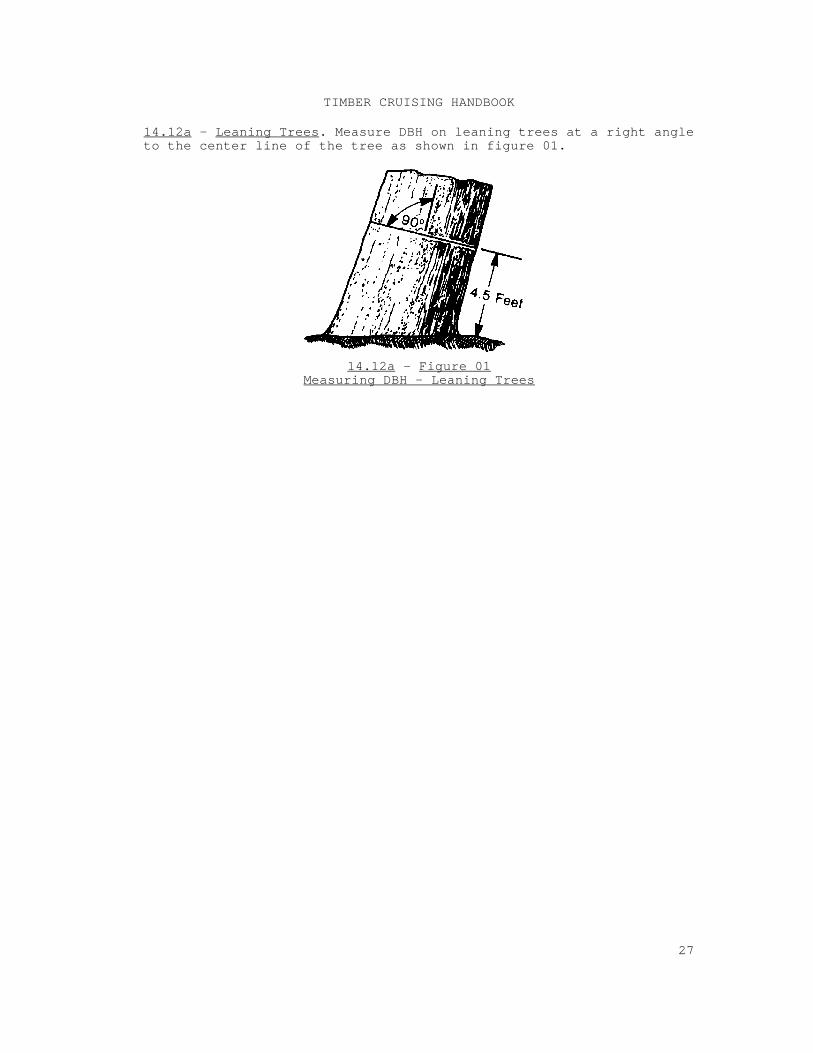
14.12a - Leaning Trees. Measure DBH on leaning trees at a right angleto the center line of the tree as shown in figure 01.
14.12a - Figure 01Measuring DBH - Leaning Trees
TIMBER CRUISING HANDBOOK
28
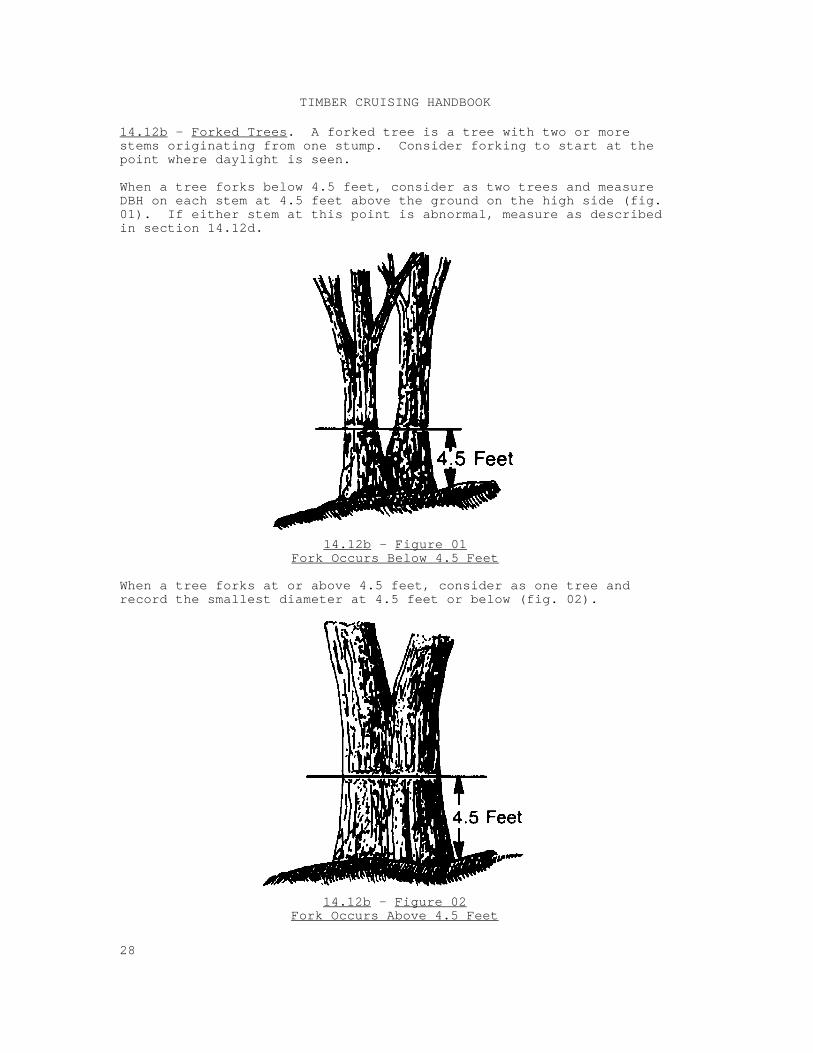
14.12b - Forked Trees. A forked tree is a tree with two or morestems originating from one stump. Consider forking to start at thepoint where daylight is seen.
When a tree forks below 4.5 feet, consider as two trees and measureDBH on each stem at 4.5 feet above the ground on the high side (fig.01). If either stem at this point is abnormal, measure as describedin section 14.12d.
14.12b - Figure 01Fork Occurs Below 4.5 Feet
When a tree forks at or above 4.5 feet, consider as one tree andrecord the smallest diameter at 4.5 feet or below (fig. 02).
14.12b - Figure 02Fork Occurs Above 4.5 Feet
TIMBER CRUISING HANDBOOK
29
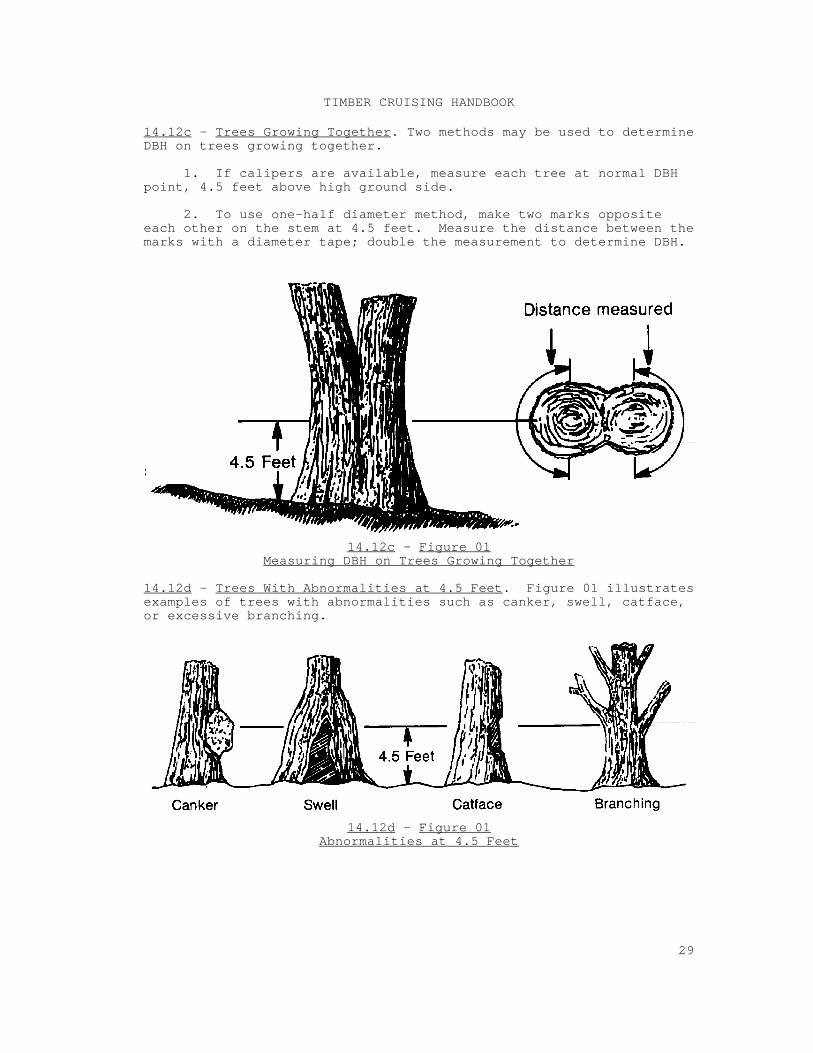
14.12c - Trees Growing Together. Two methods may be used to determineDBH on trees growing together.
1. If calipers are available, measure each tree at normal DBHpoint, 4.5 feet above high ground side.
2. To use one-half diameter method, make two marks oppositeeach other on the stem at 4.5 feet. Measure the distance between themarks with a diameter tape; double the measurement to determine DBH.
14.12c - Figure 01Measuring DBH on Trees Growing Together
14.12d - Trees With Abnormalities at 4.5 Feet. Figure 01 illustratesexamples of trees with abnormalities such as canker, swell, catface,or excessive branching.
14.12d - Figure 01Abnormalities at 4.5 Feet
TIMBER CRUISING HANDBOOK
30
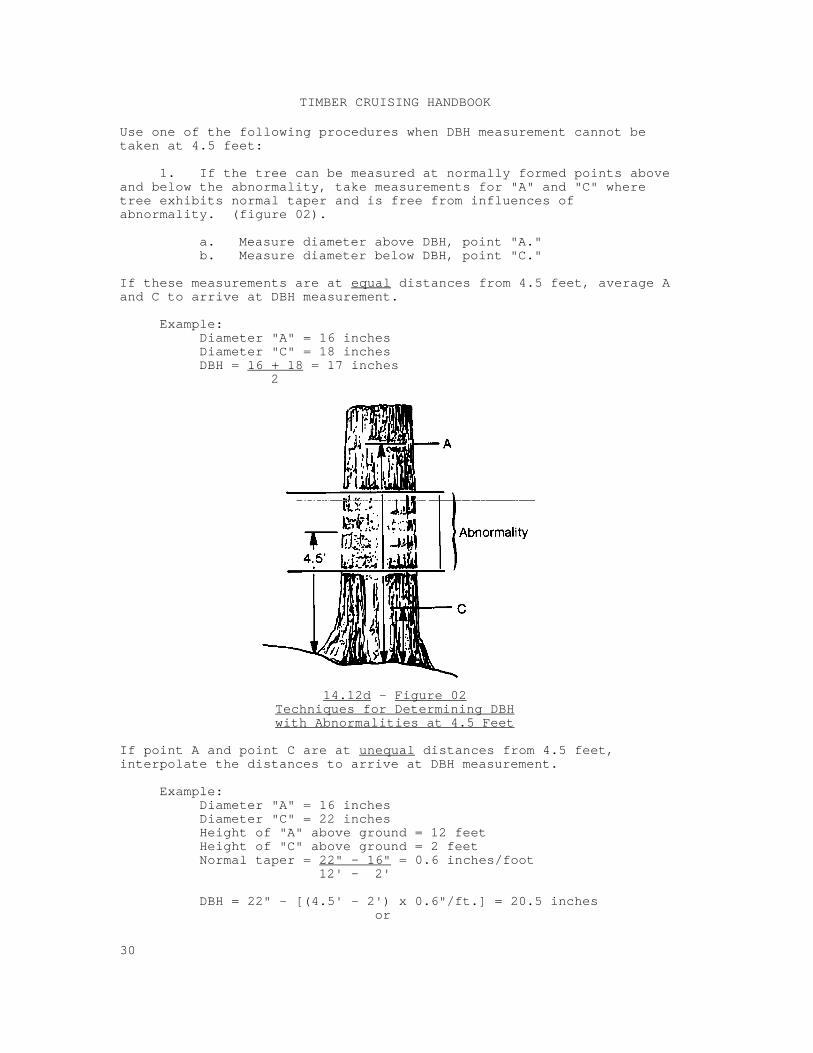
Use one of the following procedures when DBH measurement cannot betaken at 4.5 feet:
1. If the tree can be measured at normally formed points aboveand below the abnormality, take measurements for "A" and "C" wheretree exhibits normal taper and is free from influences ofabnormality. (figure 02).
a. Measure diameter above DBH, point "A."b. Measure diameter below DBH, point "C."
If these measurements are at equal distances from 4.5 feet, average Aand C to arrive at DBH measurement.
Example:Diameter "A" = 16 inchesDiameter "C" = 18 inchesDBH = 16 + 18 = 17 inches
2
14.12d - Figure 02Techniques for Determining DBHwith Abnormalities at 4.5 Feet
If point A and point C are at unequal distances from 4.5 feet,interpolate the distances to arrive at DBH measurement.
Example:Diameter "A" = 16 inchesDiameter "C" = 22 inchesHeight of "A" above ground = 12 feetHeight of "C" above ground = 2 feetNormal taper = 22" - 16" = 0.6 inches/foot
12' - 2'
DBH = 22" - [(4.5' - 2') x 0.6"/ft.] = 20.5 inches or
TIMBER CRUISING HANDBOOK
31
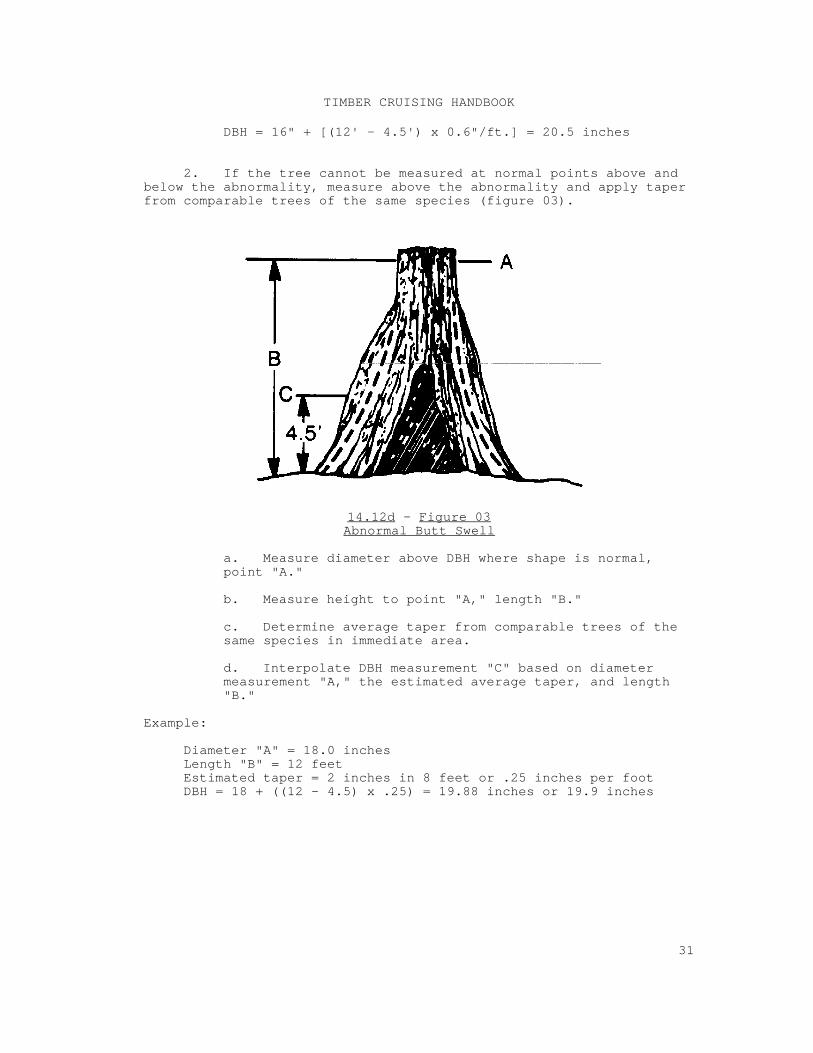
DBH = 16" + [(12' - 4.5') x 0.6"/ft.] = 20.5 inches
2. If the tree cannot be measured at normal points above andbelow the abnormality, measure above the abnormality and apply taperfrom comparable trees of the same species (figure 03).
14.12d - Figure 03Abnormal Butt Swell
a. Measure diameter above DBH where shape is normal,point "A."
b. Measure height to point "A," length "B."
c. Determine average taper from comparable trees of thesame species in immediate area.
d. Interpolate DBH measurement "C" based on diametermeasurement "A," the estimated average taper, and length"B."
Example:
Diameter "A" = 18.0 inchesLength "B" = 12 feetEstimated taper = 2 inches in 8 feet or .25 inches per footDBH = 18 + ((12 - 4.5) x .25) = 19.88 inches or 19.9 inches
TIMBER CRUISING HANDBOOK
32
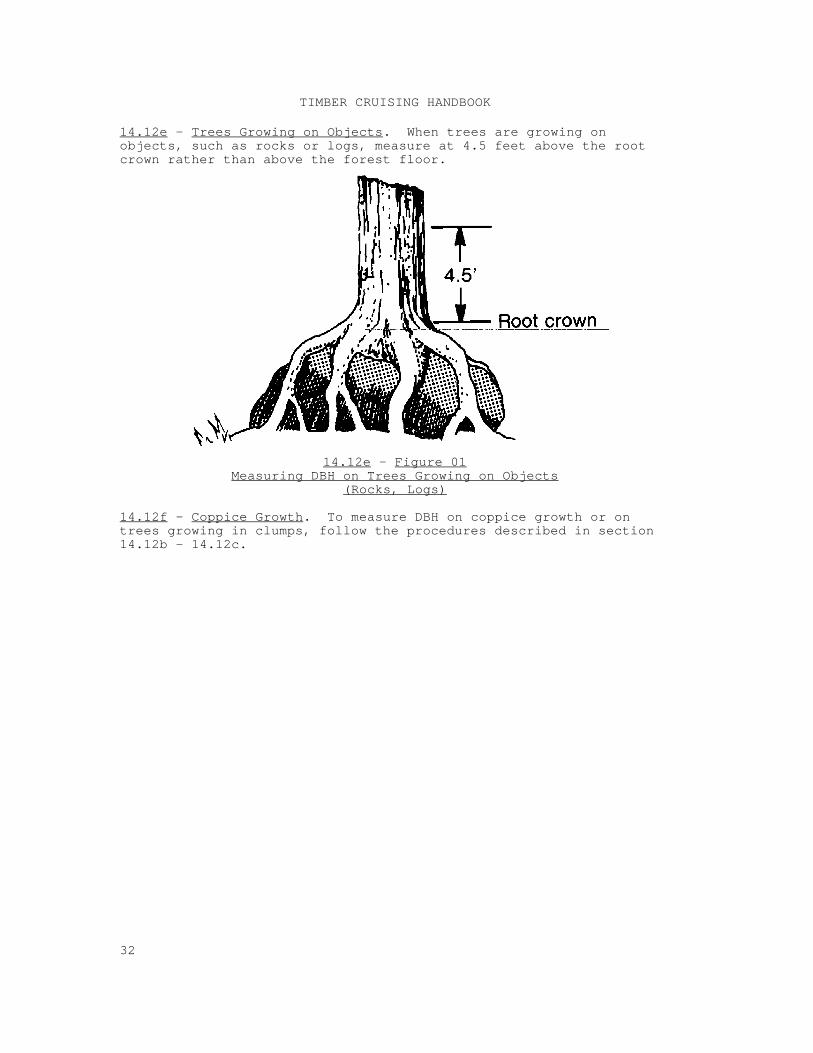
14.12e - Trees Growing on Objects. When trees are growing onobjects, such as rocks or logs, measure at 4.5 feet above the rootcrown rather than above the forest floor.
14.12e - Figure 01Measuring DBH on Trees Growing on Objects
(Rocks, Logs)
14.12f - Coppice Growth. To measure DBH on coppice growth or ontrees growing in clumps, follow the procedures described in section14.12b - 14.12c.
TIMBER CRUISING HANDBOOK
33
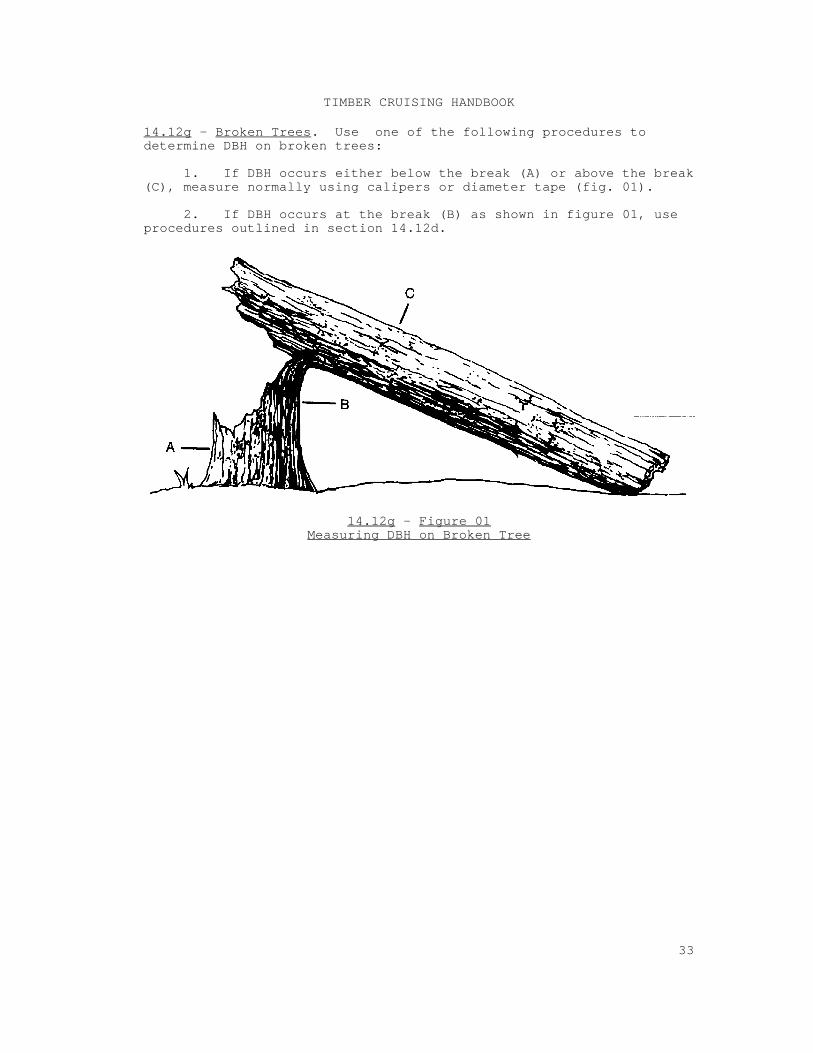
14.12g - Broken Trees. Use one of the following procedures todetermine DBH on broken trees:
1. If DBH occurs either below the break (A) or above the break(C), measure normally using calipers or diameter tape (fig. 01).
2. If DBH occurs at the break (B) as shown in figure 01, useprocedures outlined in section 14.12d.
14.12g - Figure 01Measuring DBH on Broken Tree
TIMBER CRUISING HANDBOOK
34
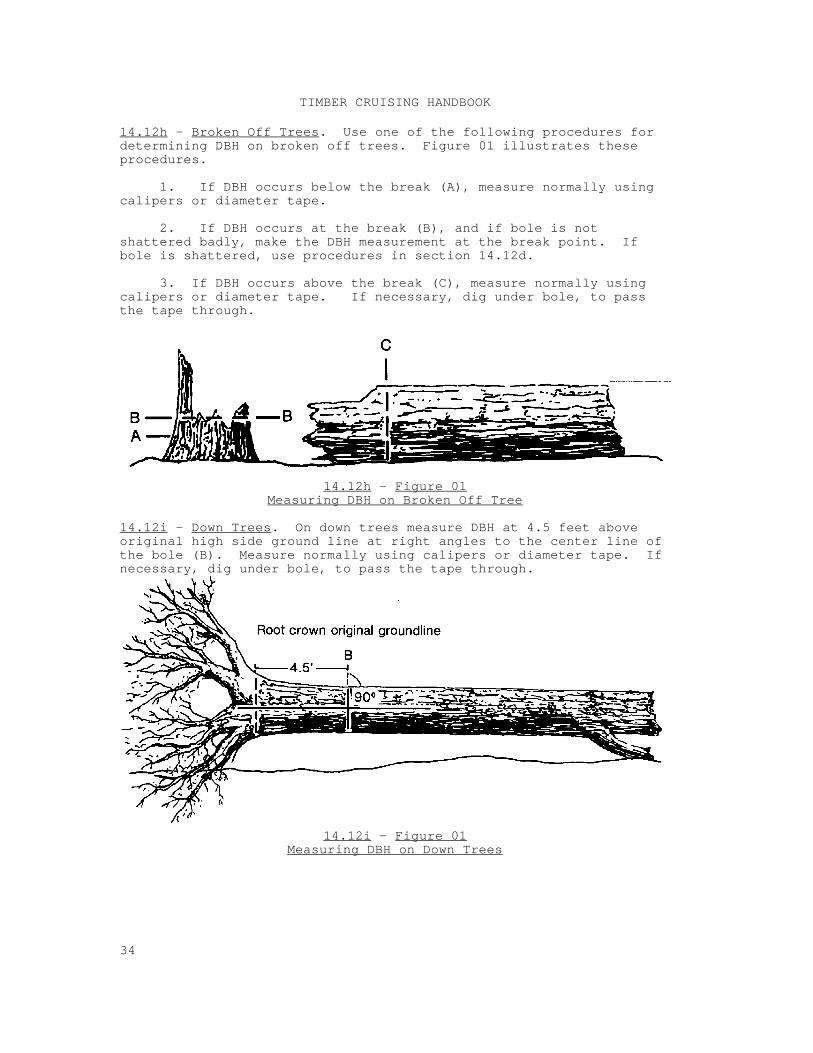
14.12h - Broken Off Trees. Use one of the following procedures fordetermining DBH on broken off trees. Figure 01 illustrates theseprocedures.
1. If DBH occurs below the break (A), measure normally usingcalipers or diameter tape.
2. If DBH occurs at the break (B), and if bole is notshattered badly, make the DBH measurement at the break point. Ifbole is shattered, use procedures in section 14.12d.
3. If DBH occurs above the break (C), measure normally usingcalipers or diameter tape. If necessary, dig under bole, to passthe tape through.
14.12h - Figure 01Measuring DBH on Broken Off Tree
14.12i - Down Trees. On down trees measure DBH at 4.5 feet aboveoriginal high side ground line at right angles to the center line ofthe bole (B). Measure normally using calipers or diameter tape. Ifnecessary, dig under bole, to pass the tape through.
14.12i - Figure 01Measuring DBH on Down Trees
TIMBER CRUISING HANDBOOK
35
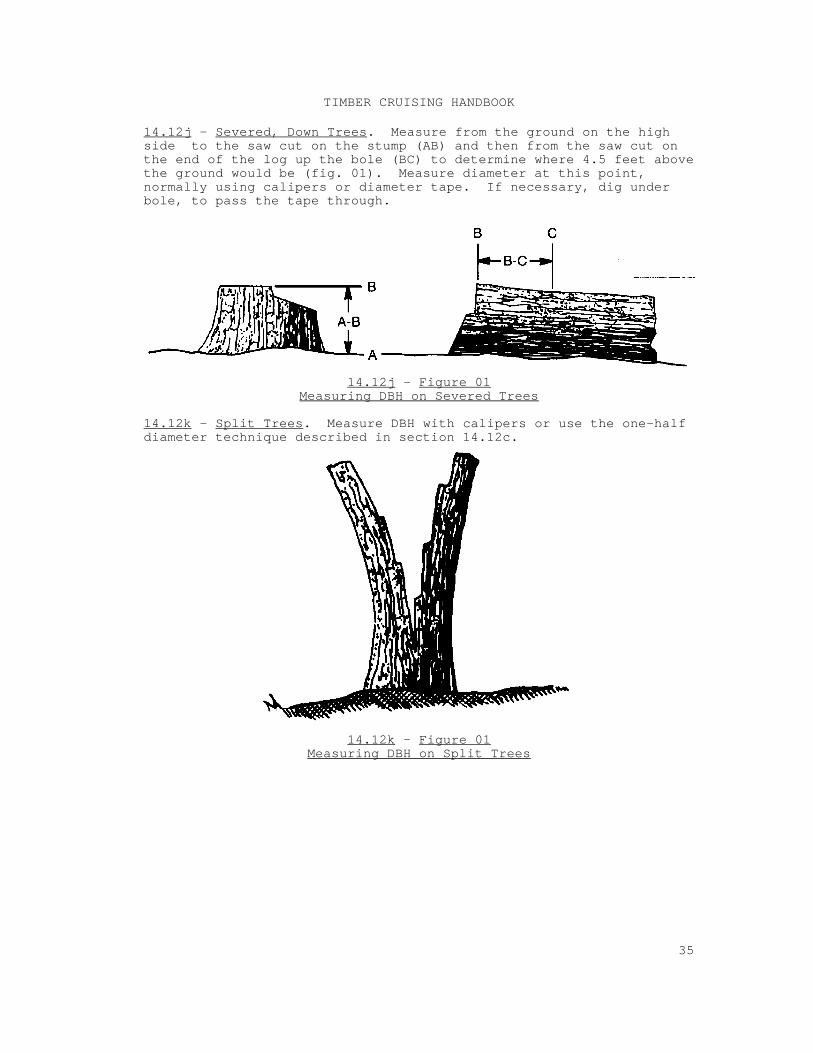
14.12j - Severed, Down Trees. Measure from the ground on the highside to the saw cut on the stump (AB) and then from the saw cut onthe end of the log up the bole (BC) to determine where 4.5 feet abovethe ground would be (fig. 01). Measure diameter at this point,normally using calipers or diameter tape. If necessary, dig underbole, to pass the tape through.
14.12j - Figure 01Measuring DBH on Severed Trees
14.12k - Split Trees. Measure DBH with calipers or use the one-halfdiameter technique described in section 14.12c.
14.12k - Figure 01Measuring DBH on Split Trees
TIMBER CRUISING HANDBOOK
36
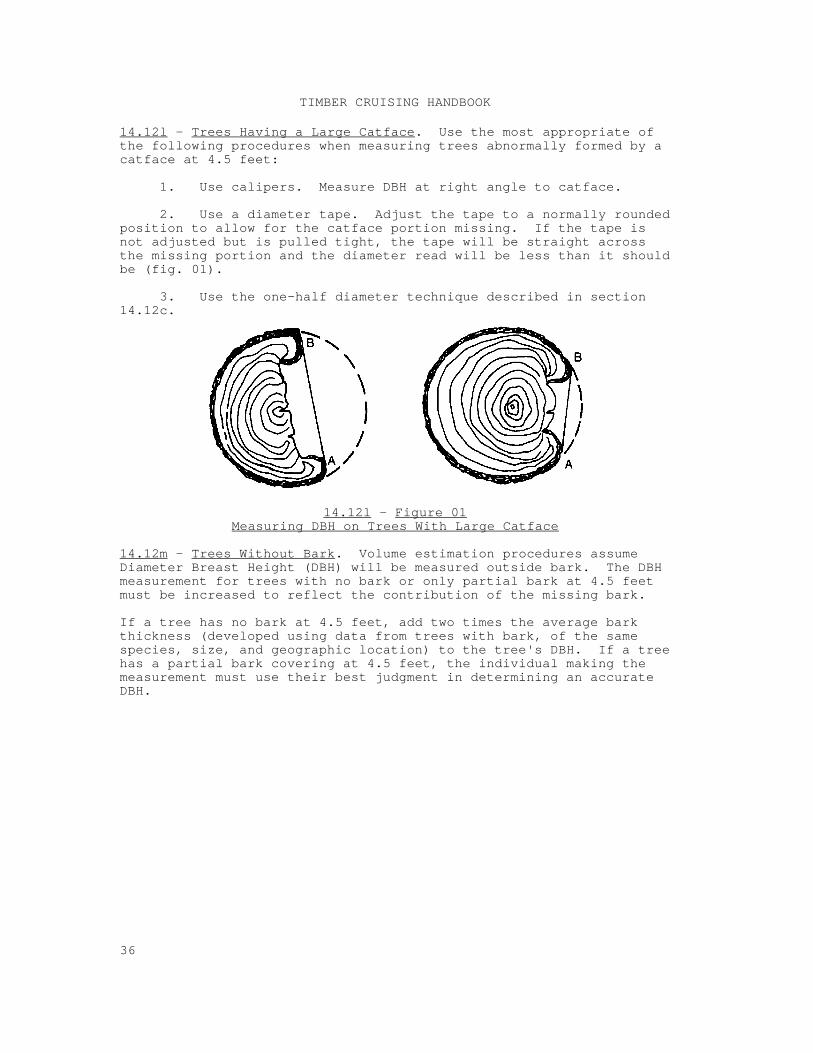
14.12l - Trees Having a Large Catface. Use the most appropriate ofthe following procedures when measuring trees abnormally formed by acatface at 4.5 feet:
1. Use calipers. Measure DBH at right angle to catface.
2. Use a diameter tape. Adjust the tape to a normally roundedposition to allow for the catface portion missing. If the tape isnot adjusted but is pulled tight, the tape will be straight acrossthe missing portion and the diameter read will be less than it shouldbe (fig. 01).
3. Use the one-half diameter technique described in section14.12c.
14.12l - Figure 01Measuring DBH on Trees With Large Catface
14.12m - Trees Without Bark. Volume estimation procedures assumeDiameter Breast Height (DBH) will be measured outside bark. The DBHmeasurement for trees with no bark or only partial bark at 4.5 feetmust be increased to reflect the contribution of the missing bark.
If a tree has no bark at 4.5 feet, add two times the average barkthickness (developed using data from trees with bark, of the samespecies, size, and geographic location) to the tree's DBH. If a treehas a partial bark covering at 4.5 feet, the individual making themeasurement must use their best judgment in determining an accurateDBH.
TIMBER CRUISING HANDBOOK
37
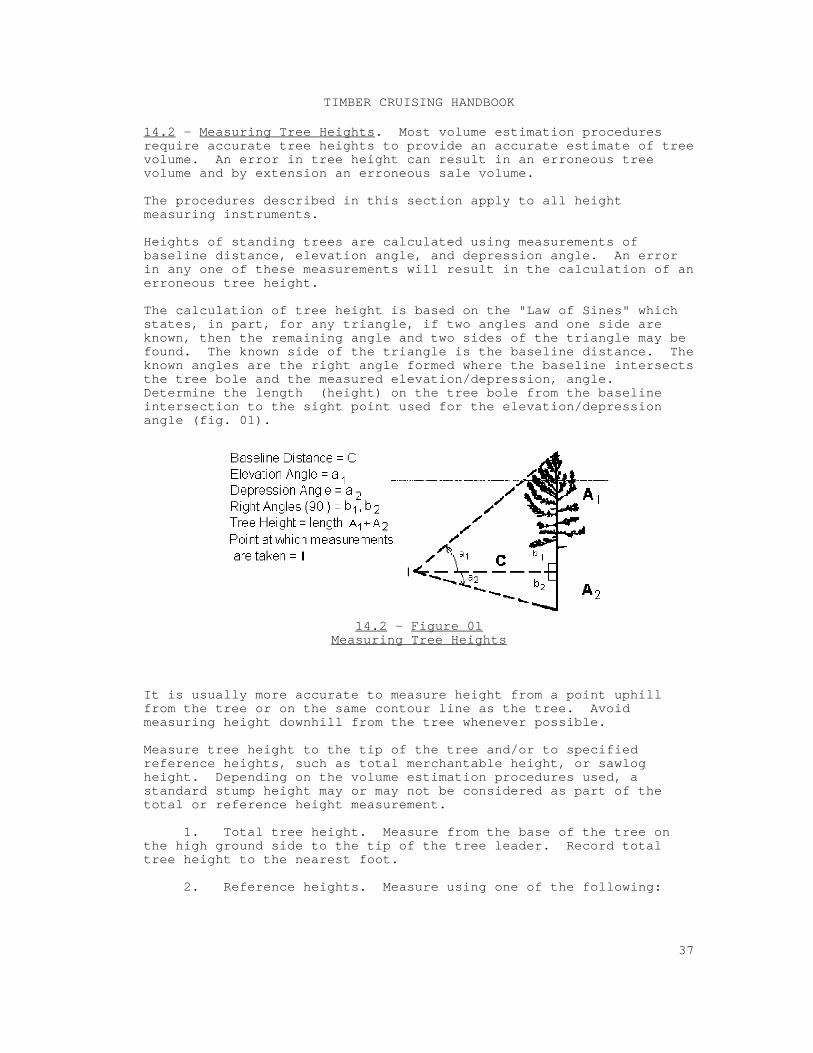
14.2 - Measuring Tree Heights. Most volume estimation proceduresrequire accurate tree heights to provide an accurate estimate of treevolume. An error in tree height can result in an erroneous treevolume and by extension an erroneous sale volume.
The procedures described in this section apply to all heightmeasuring instruments.
Heights of standing trees are calculated using measurements ofbaseline distance, elevation angle, and depression angle. An errorin any one of these measurements will result in the calculation of anerroneous tree height.
The calculation of tree height is based on the "Law of Sines" whichstates, in part, for any triangle, if two angles and one side areknown, then the remaining angle and two sides of the triangle may befound. The known side of the triangle is the baseline distance. Theknown angles are the right angle formed where the baseline intersectsthe tree bole and the measured elevation/depression, angle. Determine the length (height) on the tree bole from the baselineintersection to the sight point used for the elevation/depressionangle (fig. 01).
14.2 - Figure 01Measuring Tree Heights
It is usually more accurate to measure height from a point uphillfrom the tree or on the same contour line as the tree. Avoidmeasuring height downhill from the tree whenever possible.
Measure tree height to the tip of the tree and/or to specifiedreference heights, such as total merchantable height, or sawlogheight. Depending on the volume estimation procedures used, astandard stump height may or may not be considered as part of thetotal or reference height measurement.
1. Total tree height. Measure from the base of the tree onthe high ground side to the tip of the tree leader. Record totaltree height to the nearest foot.
2. Reference heights. Measure using one of the following:
TIMBER CRUISING HANDBOOK
38
a. To a specified diameter. Measure from the base of thetree on the high ground side to a specific referencediameter (minimum DIB or DOB).
b. To a merchantability limit. Measure from the base ofthe tree on the high ground side to a point above which thebole is too small or defective to meet the specifiedproduct utilization standards.
14.21 - Baseline Distance. Baseline distance is the horizontaldistance from the face of the tree to a manufacturer's specifiedpoint on the height (angle) measuring instruments. Many instrumentsused to measure tree height are calculated for specific baselinedistances.
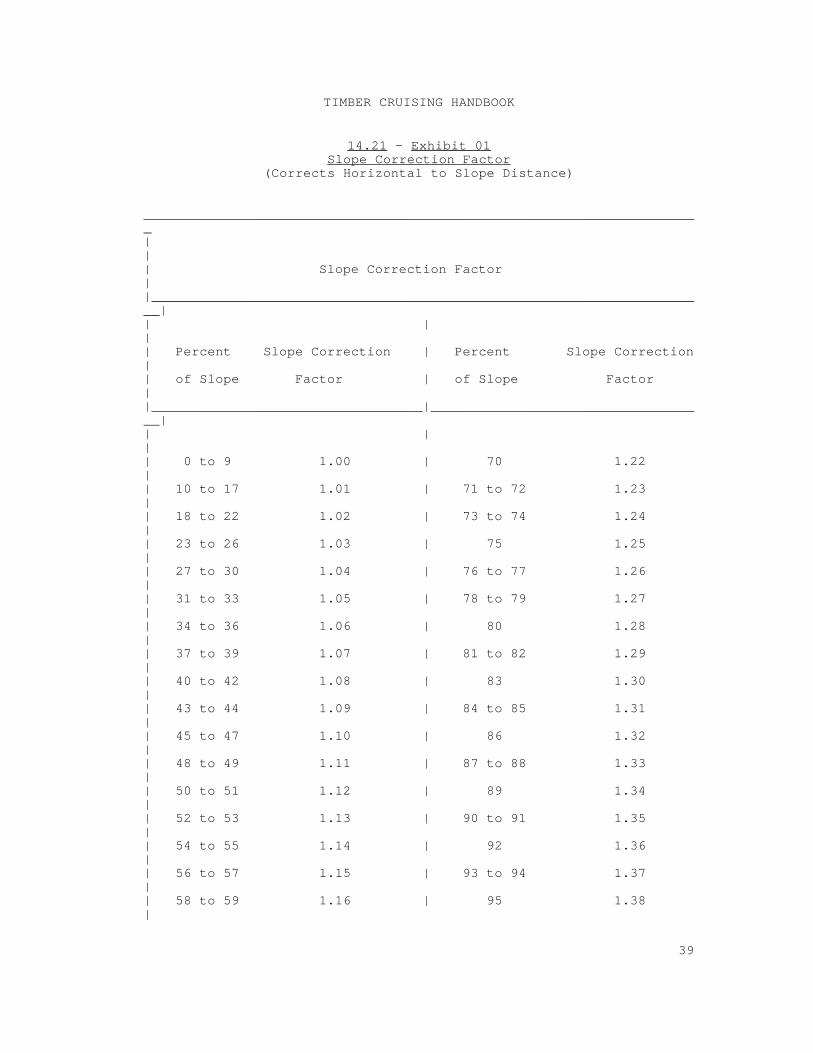
When using a tape to measure baseline distance, attach the tape at aconvenient height on the tree and back off the required distance,pulling the tape tight. With a clinometer, find the percent slope ofthe tape going back to the tree. If the slope is over 10 percent, anadjustment to the measured slope distance is necessary to prevent abias in the height calculation. Calculate the slope distance bymultiplying the desired baseline distance by the slope correctionfactor (ex. 01). Back off the slope distance and measure the treeheight from this distance, the desired baseline distance.
Example:Initial measured base distance (desired horizontal distance) = 66 feetPercent slope to tree = 25Indicated slope distance for 66 feet = 68 feet (66 x 1.03)
This adjustment is necessary to ensure the desired horizontaldistance is maintained.
TIMBER CRUISING HANDBOOK
39
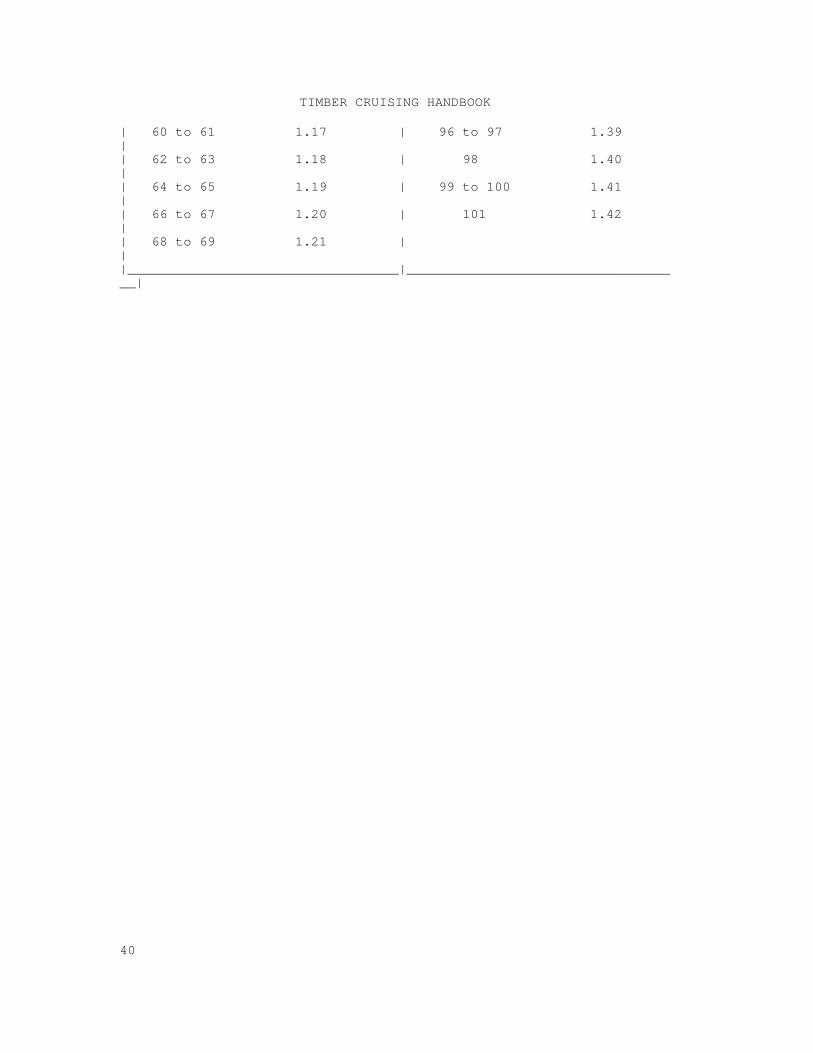
14.21 - Exhibit 01Slope Correction Factor
(Corrects Horizontal to Slope Distance)
______________________________________________________________________| || Slope Correction Factor ||______________________________________________________________________|| | || Percent Slope Correction | Percent Slope Correction || of Slope Factor | of Slope Factor ||__________________________________|___________________________________|| | || 0 to 9 1.00 | 70 1.22 || 10 to 17 1.01 | 71 to 72 1.23 || 18 to 22 1.02 | 73 to 74 1.24 || 23 to 26 1.03 | 75 1.25 || 27 to 30 1.04 | 76 to 77 1.26 || 31 to 33 1.05 | 78 to 79 1.27 || 34 to 36 1.06 | 80 1.28 || 37 to 39 1.07 | 81 to 82 1.29 || 40 to 42 1.08 | 83 1.30 || 43 to 44 1.09 | 84 to 85 1.31 || 45 to 47 1.10 | 86 1.32 || 48 to 49 1.11 | 87 to 88 1.33 || 50 to 51 1.12 | 89 1.34 || 52 to 53 1.13 | 90 to 91 1.35 || 54 to 55 1.14 | 92 1.36 || 56 to 57 1.15 | 93 to 94 1.37 || 58 to 59 1.16 | 95 1.38 |
TIMBER CRUISING HANDBOOK
40
| 60 to 61 1.17 | 96 to 97 1.39 || 62 to 63 1.18 | 98 1.40 || 64 to 65 1.19 | 99 to 100 1.41 || 66 to 67 1.20 | 101 1.42 || 68 to 69 1.21 | ||__________________________________|___________________________________|
TIMBER CRUISING HANDBOOK
41
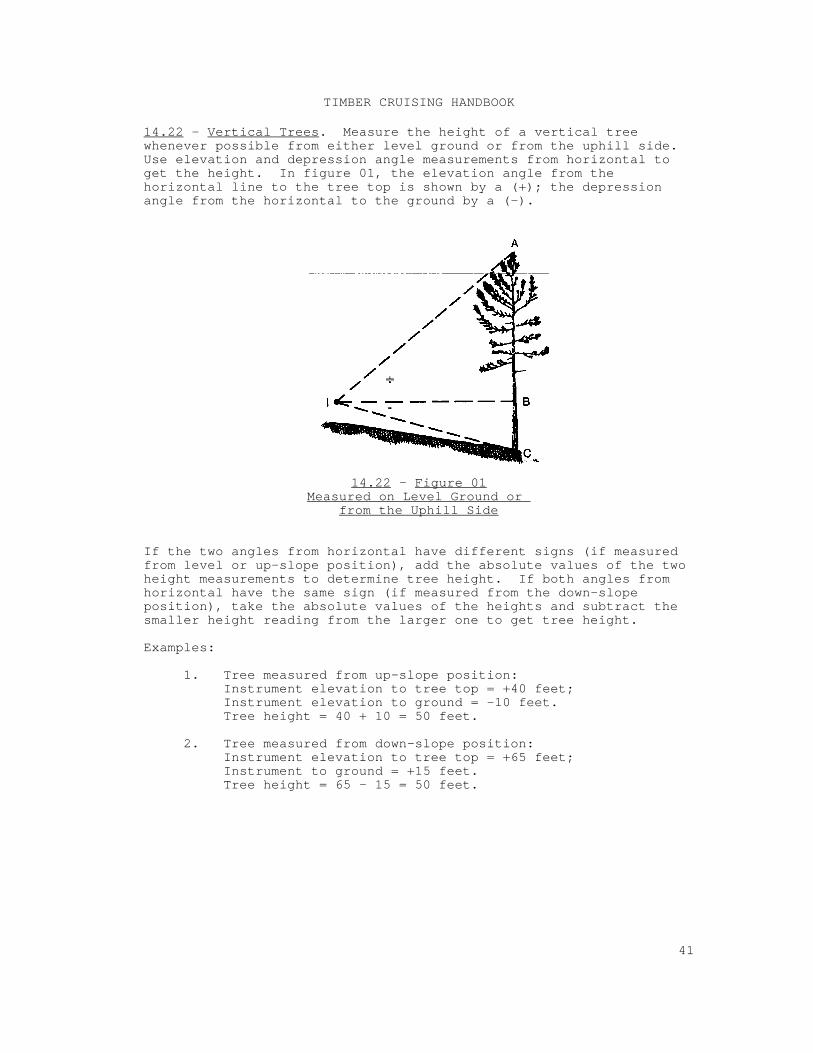
14.22 - Vertical Trees. Measure the height of a vertical treewhenever possible from either level ground or from the uphill side. Use elevation and depression angle measurements from horizontal toget the height. In figure 01, the elevation angle from thehorizontal line to the tree top is shown by a (+); the depressionangle from the horizontal to the ground by a (-).
14.22 - Figure 01Measured on Level Ground or
from the Uphill Side
If the two angles from horizontal have different signs (if measuredfrom level or up-slope position), add the absolute values of the twoheight measurements to determine tree height. If both angles fromhorizontal have the same sign (if measured from the down-slopeposition), take the absolute values of the heights and subtract thesmaller height reading from the larger one to get tree height.
Examples:
1. Tree measured from up-slope position:Instrument elevation to tree top = +40 feet;Instrument elevation to ground = -10 feet.Tree height = 40 + 10 = 50 feet.
2. Tree measured from down-slope position:Instrument elevation to tree top = +65 feet;Instrument to ground = +15 feet.Tree height = 65 - 15 = 50 feet.
Tree Height (bole length) AB2 BC2
TIMBER CRUISING HANDBOOK
42
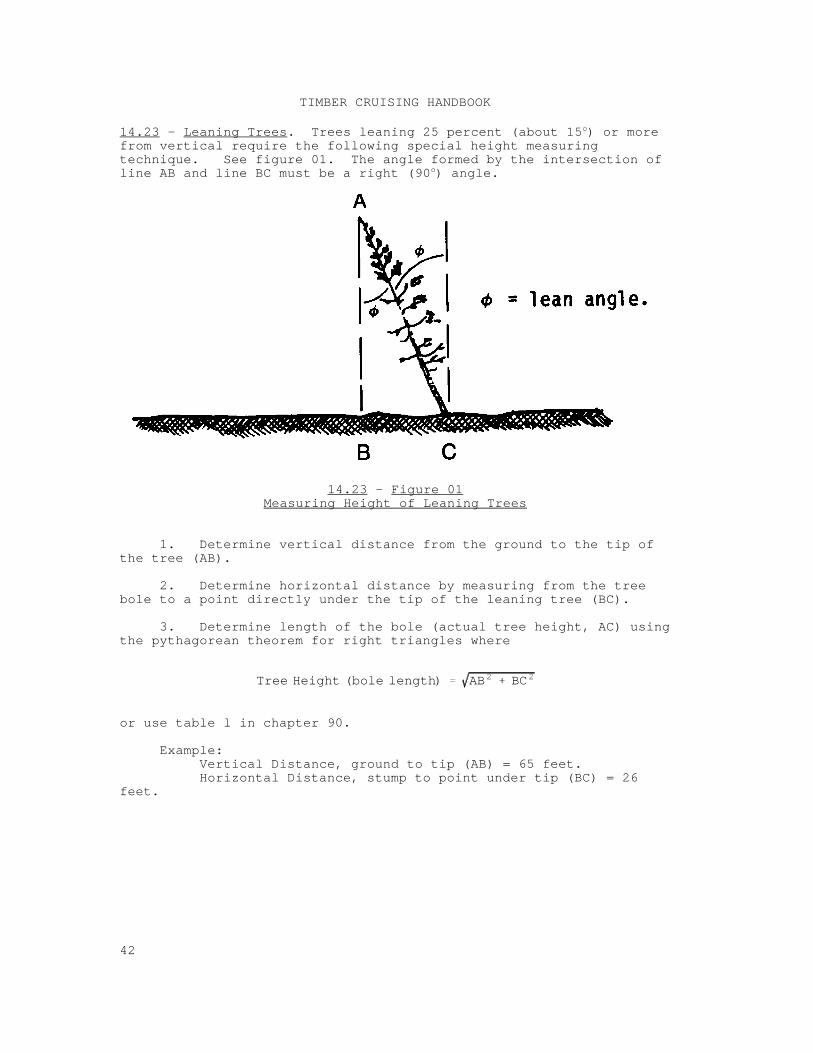
14.23 - Leaning Trees. Trees leaning 25 percent (about 15 ) or moreo
from vertical require the following special height measuringtechnique. See figure 01. The angle formed by the intersection ofline AB and line BC must be a right (90 ) angle.o
14.23 - Figure 01Measuring Height of Leaning Trees
1. Determine vertical distance from the ground to the tip ofthe tree (AB).
2. Determine horizontal distance by measuring from the treebole to a point directly under the tip of the leaning tree (BC).
3. Determine length of the bole (actual tree height, AC) usingthe pythagorean theorem for right triangles where
or use table l in chapter 90.
Example:Vertical Distance, ground to tip (AB) = 65 feet.Horizontal Distance, stump to point under tip (BC) = 26
feet.
Tree Height AB2 BC2
652 262
4901
70 feet
TIMBER CRUISING HANDBOOK
43
Alternatively, use the angle-of-lean method:
1. Measure Vertical Distance (AB)
2. Determine tree lean angle ( in percent or degrees). Thelean angle can be measured in degrees rather than percent, but then atrigonometric table is necessary to find the secant of the measuredangle.
3. Multiply Vertical Distance by slope correction factor (sec.14.21) to obtain bole length or the leaning tree height.
Example:Lean percent = 40, Factor = 1.08(Lean angle = 22 Secant = 1.08)o
Vertical Distance = 65 feetLeaning tree height = 65 x 1.08 = 70 feet.
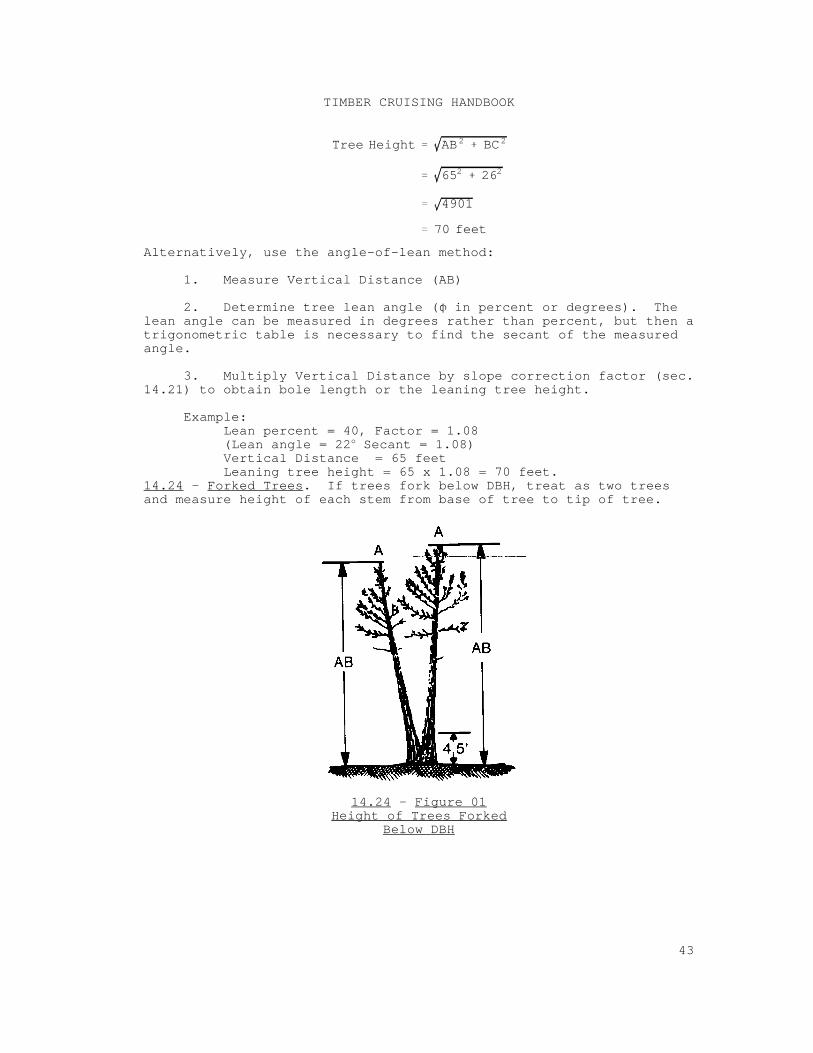
14.24 - Forked Trees. If trees fork below DBH, treat as two treesand measure height of each stem from base of tree to tip of tree.
14.24 - Figure 01Height of Trees Forked
Below DBH
TIMBER CRUISING HANDBOOK
44
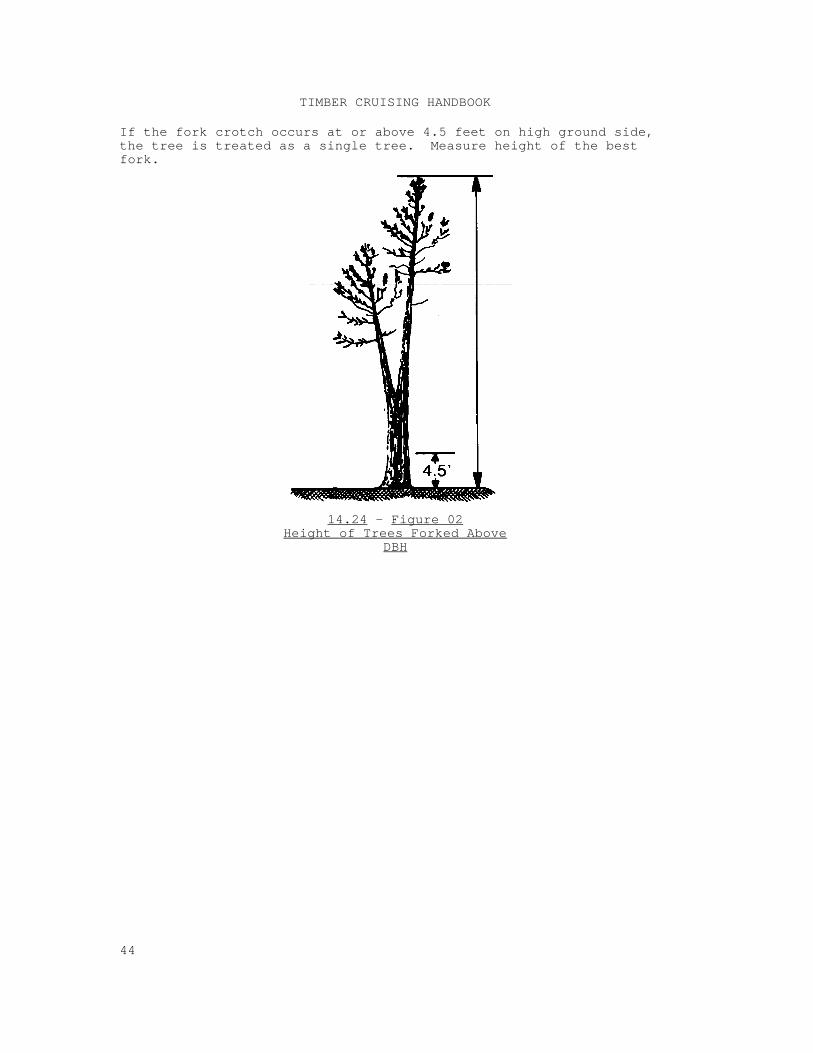
If the fork crotch occurs at or above 4.5 feet on high ground side,the tree is treated as a single tree. Measure height of the bestfork.
14.24 - Figure 02Height of Trees Forked Above
DBH
TIMBER CRUISING HANDBOOK
45
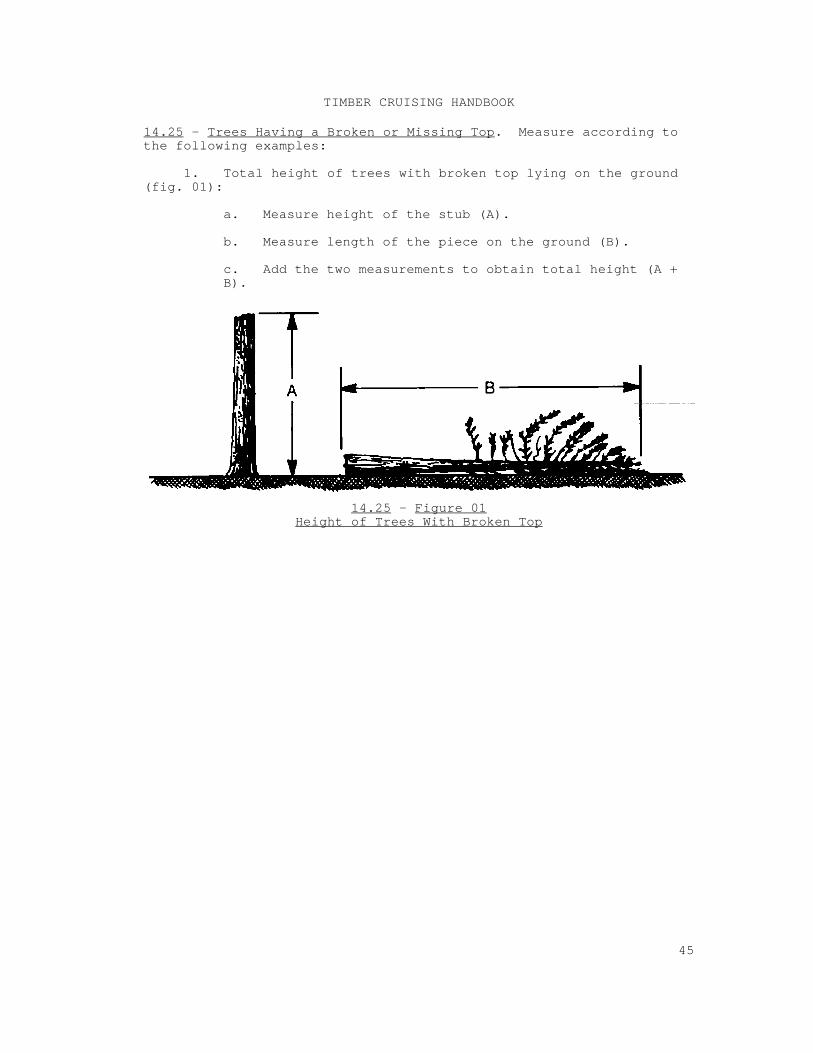
14.25 - Trees Having a Broken or Missing Top. Measure according tothe following examples:
1. Total height of trees with broken top lying on the ground(fig. 01):
a. Measure height of the stub (A).
b. Measure length of the piece on the ground (B).
c. Add the two measurements to obtain total height (A +B).
14.25 - Figure 01Height of Trees With Broken Top
Height B A 2 C 2
TIMBER CRUISING HANDBOOK
46
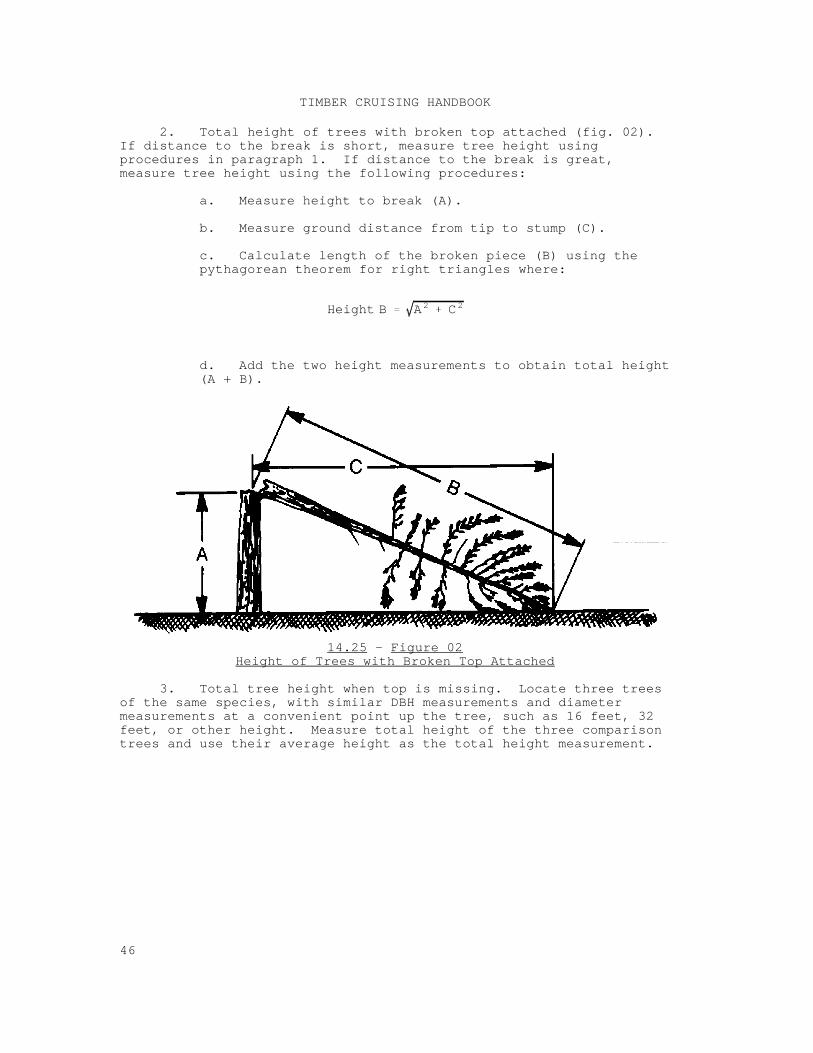
2. Total height of trees with broken top attached (fig. 02). If distance to the break is short, measure tree height usingprocedures in paragraph 1. If distance to the break is great,measure tree height using the following procedures:
a. Measure height to break (A).
b. Measure ground distance from tip to stump (C).
c. Calculate length of the broken piece (B) using thepythagorean theorem for right triangles where:
d. Add the two height measurements to obtain total height(A + B).
14.25 - Figure 02Height of Trees with Broken Top Attached
3. Total tree height when top is missing. Locate three treesof the same species, with similar DBH measurements and diametermeasurements at a convenient point up the tree, such as 16 feet, 32feet, or other height. Measure total height of the three comparisontrees and use their average height as the total height measurement.
Girard form classDIB at top of butt log
DBH× 100
TIMBER CRUISING HANDBOOK
47
14.26 - When Measurement Point is Hidden. There are many instanceswhere height to be measured such as merchantable height cannot bemeasured directly. Dense foliage or foliage from an adjacent treemay obscure the measurement point. In these instances, obtain anaverage height from three comparison trees.
Example of comparison tree method for merchantable height (referenceheight):
Tree 1 Tree 2 Tree 3 Average Tree beingMeasuredTotal height 100 ft. 110 ft. 105 ft. 105 108Merch. height 81 ft. 87 ft. 84 ft. 84 to beestimatedDBH 16 18 18 17.33 17
Average height ratio = 84 = .80
105
Reference height (tree being measured) = 108 feet x 0.80 = 86.4 = 86feet.
14.3 - Tree Form Class. A measure commonly used as an independentvariable along with DBH and height is Girard form class.
Specify the length of the butt log used for this purpose since formclass may be expressed for either a 16-foot or 32-foot butt log. (Normally the DIB of the butt log is recorded at 17 or 33 feet abovethe ground to allow for a 1-foot stump.)
TIMBER CRUISING HANDBOOK
48
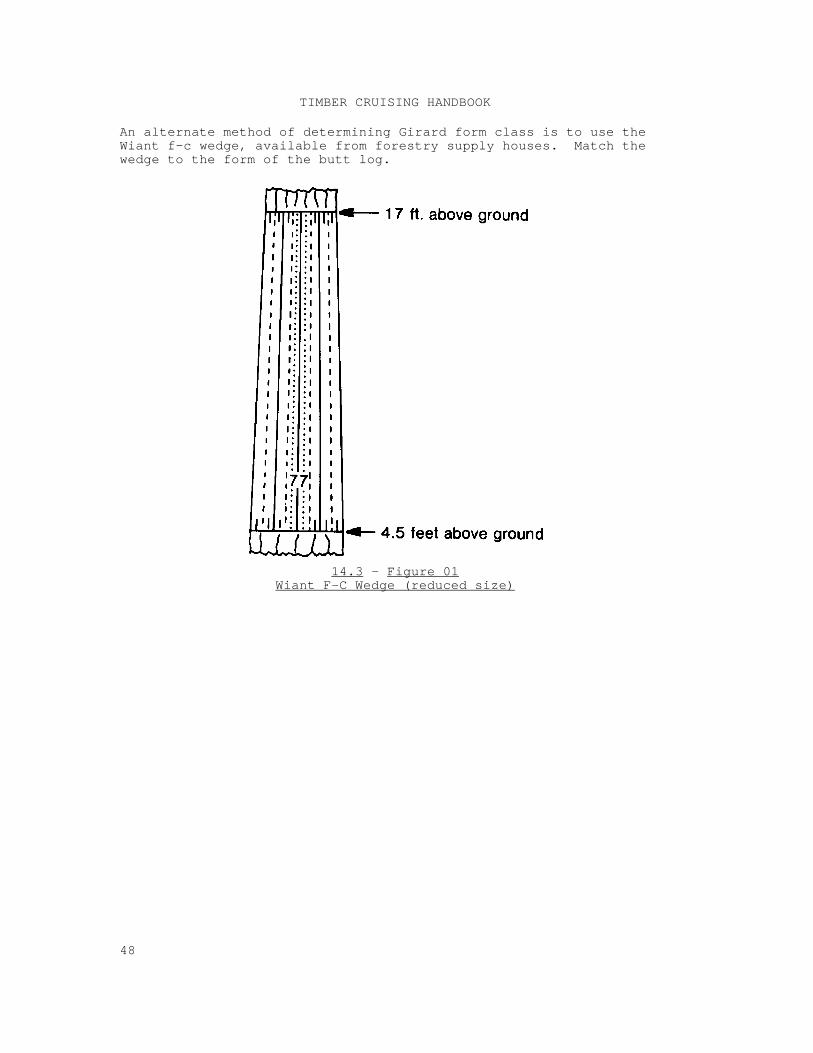
An alternate method of determining Girard form class is to use theWiant f-c wedge, available from forestry supply houses. Match thewedge to the form of the butt log.
14.3 - Figure 01Wiant F-C Wedge (reduced size)

TIMBER CRUISING HANDBOOK
49

TIMBER CRUISING HANDBOOK
50
CHAPTER 20 - ESTIMATING TREE VOLUME AND WEIGHT
Contents
21 LOG RULES AND CUBIC FORMULAS21.1 Log Rules21.2 Cubic Formulas
22 TREE VOLUME DETERMINATION22.1 Utilization Limits22.2 Tree Volume and Product Estimators22.21 Tree Stem Components22.22 Types and Use of Tree Volume and Product Estimators22.22a Standard Tree Volume Estimators--Volume and Stem Profile
Models22.22b Local Tree Volume Estimators22.22c Tarif Volume Estimators22.22d Aerial Volume Estimators22.22e Stem Profile Models22.23 Validation of Tree Volume Estimators22.3 Estimating Tree Defect and Net Tree Volume22.31 Defect Deduction Methods22.31a Volume Distribution in Trees22.31b Rots22.31c Sweep and Crook22.31d Missing Wood22.31e Breakage and Hidden Defect22.31f Net Volume Estimators22.4 Direct Tree Volume Estimation Methods22.41 Measuring Standing Trees22.42 Fall, Buck, and Scale
23 WEIGHT DETERMINATION23.1 Merchantable Components23.2 Residues23.21 Logging Residues23.22 Standing Residues

TIMBER CRUISING HANDBOOK
51
VA a2
× L
TIMBER CRUISING HANDBOOK
52
CHAPTER 20 - ESTIMATING TREE VOLUME AND WEIGHT
This chapter includes general guidelines for using tree volume andtree product estimators and defines acceptable direct tree volume andproduct determination techniques. Guidelines for estimating theweight of trees and components of trees are also given. 21 - LOG RULES AND CUBIC FORMULAS.
21.1 - Log Rules. A log rule is a table of estimated volume oflumber which might be sawn from logs of different sizes under assumedconditions. The Scribner Decimal C, and International 1/4-inch rulesare used by the Forest Service to estimate board-foot contents inroundwood.
21.2 - Cubic Formulas. A cubic-foot formula expresses roundwoodvolume without reference to product class. Use the Smalian formulato determine the cubic volume of roundwood. The Smalian formula, ingeneral terms, is:
Where: V = Volume in cubic feet (ft )3
A = Large end cross section area (ft )2
a = Small end cross section area (ft )2
L = Log length (ft)
22 - TREE VOLUME DETERMINATION. See FSH 2409.12a, Volume EstimatorHandbook, for detailed descriptions of all phases of developing treevolume and product estimators, stem profile models, modelverification, model validation, and model calibration.
22.1 - Utilization Limits. Determine volume to utilization limitsapplicable to the place and time when the timber sale will be sold. These limits are usually expressed in terms of height and diameter. Calculate or measure a merchantable height, which is the height froma specified stump to a specified top diameter.
The advent of whole-tree chipping may extend utilization to includethe entire main stem and the branches as well. Under theseconditions, call the entire stem merchantable. For sawtimber trees,utilization may not necessarily end with the sawlog portion, but mayinclude the chippable portion above the sawlog. Merchantabilitycriteria for the sawlog portion can change over time, affecting notonly the smallest tree diameter considered merchantable, but alsoextending utilization farther up the stem.
22.2 - Tree Volume and Product Estimators. Apply the term "treevolume estimator" (sec. 05) to either an equation or its tabular representation, or both, for estimating the cubic content of a tree. Compute tree volumes from equations or from stem profile models. Usevolume tables only when hand summary of volumes is necessary.
TIMBER CRUISING HANDBOOK
53
The term "product estimator" (sec. 05) is similar to the volumeestimator except cubic feet may not be the unit of measure. Thus,sawtimber portions may be expressed in board feet, poles may be inlineal feet, pulpwood in cords or units, and peeler blocks may beboard feet or square feet. Cubic feet may be used to express thesolid wood content for any wood product and its use is preferable toother product estimators.
22.21 - Tree Stem Components. Measure the dimensions usuallynecessary for calculating volume. The most common measurements areDBH and height to a specific point on the stem, or to the tip of thetree.
To the extent possible, partition the tree into product components. Product feasibility is based on local utilization practices andmarkets for the various products.
The main stem components are:
1. The sawlog portion to a specified top limit.
2. The topwood portion from the top of the sawlog to aspecified top limit, such as 4 inches DOB (or DIB), or to the tip ofthe tree when only the main stem is considered.
3. The crownwood portion includes all branches and thatportion of the main stem above the merchantable limit.
The components mentioned in paragraphs 2 and 3 are often classed aschippable material.
Topwood in the main stem may be estimated by a separate productvolume equation having DBH as one of its variables. It may also beestimated using a stem profile model by specifying the sawlog toplimit and a topwood limit of either height or diameter. Crownwoodvolume may be estimated as the difference between total tree cubicvolume, including branches, and stem volume to the definedmerchantable height.
22.22 - Types and Use of Tree Volume and Product Estimators. Use theappropriate type of estimator from those available. Four types ofvolume estimators are recognized based on the independent variablesused. They are discussed in sections 22.22a-22.22e.
Before starting a cruise, know the specific product or volumeestimator characteristics used to derive tract volumes. Select themost appropriate volume estimators for each species and product classto be cruised. For each applicable product or volume estimator knowthe top limits and stump heights, and whether use of a form factor isneeded. Not having such information, or failing to apply itproperly, will lead to a bias in the tract product volume orestimate.
22.22a - Standard Tree Volume Estimators--Volume and Stem ProfileModels. Standard volume estimators use diameter breast height (DBH)and height as independent variables and diameter inside bark (DIB) ordiameter outside bark (DOB) to define diameter limit. The heightvariable is defined as: a) total height, from ground to tip or stump

TIMBER CRUISING HANDBOOK
54
to tip; b) height to a specified diameter limit; or c) height to apoint otherwise defined. In timber cruising, DOB is the preferredway to define the diameter limit since this is all the cruiser canaccurately determine.

TIMBER CRUISING HANDBOOK
55
When using standard volume estimators:
1. Clearly understand the criteria that define the height forthe applicable volume estimator. Heights other than total height arecollectively called reference height and define the stem section forestimating volume if the section is less than the total stem length.
2. Measure heights to the specified diameter limit. Do not disregard the basic assumptions of the volume estimator regardless ofutilization practiced by operators. When volume estimators specifyDIB limit, use a standard DOB equivalent for a particular species orassume a bark thickness to determine height where the DIB occurs.
3. Observe the stratification (site, defect, species, other)on which the volume estimator is applicable.
4. Properly apply defect deduction methods in keeping with thebasic premises of the volume estimator(s) being used. For example,if the volume estimator is based on measuring the entire stem lengthto a specified reference diameter, make the suitable percentagededuction from tree volume for any defective segments downstem fromthe reference diameter. Do not measure a shorter height or recordfewer logs for the tree to account for the defect.
22.22b - Local Tree Volume Estimators. Local volume estimators useonly DBH as a predictor. They are constructed using sample tree datafrom the population of trees whose volume is to be estimated. Use oflocal volume estimators requires approval by the Regional Forester(sec. 04).
Evaluate the use of local volume estimators by considering thepurpose of the cruise estimate and the level of accuracy required. The chance for bias is increased by the loss of the height variable,and a local volume estimator's usefulness is limited to standshaving uniform height conditions within DBH classes, or where it ispractical to stratify site conditions.
22.22c - Tarif Volume Estimators. A tarif tree volume system is anindexed system of local tree volume estimators based on therelationship of tree volume to tree basal area. For many species oftrees in even-aged stands, the relationship is expressed as a linearregression called a volume/basal area line. While the tarif conceptis not limited to even-aged stands, the volume/basal area line isespecially suited to stands having relatively uniform tree heightswithin DBH classes. Tarif estimators do not indicate volume of treesby log position and do not provide a direct means for determiningdefect and grade.
The basal area variable is converted to DBH equivalents forincorporation into a tarif volume reference. The tarif volumereference is defined by a specific volume/basal area line andidentified by an indexed tarif number. Tarif number is defined asthe cubic foot volume to the specified top of a tree of 1.0 squarefoot basal area.
To find the specific tarif number of an even-aged stand, measure theDBH and height of about 25 sample trees. Use the DBH and height ofeach tree to determine its tarif number. Average the tree tarif
TIMBER CRUISING HANDBOOK
56
numbers to find the tarif number for the stand. The stand tarifnumber indicates the correct volume estimator.
To find the tarif number in an uneven-aged or mixed species stand,stratify the stand by species-DBH group and find an average tarif foreach species-DBH group.
Use single tree tarif numbers when referencing tarif volumeestimators to find volumes and volume/basal area ratios from a fixedpoint, point sample, or 3P cruise.
22.22d - Aerial Volume Estimators. Aerial volume estimators arespecifically intended for estimating tree volume from aerialphotographs. Aerial volume estimators are analogues of conventionaltree volume estimators but use crown diameter as the independentvariable instead of tree DBH. They may be based on crown diameterand total height or on crown diameter alone.
Use aerial volume estimators only when more generalized informationwith a larger sampling error will meet the cruise objective. Use ofaerial volume estimators requires approval by the Regional Forester(sec. 04).
The use of aerial volume estimators is limited because aerial cruisesrequire special photogrametric skills and a larger scale photography(1:5000 or 1:8000) than is generally required for the usual saleplanning purposes. They also have a greater sampling error becausethe tree volume is more closely related to DBH than crown diameter.
22.22e - Stem Profile Models. A stem profile model expresses theform of the tree stem. It can also function as a volume estimatorwith greater versatility than conventional volume equations. Not allprofile models use the same form or independent variables, so collectdata for the variables defined in the profile model to be used.
In cruising, profile models may be used to estimate:
1. Diameter at desired heights on the stem.
2. Height to a given diameter.
3. Volume for the entire stem or in a given portion of thestem.
22.23 - Validation of Tree Volume Estimators. Validate the volumeestimators for first-time use. A validation check serves twopurposes:
1. to validate the ability of the equation to predict volumewithin the constraints of the initial assumptions, and
2. to check the validity of the actual assumptions.
Statistical precision or goodness of fit measures for a tree volumeestimator only apply to the data used in its derivation. Validationusing an independent sample is a measure of how well the equationestimates volume of trees from applicable stands. See the TimberVolume Estimator Handbook, FSH 2409.12a, for details of validation.
TIMBER CRUISING HANDBOOK
57
22.3 - Estimating Tree Defect and Net Tree Volume. The standardpractice in National Forest volume determination is to sell onlymerchantable wood volume. Partition roundwood volume into twocomponents: gross and net.
Gross is the total volume in the tree to a specified top limit.
Net is the residual volume after deducting wood loss (defect)from gross volume. Requirements for specifying measurementlimits are the same as for gross volume.
Defect is any tree condition that reduces either product yield(lumber or veneer, for example) or wood fiber yield. Examples ofdefect include soft rots, crook, sweep, heart check, and fire scars. All of these defects can reduce product yield, but of the examplesgiven, only soft rots and fire scar reduce fiber yield. Refer todetailed defect information in the National Forest Log ScalingHandbook, FSH 2409.11, and the Cubic Scaling Handbook, FSH 2409.11a.
22.31 - Defect Deduction Methods. Estimate defect in standing treesin one of two ways:
1. Ocularly estimate the extent and position of defect in thetree, then refer to a table of percentages of stem volume (sec.22.31a, ex. 01 and 02). Where only a part of a standard segmentlength is affected by the defect, multiply the tabular volume percentby the fraction affected.
2. Make defect deductions in the raw data used for derivingthe volume estimators to calculate the net volume of each sampletree. The result is a net volume estimate.
In using percentage deduction methods, decide on the suitablededuction from an ocular assessment of stem condition. Tailor thesemethods to specific Regions or sub-Regions to allow for the differingdefect characteristics of species. Most methods require tables thatshow the average percentage distribution of tree volume for each logbased on the log position in the tree.
Successful application of ocular defect estimation methods demandsconsiderable skill by the cruiser and a knowledge of rotcharacteristics for the species being cruised. Each cruiser mustcontinually update their skills by periodically visiting sawmills andlogged areas to relate the extent of rot to surface indicators.
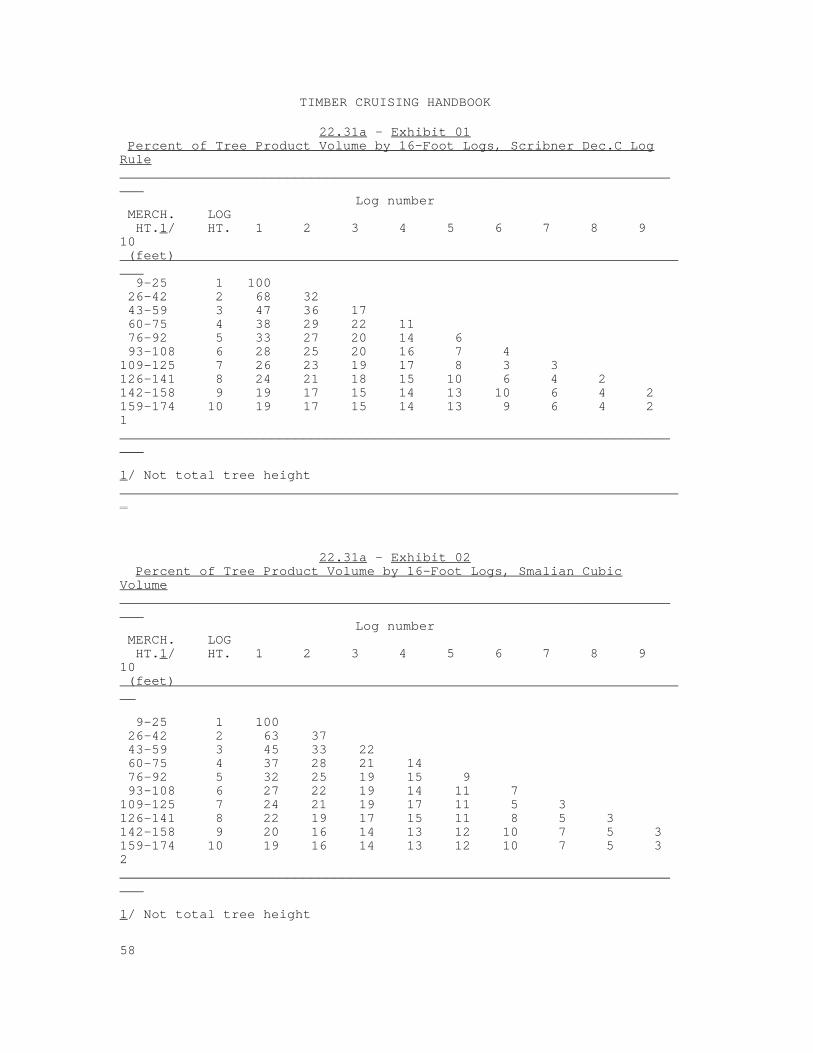
22.31a - Volume Distribution in Trees. Where the cruiser must makeocular assessments of defect in standing trees, use tables that showthe percent of tree volume in different parts of a tree. Thesetables show percentage of volume by 16-foot segments within themerchantable length, although other segment lengths may also be used. Examples of such tables are shown in Exhibits 01 and 02. Tablesshowing volume distribution in trees should specify the area ofapplicability and species or species group to which they apply.
TIMBER CRUISING HANDBOOK
58
22.31a - Exhibit 01 Percent of Tree Product Volume by 16-Foot Logs, Scribner Dec.C LogRule ________________________________________________________________________
Log number MERCH. LOG HT.1/ HT. 1 2 3 4 5 6 7 8 9 10 (feet) 9-25 1 100 26-42 2 68 32 43-59 3 47 36 17 60-75 4 38 29 22 11 76-92 5 33 27 20 14 6 93-108 6 28 25 20 16 7 4109-125 7 26 23 19 17 8 3 3126-141 8 24 21 18 15 10 6 4 2142-158 9 19 17 15 14 13 10 6 4 2159-174 10 19 17 15 14 13 9 6 4 2 1________________________________________________________________________
1/ Not total tree height
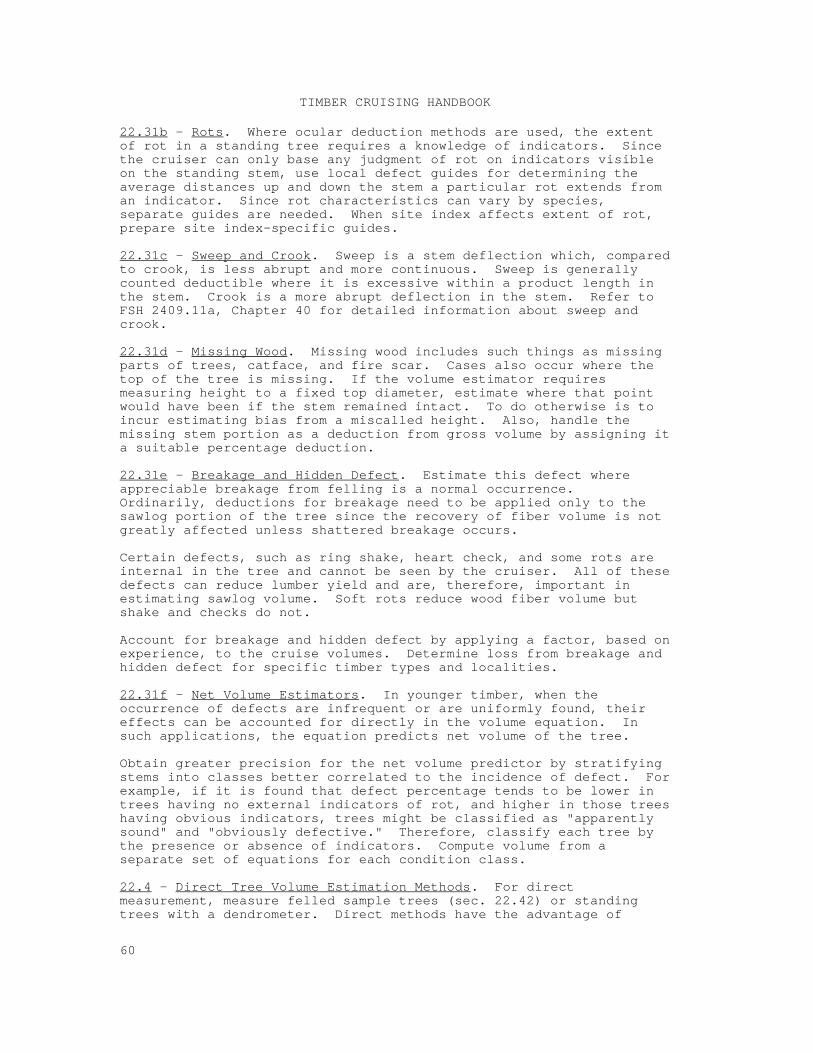
22.31a - Exhibit 02 Percent of Tree Product Volume by 16-Foot Logs, Smalian CubicVolume ________________________________________________________________________
Log number MERCH. LOG HT.1/ HT. 1 2 3 4 5 6 7 8 9 10 (feet)
9-25 1 100 26-42 2 63 37 43-59 3 45 33 22 60-75 4 37 28 21 14 76-92 5 32 25 19 15 9 93-108 6 27 22 19 14 11 7109-125 7 24 21 19 17 11 5 3126-141 8 22 19 17 15 11 8 5 3142-158 9 20 16 14 13 12 10 7 5 3159-174 10 19 16 14 13 12 10 7 5 3 2________________________________________________________________________
1/ Not total tree height

TIMBER CRUISING HANDBOOK
59
When volume estimators are based on measuring entire stem length to aspecified reference diameter and it becomes necessary to reducemerchantable length because of defect, express this as a percentagededuction from tree volume, rather than by tallying the tree as beingshorter than it is.
TIMBER CRUISING HANDBOOK
60
22.31b - Rots. Where ocular deduction methods are used, the extentof rot in a standing tree requires a knowledge of indicators. Sincethe cruiser can only base any judgment of rot on indicators visibleon the standing stem, use local defect guides for determining theaverage distances up and down the stem a particular rot extends froman indicator. Since rot characteristics can vary by species,separate guides are needed. When site index affects extent of rot,prepare site index-specific guides.
22.31c - Sweep and Crook. Sweep is a stem deflection which, comparedto crook, is less abrupt and more continuous. Sweep is generallycounted deductible where it is excessive within a product length inthe stem. Crook is a more abrupt deflection in the stem. Refer toFSH 2409.11a, Chapter 40 for detailed information about sweep andcrook.
22.31d - Missing Wood. Missing wood includes such things as missingparts of trees, catface, and fire scar. Cases also occur where thetop of the tree is missing. If the volume estimator requiresmeasuring height to a fixed top diameter, estimate where that pointwould have been if the stem remained intact. To do otherwise is toincur estimating bias from a miscalled height. Also, handle themissing stem portion as a deduction from gross volume by assigning ita suitable percentage deduction.
22.31e - Breakage and Hidden Defect. Estimate this defect whereappreciable breakage from felling is a normal occurrence. Ordinarily, deductions for breakage need to be applied only to thesawlog portion of the tree since the recovery of fiber volume is notgreatly affected unless shattered breakage occurs.
Certain defects, such as ring shake, heart check, and some rots areinternal in the tree and cannot be seen by the cruiser. All of thesedefects can reduce lumber yield and are, therefore, important inestimating sawlog volume. Soft rots reduce wood fiber volume butshake and checks do not.
Account for breakage and hidden defect by applying a factor, based onexperience, to the cruise volumes. Determine loss from breakage andhidden defect for specific timber types and localities.
22.31f - Net Volume Estimators. In younger timber, when theoccurrence of defects are infrequent or are uniformly found, theireffects can be accounted for directly in the volume equation. Insuch applications, the equation predicts net volume of the tree.
Obtain greater precision for the net volume predictor by stratifyingstems into classes better correlated to the incidence of defect. Forexample, if it is found that defect percentage tends to be lower intrees having no external indicators of rot, and higher in those trees having obvious indicators, trees might be classified as "apparentlysound" and "obviously defective." Therefore, classify each tree bythe presence or absence of indicators. Compute volume from aseparate set of equations for each condition class.
22.4 - Direct Tree Volume Estimation Methods. For directmeasurement, measure felled sample trees (sec. 22.42) or standingtrees with a dendrometer. Direct methods have the advantage of
TIMBER CRUISING HANDBOOK
61
basing volume estimates on measurements of samples representative ofthe tract being cruised and are, therefore, less prone to the biasinherent in indirect methods.
22.41 - Measuring Standing Trees. For standing trees, estimatevolume directly using a type of dendrometer capable of measuringoutside bark diameters at selected points on the stem and the heightsabove ground to those points. A variety of devices are available fordoing this. Some devices, such as the Spiegel Relaskop, readdirectly in standard measurement units. Others, like the Barr andStroud dendrometer, require translation to get standard units. Estimate defect using the methods described in Section 22.3.
22.42 - Fall, Buck, and Scale. Another method of direct measurementis to fall a sample of trees on the area being cruised, cut them intologs, and determine their gross and net volumes using standardscaling procedures (FSH 2409.11a; FSH 2409.11).
1. Use data obtained from such scales to:
a. Serve as a training experience for cruisers inassessing cull and defect in standing trees.
b. Check the reliability of tree volume estimators.
c. Build up data files for developing tree volumeregressions.
d. Serve as a sample in some cruising systems such as 3P(sec. 30).
2. Establish regional standards to produce consistent cruiseestimates when using fall, buck, and scale. These standards mustcover the following specifications:
a. Measurement of height (total height, from ground orstump, or merchantable height).
b. Minimum top scaling diameters.
c. Minimum scaling lengths and segmentation rules.
d. Guidelines to account for broken chunks, highlydefective material, and extremely knotty material.
e. Bucking requirements.
f. Tree identification.
g. Data to be recorded.
23 - WEIGHT DETERMINATION. Use weight estimation for treecomponents, such as crownwood, that do not readily lend themselves tovolume determination methods. Tree weight estimates are used forplanning helicopter logging and timber hauling operations.
TIMBER CRUISING HANDBOOK
62
Weight is much more closely related to cubic volume than board footunits of measure, and weight may be a useful estimator when cubicunits of volume are of interest.
23.1 - Merchantable Components. Weight predictors can be derived toestimate weight of various tree components: total tree, tree bole tospecified top limit, branches to specified minimum diameters, andfoliage and twigs. Weights may be for wood alone, or for wood andbark. Separate bark weight prediction equations are also available. In addition, weight is expressed on an oven-dry or green basis, orboth.
Weight equations usually express weights for tree components as afunction of species, DBH, and stem height. Therefore, weightestimates can be determined from the regular cruise data collectedfor conventional volume estimates.
23.2 - Residues. Weight is used to quantify two types of residuesthat result from timber harvesting.
1. Logging residues are tree portions left behind in loggingand are outside the products specified in the timber sale contract.
2. Standing residues are standing trees not meetingmerchantability specifications on the timber sale contract forstandard products.
23.21 - Logging Residues. Residues are the tree crowns andunmerchantable segments of the trees. Logging residue potentialprediction equations have been developed for given utilizationstandards in several species and may be used when precise estimatesare not needed.
Greater accuracy is obtained by some form of post-logging residuesampling. The line-intersect, planar-intercept method, or some othersuitable method, may be used to get a tally of material lengths andcritical diameters, by species. Estimates are expressed in tonsper-acre.
Specific information about line-intersect sampling procedures can befound in a publication by C. E. Van Wagner (1968).
23.22 - Standing Residues. Trees considered unmerchantable are notincluded for removal under the timber sale contract. Tally thesetrees as separate cruise components and apply weight coefficients asnecessary.

TIMBER CRUISING HANDBOOK
63

TIMBER CRUISING HANDBOOK
64
TIMBER CRUISING HANDBOOK
65
CHAPTER 30 - CRUISING SYSTEMS
Contents
30.5 Definitions
31 STATISTICAL METHODS IN CRUISING31.1 Statistical Notation and Formulas31.2 Statistical Concepts31.21 Frequency Distribution31.22 The Normal Distribution31.23 Sampling31.24 Examples of Bias31.3 Sampling Statistics31.31 Calculating a Mean31.32 Calculating Variance31.33 Calculating Standard Deviation31.34 Calculating Coefficient of Variation31.35 Standard Error and Confidence Limits31.36 Calculating Sampling Error31.4 Determining Sample Size31.5 Stratification
32 100 PERCENT CRUISE
33 SAMPLE-TREE WITH COMPLETE TALLY33.1 Sample-Tree With Complete Tally Method33.11 Operational Features33.12 Statistical Features33.2 Calculating Sample Size33.3 Calculating Sampling Statistics33.31 Sample Expansion33.32 Sampling Error33.4 Additional Population Characteristics33.5 Application
34 FIXED PLOTS34.1 Fixed Plot Method34.11 Operational Features34.12 Statistical Features34.2 Field Procedures34.21 Sample Plot Location and Monumentation of Plots and Trees34.22 Establishing Plot Boundaries34.3 Calculating Sample Size34.4 Calculating Sampling Statistics34.41 Sample Expansion34.42 Sampling Error34.5 Additional Population Characteristics34.6 Application
35 POINT SAMPLING 35.1 Point Sampling Method 35.11 Operational Features35.12 Statistical Features35.13 Basal Area Factor35.2 Field Procedures for Point Sampling
TIMBER CRUISING HANDBOOK
66
35.21 Sample Point Location and Monumentation of Points and Trees35.21a Angle Gauge Use35.22 Sample Tree Determination35.22a Assessing Borderline and Other Questionable Trees35.3 Calculating Sample Size35.4 Calculating Sampling Statistic35.41 Sample Expansion35.42 Sampling Error35.5 Additional Population Characteristics35.6 Application
36 3P SAMPLING36.1 3P Sampling Method36.11 Operational Features36.12 Statistical Features36.2 Field Procedures36.3 Calculating Sample Size and Preparing 3P Random NumberLists36.4 Calculating Sampling Statistics36.41 Sample Expansion36.42 Sampling Error36.5 Additional Population Characteristics36.6 Application
37 TWO-STAGE SAMPLING 37.1 Sample-Tree With 3P Subsampling Method37.12 Operational Features37.13 Statistical Features37.14 Calculating Sample Size37.15 Producing Random Number Lists37.16 Calculating Sampling Statistics37.16a Sample Expansion37.16b Sampling Error37.17 Additional Population Characteristics37.18 Application37.2 Fixed Area Plot With 3P Subsampling 37.21 Fixed Area Plot With 3P Subsampling Method 37.22 Operational Features37.23 Statistical Features37.24 Calculating Sample Size37.25 Producing Random Number List37.26 Calculating Sampling Statistics37.26a Sample Expansion37.26b Sampling Error37.27 Additional Population Characteristics37.28 Application37.3 Point Sampling with 3P Subsampling37.31 Operational Features37.32 Statistical Features37.33 Calculating Sample Size37.34 Random Number List37.35 Calculating Sampling Statistics37.35a Sample Expansion37.35b Sampling Error37.36 Additional Population Characteristics37.37 Application37.4 Point Count/Measure-Plot Method37.41 Operational Features
TIMBER CRUISING HANDBOOK
67
37.42 Statistical Features37.43 Calculating Sample Size37.44 Calculating Sampling Statistics37.44a Sample Expansion37.44b Sampling Error37.45 Additional Population Characteristics37.46 Application37.5 Point Count/Measure-Tree Method37.51 Operational Features37.52 Statistical Features37.53 Calculating Sample Size37.54 Calculating Sampling Statistics37.54a Sample Expansion37.54b Sampling Error37.55 Additional Population Characteristics37.56 Application
38 COMBINING STRATA38.1 Combining Sampling Statistics38.11 Same Cruising Technique38.12 Different Cruising Techniques, Two Strata38.13 Different Cruising Techniques, Three Strata38.2 Combining Additional Population Characteristics38.21 Additional Characteristic, Two Strata38.3 Applications of Combined Statistics

TIMBER CRUISING HANDBOOK
68
TIMBER CRUISING HANDBOOK
69
CHAPTER 30 - CRUISING SYSTEMS
During the design phase, choose the appropriate and most efficientcruise system from those described in this chapter. The numericalexamples given are intended to illustrate the arithmetic proceduresinvolved in each cruising system. The examples are necessarilybrief, are not based on actual data, and in most cases would not meeterror standards due to the small number of samples taken.
30.5 - Definitions.
Accuracy. Accuracy refers to how well the sample estimates thetrue value of a quantity. Either bias, lack of precision, or both,can impair accuracy of an estimate. An estimate may be very precise,but because of bias, may still be inaccurate.
Bias. Bias is a systematic error.
Coefficient of Variation. This is a measure of relativedispersion. It is the standard deviation expressed as a percentageof the mean.
Expansion Factor. In any sampling scheme, only selected treesare completely measured. The trees that are measured also representthose that were not measured and must be expanded to get a totalstand value. A blow-up, or expansion factor can be calculated basedon the sampling scheme that allows each sampled tree to be expandedto represent the entire stand. The factors (denoted by F) can becalculated to expand each sample tree to units such as trees per acreor volume per acre; the type of factor is denoted by subscriptingthe F.
Frequency Distribution. A frequency distribution divides thepopulation into a relatively small number of classes, listing thenumber of observations belonging to each.
Mean. This is the average value obtained from dividing the sumof sample unit values by the number of sample units.
Normal Distribution. The normal distribution is a frequencydistribution where the distribution of a random measuring error orrandom error for repeated measurements (for large n) of physicalquantities exhibits a particular symmetric bell shape, with a typicalmaximum, the curve falling off on both sides, and large deviationsfrom the measured value being rare. Assume a normal distributiongoverns the distribution of population values dealt with in timbercruises.
Parameter. Characteristics such as relative frequency, mean, orstandard deviation which refer to the population, are calledparameters. Mean tree volume for the entire population is called aparameter, and the sample-based mean tree volume is a statistic whichestimates the parameter.
Population. The defined total set of all possible observations,about which information is desired is termed a population.
TIMBER CRUISING HANDBOOK
70
Precision. Precision describes the clustering of sample valuesabout their mean.
Sampling Error. The sampling error expresses the precision ofthe inventory. It is the percent error of an estimated mean at adesired probability level. It is calculated as the standard error ofthe mean times a student t value, divided by the mean and multipliedby 100 to express a percent.
Standard Deviation. This commonly used measure of dispersion iscalculated by taking the square root of the variance.
Standard Error. The standard error of the mean provides anestimate of the sampling error. It describes the variation ofmultiple sample means about the population mean. It can be estimatedfrom a single sample as the square root of the sample variancedivided by the sample size.
Tree Factor. A factor that expands each sampled tree to thenumber of trees that it represents. Variance. Variance is a measure of how the sample unit values,such as tree volumes are dispersed (clustered, scattered) around themean of the unit values.
Volume Factor. A factor that expands each sampled tree to thevolume that it represents.
31 - STATISTICAL METHODS IN CRUISING. To make valid estimates, usestatistical methods together with the basic formulas to design acruise. For detailed information about statistics, refer to Freese(1962 and 1967) or college text books on forest mensuration andstatistics.
31.1 - Statistical Notation and Formulas. There are several methodsof writing many of the formulas. While an effort has been made toprovide a consistent approach in this handbook, other references mayuse different notations and formulations for the same equations. Some mensuration and statistical texts use the notation as given inparenthesis. The following describes standard statistical notationused in this chapter:
x Individual measurement
n Number of sampling units in a sample
N Number of sampling units in the population
Summation sign, read as sum of
x Arithmetic mean of the sample
V Variance (s 2)
SD Standard deviation (s)
SE Standard error of the mean (sx)
E Sampling error in percent
CV Coefficient of variation in percent
TIMBER CRUISING HANDBOOK
71
31.2 - Statistical Concepts. Use the statistical concepts ofpopulation, population variance, and sampling error objective as astarting point in cruise design. The units to be sampled within eachpopulation exhibit a characteristic variation. Populations are neveruniform, and the values of the units (trees, points, plots)comprising the population vary between certain limits, depending onhow the population is defined. Therefore, the less variation thereis in the measured variable from sampling unit to sampling unit, thefewer sampling units are needed to get a reliable estimate. Determine the reliability of estimates using the sampling error.
Use three basic elements in designing a cruise:
1. The population to be sampled.
2. The degree of variation within the population.
3. The sampling error objective.
Once the cruise is completed, compute the estimate, the samplingerror of the estimate (within 95 percent confidence limits), and thecoefficient of variation.
31.21 - Frequency Distribution. The mathematical form of a frequencydistribution is expressed as a distribution function. Eachpopulation has a distinctive distribution function and the form ofthe distribution function determines the suitable statisticaltreatment of sample data. The form of the distribution is seldomknown and large samples tend to approximate a normal distribution;consider a large sample to be one consisting of 30 or more samplingunits.
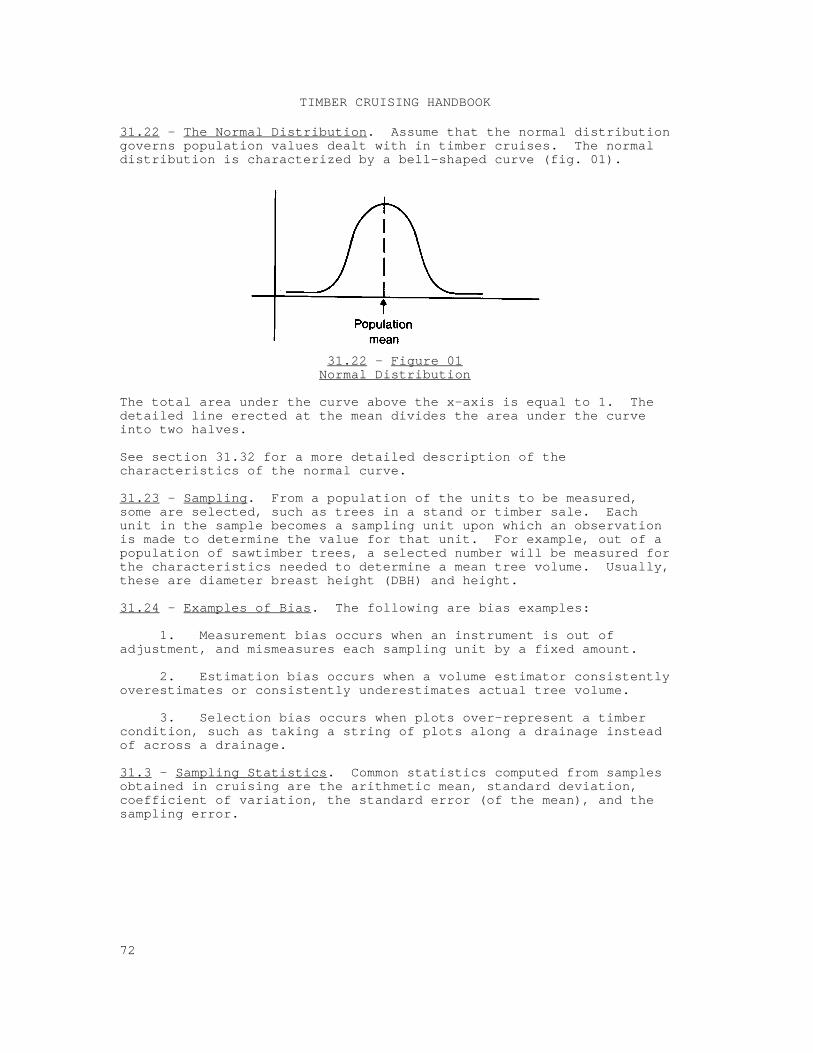
TIMBER CRUISING HANDBOOK
72
31.22 - The Normal Distribution. Assume that the normal distributiongoverns population values dealt with in timber cruises. The normaldistribution is characterized by a bell-shaped curve (fig. 01).
31.22 - Figure 01Normal Distribution
The total area under the curve above the x-axis is equal to 1. Thedetailed line erected at the mean divides the area under the curveinto two halves.
See section 31.32 for a more detailed description of thecharacteristics of the normal curve.
31.23 - Sampling. From a population of the units to be measured,some are selected, such as trees in a stand or timber sale. Eachunit in the sample becomes a sampling unit upon which an observationis made to determine the value for that unit. For example, out of apopulation of sawtimber trees, a selected number will be measured forthe characteristics needed to determine a mean tree volume. Usually,these are diameter breast height (DBH) and height.
31.24 - Examples of Bias. The following are bias examples:
1. Measurement bias occurs when an instrument is out ofadjustment, and mismeasures each sampling unit by a fixed amount.
2. Estimation bias occurs when a volume estimator consistentlyoverestimates or consistently underestimates actual tree volume.
3. Selection bias occurs when plots over-represent a timbercondition, such as taking a string of plots along a drainage insteadof across a drainage.
31.3 - Sampling Statistics. Common statistics computed from samplesobtained in cruising are the arithmetic mean, standard deviation,coefficient of variation, the standard error (of the mean), and thesampling error.
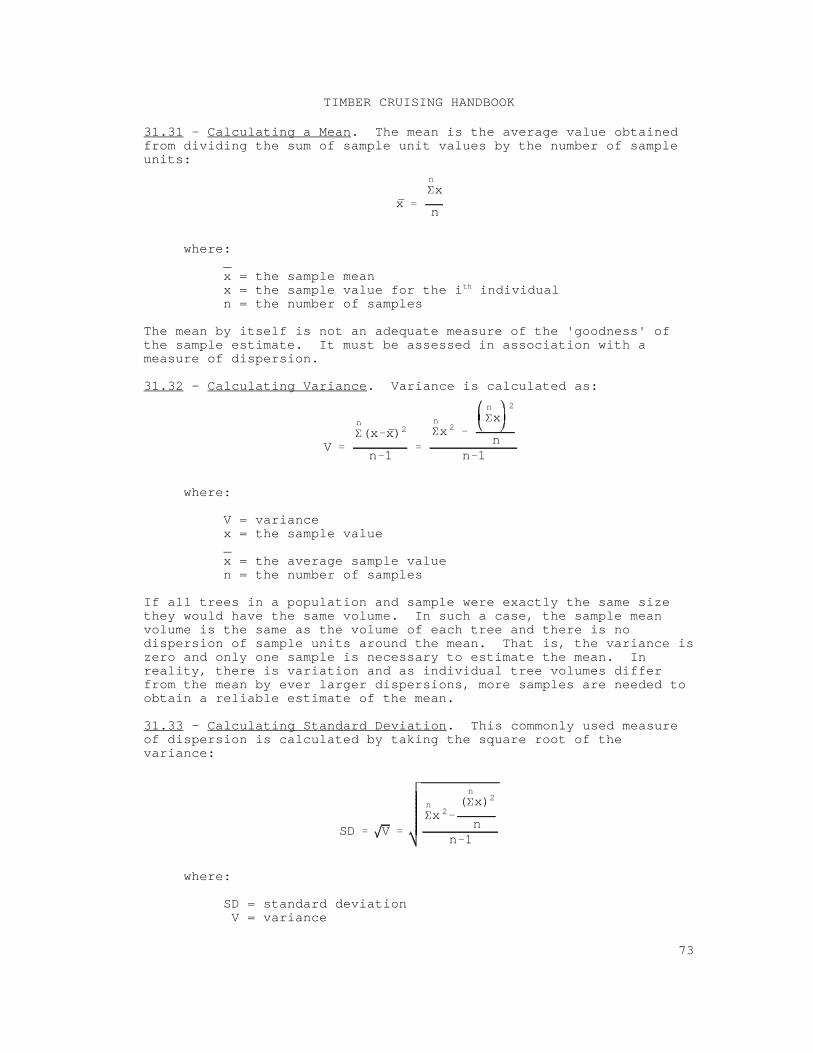
x
n
x
n
V
n
(x x)2
n 1
n
x 2
n
x2
nn 1
SD V
n
x 2(n
x)2
nn 1
TIMBER CRUISING HANDBOOK
73
31.31 - Calculating a Mean. The mean is the average value obtainedfrom dividing the sum of sample unit values by the number of sampleunits:
where:_x = the sample meanx = the sample value for the i individualth
n = the number of samples
The mean by itself is not an adequate measure of the 'goodness' ofthe sample estimate. It must be assessed in association with ameasure of dispersion.
31.32 - Calculating Variance. Variance is calculated as:
where:
V = variancex = the sample value x = the average sample valuen = the number of samples
If all trees in a population and sample were exactly the same sizethey would have the same volume. In such a case, the sample meanvolume is the same as the volume of each tree and there is nodispersion of sample units around the mean. That is, the variance iszero and only one sample is necessary to estimate the mean. Inreality, there is variation and as individual tree volumes differfrom the mean by ever larger dispersions, more samples are needed toobtain a reliable estimate of the mean.
31.33 - Calculating Standard Deviation. This commonly used measureof dispersion is calculated by taking the square root of thevariance:
where:
SD = standard deviation V = variance
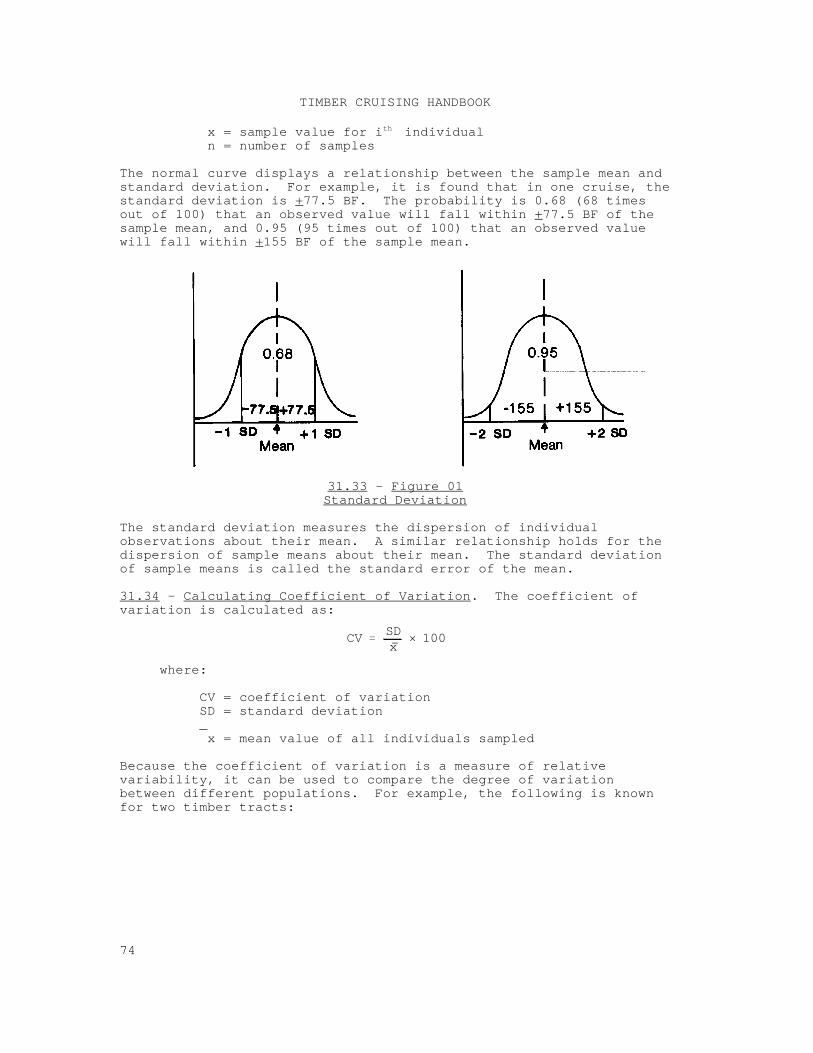
CVSDx
× 100
TIMBER CRUISING HANDBOOK
74
x = sample value for i individualth
n = number of samples
The normal curve displays a relationship between the sample mean andstandard deviation. For example, it is found that in one cruise, thestandard deviation is +77.5 BF. The probability is 0.68 (68 timesout of 100) that an observed value will fall within +77.5 BF of thesample mean, and 0.95 (95 times out of 100) that an observed valuewill fall within +155 BF of the sample mean.
31.33 - Figure 01Standard Deviation
The standard deviation measures the dispersion of individualobservations about their mean. A similar relationship holds for thedispersion of sample means about their mean. The standard deviationof sample means is called the standard error of the mean.
31.34 - Calculating Coefficient of Variation. The coefficient ofvariation is calculated as:
where:
CV = coefficient of variationSD = standard deviation_ x = mean value of all individuals sampled
Because the coefficient of variation is a measure of relativevariability, it can be used to compare the degree of variationbetween different populations. For example, the following is knownfor two timber tracts:
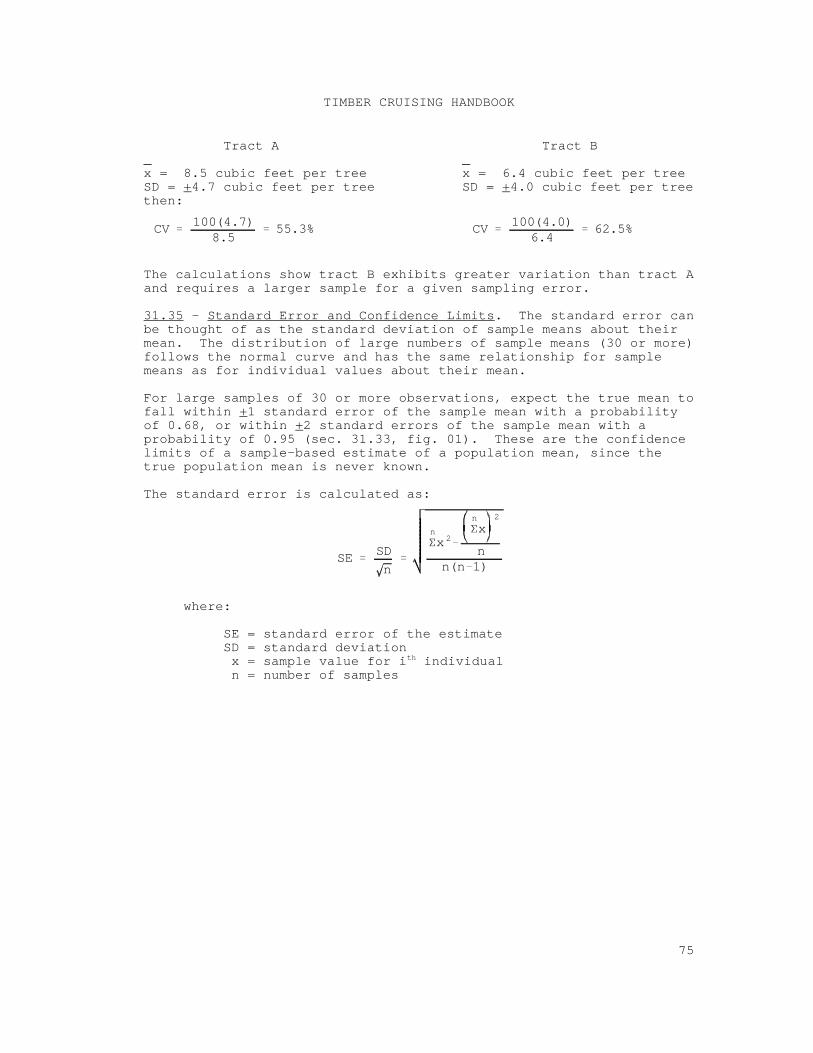
CV100(4.7)
8.555.3% CV
100(4.0)6.4
62.5%
SESD
n
n
x 2
n
x2
nn(n 1)
TIMBER CRUISING HANDBOOK
75
Tract A Tract B_ _x = 8.5 cubic feet per tree x = 6.4 cubic feet per treeSD = +4.7 cubic feet per tree SD = +4.0 cubic feet per treethen:
The calculations show tract B exhibits greater variation than tract Aand requires a larger sample for a given sampling error.
31.35 - Standard Error and Confidence Limits. The standard error canbe thought of as the standard deviation of sample means about theirmean. The distribution of large numbers of sample means (30 or more)follows the normal curve and has the same relationship for samplemeans as for individual values about their mean.
For large samples of 30 or more observations, expect the true mean tofall within +1 standard error of the sample mean with a probabilityof 0.68, or within +2 standard errors of the sample mean with aprobability of 0.95 (sec. 31.33, fig. 01). These are the confidencelimits of a sample-based estimate of a population mean, since thetrue population mean is never known.
The standard error is calculated as:
where:
SE = standard error of the estimateSD = standard deviation x = sample value for i individualth
n = number of samples
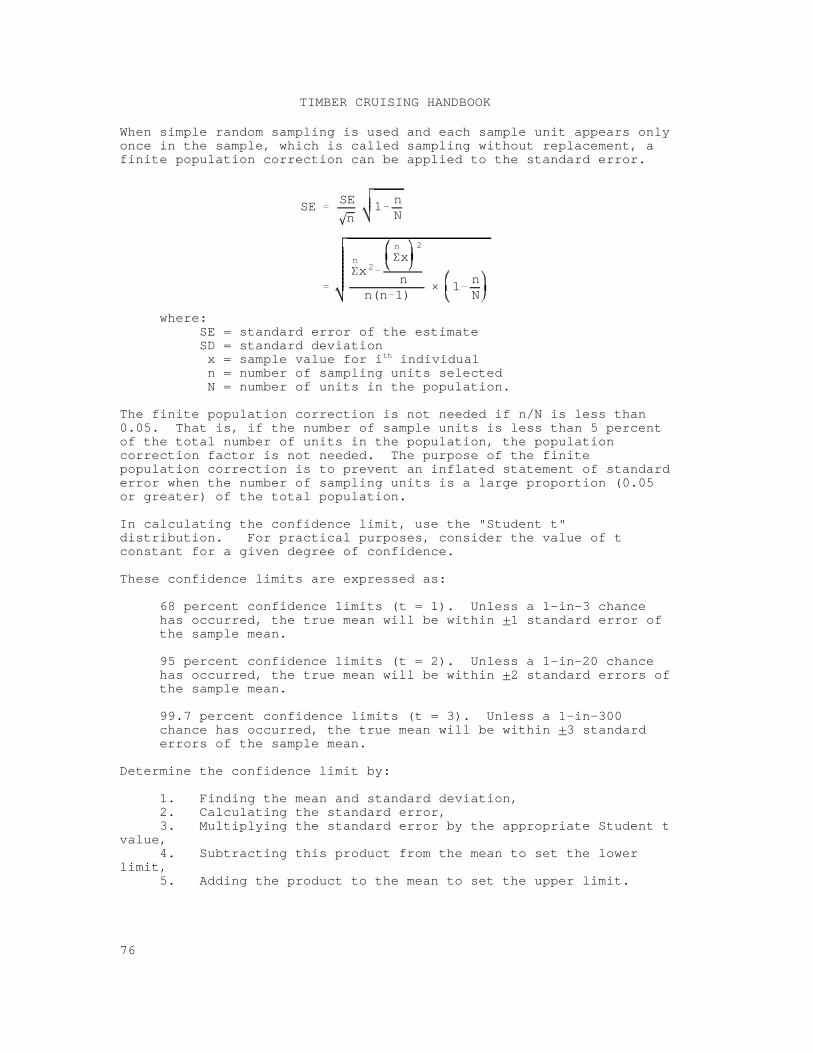
SESE
n1
nN
n
x 2
n
x2
nn(n 1)
× 1nN
TIMBER CRUISING HANDBOOK
76
When simple random sampling is used and each sample unit appears onlyonce in the sample, which is called sampling without replacement, afinite population correction can be applied to the standard error.
where:SE = standard error of the estimateSD = standard deviation x = sample value for i individualth
n = number of sampling units selected N = number of units in the population.
The finite population correction is not needed if n/N is less than0.05. That is, if the number of sample units is less than 5 percentof the total number of units in the population, the populationcorrection factor is not needed. The purpose of the finitepopulation correction is to prevent an inflated statement of standarderror when the number of sampling units is a large proportion (0.05or greater) of the total population.
In calculating the confidence limit, use the "Student t"distribution. For practical purposes, consider the value of tconstant for a given degree of confidence.
These confidence limits are expressed as:
68 percent confidence limits (t = 1). Unless a 1-in-3 chancehas occurred, the true mean will be within +1 standard error ofthe sample mean.
95 percent confidence limits (t = 2). Unless a 1-in-20 chancehas occurred, the true mean will be within +2 standard errors ofthe sample mean.
99.7 percent confidence limits (t = 3). Unless a 1-in-300chance has occurred, the true mean will be within +3 standarderrors of the sample mean.
Determine the confidence limit by:
1. Finding the mean and standard deviation,2. Calculating the standard error,3. Multiplying the standard error by the appropriate Student t
value,4. Subtracting this product from the mean to set the lower
limit,5. Adding the product to the mean to set the upper limit.
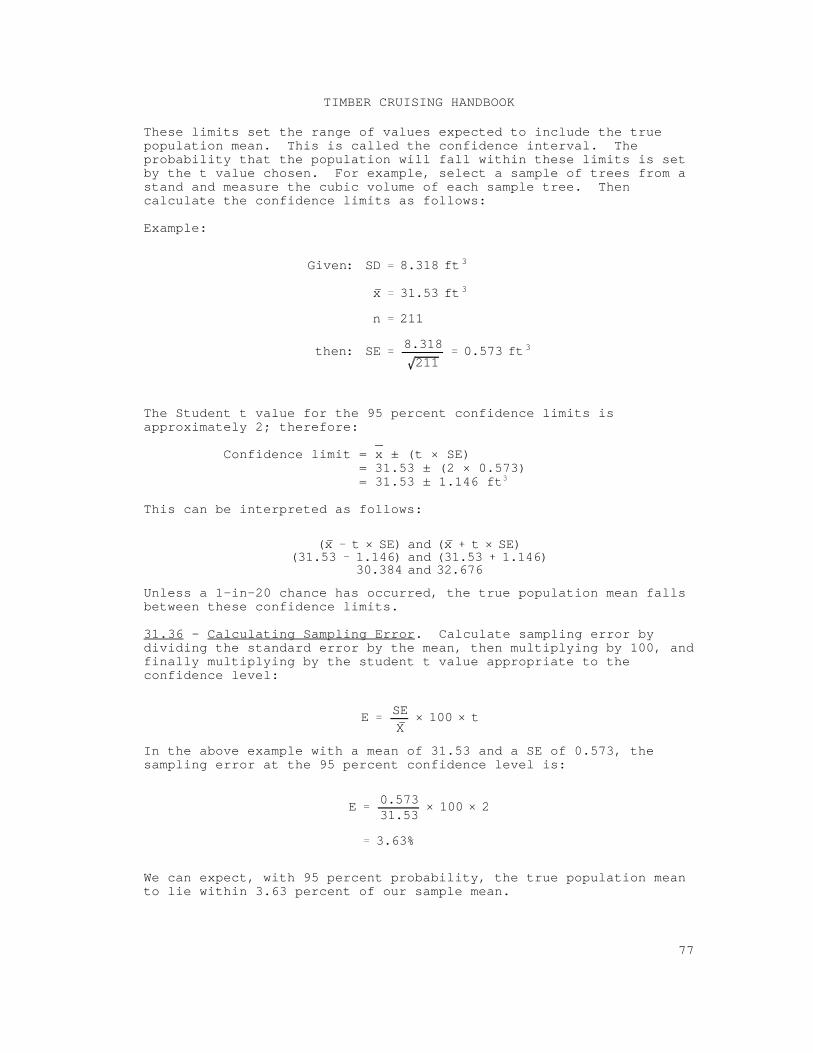
Given: SD 8.318 ft 3
x 31.53 ft 3
n 211
then: SE8.318
2110.573 ft 3
(x t × SE) and (x t × SE)(31.53 1.146) and (31.53 1.146)
30.384 and 32.676
ESE
X× 100 × t
E0.57331.53
× 100 × 2
3.63%
TIMBER CRUISING HANDBOOK
77
These limits set the range of values expected to include the truepopulation mean. This is called the confidence interval. Theprobability that the population will fall within these limits is setby the t value chosen. For example, select a sample of trees from astand and measure the cubic volume of each sample tree. Thencalculate the confidence limits as follows:
Example:
The Student t value for the 95 percent confidence limits isapproximately 2; therefore:
Confidence limit = x ± (t × SE) = 31.53 ± (2 × 0.573) = 31.53 ± 1.146 ft3
This can be interpreted as follows:
Unless a 1-in-20 chance has occurred, the true population mean fallsbetween these confidence limits.
31.36 - Calculating Sampling Error. Calculate sampling error bydividing the standard error by the mean, then multiplying by 100, andfinally multiplying by the student t value appropriate to theconfidence level:
In the above example with a mean of 31.53 and a SE of 0.573, thesampling error at the 95 percent confidence level is:
We can expect, with 95 percent probability, the true population meanto lie within 3.63 percent of our sample mean.
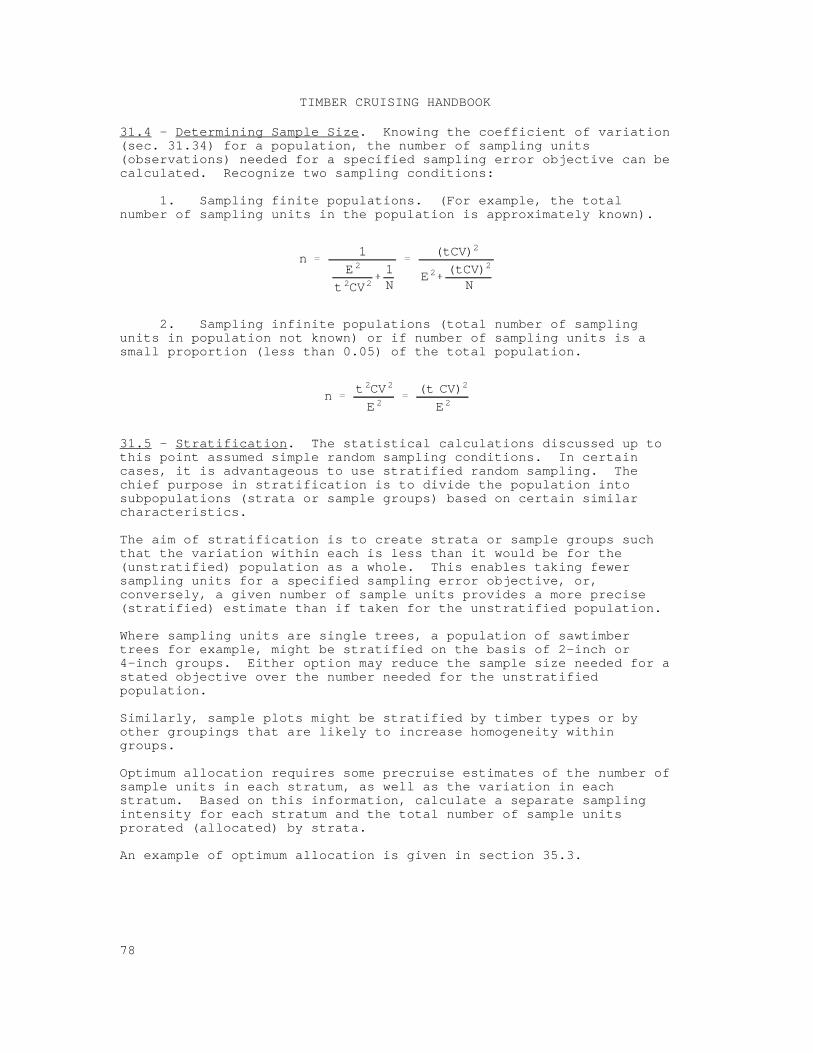
n1
E 2
t 2CV2
1N
(tCV)2
E 2 (tCV)2
N
nt 2CV 2
E 2
(t CV)2
E 2
TIMBER CRUISING HANDBOOK
78
31.4 - Determining Sample Size. Knowing the coefficient of variation(sec. 31.34) for a population, the number of sampling units(observations) needed for a specified sampling error objective can becalculated. Recognize two sampling conditions:
1. Sampling finite populations. (For example, the totalnumber of sampling units in the population is approximately known).
2. Sampling infinite populations (total number of samplingunits in population not known) or if number of sampling units is asmall proportion (less than 0.05) of the total population.
31.5 - Stratification. The statistical calculations discussed up tothis point assumed simple random sampling conditions. In certaincases, it is advantageous to use stratified random sampling. Thechief purpose in stratification is to divide the population intosubpopulations (strata or sample groups) based on certain similarcharacteristics.
The aim of stratification is to create strata or sample groups suchthat the variation within each is less than it would be for the(unstratified) population as a whole. This enables taking fewersampling units for a specified sampling error objective, or,conversely, a given number of sample units provides a more precise(stratified) estimate than if taken for the unstratified population.
Where sampling units are single trees, a population of sawtimbertrees for example, might be stratified on the basis of 2-inch or4-inch groups. Either option may reduce the sample size needed for astated objective over the number needed for the unstratifiedpopulation.
Similarly, sample plots might be stratified by timber types or byother groupings that are likely to increase homogeneity withingroups.
Optimum allocation requires some precruise estimates of the number ofsample units in each stratum, as well as the variation in eachstratum. Based on this information, calculate a separate samplingintensity for each stratum and the total number of sample unitsprorated (allocated) by strata.
An example of optimum allocation is given in section 35.3.

TIMBER CRUISING HANDBOOK
79
32 - 100 PERCENT CRUISE. Every member of the population is visitedand measured. The variable of interest, generally expressed asvolume or value, is an exact measure of the strata. Apply thismethod to finite populations of trees where each tree in thepopulation is measured, but restrict its use to special cases wheresampling is not practical. For example, the trees to be cut from anaccess road right-of-way which lies outside the boundaries of thecutting units may be an appropriate use. Consider 100 percentmeasurement for sales of species or products with exceptionally highvalues.
TIMBER CRUISING HANDBOOK
80
33 - SAMPLE-TREE WITH COMPLETE TALLY.
33.1 - Sample-Tree With Complete Tally Method. In this method,single trees are sampled with equal probability of selection. Definethe population(s) and components to be sampled. Some form ofstratification may be used, either based on species, species groups,diameter breast height (DBH) classes, or a combination of these. Insome cases, define a non-sampled (100-percent measured) component. Such a component might consist of trees above a certain DBH class, ortrees of certain species estimated to have too few trees to yield therequired minimum number of samples at the prescribed samplingfrequency. To use this cruise method, make a complete tally of thepopulation being sampled.
33.11 - Operational Features. Select trees without bias. Selecttrees randomly to meet the requirement for unbiased sample unitselection. Ensure randomness by using dice, poker chips, marbles, orrandom numbers in the selection process.
Systematic sampling (sampling every nth tree) may be used in certaincontrolled situations, where the cruiser does not keep track of theirown samples. In such applications, someone other than the cruiserrecords the cruise data. This is to control personal bias on thepart of the cruiser.
Sample-tree cruising is best done with a crew of three or fourmarker-cruisers and a tallier. This system loses its advantage inscattered timber. Crew members function as both marker and cruiser. The main advantage is that the tallier keeps the tree count and callsthe sample trees to be measured as they come up, thereby removing apossible source of bias in sample selection.
The cruiser receiving the sample-tree call measures the sample-treeand either records the data or calls it in to the tallier. Identifycruise trees for later check cruising with the cruiser'sidentification and the tree number.
Conduct an accurate tree count and avoid missing trees ordouble-counting to ensure accurate results from this method. Thebest way to do this is to mark the tree, then report it to thetallier.
33.12 - Statistical Features. This cruising method may be used withsimple random sampling or with stratified random sampling.
Use simple random sampling for single-product situations, such aspulpwood, where the need for sampling precision is less critical, orwhere the population is not large enough to make stratificationworthwhile.
Prescribe stratified sampling where it is possible to subdivide thepopulation into fairly homogeneous groups (sec. 31.5).
Generally, for sample-tree with complete tally, the variable ofinterest subject to sampling error, is volume per tree.
33.2 - Calculating Sample Size. Calculate optimum sample size usingprecruise data and the series of steps illustrated. In the example,
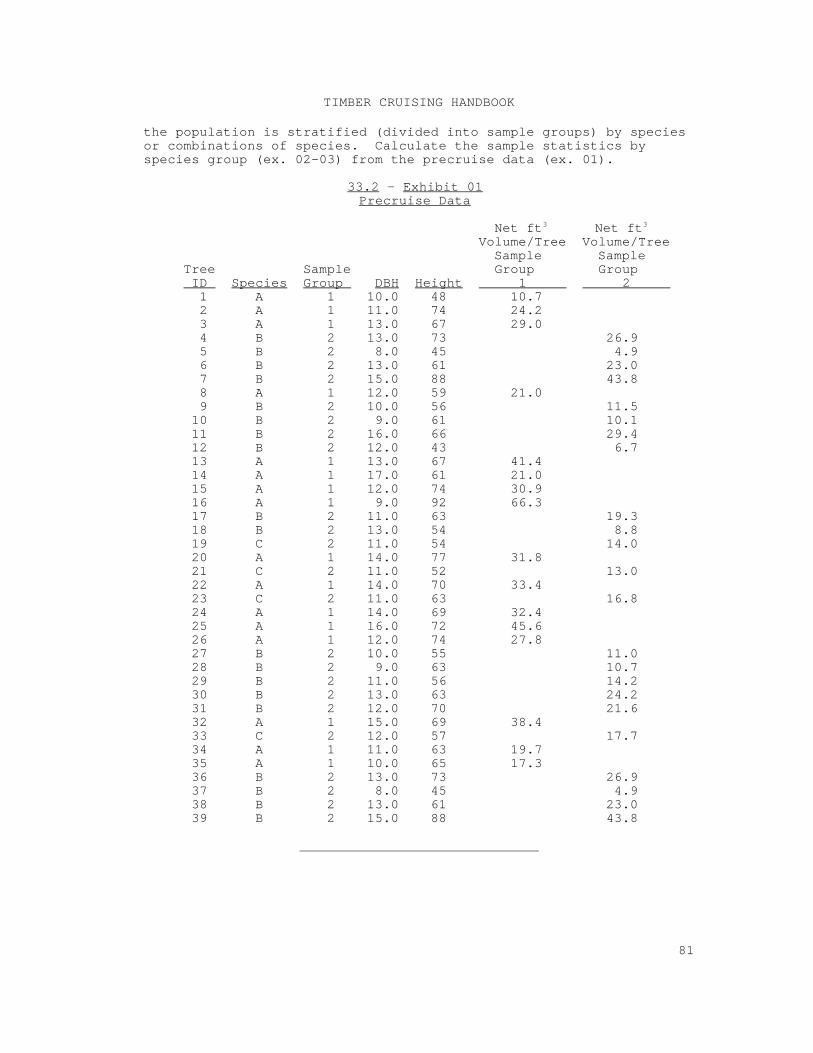
TIMBER CRUISING HANDBOOK
81
the population is stratified (divided into sample groups) by speciesor combinations of species. Calculate the sample statistics byspecies group (ex. 02-03) from the precruise data (ex. 01).
33.2 - Exhibit 01 Precruise Data
Net ft Net ft 3 3
Volume/Tree Volume/Tree Sample Sample
Tree Sample Group Group ID Species Group DBH Height 1 2 1 A 1 10.0 48 10.7 2 A 1 11.0 74 24.2 3 A 1 13.0 67 29.0 4 B 2 13.0 73 26.9 5 B 2 8.0 45 4.9 6 B 2 13.0 61 23.0 7 B 2 15.0 88 43.8 8 A 1 12.0 59 21.0 9 B 2 10.0 56 11.5 10 B 2 9.0 61 10.1 11 B 2 16.0 66 29.4 12 B 2 12.0 43 6.7 13 A 1 13.0 67 41.4 14 A 1 17.0 61 21.0 15 A 1 12.0 74 30.9 16 A 1 9.0 92 66.3 17 B 2 11.0 63 19.3 18 B 2 13.0 54 8.8 19 C 2 11.0 54 14.0 20 A 1 14.0 77 31.8 21 C 2 11.0 52 13.0 22 A 1 14.0 70 33.4 23 C 2 11.0 63 16.8 24 A 1 14.0 69 32.4 25 A 1 16.0 72 45.6 26 A 1 12.0 74 27.8 27 B 2 10.0 55 11.0 28 B 2 9.0 63 10.7 29 B 2 11.0 56 14.2 30 B 2 13.0 63 24.2 31 B 2 12.0 70 21.6 32 A 1 15.0 69 38.4 33 C 2 12.0 57 17.7 34 A 1 11.0 63 19.7 35 A 1 10.0 65 17.3 36 B 2 13.0 73 26.9 37 B 2 8.0 45 4.9 38 B 2 13.0 61 23.0 39 B 2 15.0 88 43.8
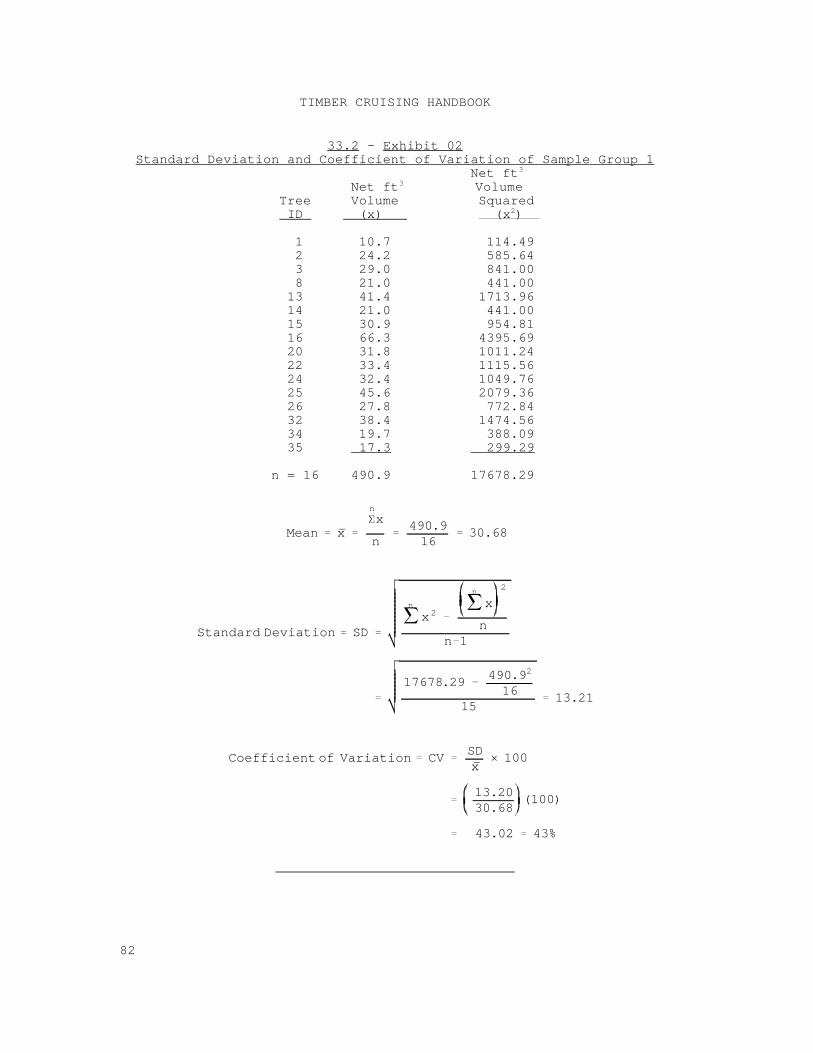
Coefficient of Variation CVSDx
× 100
13.2030.68
(100)
43.02 43%
Mean x
n
x
n490.916
30.68
Standard Deviation SD
n
x 2
n
x2
nn 1
17678.29490.92
1615
13.21
TIMBER CRUISING HANDBOOK
82
33.2 - Exhibit 02Standard Deviation and Coefficient of Variation of Sample Group 1
Net ft3
Net ft Volume3
Tree Volume Squared ID (x) (x ) 2
1 10.7 114.49 2 24.2 585.64 3 29.0 841.00 8 21.0 441.00 13 41.4 1713.96 14 21.0 441.00 15 30.9 954.81 16 66.3 4395.69 20 31.8 1011.24 22 33.4 1115.56 24 32.4 1049.76 25 45.6 2079.36 26 27.8 772.84 32 38.4 1474.56 34 19.7 388.09 35 17.3 299.29
n = 16 490.9 17678.29

Coefficient of Variation CVSDx
× 100
10.7218.52
(100)
57.88 58%
Mean x
n
x
n425.923
18.52
Standard Deviation SD
n
x 2
n
x2
nn 1
10415.87425.92
2322
10.72
TIMBER CRUISING HANDBOOK
83
33.2 - Exhibit 03 Standard Deviation and Coefficient of Variation of Sample Group 2
Net ft3
Net ft Volume3
Tree Volume Squared ID (x) (x ) 2
4 26.9 723.61 5 4.9 24.01 6 23.0 529.00 7 43.8 1918.44 9 11.5 132.25 10 10.1 102.01 11 29.1 846.81 12 6.7 44.89 17 19.3 372.49 18 8.8 77.44 19 14.0 196.00 21 13.0 169.00 23 16.8 282.24 27 11.0 121.00 28 10.7 114.49 29 14.2 201.64 30 24.2 585.64 31 21.6 466.56 33 17.7 313.29 36 26.9 723.61 37 4.9 24.01 38 23.0 529.00 39 43.8 1918.44
n = 23 425.9 10415.87
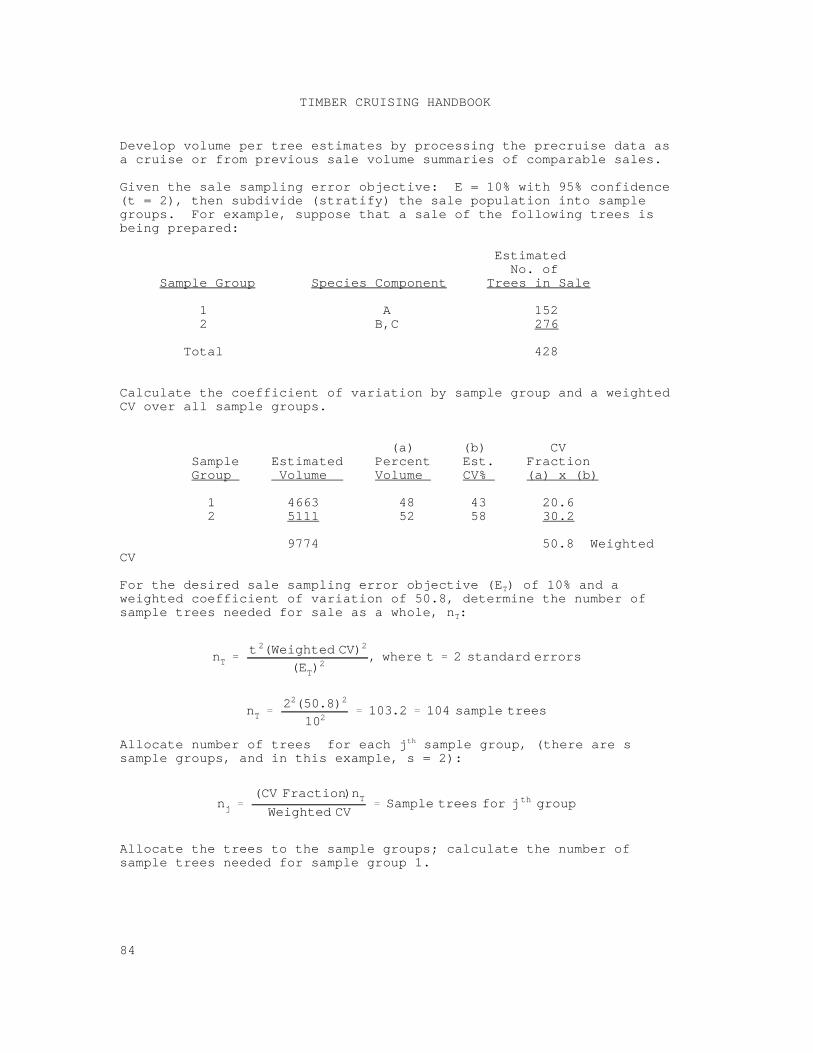
nTt 2(Weighted CV)2
(ET)2
, where t 2 standard errors
nT22(50.8)2
102103.2 104 sample trees
nj(CV Fraction)nTWeighted CV
Sample trees for j th group
TIMBER CRUISING HANDBOOK
84
Develop volume per tree estimates by processing the precruise data asa cruise or from previous sale volume summaries of comparable sales.
Given the sale sampling error objective: E = 10% with 95% confidence(t = 2), then subdivide (stratify) the sale population into samplegroups. For example, suppose that a sale of the following trees isbeing prepared:
Estimated No. of
Sample Group Species Component Trees in Sale
1 A 152 2 B,C 276
Total 428
Calculate the coefficient of variation by sample group and a weightedCV over all sample groups.
(a) (b) CV Sample Estimated Percent Est. Fraction Group Volume Volume CV% (a) x (b)
1 4663 48 43 20.6 2 5111 52 58 30.2
9774 50.8 WeightedCV
For the desired sale sampling error objective (E ) of 10% and aT
weighted coefficient of variation of 50.8, determine the number ofsample trees needed for sale as a whole, n :T
Allocate number of trees for each j sample group, (there are sth
sample groups, and in this example, s = 2):
Allocate the trees to the sample groups; calculate the number ofsample trees needed for sample group 1.
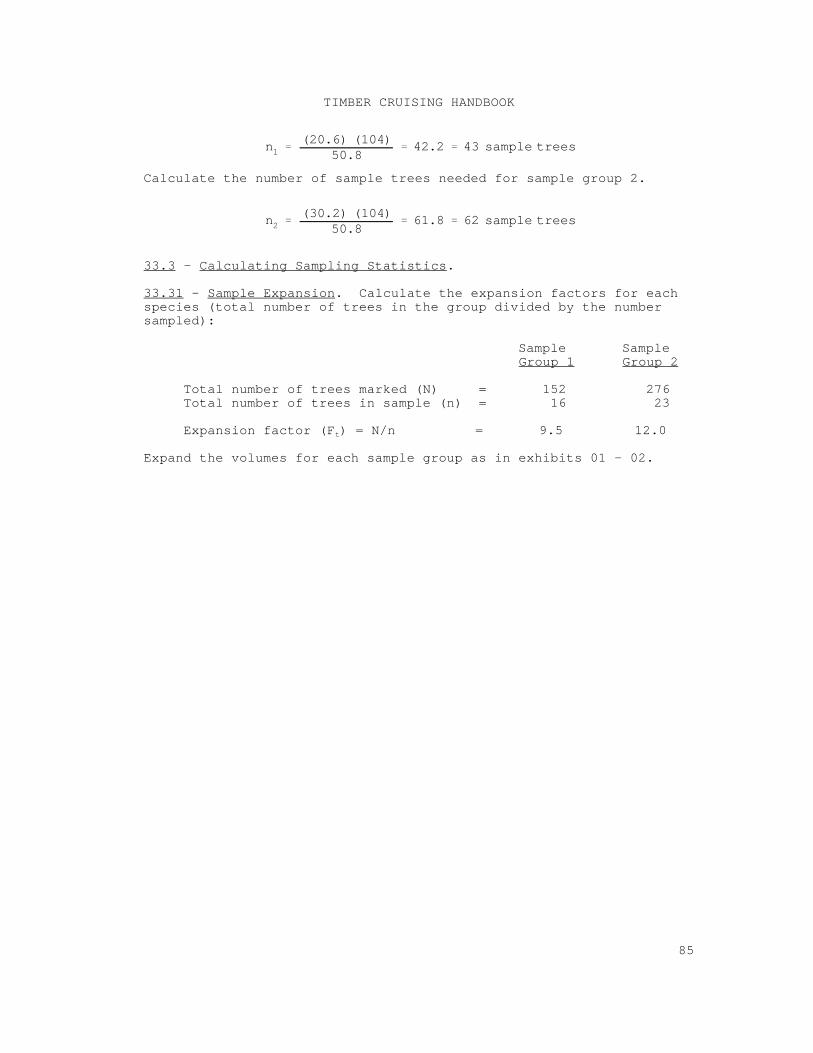
n1(20.6) (104)
50.842.2 43 sample trees
n2(30.2) (104)
50.861.8 62 sample trees
TIMBER CRUISING HANDBOOK
85
Calculate the number of sample trees needed for sample group 2.
33.3 - Calculating Sampling Statistics.
33.31 - Sample Expansion. Calculate the expansion factors for eachspecies (total number of trees in the group divided by the numbersampled):
Sample Sample Group 1 Group 2
Total number of trees marked (N) = 152 276 Total number of trees in sample (n) = 16 23
Expansion factor (F ) = N/n = 9.5 12.0t
Expand the volumes for each sample group as in exhibits 01 - 02.
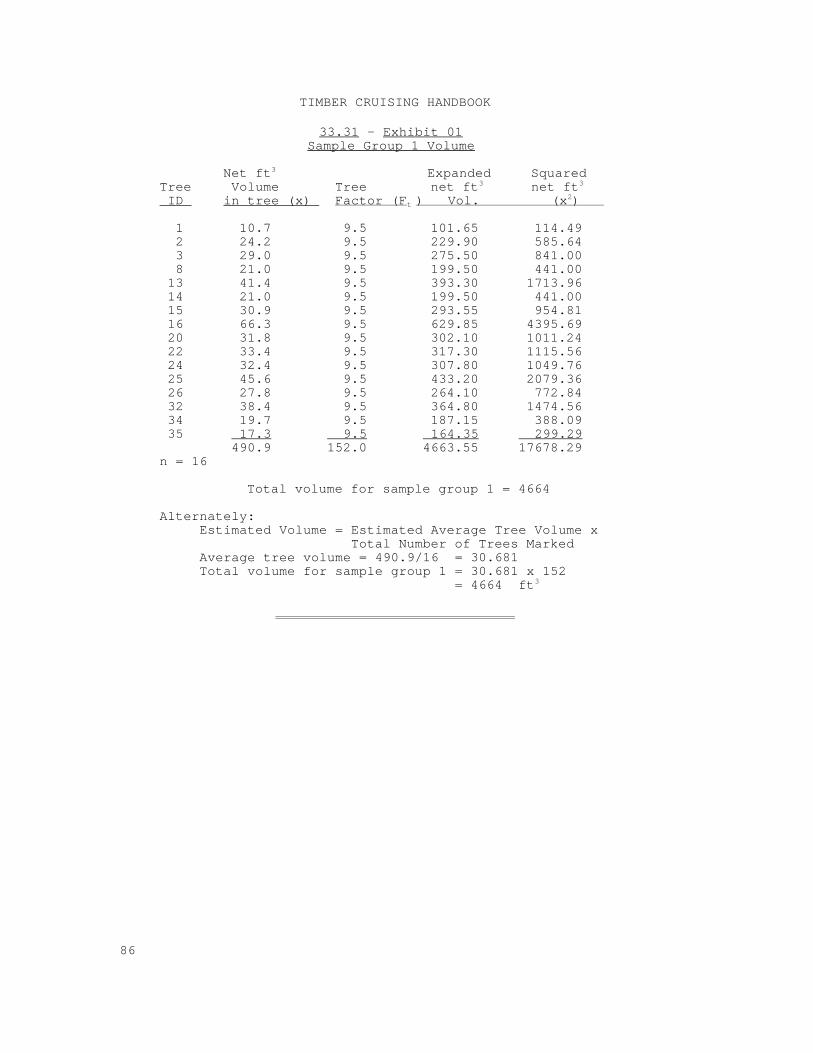
TIMBER CRUISING HANDBOOK
86
33.31 - Exhibit 01 Sample Group 1 Volume
Net ft Expanded Squared 3
Tree Volume Tree net ft net ft 3 3
ID in tree (x) Factor (F ) Vol. (x ) t 2
1 10.7 9.5 101.65 114.49 2 24.2 9.5 229.90 585.64 3 29.0 9.5 275.50 841.00 8 21.0 9.5 199.50 441.00 13 41.4 9.5 393.30 1713.96 14 21.0 9.5 199.50 441.00 15 30.9 9.5 293.55 954.81 16 66.3 9.5 629.85 4395.69 20 31.8 9.5 302.10 1011.24 22 33.4 9.5 317.30 1115.56 24 32.4 9.5 307.80 1049.76 25 45.6 9.5 433.20 2079.36 26 27.8 9.5 264.10 772.84 32 38.4 9.5 364.80 1474.56 34 19.7 9.5 187.15 388.09 35 17.3 9.5 164.35 299.29 490.9 152.0 4663.55 17678.29 n = 16
Total volume for sample group 1 = 4664
Alternately:Estimated Volume = Estimated Average Tree Volume x Total Number of Trees MarkedAverage tree volume = 490.9/16 = 30.681Total volume for sample group 1 = 30.681 x 152 = 4664 ft3
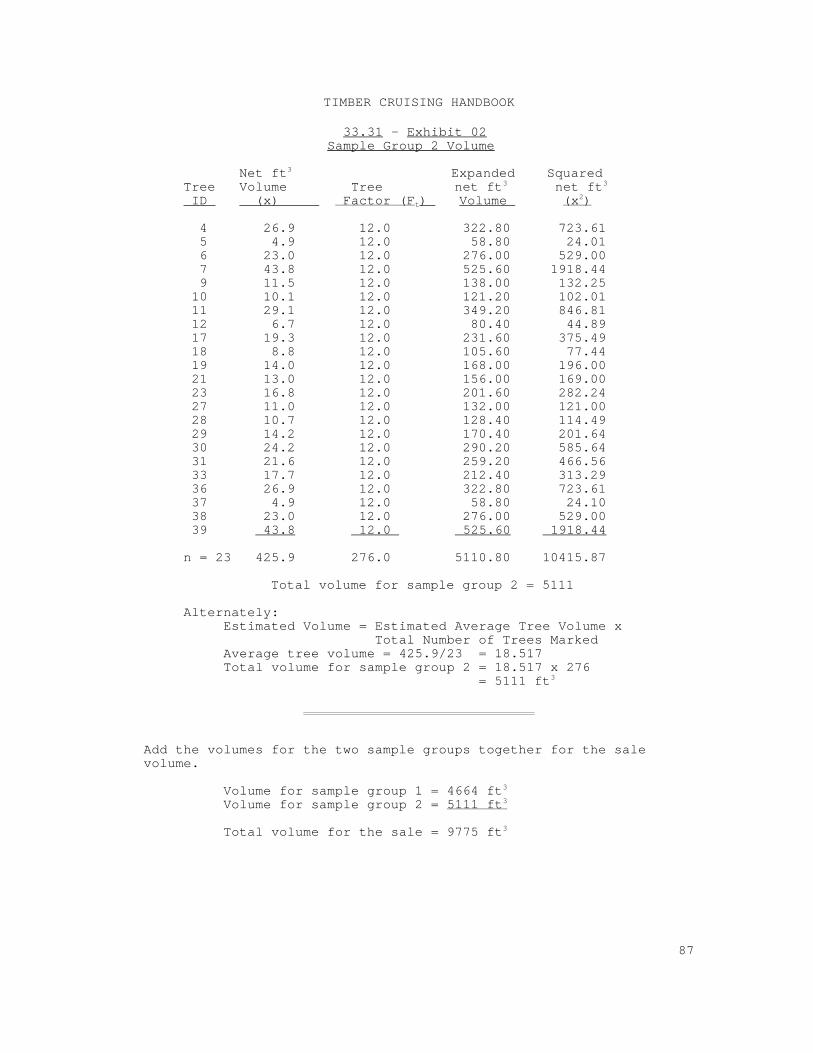
TIMBER CRUISING HANDBOOK
87
33.31 - Exhibit 02 Sample Group 2 Volume
Net ft Expanded Squared 3
Tree Volume Tree net ft net ft 3 3
ID (x) Factor (F ) Volume (x )t2
4 26.9 12.0 322.80 723.61 5 4.9 12.0 58.80 24.01 6 23.0 12.0 276.00 529.00 7 43.8 12.0 525.60 1918.44 9 11.5 12.0 138.00 132.25 10 10.1 12.0 121.20 102.01 11 29.1 12.0 349.20 846.81 12 6.7 12.0 80.40 44.89 17 19.3 12.0 231.60 375.49 18 8.8 12.0 105.60 77.44 19 14.0 12.0 168.00 196.00 21 13.0 12.0 156.00 169.00
23 16.8 12.0 201.60 282.24 27 11.0 12.0 132.00 121.00 28 10.7 12.0 128.40 114.49 29 14.2 12.0 170.40 201.64 30 24.2 12.0 290.20 585.64 31 21.6 12.0 259.20 466.56 33 17.7 12.0 212.40 313.29 36 26.9 12.0 322.80 723.61 37 4.9 12.0 58.80 24.10 38 23.0 12.0 276.00 529.00
39 43.8 12.0 525.60 1918.44
n = 23 425.9 276.0 5110.80 10415.87
Total volume for sample group 2 = 5111
Alternately:Estimated Volume = Estimated Average Tree Volume x Total Number of Trees MarkedAverage tree volume = 425.9/23 = 18.517Total volume for sample group 2 = 18.517 x 276
= 5111 ft 3
Add the volumes for the two sample groups together for the salevolume.
Volume for sample group 1 = 4664 ft3
Volume for sample group 2 = 5111 ft3
Total volume for the sale = 9775 ft3
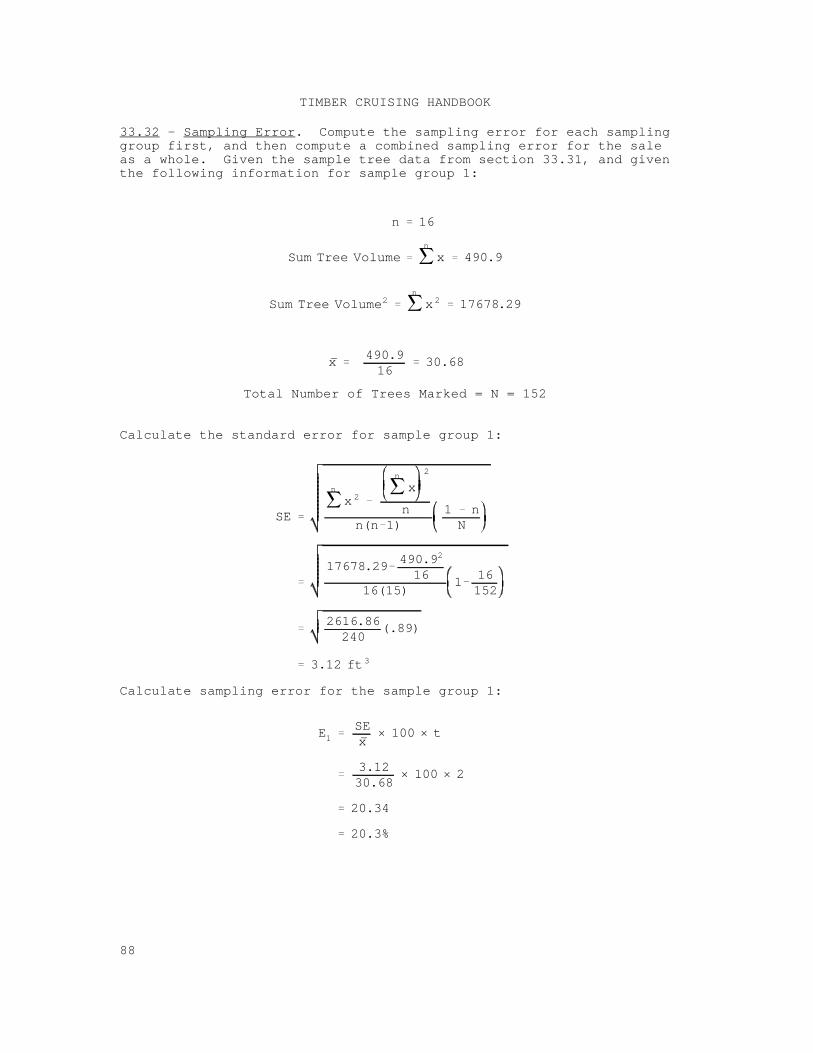
n 16
Sum Tree Volumen
x 490.9
Sum Tree Volume2n
x 2 17678.29
x490.916
30.68
SE
n
x 2
n
x2
nn(n 1)
1 nN
17678.29490.92
1616(15)
116152
2616.86240
(.89)
3.12 ft3
E1SEx
× 100 × t
3.1230.68
× 100 × 2
20.34
20.3%
TIMBER CRUISING HANDBOOK
88
33.32 - Sampling Error. Compute the sampling error for each samplinggroup first, and then compute a combined sampling error for the saleas a whole. Given the sample tree data from section 33.31, and giventhe following information for sample group 1:
Total Number of Trees Marked = N = 152
Calculate the standard error for sample group 1:
Calculate sampling error for the sample group 1:
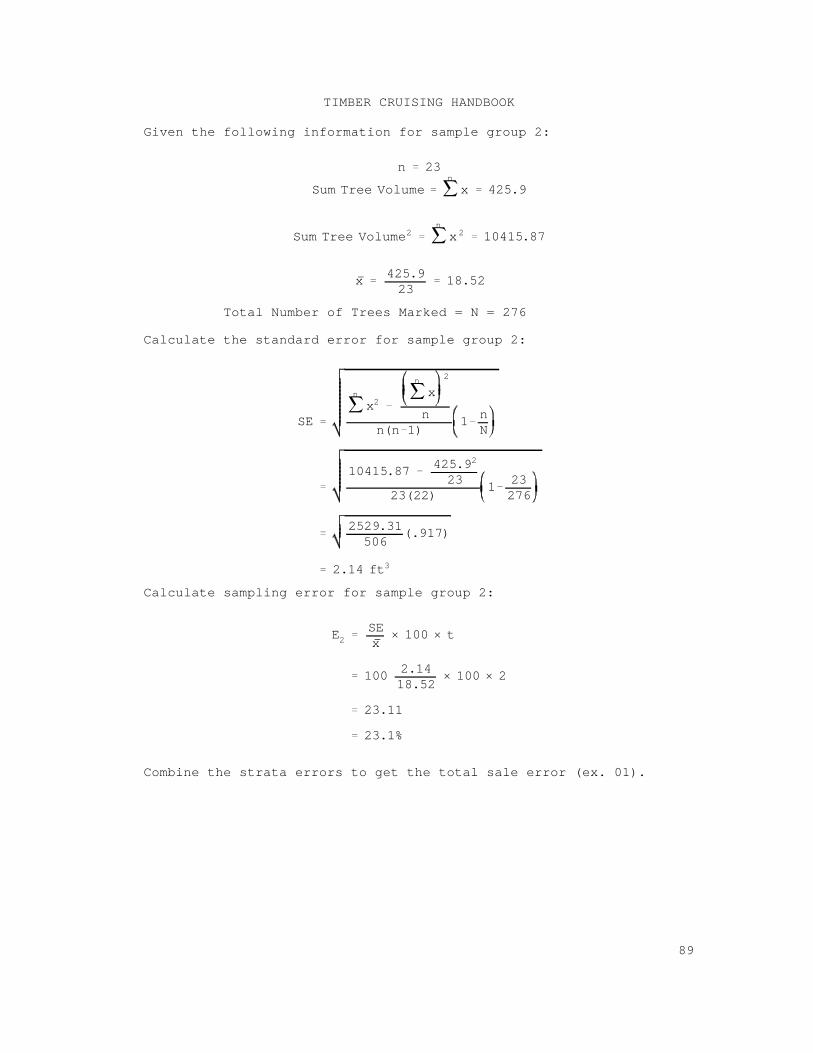
n 23
Sum Tree Volumen
x 425.9
Sum Tree Volume2n
x 2 10415.87
x425.923
18.52
SE
n
x2
n
x2
nn(n 1)
1nN
10415.87425.92
2323(22)
123276
2529.31506
(.917)
2.14 ft3
E2SEx
× 100 × t
1002.1418.52
× 100 × 2
23.11
23.1%
TIMBER CRUISING HANDBOOK
89
Given the following information for sample group 2:
Total Number of Trees Marked = N = 276
Calculate the standard error for sample group 2:
Calculate sampling error for sample group 2:
Combine the strata errors to get the total sale error (ex. 01).
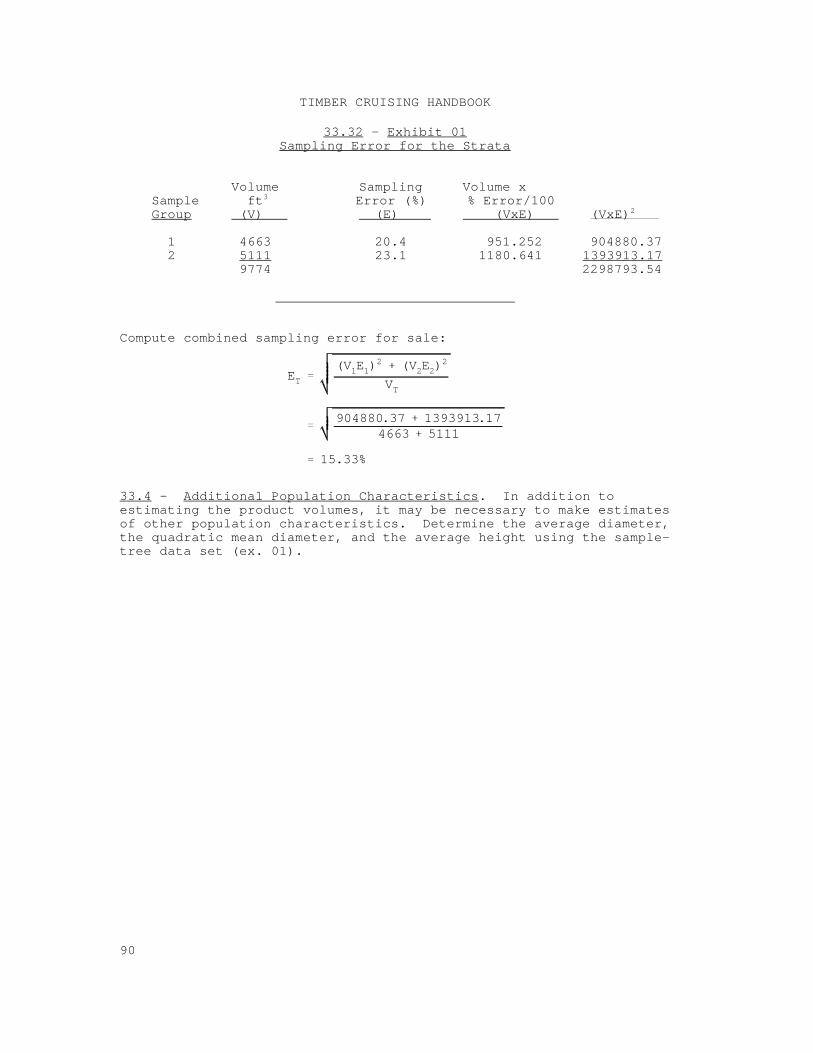
ET(V1E1)
2 (V2E2)2
VT
904880.37 1393913.174663 5111
15.33%
TIMBER CRUISING HANDBOOK
90
33.32 - Exhibit 01Sampling Error for the Strata
Volume Sampling Volume x Sample ft Error (%) % Error/1003
Group (V) (E) (VxE) (VxE) 2
1 4663 20.4 951.252 904880.37 2 5111 23.1 1180.641 1393913.17 9774 2298793.54
Compute combined sampling error for sale:
33.4 - Additional Population Characteristics. In addition toestimating the product volumes, it may be necessary to make estimatesof other population characteristics. Determine the average diameter,the quadratic mean diameter, and the average height using the sample-tree data set (ex. 01).
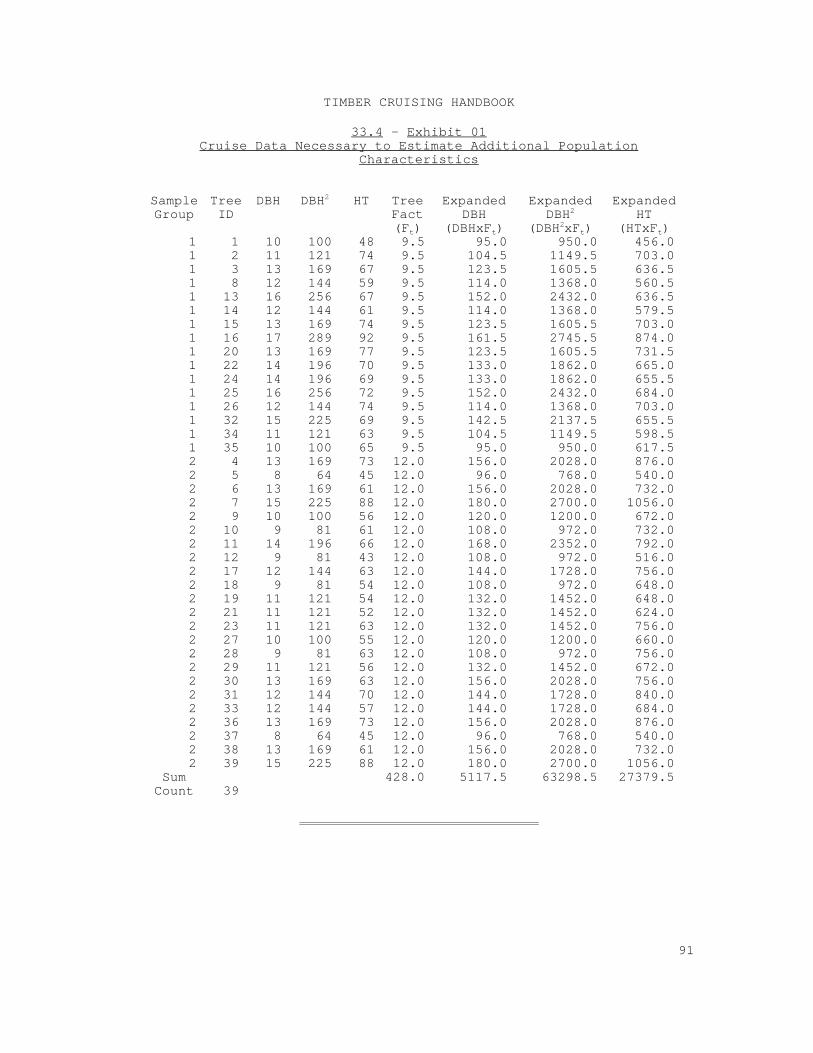
TIMBER CRUISING HANDBOOK
91
33.4 - Exhibit 01Cruise Data Necessary to Estimate Additional Population
Characteristics
Sample Tree DBH DBH HT Tree Expanded Expanded ExpandedGroup ID Fact DBH DBH HT
2
(F ) (DBHxF ) (DBH xF ) (HTxF )t t
2
2t t
1 1 10 100 48 9.5 95.0 950.0 456.0 1 2 11 121 74 9.5 104.5 1149.5 703.0 1 3 13 169 67 9.5 123.5 1605.5 636.5 1 8 12 144 59 9.5 114.0 1368.0 560.5 1 13 16 256 67 9.5 152.0 2432.0 636.5 1 14 12 144 61 9.5 114.0 1368.0 579.5 1 15 13 169 74 9.5 123.5 1605.5 703.0 1 16 17 289 92 9.5 161.5 2745.5 874.0 1 20 13 169 77 9.5 123.5 1605.5 731.5 1 22 14 196 70 9.5 133.0 1862.0 665.0 1 24 14 196 69 9.5 133.0 1862.0 655.5 1 25 16 256 72 9.5 152.0 2432.0 684.0 1 26 12 144 74 9.5 114.0 1368.0 703.0 1 32 15 225 69 9.5 142.5 2137.5 655.5 1 34 11 121 63 9.5 104.5 1149.5 598.5 1 35 10 100 65 9.5 95.0 950.0 617.5 2 4 13 169 73 12.0 156.0 2028.0 876.0 2 5 8 64 45 12.0 96.0 768.0 540.0 2 6 13 169 61 12.0 156.0 2028.0 732.0 2 7 15 225 88 12.0 180.0 2700.0 1056.0 2 9 10 100 56 12.0 120.0 1200.0 672.0 2 10 9 81 61 12.0 108.0 972.0 732.0 2 11 14 196 66 12.0 168.0 2352.0 792.0 2 12 9 81 43 12.0 108.0 972.0 516.0 2 17 12 144 63 12.0 144.0 1728.0 756.0 2 18 9 81 54 12.0 108.0 972.0 648.0 2 19 11 121 54 12.0 132.0 1452.0 648.0 2 21 11 121 52 12.0 132.0 1452.0 624.0 2 23 11 121 63 12.0 132.0 1452.0 756.0 2 27 10 100 55 12.0 120.0 1200.0 660.0 2 28 9 81 63 12.0 108.0 972.0 756.0 2 29 11 121 56 12.0 132.0 1452.0 672.0 2 30 13 169 63 12.0 156.0 2028.0 756.0 2 31 12 144 70 12.0 144.0 1728.0 840.0 2 33 12 144 57 12.0 144.0 1728.0 684.0 2 36 13 169 73 12.0 156.0 2028.0 876.0 2 37 8 64 45 12.0 96.0 768.0 540.0 2 38 13 169 61 12.0 156.0 2028.0 732.0 2 39 15 225 88 12.0 180.0 2700.0 1056.0
Sum 428.0 5117.5 63298.5 27379.5 Count 39
Mean DBH
n
DBH × Ft
n
Ft
5117.5428
12.0 inches
Quadratic Mean Diameter
n
DBH2 × Ftn
Ft
63298.5428
12.2 inches
Mean Height
n
HT × Ft
n
Ft
27379.5429
64 feet
TIMBER CRUISING HANDBOOK
92
Calculate the additional population characteristics:
33.5 - Application. Apply this method in the following cases:
1. Stands requiring partial cutting, in which the trees to beleft are marked, or stands requiring overstory removal where trees tobe cut are marked.
2. Small clearcut areas, usually less than 25 acres with ahigh coefficient of variation (plots or points), for which the numberof sample points or plots needed for prescribed accuracy standardswould be excessive (more than 1 point per acre).
3. Sales having numerous species, for which stratification canreduce variation, resulting in a light sample intensity relative toother cruising systems.
TIMBER CRUISING HANDBOOK
93
34 - FIXED PLOTS.
34.1 - Fixed Plot Method. This is an area sampling method usingplots of a specified area so trees in the population are selectedwith equal probability. The plots may be either circular orrectangular. The population is the total number of plots ofspecified area contained in the proposed area to be cruised. Forexample, the population of fifth-acre plots on a 48-acre tract is240. Cruises using fixed area plots are customarily described interms of the percentage of tract area covered. On this same tract, a10-percent cruise would sample 4.8 acres, the equivalent of 24fifth-acre plots.
34.11 - Operational Features. Establish a specified number of sampleplots of equal area in an unbiased manner over the tract of timber tobe cruised. Measure each tree located within each sample plotboundary as a sample tree.
The cruise results in an estimate of average volume per acre. Determine the area of the tract by survey (ch. 50). Determine totalestimated tract volume by multiplying estimated average volume peracre by the number of acres in the tract.
34.12 - Statistical Features. In this cruising method, each tree hasan equal probability of being selected.
Stratification can be an advantage in plot sampling to reducesampling variation and to reduce the number of plots needed. Ordinarily, stratify by similarity (homogeneity) of timberconditions. Subdivide the tract to be cruised into areas havingsimilar conditions of density, product components, or othercharacteristics. Sample each stratum separately, and compute thesample statistics as for a stratified sample.
The use of sample groups (stratification of individual trees on apoint) is not recommended due to of the difficulty in determining asampling error.
The variable of interest, subject to sampling error, is averagevolume or value per acre.
34.2 - Field Procedures. Use the following field proceduresappropriate to the situation. Evaluate the plot shape using thefollowing criteria:
1. Circular plots. The center of each plot is definitivelymarked so it can be determined accurately whether borderline treesare in or out of the plot. Because there is less perimeter in acircular plot than a rectangular plot of the same area, there arefewer borderline trees.
2. Rectangular plots. With the steel tape on the centerlineof the plot, the cruiser is able to rapidly and systematicallyprogress through the plot. The rectangular plot allows cruiser towork continuously forward.
34.21 - Sample Plot Location and Monumentation of Plots and Trees. Plot size may vary between sampling strata. However, use only one
TIMBER CRUISING HANDBOOK
94
plot size in each stratum. Gear plot size to tree density and selecta plot size that will ensure an average of about 4 to 8 trees perplot. Consider stand variation and species composition indetermining plot size.
Plot placement may follow various patterns, but locate plots in anunbiased manner. Select the location of the starting plot randomlyif the sample plots are located on a grid.
Monument plot locations. Identify cruise starting points and plotlocations in a way that make the locations highly visible in thefield to enable a check cruiser to find them. File a writtendescription with the cruise information to facilitate plotrelocation.
Identify plot centers with either a wooden stake or wire pin. Numberthe tallied trees clockwise from north on the face of the tree towardthe plot center.
34.22 - Establishing Plot Boundaries. Establish plot boundaries bymeasurement, not by pacing. Determine circular plot boundaries bymeasuring the radius from the marked plot center. Determinerectangular plot boundaries from the centerline defined by the chainstretched between the marked end-line centers. Exhibit 01 listsradii for a variety of circular plot sizes.
34.22 - Exhibit 01 Plot Radius Table
Feet Acre Radius
1 117.8 1/2 83.3 1/3 68.0 1/4 58.9 1/5 52.7 1/10 37.2 1/20 26.3 1/25 23.5 1/40 18.6 1/50 16.7 1/100 11.8 1/300 6.8 1/500 5.3 1/1000 3.7
Determine if problem trees, such as forked, leaning, or down trees,are in or out, depending on the location of tree DBH in relation tothe plot boundary. Use tree DBH as the point of reference ratherthan the base of the tree because the tree base is considered to bean ambiguous reference point, particularly in the case of uprootedtrees. Consider the following examples:
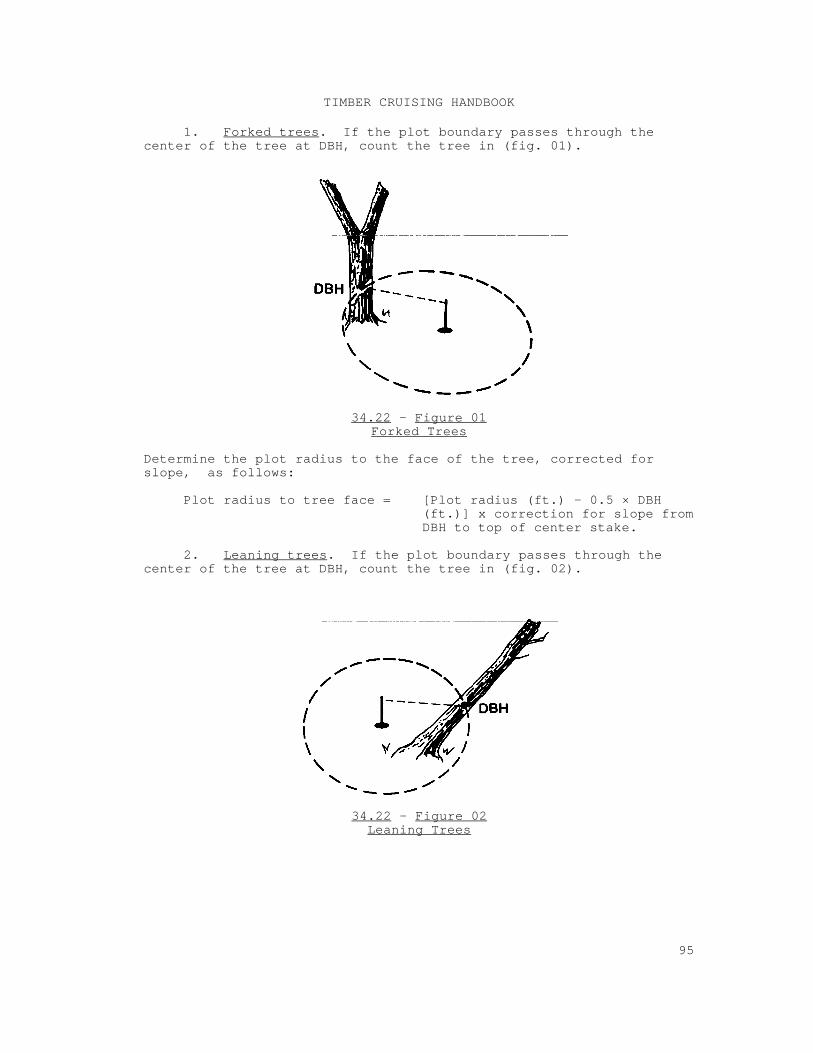
TIMBER CRUISING HANDBOOK
95
1. Forked trees. If the plot boundary passes through thecenter of the tree at DBH, count the tree in (fig. 01).
34.22 - Figure 01Forked Trees
Determine the plot radius to the face of the tree, corrected forslope, as follows:
Plot radius to tree face = [Plot radius (ft.) - 0.5 × DBH(ft.)] x correction for slope fromDBH to top of center stake.
2. Leaning trees. If the plot boundary passes through thecenter of the tree at DBH, count the tree in (fig. 02).
34.22 - Figure 02Leaning Trees
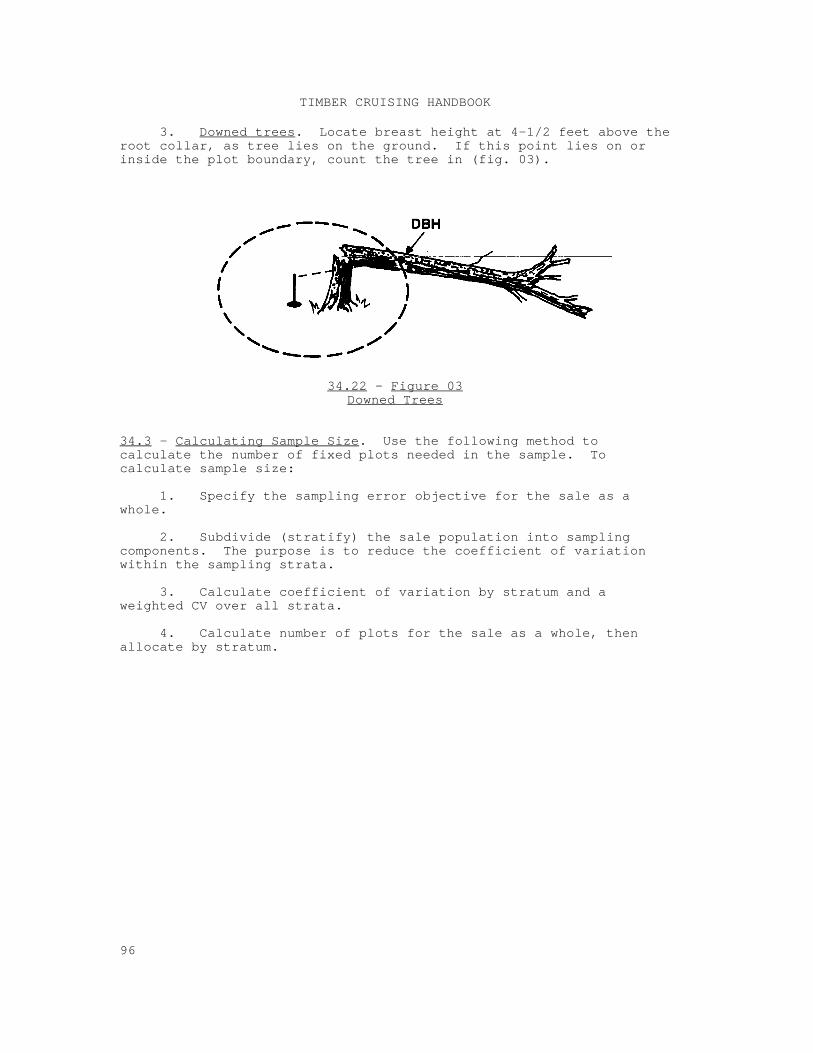
TIMBER CRUISING HANDBOOK
96
3. Downed trees. Locate breast height at 4-1/2 feet above theroot collar, as tree lies on the ground. If this point lies on orinside the plot boundary, count the tree in (fig. 03).
34.22 - Figure 03Downed Trees
34.3 - Calculating Sample Size. Use the following method tocalculate the number of fixed plots needed in the sample. Tocalculate sample size:
1. Specify the sampling error objective for the sale as awhole.
2. Subdivide (stratify) the sale population into samplingcomponents. The purpose is to reduce the coefficient of variationwithin the sampling strata.
3. Calculate coefficient of variation by stratum and aweighted CV over all strata.
4. Calculate number of plots for the sale as a whole, thenallocate by stratum.
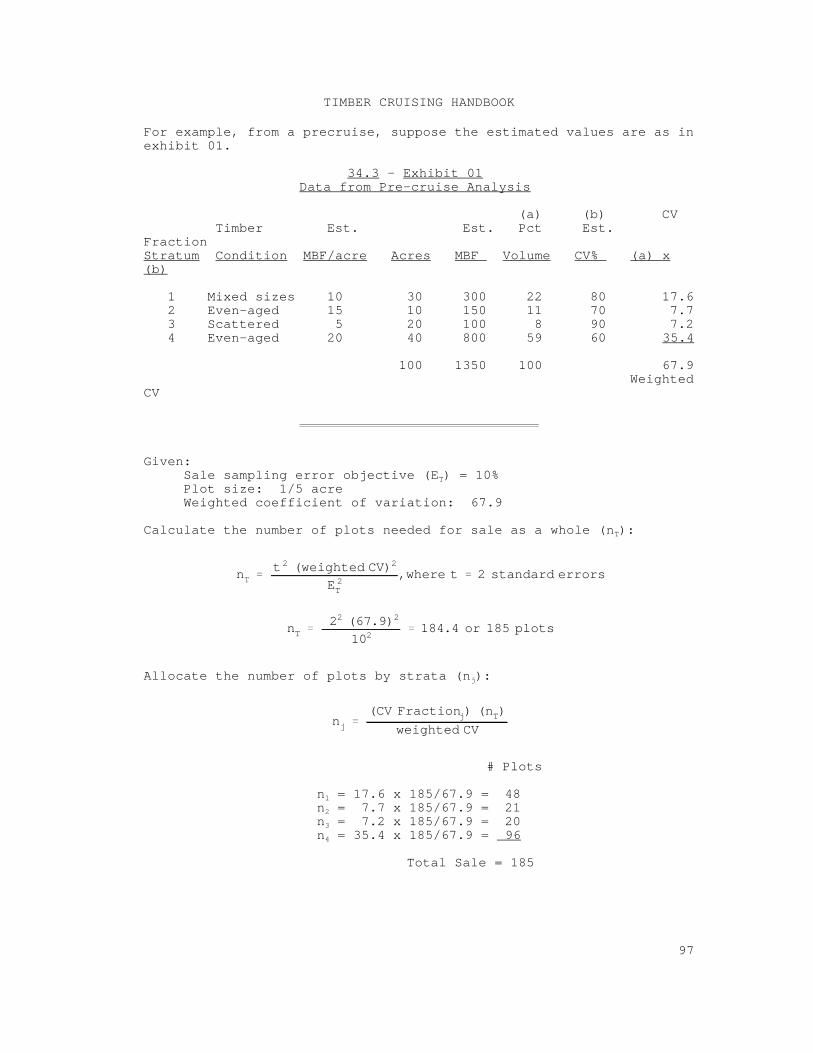
nTt 2 (weighted CV)2
E 2T
,where t 2 standard errors
nT22 (67.9)2
102184.4 or 185 plots
nj(CV Fractionj) (nT)
weighted CV
TIMBER CRUISING HANDBOOK
97
For example, from a precruise, suppose the estimated values are as inexhibit 01.
34.3 - Exhibit 01 Data from Pre-cruise Analysis
(a) (b) CV Timber Est. Est. Pct Est. FractionStratum Condition MBF/acre Acres MBF Volume CV% (a) x(b)
1 Mixed sizes 10 30 300 22 80 17.6 2 Even-aged 15 10 150 11 70 7.7 3 Scattered 5 20 100 8 90 7.2 4 Even-aged 20 40 800 59 60 35.4
100 1350 100 67.9 WeightedCV
Given:Sale sampling error objective (E ) = 10%T
Plot size: 1/5 acreWeighted coefficient of variation: 67.9
Calculate the number of plots needed for sale as a whole (n ):T
Allocate the number of plots by strata (n ):j
# Plots
n = 17.6 x 185/67.9 = 481
n = 7.7 x 185/67.9 = 212
n = 7.2 x 185/67.9 = 203
n = 35.4 x 185/67.9 = 964
Total Sale = 185
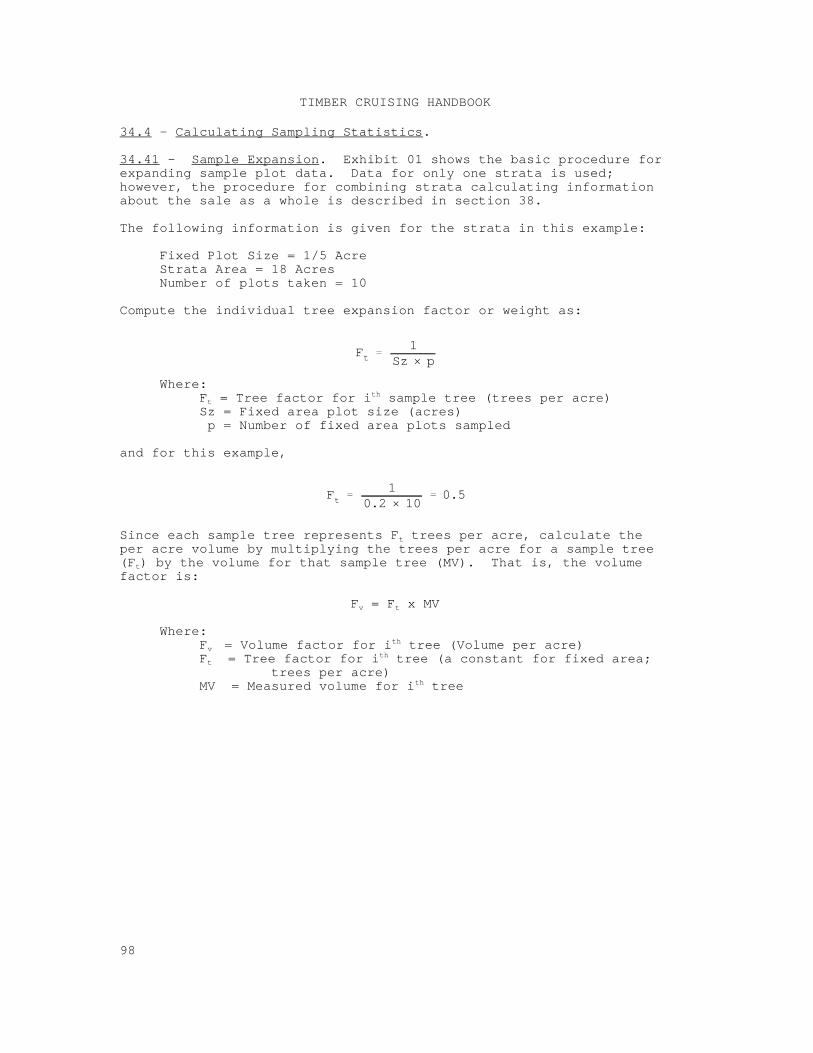
Ft1
0.2 × 100.5
Ft1
Sz × p
TIMBER CRUISING HANDBOOK
98
34.4 - Calculating Sampling Statistics.
34.41 - Sample Expansion. Exhibit 01 shows the basic procedure forexpanding sample plot data. Data for only one strata is used;however, the procedure for combining strata calculating informationabout the sale as a whole is described in section 38.
The following information is given for the strata in this example:
Fixed Plot Size = 1/5 AcreStrata Area = 18 AcresNumber of plots taken = 10
Compute the individual tree expansion factor or weight as:
Where:F = Tree factor for i sample tree (trees per acre)t
th
Sz = Fixed area plot size (acres) p = Number of fixed area plots sampled
and for this example,
Since each sample tree represents F trees per acre, calculate thet
per acre volume by multiplying the trees per acre for a sample tree(F ) by the volume for that sample tree (MV). That is, the volumet
factor is:
F = F x MVv t
Where:F = Volume factor for i tree (Volume per acre)v
th
F = Tree factor for i tree (a constant for fixed area; tth
trees per acre)MV = Measured volume for i treeth
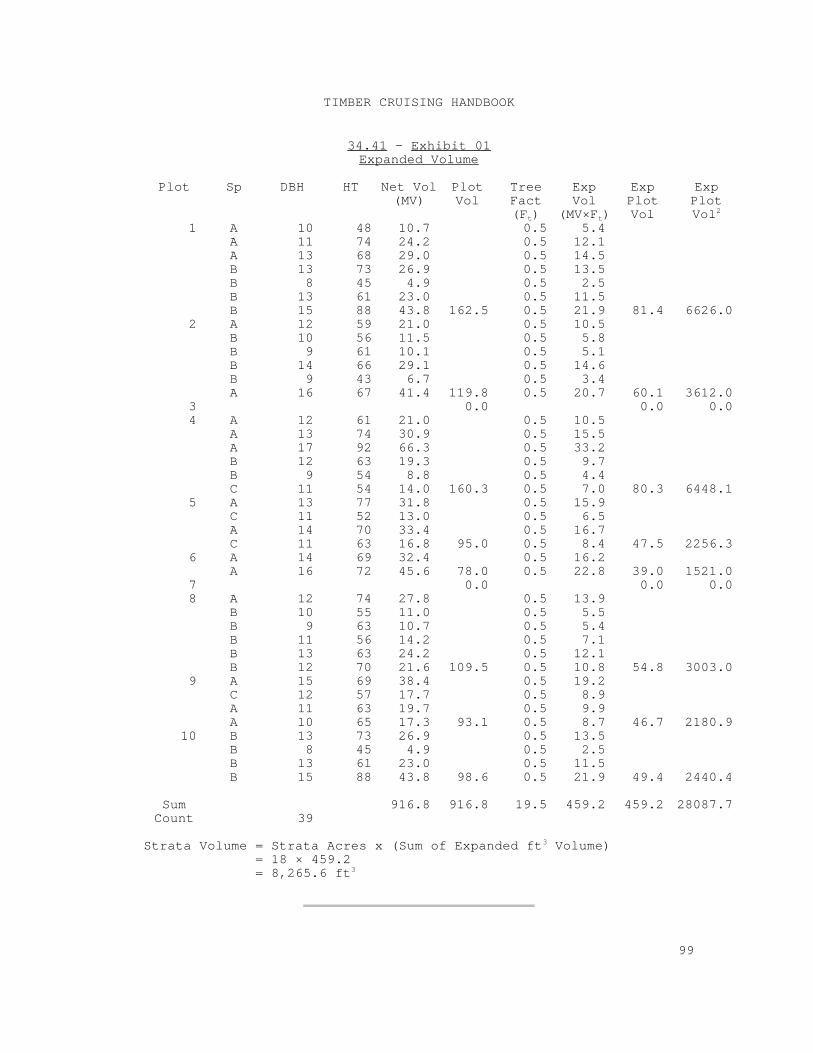
TIMBER CRUISING HANDBOOK
99
34.41 - Exhibit 01Expanded Volume
Plot Sp DBH HT Net Vol Plot Tree Exp Exp Exp(MV) Vol Fact Vol Plot Plot
(F ) (MV×F ) Vol Volt t2
1 A 10 48 10.7 0.5 5.4 A 11 74 24.2 0.5 12.1 A 13 68 29.0 0.5 14.5 B 13 73 26.9 0.5 13.5 B 8 45 4.9 0.5 2.5 B 13 61 23.0 0.5 11.5 B 15 88 43.8 162.5 0.5 21.9 81.4 6626.0
2 A 12 59 21.0 0.5 10.5 B 10 56 11.5 0.5 5.8 B 9 61 10.1 0.5 5.1 B 14 66 29.1 0.5 14.6 B 9 43 6.7 0.5 3.4 A 16 67 41.4 119.8 0.5 20.7 60.1 3612.0
3 0.0 0.0 0.0 4 A 12 61 21.0 0.5 10.5
A 13 74 30.9 0.5 15.5 A 17 92 66.3 0.5 33.2 B 12 63 19.3 0.5 9.7 B 9 54 8.8 0.5 4.4 C 11 54 14.0 160.3 0.5 7.0 80.3 6448.1
5 A 13 77 31.8 0.5 15.9 C 11 52 13.0 0.5 6.5 A 14 70 33.4 0.5 16.7 C 11 63 16.8 95.0 0.5 8.4 47.5 2256.3
6 A 14 69 32.4 0.5 16.2 A 16 72 45.6 78.0 0.5 22.8 39.0 1521.0
7 0.0 0.0 0.0 8 A 12 74 27.8 0.5 13.9
B 10 55 11.0 0.5 5.5 B 9 63 10.7 0.5 5.4 B 11 56 14.2 0.5 7.1 B 13 63 24.2 0.5 12.1 B 12 70 21.6 109.5 0.5 10.8 54.8 3003.0
9 A 15 69 38.4 0.5 19.2 C 12 57 17.7 0.5 8.9 A 11 63 19.7 0.5 9.9 A 10 65 17.3 93.1 0.5 8.7 46.7 2180.9
10 B 13 73 26.9 0.5 13.5 B 8 45 4.9 0.5 2.5 B 13 61 23.0 0.5 11.5 B 15 88 43.8 98.6 0.5 21.9 49.4 2440.4
Sum 916.8 916.8 19.5 459.2 459.2 28087.7 Count 39
Strata Volume = Strata Acres x (Sum of Expanded ft Volume)3
= 18 × 459.2 = 8,265.6 ft3

TIMBER CRUISING HANDBOOK
100
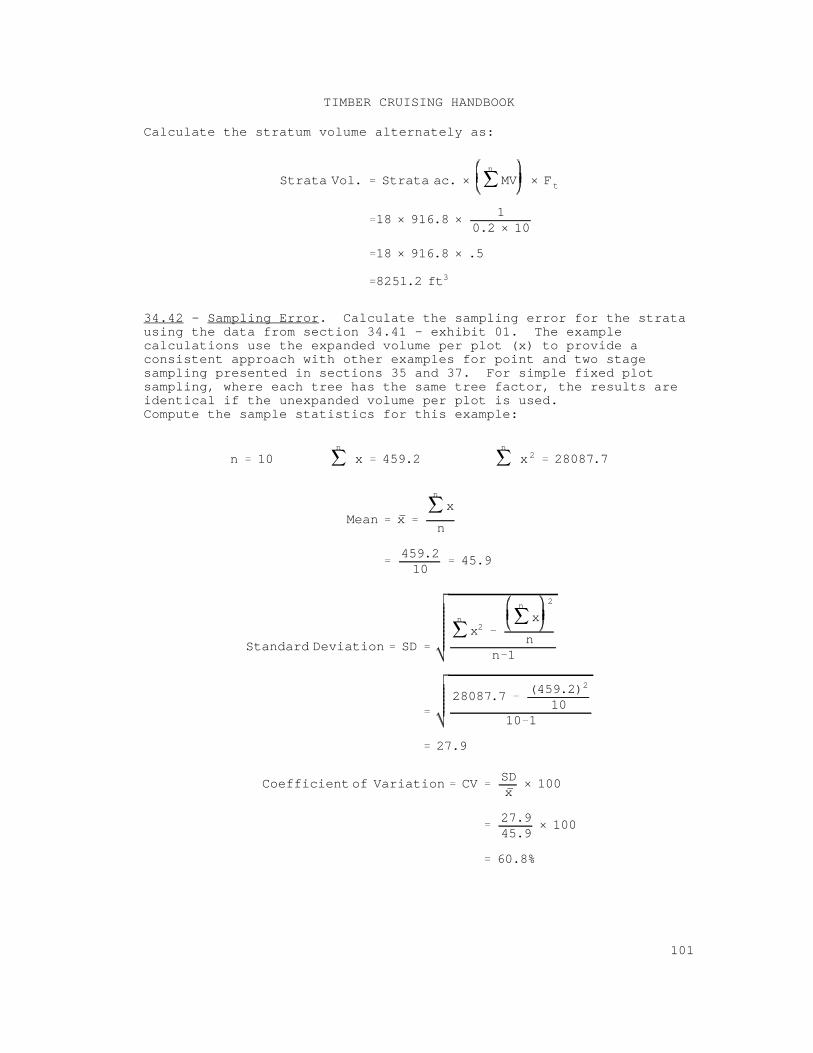
Strata Vol. Strata ac. ×n
MV × Ft
18 × 916.8 ×1
0.2 × 10
18 × 916.8 × .5
8251.2 ft3
n 10n
x 459.2n
x 2 28087.7
Mean x
n
x
n
459.210
45.9
Standard Deviation SD
n
x2
n
x2
nn 1
28087.7(459.2)2
1010 1
27.9
Coefficient of Variation CVSDx
× 100
27.945.9
× 100
60.8%
TIMBER CRUISING HANDBOOK
101
Calculate the stratum volume alternately as:
34.42 - Sampling Error. Calculate the sampling error for the stratausing the data from section 34.41 - exhibit 01. The examplecalculations use the expanded volume per plot (x) to provide aconsistent approach with other examples for point and two stagesampling presented in sections 35 and 37. For simple fixed plotsampling, where each tree has the same tree factor, the results areidentical if the unexpanded volume per plot is used.Compute the sample statistics for this example:
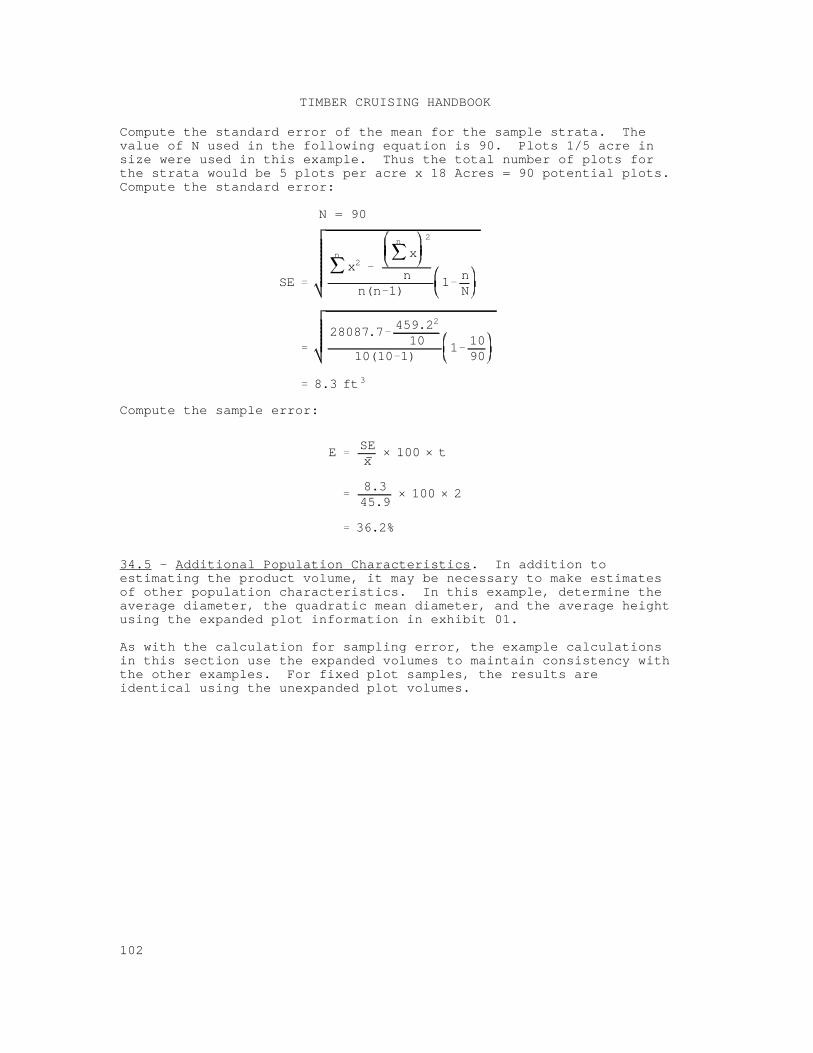
SE
n
x2
n
x2
nn(n 1)
1nN
28087.7459.22
1010(10 1)
11090
8.3 ft3
ESEx
× 100 × t
8.345.9
× 100 × 2
36.2%
TIMBER CRUISING HANDBOOK
102
Compute the standard error of the mean for the sample strata. Thevalue of N used in the following equation is 90. Plots 1/5 acre insize were used in this example. Thus the total number of plots forthe strata would be 5 plots per acre x 18 Acres = 90 potential plots. Compute the standard error:
N = 90
Compute the sample error:
34.5 - Additional Population Characteristics. In addition toestimating the product volume, it may be necessary to make estimatesof other population characteristics. In this example, determine theaverage diameter, the quadratic mean diameter, and the average heightusing the expanded plot information in exhibit 01.
As with the calculation for sampling error, the example calculationsin this section use the expanded volumes to maintain consistency withthe other examples. For fixed plot samples, the results areidentical using the unexpanded plot volumes.
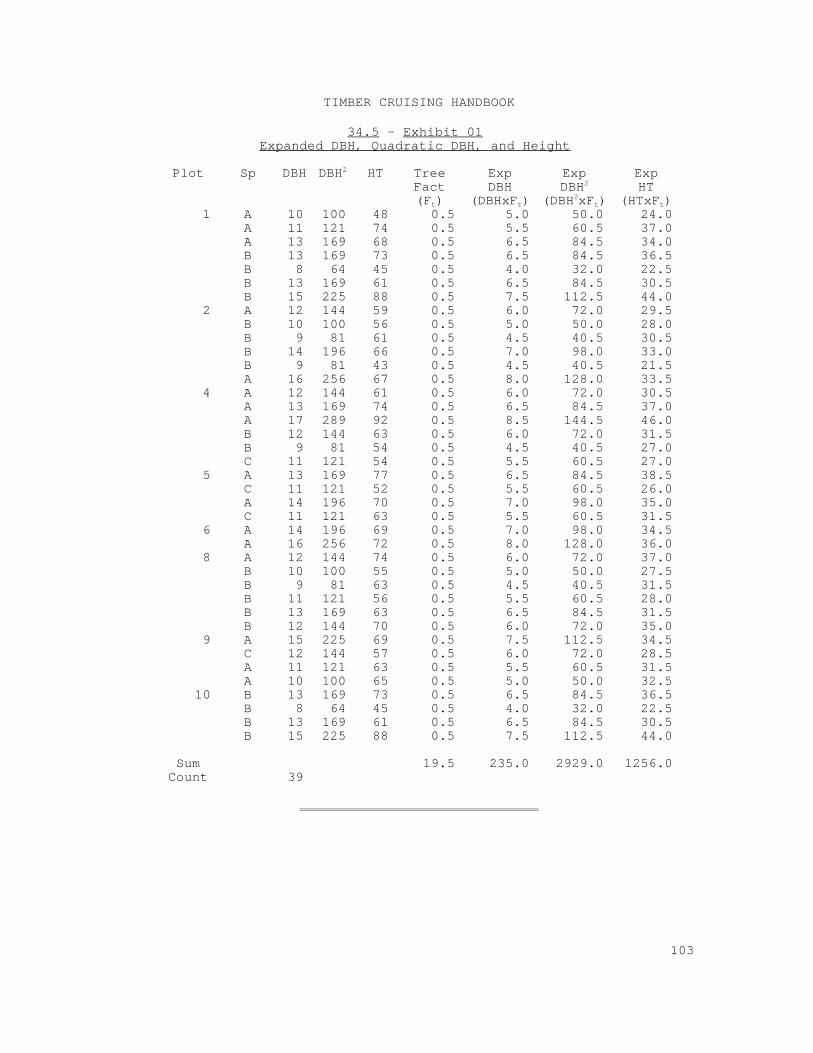
TIMBER CRUISING HANDBOOK
103
34.5 - Exhibit 01 Expanded DBH, Quadratic DBH, and Height
Plot Sp DBH DBH HT Tree Exp Exp Exp2
Fact DBH DBH HT(F ) (DBHxF ) (DBH xF ) (HTxF )t t
2
2t t
1 A 10 100 48 0.5 5.0 50.0 24.0 A 11 121 74 0.5 5.5 60.5 37.0 A 13 169 68 0.5 6.5 84.5 34.0 B 13 169 73 0.5 6.5 84.5 36.5 B 8 64 45 0.5 4.0 32.0 22.5 B 13 169 61 0.5 6.5 84.5 30.5 B 15 225 88 0.5 7.5 112.5 44.0
2 A 12 144 59 0.5 6.0 72.0 29.5 B 10 100 56 0.5 5.0 50.0 28.0 B 9 81 61 0.5 4.5 40.5 30.5 B 14 196 66 0.5 7.0 98.0 33.0 B 9 81 43 0.5 4.5 40.5 21.5 A 16 256 67 0.5 8.0 128.0 33.5
4 A 12 144 61 0.5 6.0 72.0 30.5 A 13 169 74 0.5 6.5 84.5 37.0 A 17 289 92 0.5 8.5 144.5 46.0 B 12 144 63 0.5 6.0 72.0 31.5 B 9 81 54 0.5 4.5 40.5 27.0 C 11 121 54 0.5 5.5 60.5 27.0
5 A 13 169 77 0.5 6.5 84.5 38.5 C 11 121 52 0.5 5.5 60.5 26.0 A 14 196 70 0.5 7.0 98.0 35.0 C 11 121 63 0.5 5.5 60.5 31.5
6 A 14 196 69 0.5 7.0 98.0 34.5 A 16 256 72 0.5 8.0 128.0 36.0
8 A 12 144 74 0.5 6.0 72.0 37.0 B 10 100 55 0.5 5.0 50.0 27.5 B 9 81 63 0.5 4.5 40.5 31.5 B 11 121 56 0.5 5.5 60.5 28.0 B 13 169 63 0.5 6.5 84.5 31.5 B 12 144 70 0.5 6.0 72.0 35.0
9 A 15 225 69 0.5 7.5 112.5 34.5 C 12 144 57 0.5 6.0 72.0 28.5 A 11 121 63 0.5 5.5 60.5 31.5 A 10 100 65 0.5 5.0 50.0 32.5
10 B 13 169 73 0.5 6.5 84.5 36.5 B 8 64 45 0.5 4.0 32.0 22.5 B 13 169 61 0.5 6.5 84.5 30.5 B 15 225 88 0.5 7.5 112.5 44.0
Sum 19.5 235.0 2929.0 1256.0 Count 39
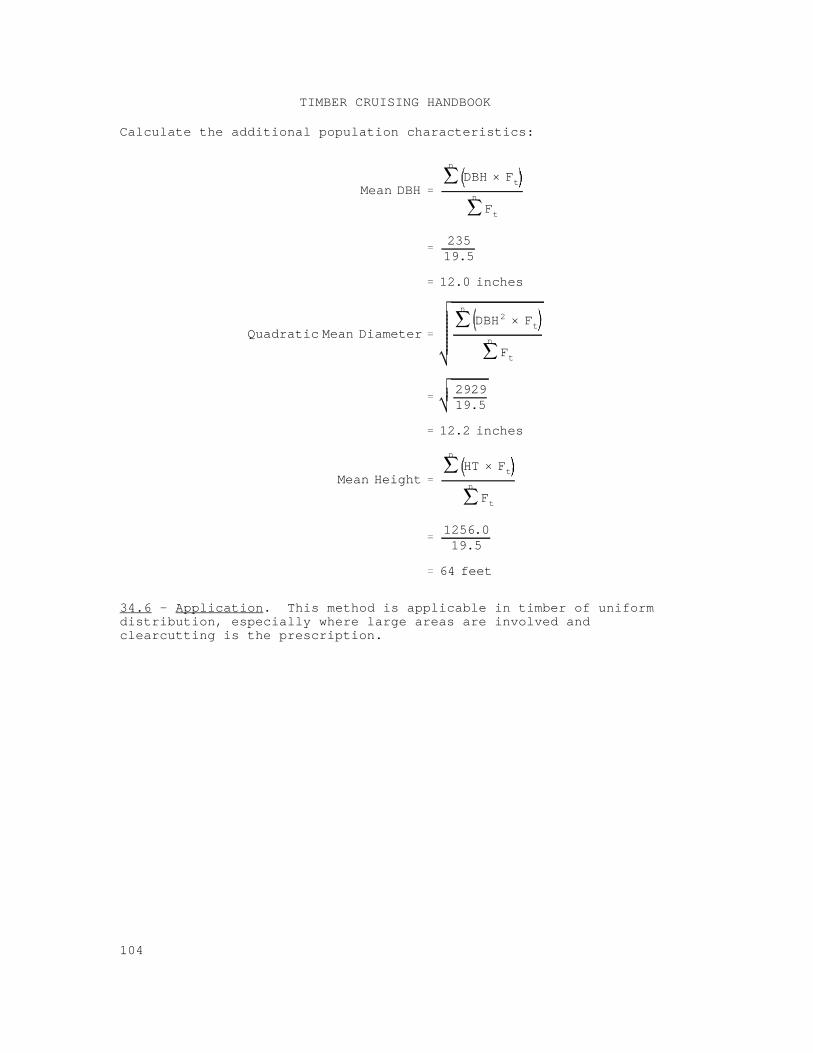
Mean DBH
n
DBH × Ftn
Ft
23519.5
12.0 inches
Quadratic Mean Diameter
n
DBH2 × Ftn
Ft
292919.5
12.2 inches
Mean Height
n
HT × Ftn
Ft
1256.019.5
64 feet
TIMBER CRUISING HANDBOOK
104
Calculate the additional population characteristics:
34.6 - Application. This method is applicable in timber of uniformdistribution, especially where large areas are involved andclearcutting is the prescription.

TIMBER CRUISING HANDBOOK
105

TIMBER CRUISING HANDBOOK
106
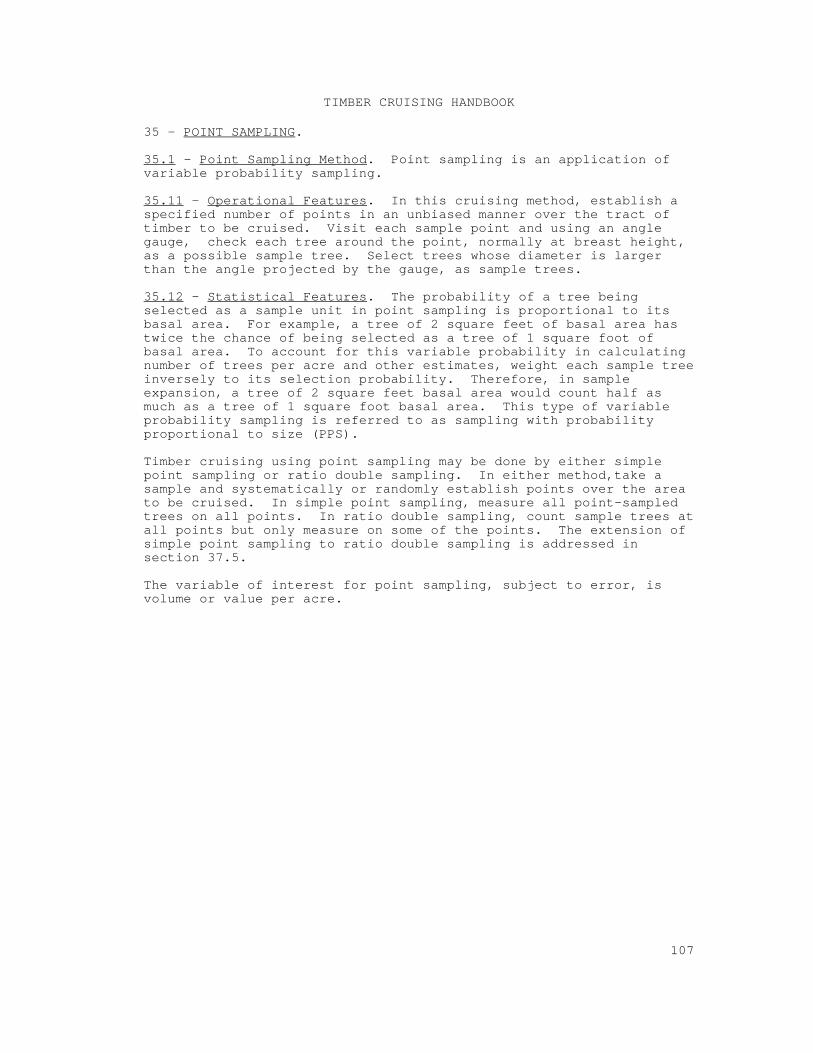
TIMBER CRUISING HANDBOOK
107
35 - POINT SAMPLING.
35.1 - Point Sampling Method. Point sampling is an application ofvariable probability sampling.
35.11 - Operational Features. In this cruising method, establish aspecified number of points in an unbiased manner over the tract oftimber to be cruised. Visit each sample point and using an anglegauge, check each tree around the point, normally at breast height,as a possible sample tree. Select trees whose diameter is largerthan the angle projected by the gauge, as sample trees.
35.12 - Statistical Features. The probability of a tree beingselected as a sample unit in point sampling is proportional to itsbasal area. For example, a tree of 2 square feet of basal area hastwice the chance of being selected as a tree of 1 square foot ofbasal area. To account for this variable probability in calculatingnumber of trees per acre and other estimates, weight each sample treeinversely to its selection probability. Therefore, in sampleexpansion, a tree of 2 square feet basal area would count half asmuch as a tree of 1 square foot basal area. This type of variableprobability sampling is referred to as sampling with probabilityproportional to size (PPS).
Timber cruising using point sampling may be done by either simplepoint sampling or ratio double sampling. In either method,take asample and systematically or randomly establish points over the areato be cruised. In simple point sampling, measure all point-sampledtrees on all points. In ratio double sampling, count sample trees atall points but only measure on some of the points. The extension ofsimple point sampling to ratio double sampling is addressed insection 37.5.
The variable of interest for point sampling, subject to error, isvolume or value per acre.
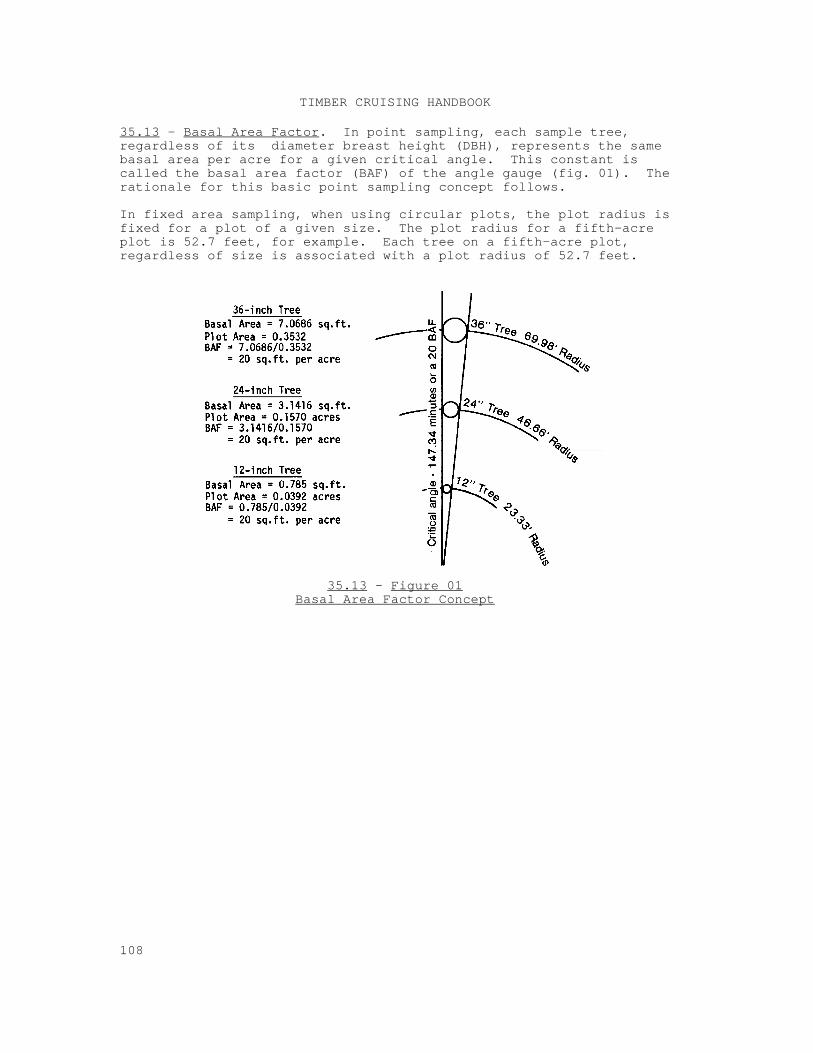
TIMBER CRUISING HANDBOOK
108
35.13 - Basal Area Factor. In point sampling, each sample tree,regardless of its diameter breast height (DBH), represents the samebasal area per acre for a given critical angle. This constant iscalled the basal area factor (BAF) of the angle gauge (fig. 01). Therationale for this basic point sampling concept follows.
In fixed area sampling, when using circular plots, the plot radius isfixed for a plot of a given size. The plot radius for a fifth-acreplot is 52.7 feet, for example. Each tree on a fifth-acre plot,regardless of size is associated with a plot radius of 52.7 feet.
35.13 - Figure 01Basal Area Factor Concept
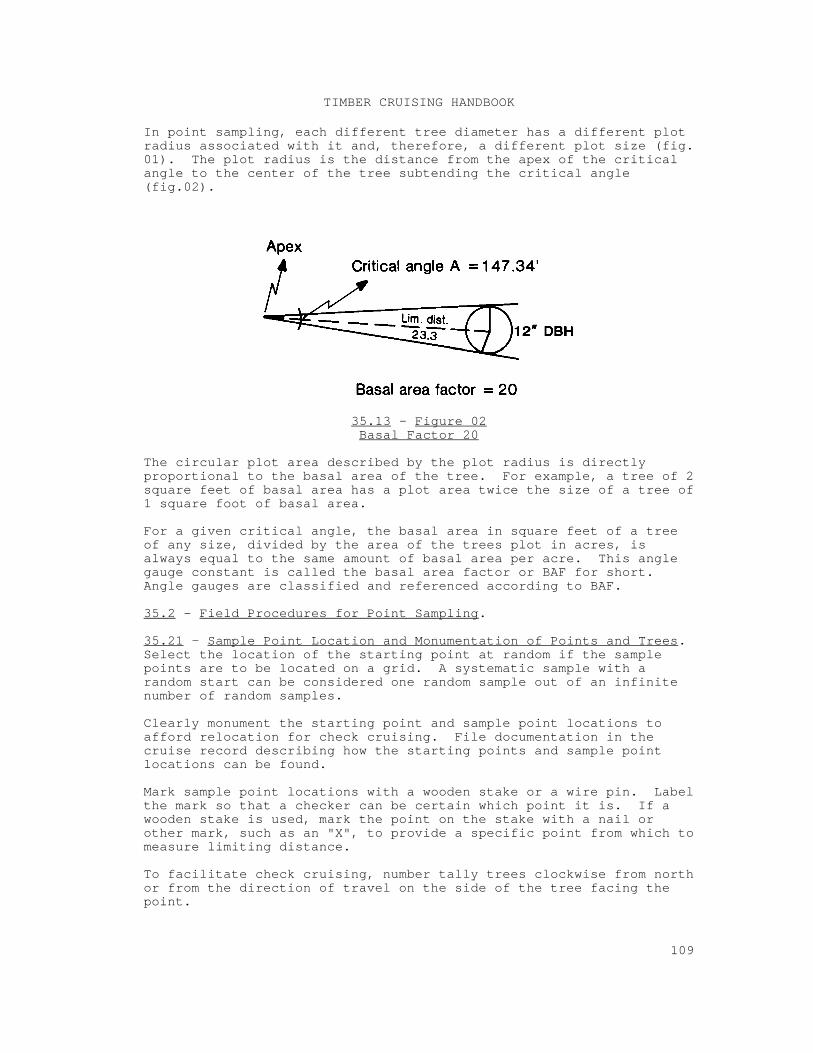
TIMBER CRUISING HANDBOOK
109
In point sampling, each different tree diameter has a different plotradius associated with it and, therefore, a different plot size (fig.01). The plot radius is the distance from the apex of the criticalangle to the center of the tree subtending the critical angle(fig.02).
35.13 - Figure 02Basal Factor 20
The circular plot area described by the plot radius is directlyproportional to the basal area of the tree. For example, a tree of 2square feet of basal area has a plot area twice the size of a tree of1 square foot of basal area.
For a given critical angle, the basal area in square feet of a treeof any size, divided by the area of the trees plot in acres, isalways equal to the same amount of basal area per acre. This anglegauge constant is called the basal area factor or BAF for short. Angle gauges are classified and referenced according to BAF.
35.2 - Field Procedures for Point Sampling.
35.21 - Sample Point Location and Monumentation of Points and Trees. Select the location of the starting point at random if the samplepoints are to be located on a grid. A systematic sample with arandom start can be considered one random sample out of an infinitenumber of random samples.
Clearly monument the starting point and sample point locations toafford relocation for check cruising. File documentation in thecruise record describing how the starting points and sample pointlocations can be found.
Mark sample point locations with a wooden stake or a wire pin. Labelthe mark so that a checker can be certain which point it is. If awooden stake is used, mark the point on the stake with a nail orother mark, such as an "X", to provide a specific point from which tomeasure limiting distance.
To facilitate check cruising, number tally trees clockwise from northor from the direction of travel on the side of the tree facing thepoint.
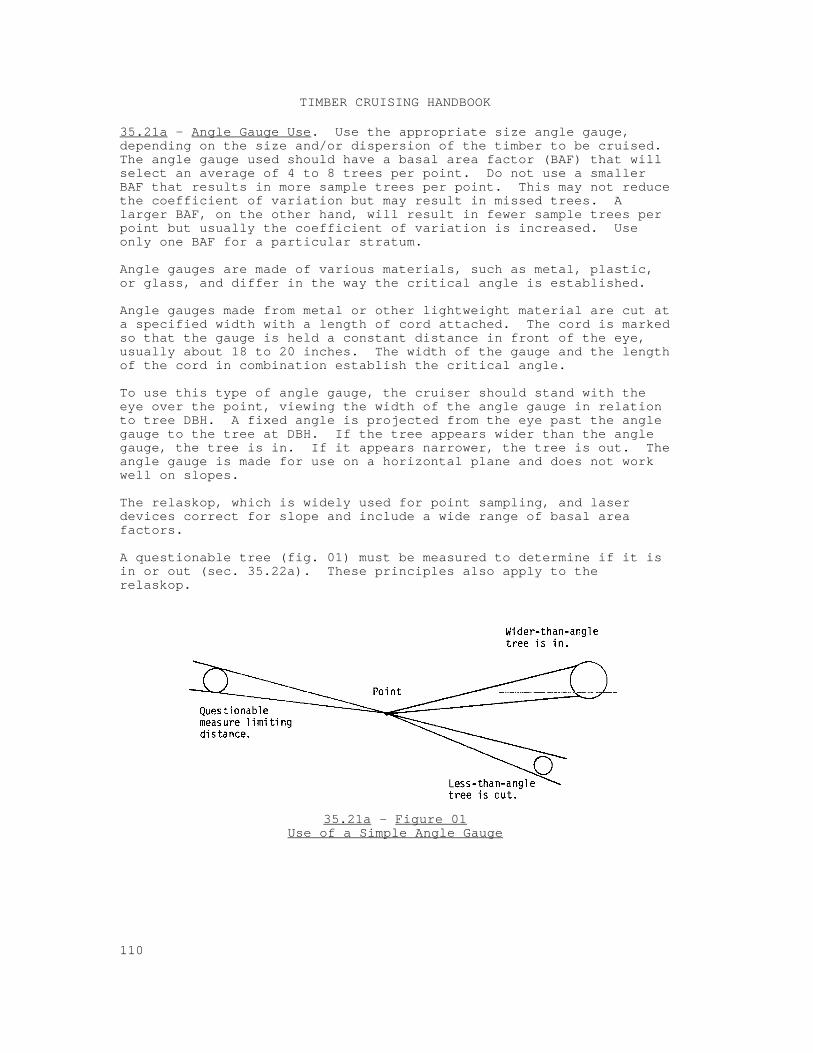
TIMBER CRUISING HANDBOOK
110
35.21a - Angle Gauge Use. Use the appropriate size angle gauge,depending on the size and/or dispersion of the timber to be cruised. The angle gauge used should have a basal area factor (BAF) that willselect an average of 4 to 8 trees per point. Do not use a smallerBAF that results in more sample trees per point. This may not reducethe coefficient of variation but may result in missed trees. Alarger BAF, on the other hand, will result in fewer sample trees perpoint but usually the coefficient of variation is increased. Useonly one BAF for a particular stratum.
Angle gauges are made of various materials, such as metal, plastic,or glass, and differ in the way the critical angle is established.
Angle gauges made from metal or other lightweight material are cut ata specified width with a length of cord attached. The cord is markedso that the gauge is held a constant distance in front of the eye,usually about 18 to 20 inches. The width of the gauge and the lengthof the cord in combination establish the critical angle.
To use this type of angle gauge, the cruiser should stand with theeye over the point, viewing the width of the angle gauge in relationto tree DBH. A fixed angle is projected from the eye past the anglegauge to the tree at DBH. If the tree appears wider than the anglegauge, the tree is in. If it appears narrower, the tree is out. Theangle gauge is made for use on a horizontal plane and does not workwell on slopes.
The relaskop, which is widely used for point sampling, and laserdevices correct for slope and include a wide range of basal areafactors.
A questionable tree (fig. 01) must be measured to determine if it isin or out (sec. 35.22a). These principles also apply to therelaskop.
35.21a - Figure 01Use of a Simple Angle Gauge
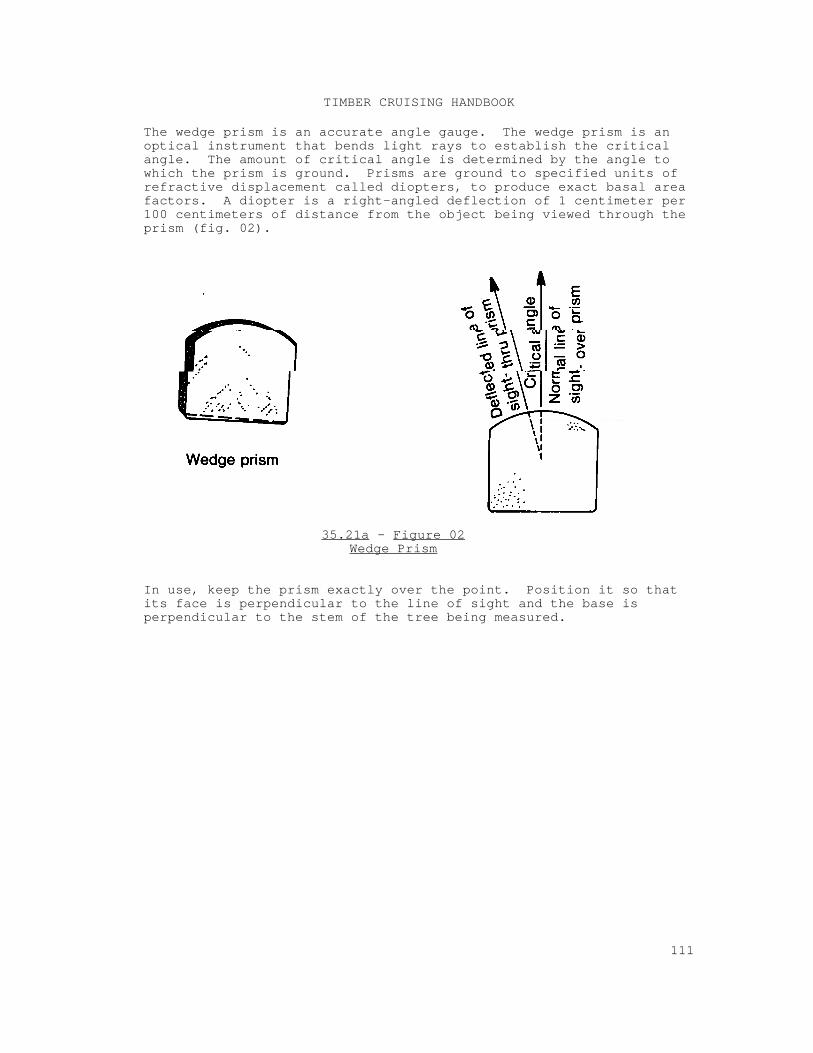
TIMBER CRUISING HANDBOOK
111
The wedge prism is an accurate angle gauge. The wedge prism is anoptical instrument that bends light rays to establish the criticalangle. The amount of critical angle is determined by the angle towhich the prism is ground. Prisms are ground to specified units ofrefractive displacement called diopters, to produce exact basal areafactors. A diopter is a right-angled deflection of 1 centimeter per100 centimeters of distance from the object being viewed through theprism (fig. 02).
35.21a - Figure 02Wedge Prism
In use, keep the prism exactly over the point. Position it so thatits face is perpendicular to the line of sight and the base isperpendicular to the stem of the tree being measured.
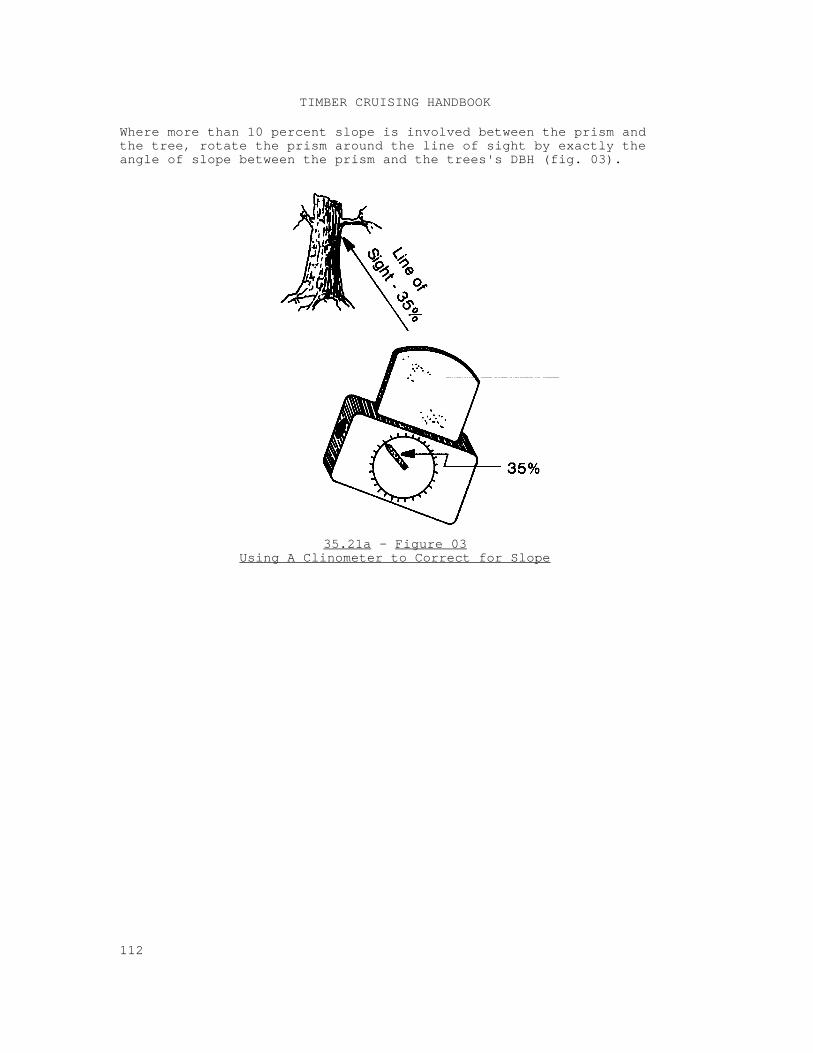
TIMBER CRUISING HANDBOOK
112
Where more than 10 percent slope is involved between the prism andthe tree, rotate the prism around the line of sight by exactly theangle of slope between the prism and the trees's DBH (fig. 03).
35.21a - Figure 03Using A Clinometer to Correct for Slope

TIMBER CRUISING HANDBOOK
113
To determine in and out trees, view each tree through the prism. Theportion of the tree viewed through the prism is deflected, creating adisplaced image. If the displacement overlaps the tree, the tree isin. If the displacement is separated from the tree, the tree is out. If the displacement is questionable or appears borderline, takemeasurements to determine whether or not the tree is included in thesample (fig. 04). See section 35.22a for more details on borderlineand questionable trees.
35.21a - Figure 04Use of a Prism in Point Sampling
35.22 - Sample Tree Determination. Select sample trees with the aidof an angle gauge with a fixed critical angle (sec. 35.1). Ordinarily, when using an angle gauge, trees are clearly either "in"or "out". However, it is not always possible to determine treestatus with certainty. These are trees borderline to the plotradius, that is, too close to call when observed with the anglegauge. Another problem may exist when the tree DBH is masked bybrush or other trees. Measure plot radius (limiting distance) forthese trees to determine the in/out status.
35.22a - Assessing Borderline and Other Questionable Trees. Measurelimiting distance to borderline or other questionable trees toconclusively determine if the tree in question is a sample tree.
Limiting distance is another term for plot radius, which is themaximum distance a tree can be from the point and still be in (asample tree). Limiting distance is a function of tree DBH and anangle gauge constant called the plot radius factor (PRF). The plotradius factor varies with the size of the angle gauge. For a BAF of20, the PRF is 1.944.
Limiting Distance (ft.) DBH × Plot Radius Factor
For example: DBH 12 inches
PRF 1.944
Limiting Distance (12) (1.944)
23.33 feet
PRF0.0833sin A
PRF8.696
BAF
PRF0.0833sin A
PRF8.696
BAF
0.08330.04285
8.696
20
1.944 1.944
TIMBER CRUISING HANDBOOK
114
Calculate limiting distance using the following formula:
The PRF may be determined for an angle gauge of any size from eitherof the two formulas below:
Where:
PRF = Plot radius factorA = Critical angle (in minutes) of the angle gauge.BAF = Basal area factor of the angle gauge.
For example, consider an angle gauge with a critical angle of 147.34minutes which is equal to a BAF of 20 square feet per acre (sec.35.13 fig. 02).
Tree DBH (in inches) multiplied by 1.944 gives limiting distance (infeet) from the point to the center of the tree for BAF 20.
It is, however, more efficient and more accurate to measure limitingdistance to the point from the face of the tree. Determine acorrected PRF to calculate limiting distance from the face of thetree instead of from the center of the tree.
Calculate a corrected PRF for a given size angle gauge as follows:
1. Calculate the limiting distance to the center of tree.
For a 12" tree and BAF 20:Limiting Distance = PRF x DBHLimiting Distance = 1.944 x 12 = 23.33 feet.
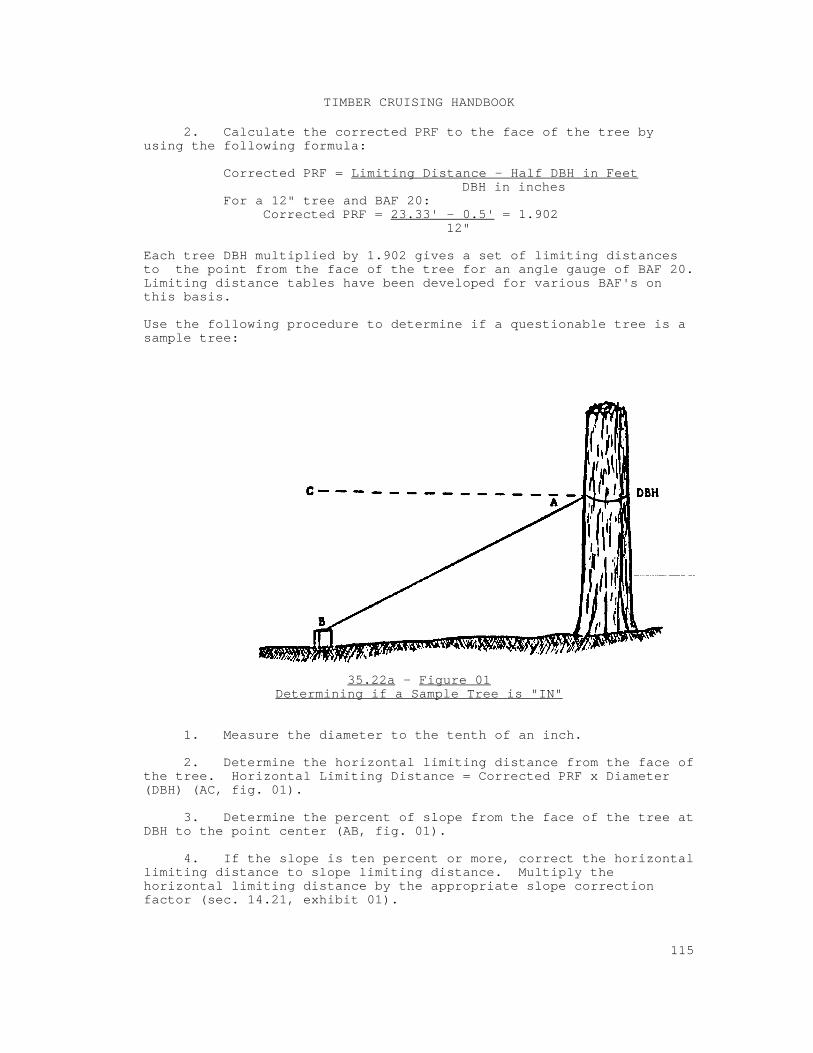
TIMBER CRUISING HANDBOOK
115
2. Calculate the corrected PRF to the face of the tree byusing the following formula:
Corrected PRF = Limiting Distance - Half DBH in FeetDBH in inches
For a 12" tree and BAF 20:Corrected PRF = 23.33' - 0.5' = 1.902
12"
Each tree DBH multiplied by 1.902 gives a set of limiting distancesto the point from the face of the tree for an angle gauge of BAF 20. Limiting distance tables have been developed for various BAF's onthis basis.
Use the following procedure to determine if a questionable tree is asample tree:
35.22a - Figure 01Determining if a Sample Tree is "IN"
1. Measure the diameter to the tenth of an inch.
2. Determine the horizontal limiting distance from the face ofthe tree. Horizontal Limiting Distance = Corrected PRF x Diameter(DBH) (AC, fig. 01).
3. Determine the percent of slope from the face of the tree atDBH to the point center (AB, fig. 01).
4. If the slope is ten percent or more, correct the horizontallimiting distance to slope limiting distance. Multiply thehorizontal limiting distance by the appropriate slope correctionfactor (sec. 14.21, exhibit 01).
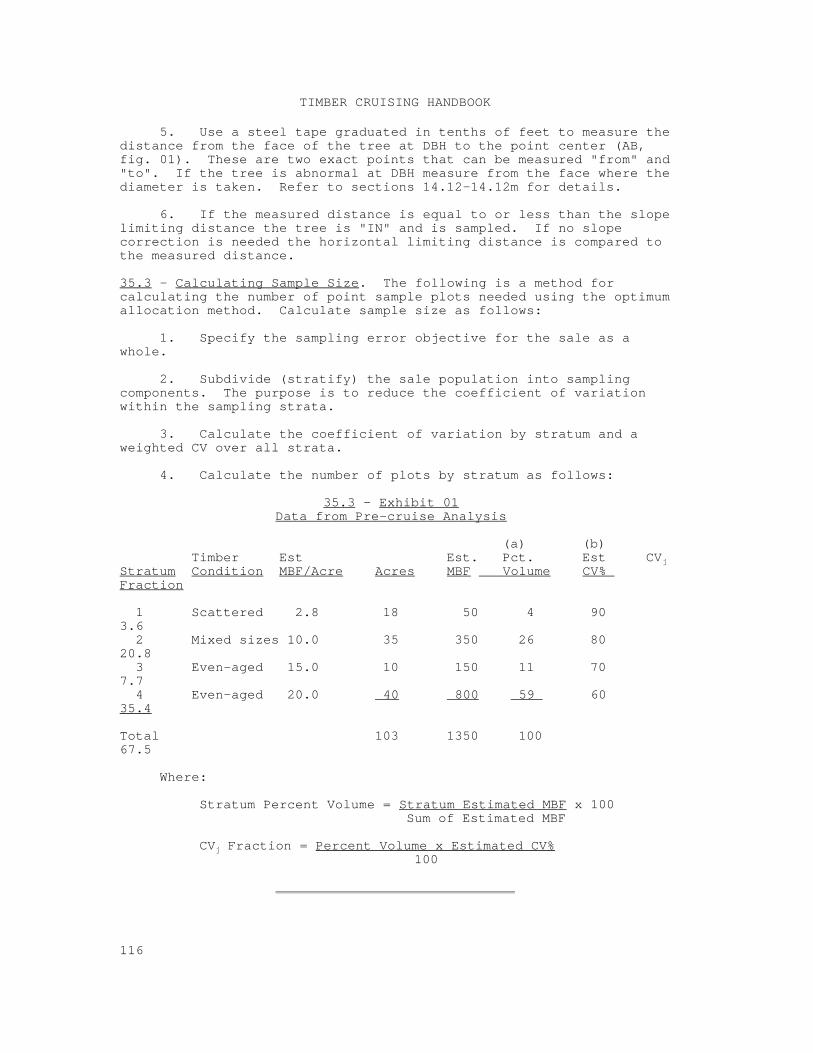
TIMBER CRUISING HANDBOOK
116
5. Use a steel tape graduated in tenths of feet to measure thedistance from the face of the tree at DBH to the point center (AB,fig. 01). These are two exact points that can be measured "from" and"to". If the tree is abnormal at DBH measure from the face where thediameter is taken. Refer to sections 14.12-14.12m for details.
6. If the measured distance is equal to or less than the slopelimiting distance the tree is "IN" and is sampled. If no slopecorrection is needed the horizontal limiting distance is compared tothe measured distance.
35.3 - Calculating Sample Size. The following is a method forcalculating the number of point sample plots needed using the optimumallocation method. Calculate sample size as follows:
1. Specify the sampling error objective for the sale as awhole.
2. Subdivide (stratify) the sale population into samplingcomponents. The purpose is to reduce the coefficient of variationwithin the sampling strata.
3. Calculate the coefficient of variation by stratum and aweighted CV over all strata.
4. Calculate the number of plots by stratum as follows:
35.3 - Exhibit 01 Data from Pre-cruise Analysis
(a) (b) Timber Est Est. Pct. Est CVj
Stratum Condition MBF/Acre Acres MBF Volume CV% Fraction
1 Scattered 2.8 18 50 4 90 3.6 2 Mixed sizes 10.0 35 350 26 80 20.8 3 Even-aged 15.0 10 150 11 70 7.7 4 Even-aged 20.0 40 800 59 60 35.4
Total 103 1350 100 67.5
Where:
Stratum Percent Volume = Stratum Estimated MBF x 100 Sum of Estimated MBF
CV Fraction = Percent Volume x Estimated CV%j
100
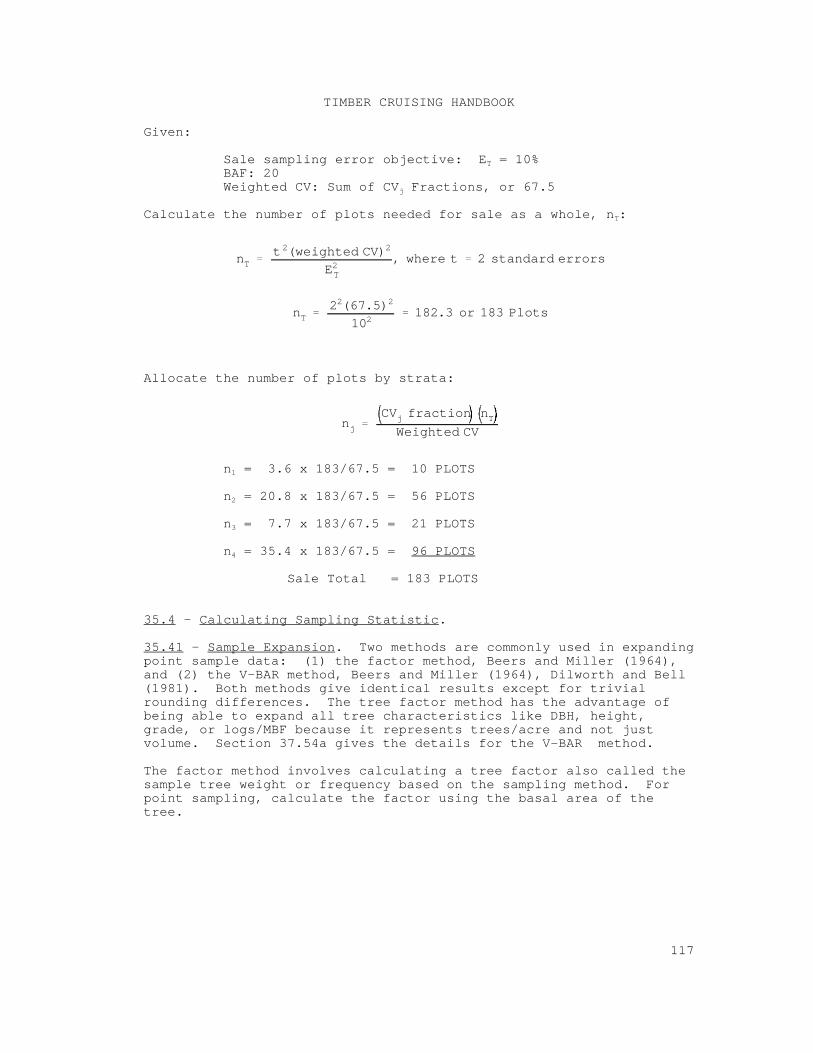
nT22(67.5)2
102182.3 or 183 Plots
nTt 2(weighted CV)2
E2T, where t 2 standard errors
njCVj fraction nTWeighted CV
TIMBER CRUISING HANDBOOK
117
Given:
Sale sampling error objective: E = 10%T
BAF: 20Weighted CV: Sum of CV Fractions, or 67.5j
Calculate the number of plots needed for sale as a whole, n :T
Allocate the number of plots by strata:
n = 3.6 x 183/67.5 = 10 PLOTS1
n = 20.8 x 183/67.5 = 56 PLOTS2
n = 7.7 x 183/67.5 = 21 PLOTS3
n = 35.4 x 183/67.5 = 96 PLOTS4
Sale Total = 183 PLOTS
35.4 - Calculating Sampling Statistic.
35.41 - Sample Expansion. Two methods are commonly used in expandingpoint sample data: (1) the factor method, Beers and Miller (1964),and (2) the V-BAR method, Beers and Miller (1964), Dilworth and Bell(1981). Both methods give identical results except for trivialrounding differences. The tree factor method has the advantage ofbeing able to expand all tree characteristics like DBH, height,grade, or logs/MBF because it represents trees/acre and not justvolume. Section 37.54a gives the details for the V-BAR method.
The factor method involves calculating a tree factor also called thesample tree weight or frequency based on the sampling method. Forpoint sampling, calculate the factor using the basal area of thetree.

Fv Ft × MV
Fv Volume factor for i th tree (volume/acre)
Ft Tree factor for i th tree (trees/acre)BAF
.005454 × DBH2 × p
MV Measured volume in i th tree
BAF Basal area factor
DBH Diameter of i th tree
p Number of prism points taken
TIMBER CRUISING HANDBOOK
118
Two factors of interest are the tree factor (F ) and the volumet
factor (F ). The tree factor is the number of trees per acrev
represented by each sample tree and the volume factor is the volumeper acre represented by each sample tree. Compute the factors asfollows:
where:
Compute the estimated total strata or tract volume contributed byeach individual tree as follows:
SV = F x Acresv
where:SV = Total volume for the i treeth
Acres = Number of acres in the strata
In this method, measure all sample trees on all points. Exhibits 01and 02 show the basic procedure for expanding point sample data andthe plot by species cross-tabulation. The sample tree count, volumefactors, and tree factors, and any other measured variables can becross-tabulated by any other observed variable. The followinginformation is given for the strata in the example:
Basal Area Factor (BAF) = 20Strata Acres = 18Number of plots taken = 10
Data for one strata (stratum 1) is shown. The procedure forcombining strata and calculating information about the sale as awhole is described in section 38.
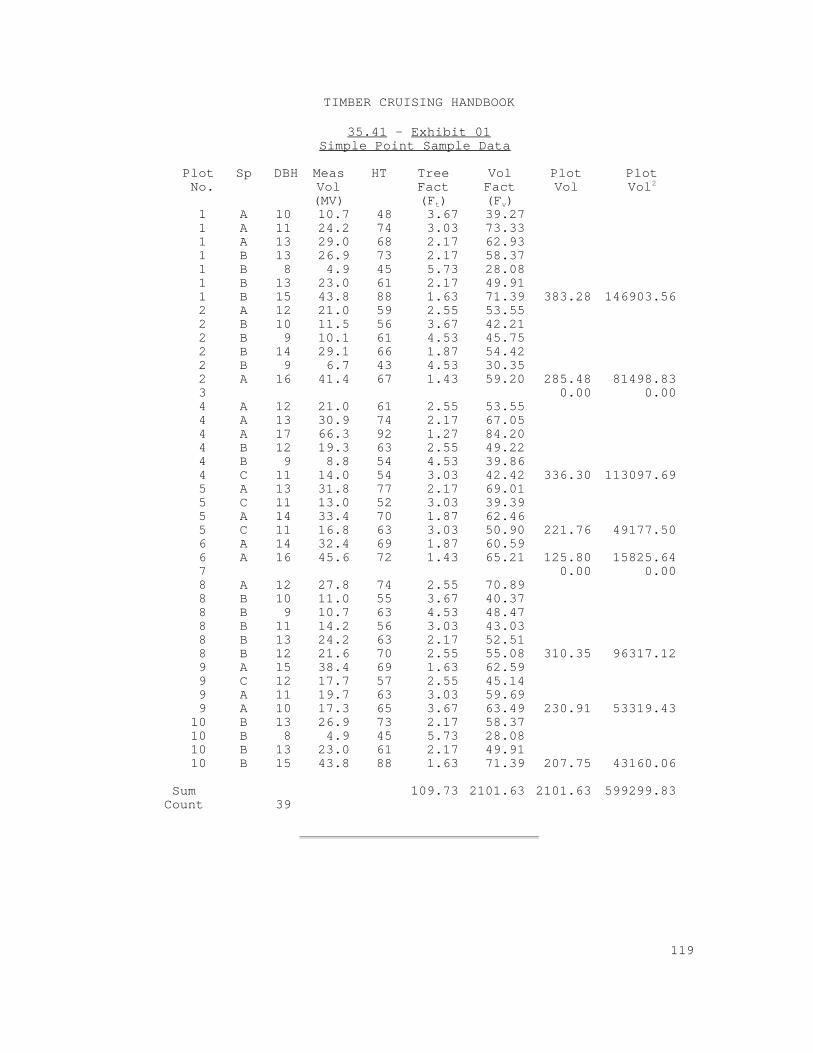
TIMBER CRUISING HANDBOOK
119
35.41 - Exhibit 01Simple Point Sample Data
Plot Sp DBH Meas HT Tree Vol Plot PlotNo. Vol Fact Fact Vol Vol
(MV) (F ) (F )t v
2
1 A 10 10.7 48 3.67 39.27 1 A 11 24.2 74 3.03 73.33 1 A 13 29.0 68 2.17 62.93 1 B 13 26.9 73 2.17 58.37 1 B 8 4.9 45 5.73 28.08 1 B 13 23.0 61 2.17 49.91 1 B 15 43.8 88 1.63 71.39 383.28 146903.56 2 A 12 21.0 59 2.55 53.55 2 B 10 11.5 56 3.67 42.21 2 B 9 10.1 61 4.53 45.75 2 B 14 29.1 66 1.87 54.42 2 B 9 6.7 43 4.53 30.35 2 A 16 41.4 67 1.43 59.20 285.48 81498.83 3 0.00 0.00 4 A 12 21.0 61 2.55 53.55 4 A 13 30.9 74 2.17 67.05 4 A 17 66.3 92 1.27 84.20 4 B 12 19.3 63 2.55 49.22 4 B 9 8.8 54 4.53 39.86 4 C 11 14.0 54 3.03 42.42 336.30 113097.69 5 A 13 31.8 77 2.17 69.01 5 C 11 13.0 52 3.03 39.39 5 A 14 33.4 70 1.87 62.46 5 C 11 16.8 63 3.03 50.90 221.76 49177.50 6 A 14 32.4 69 1.87 60.59 6 A 16 45.6 72 1.43 65.21 125.80 15825.64 7 0.00 0.00 8 A 12 27.8 74 2.55 70.89 8 B 10 11.0 55 3.67 40.37 8 B 9 10.7 63 4.53 48.47 8 B 11 14.2 56 3.03 43.03 8 B 13 24.2 63 2.17 52.51 8 B 12 21.6 70 2.55 55.08 310.35 96317.12 9 A 15 38.4 69 1.63 62.59 9 C 12 17.7 57 2.55 45.14 9 A 11 19.7 63 3.03 59.69 9 A 10 17.3 65 3.67 63.49 230.91 53319.43
10 B 13 26.9 73 2.17 58.37 10 B 8 4.9 45 5.73 28.08 10 B 13 23.0 61 2.17 49.91 10 B 15 43.8 88 1.63 71.39 207.75 43160.06
Sum 109.73 2101.63 2101.63 599299.83 Count 39
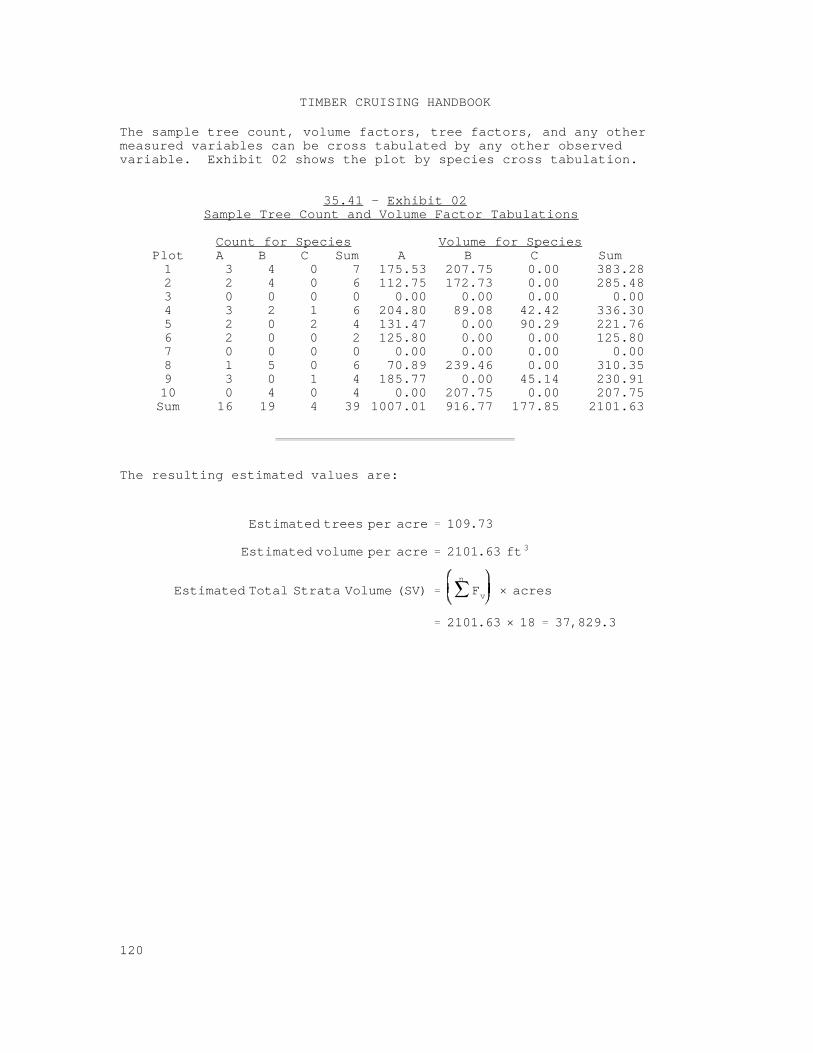
Estimated trees per acre 109.73
Estimated volume per acre 2101.63 ft3
Estimated Total Strata Volume (SV)n
Fv × acres
2101.63 × 18 37,829.3
TIMBER CRUISING HANDBOOK
120
The sample tree count, volume factors, tree factors, and any othermeasured variables can be cross tabulated by any other observedvariable. Exhibit 02 shows the plot by species cross tabulation.
35.41 - Exhibit 02Sample Tree Count and Volume Factor Tabulations
Count for Species Volume for SpeciesPlot A B C Sum A B C Sum1 3 4 0 7 175.53 207.75 0.00 383.28 2 2 4 0 6 112.75 172.73 0.00 285.48 3 0 0 0 0 0.00 0.00 0.00 0.00 4 3 2 1 6 204.80 89.08 42.42 336.30 5 2 0 2 4 131.47 0.00 90.29 221.76 6 2 0 0 2 125.80 0.00 0.00 125.80 7 0 0 0 0 0.00 0.00 0.00 0.00 8 1 5 0 6 70.89 239.46 0.00 310.35 9 3 0 1 4 185.77 0.00 45.14 230.91 10 0 4 0 4 0.00 207.75 0.00 207.75 Sum 16 19 4 39 1007.01 916.77 177.85 2101.63
The resulting estimated values are:
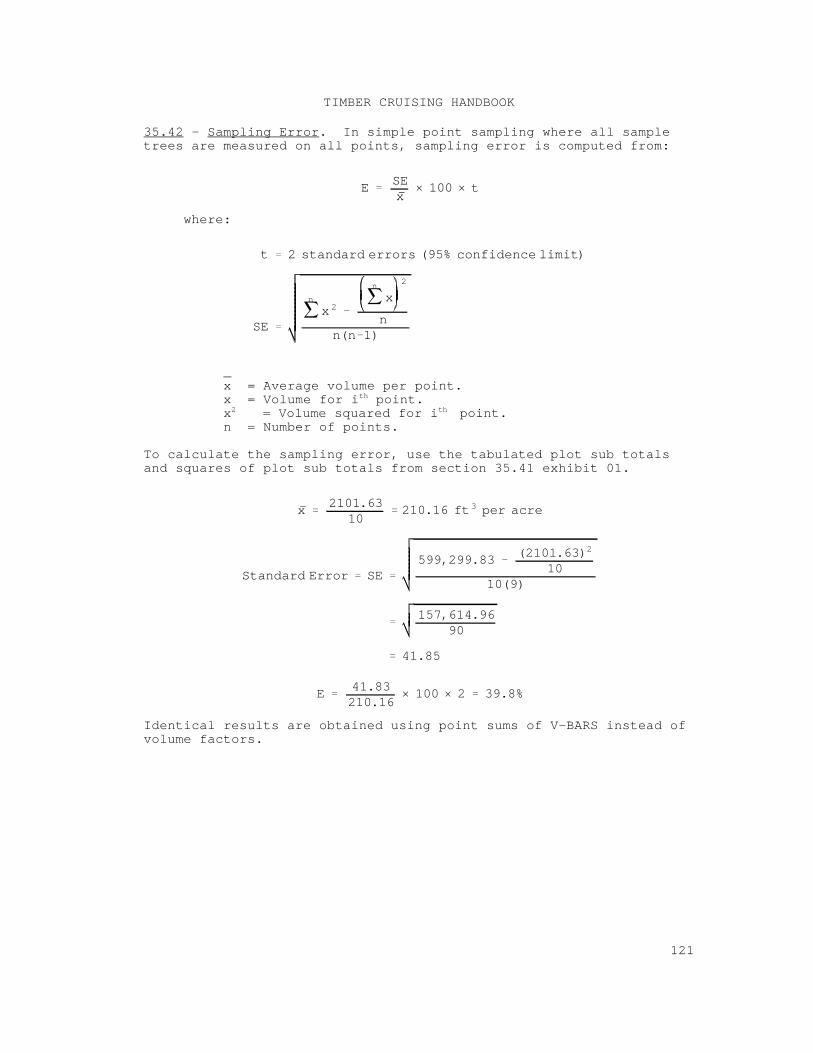
ESEx
× 100 × t
t 2 standard errors (95% confidence limit)
SE
n
x 2
n
x2
nn(n 1)
x2101.63
10210.16 ft3 per acre
Standard Error SE599,299.83
(2101.63)2
1010(9)
157,614.9690
41.85
E41.83210.16
× 100 × 2 39.8%
TIMBER CRUISING HANDBOOK
121
35.42 - Sampling Error. In simple point sampling where all sampletrees are measured on all points, sampling error is computed from:
where:
_x = Average volume per point.x = Volume for i point.th
x = Volume squared for i point.2 th
n = Number of points.
To calculate the sampling error, use the tabulated plot sub totalsand squares of plot sub totals from section 35.41 exhibit 01.
Identical results are obtained using point sums of V-BARS instead ofvolume factors.
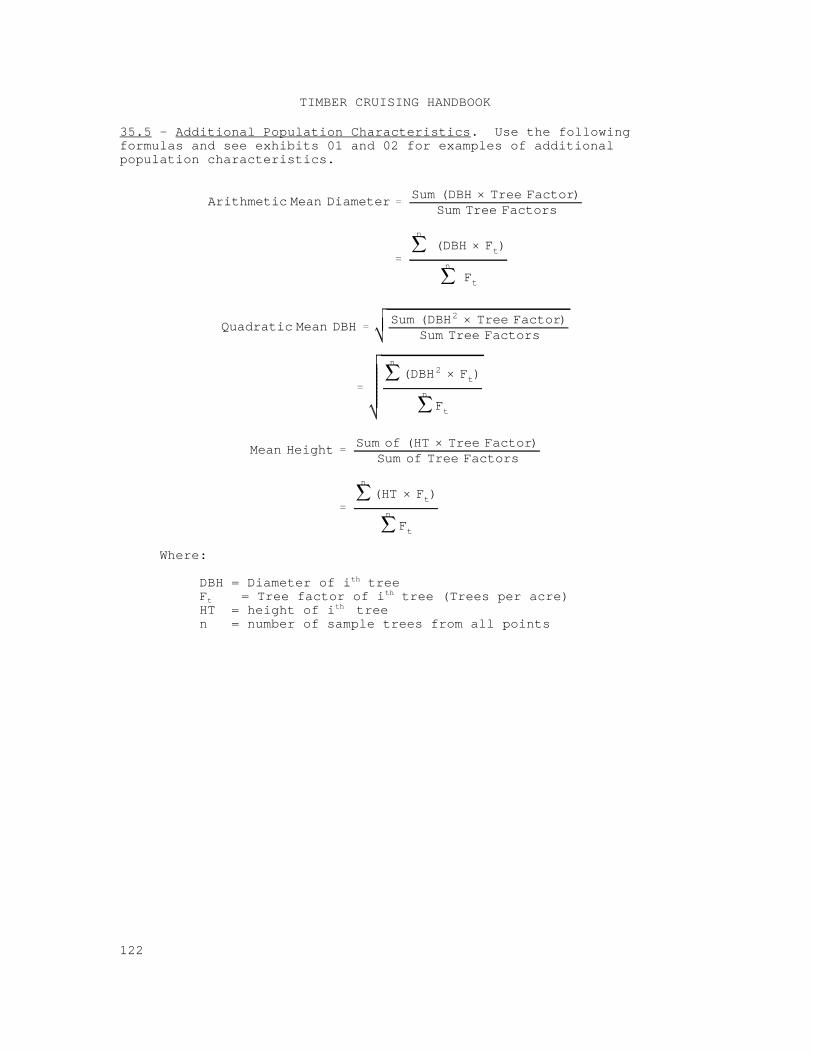
Arithmetic Mean DiameterSum (DBH × Tree Factor)
Sum Tree Factors
n
(DBH × Ft)
n
Ft
Quadratic Mean DBHSum (DBH2 × Tree Factor)
Sum Tree Factors
n
(DBH2 × Ft)
n
Ft
Mean HeightSum of (HT × Tree Factor)
Sum of Tree Factors
n
(HT × Ft)
n
Ft
TIMBER CRUISING HANDBOOK
122
35.5 - Additional Population Characteristics. Use the followingformulas and see exhibits 01 and 02 for examples of additionalpopulation characteristics.
Where:
DBH = Diameter of i treeth
F = Tree factor of i tree (Trees per acre)t th
HT = height of i treeth
n = number of sample trees from all points
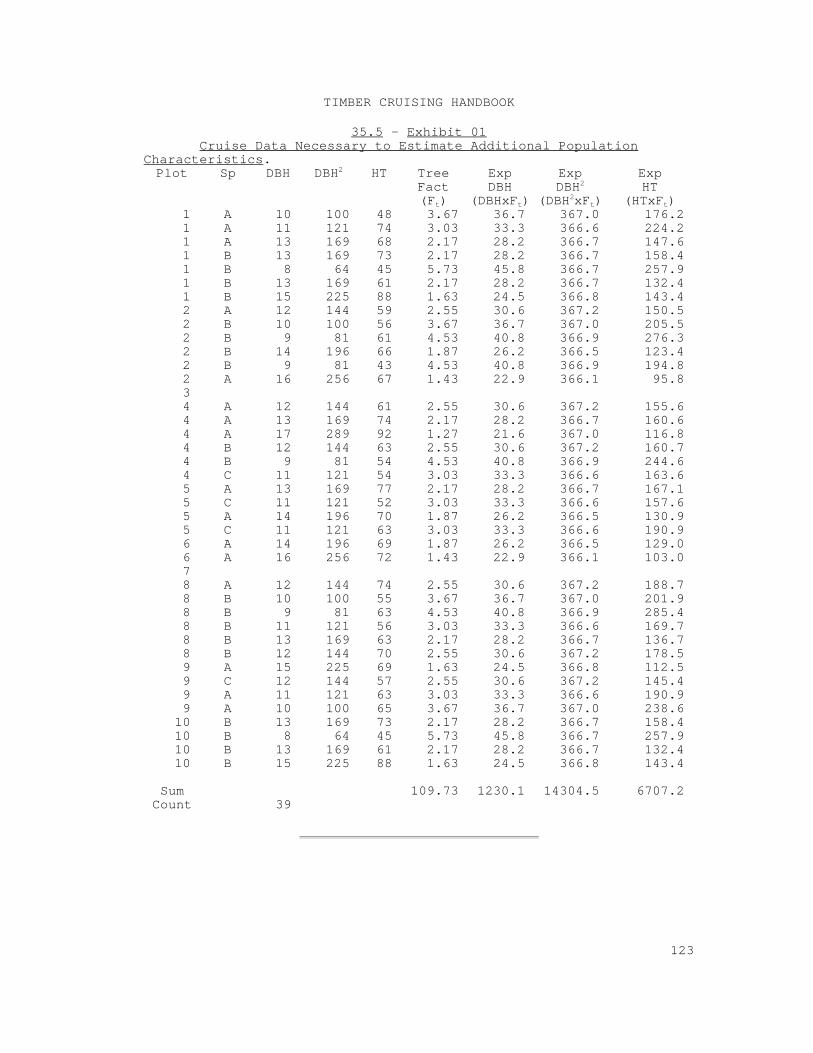
TIMBER CRUISING HANDBOOK
123
35.5 - Exhibit 01Cruise Data Necessary to Estimate Additional Population
Characteristics.Plot Sp DBH DBH HT Tree Exp Exp Exp2
Fact DBH DBH HT(F ) (DBHxF ) (DBH xF ) (HTxF )t t
2
2t t
1 A 10 100 48 3.67 36.7 367.0 176.2 1 A 11 121 74 3.03 33.3 366.6 224.2 1 A 13 169 68 2.17 28.2 366.7 147.6 1 B 13 169 73 2.17 28.2 366.7 158.4 1 B 8 64 45 5.73 45.8 366.7 257.9 1 B 13 169 61 2.17 28.2 366.7 132.4 1 B 15 225 88 1.63 24.5 366.8 143.4 2 A 12 144 59 2.55 30.6 367.2 150.5 2 B 10 100 56 3.67 36.7 367.0 205.5 2 B 9 81 61 4.53 40.8 366.9 276.3 2 B 14 196 66 1.87 26.2 366.5 123.4 2 B 9 81 43 4.53 40.8 366.9 194.8 2 A 16 256 67 1.43 22.9 366.1 95.8 3 4 A 12 144 61 2.55 30.6 367.2 155.6 4 A 13 169 74 2.17 28.2 366.7 160.6 4 A 17 289 92 1.27 21.6 367.0 116.8 4 B 12 144 63 2.55 30.6 367.2 160.7 4 B 9 81 54 4.53 40.8 366.9 244.6 4 C 11 121 54 3.03 33.3 366.6 163.6 5 A 13 169 77 2.17 28.2 366.7 167.1 5 C 11 121 52 3.03 33.3 366.6 157.6 5 A 14 196 70 1.87 26.2 366.5 130.9 5 C 11 121 63 3.03 33.3 366.6 190.9 6 A 14 196 69 1.87 26.2 366.5 129.0 6 A 16 256 72 1.43 22.9 366.1 103.0 7 8 A 12 144 74 2.55 30.6 367.2 188.7 8 B 10 100 55 3.67 36.7 367.0 201.9 8 B 9 81 63 4.53 40.8 366.9 285.4 8 B 11 121 56 3.03 33.3 366.6 169.7 8 B 13 169 63 2.17 28.2 366.7 136.7 8 B 12 144 70 2.55 30.6 367.2 178.5 9 A 15 225 69 1.63 24.5 366.8 112.5 9 C 12 144 57 2.55 30.6 367.2 145.4 9 A 11 121 63 3.03 33.3 366.6 190.9 9 A 10 100 65 3.67 36.7 367.0 238.6
10 B 13 169 73 2.17 28.2 366.7 158.4 10 B 8 64 45 5.73 45.8 366.7 257.9 10 B 13 169 61 2.17 28.2 366.7 132.4 10 B 15 225 88 1.63 24.5 366.8 143.4
Sum 109.73 1230.1 14304.5 6707.2 Count 39
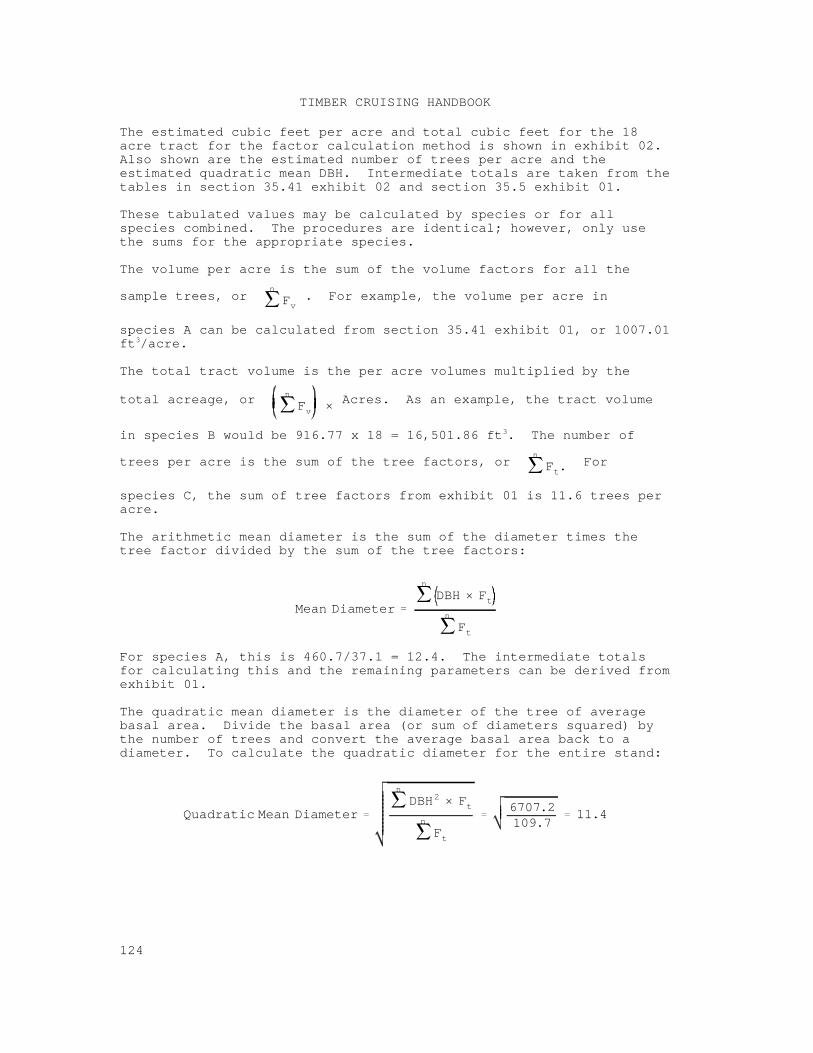
n
Fv
n
Fv ×
n
Ft.
Mean Diameter
n
DBH × Ftn
Ft
Quadratic Mean Diameter
n
DBH2 × Ftn
Ft
6707.2109.7
11.4
TIMBER CRUISING HANDBOOK
124
The estimated cubic feet per acre and total cubic feet for the 18acre tract for the factor calculation method is shown in exhibit 02. Also shown are the estimated number of trees per acre and theestimated quadratic mean DBH. Intermediate totals are taken from thetables in section 35.41 exhibit 02 and section 35.5 exhibit 01.
These tabulated values may be calculated by species or for allspecies combined. The procedures are identical; however, only usethe sums for the appropriate species.
The volume per acre is the sum of the volume factors for all the
sample trees, or . For example, the volume per acre in
species A can be calculated from section 35.41 exhibit 01, or 1007.01ft /acre.3
The total tract volume is the per acre volumes multiplied by the
total acreage, or Acres. As an example, the tract volume
in species B would be 916.77 x 18 = 16,501.86 ft . The number of3
trees per acre is the sum of the tree factors, or For
species C, the sum of tree factors from exhibit 01 is 11.6 trees peracre.
The arithmetic mean diameter is the sum of the diameter times thetree factor divided by the sum of the tree factors:
For species A, this is 460.7/37.1 = 12.4. The intermediate totalsfor calculating this and the remaining parameters can be derived from exhibit 01.
The quadratic mean diameter is the diameter of the tree of averagebasal area. Divide the basal area (or sum of diameters squared) bythe number of trees and convert the average basal area back to adiameter. To calculate the quadratic diameter for the entire stand:
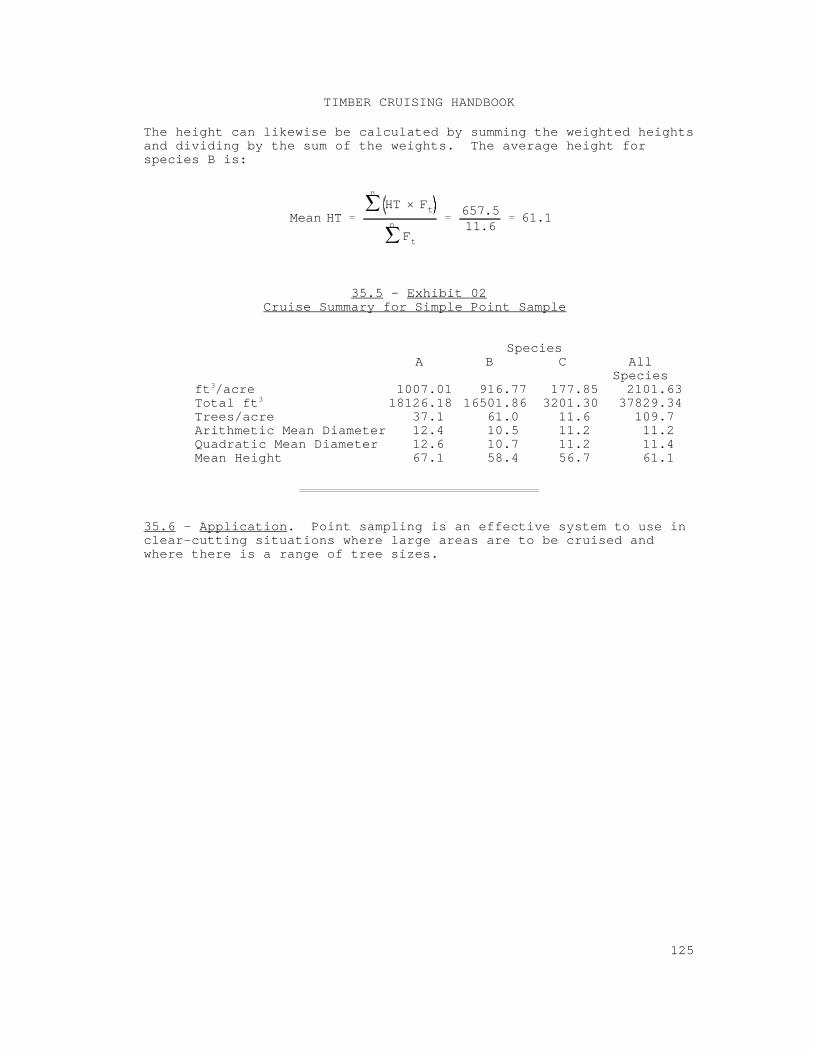
Mean HT
n
HT × Ftn
Ft
657.511.6
61.1
TIMBER CRUISING HANDBOOK
125
The height can likewise be calculated by summing the weighted heightsand dividing by the sum of the weights. The average height forspecies B is:
35.5 - Exhibit 02Cruise Summary for Simple Point Sample
SpeciesA B C All
Speciesft /acre 1007.01 916.77 177.85 2101.633
Total ft 18126.18 16501.86 3201.30 37829.343
Trees/acre 37.1 61.0 11.6 109.7Arithmetic Mean Diameter 12.4 10.5 11.2 11.2Quadratic Mean Diameter 12.6 10.7 11.2 11.4Mean Height 67.1 58.4 56.7 61.1
35.6 - Application. Point sampling is an effective system to use inclear-cutting situations where large areas are to be cruised andwhere there is a range of tree sizes.
TIMBER CRUISING HANDBOOK
126
36 - 3P SAMPLING.
36.1 - 3P Sampling Method. 3P sampling is a form of variableprobability sampling.
36.11 - Operational Features. 3P cruising involves visiting eachtree to be sold on a timber sale. Tree volume or value (KPI) isestimated and the estimate is compared with a random number. If theestimated volume or value (KPI) is equal to or greater than therandom number, measure the tree as a sample tree. Other treevariables that are closely correlated with tree volume such as DBH ,2
(DBH x HT), or (.5 × DBH) may also be used as KPI.2 2
The larger the predicted volume or value (KPI), the greater chance atree has of being selected as a sample unit. This chance orprobability is proportional to KPI, hence, probability proportionalto prediction or 3P. A tree of KPI 10, for example, has twice thechance of being selected as a tree of KPI 5. Therefore, the largeror more valuable trees are favored for sample tree selection.
36.12 - Statistical Features. The variable of interest in 3Psampling is the Measured/Predicted (M/P) ratio. This ratio isdetermined for each sample tree by dividing the measured volume orvalue for the tree by the predicted volume or value. The coefficientof variation of the M/P ratio is low, usually 35 percent or less. Therefore, few sample trees are needed to achieve standard errors of5 percent or less. The M/P ratio, being sample based, is subject tosampling error.
36.2 - Field Procedures. A crew consisting of a tallier and two tofour markers may provide the most efficient field setup.
As each tree is marked, the cruiser estimates and calls out thepredicted volume or value (KPI). The tallier records the KPI andcompares it to a random number. If the KPI equals or exceeds therandom number, the tree qualifies as a 3P sample tree.
KPI must never exceed the largest number in the random number list,which is termed "K". Any KPI larger than K must be reduced to K orthe tree and all others like it must be 100 percent cruised. Trees100 percent cruised are termed "sure measures".
Sometimes minor or very high value species are 100 percent cruised. Such a situation might occur in a 3P cruise when it is known thatonly a few trees of a certain species will be marked during the saleand sampling will be inappropriate.
Once a cruiser has called the KPI and the subject tree qualifies as asample, do not change the KPI. Sometimes a cruiser makes a poorestimate and upon measuring the sample tree, may be tempted to alterthe estimate. Do not alter the estimate; to do so would bias thecruise.
Good bookkeeping technique is important in 3P cruising. Tally KPI'sby stratum during the cruise so that later summarization involves noguess work.
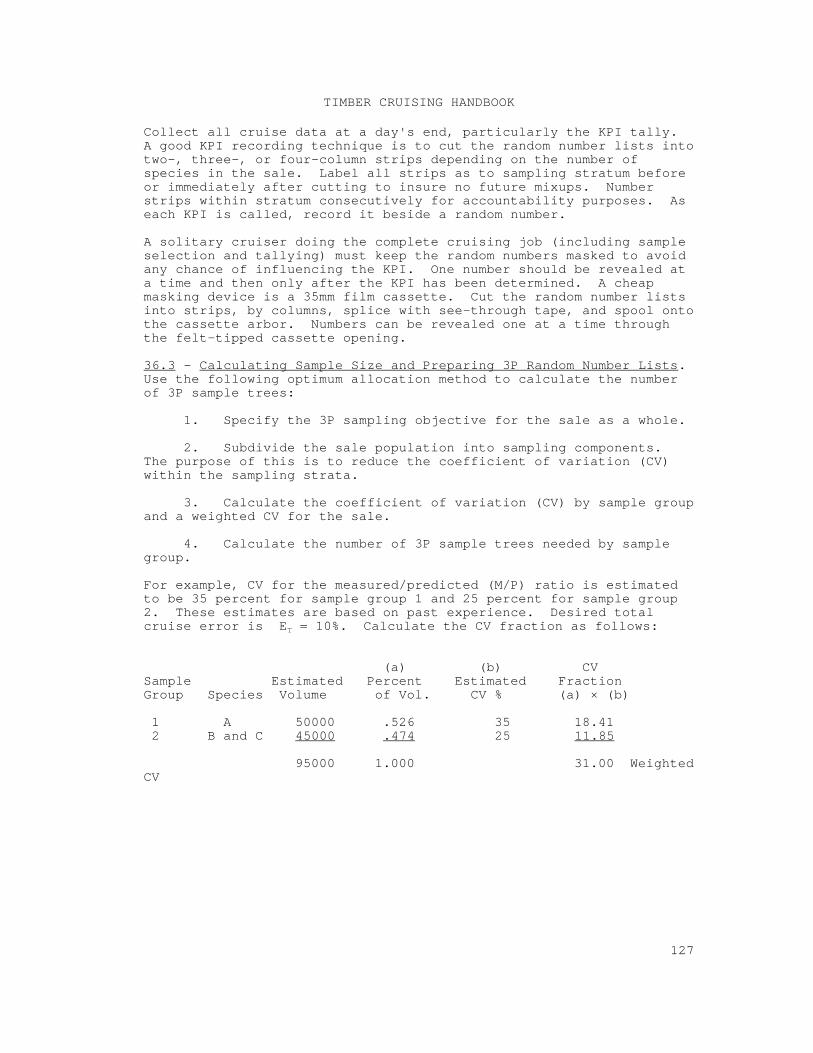
TIMBER CRUISING HANDBOOK
127
Collect all cruise data at a day's end, particularly the KPI tally. A good KPI recording technique is to cut the random number lists intotwo-, three-, or four-column strips depending on the number ofspecies in the sale. Label all strips as to sampling stratum beforeor immediately after cutting to insure no future mixups. Numberstrips within stratum consecutively for accountability purposes. Aseach KPI is called, record it beside a random number.
A solitary cruiser doing the complete cruising job (including sampleselection and tallying) must keep the random numbers masked to avoidany chance of influencing the KPI. One number should be revealed ata time and then only after the KPI has been determined. A cheapmasking device is a 35mm film cassette. Cut the random number listsinto strips, by columns, splice with see-through tape, and spool ontothe cassette arbor. Numbers can be revealed one at a time throughthe felt-tipped cassette opening.
36.3 - Calculating Sample Size and Preparing 3P Random Number Lists. Use the following optimum allocation method to calculate the numberof 3P sample trees:
1. Specify the 3P sampling objective for the sale as a whole.
2. Subdivide the sale population into sampling components. The purpose of this is to reduce the coefficient of variation (CV)within the sampling strata.
3. Calculate the coefficient of variation (CV) by sample groupand a weighted CV for the sale.
4. Calculate the number of 3P sample trees needed by samplegroup.
For example, CV for the measured/predicted (M/P) ratio is estimatedto be 35 percent for sample group 1 and 25 percent for sample group2. These estimates are based on past experience. Desired totalcruise error is E = 10%. Calculate the CV fraction as follows:T
(a) (b) CVSample Estimated Percent Estimated FractionGroup Species Volume of Vol. CV % (a) × (b)
1 A 50000 .526 35 18.41 2 B and C 45000 .474 25 11.85
95000 1.000 31.00 WeightedCV
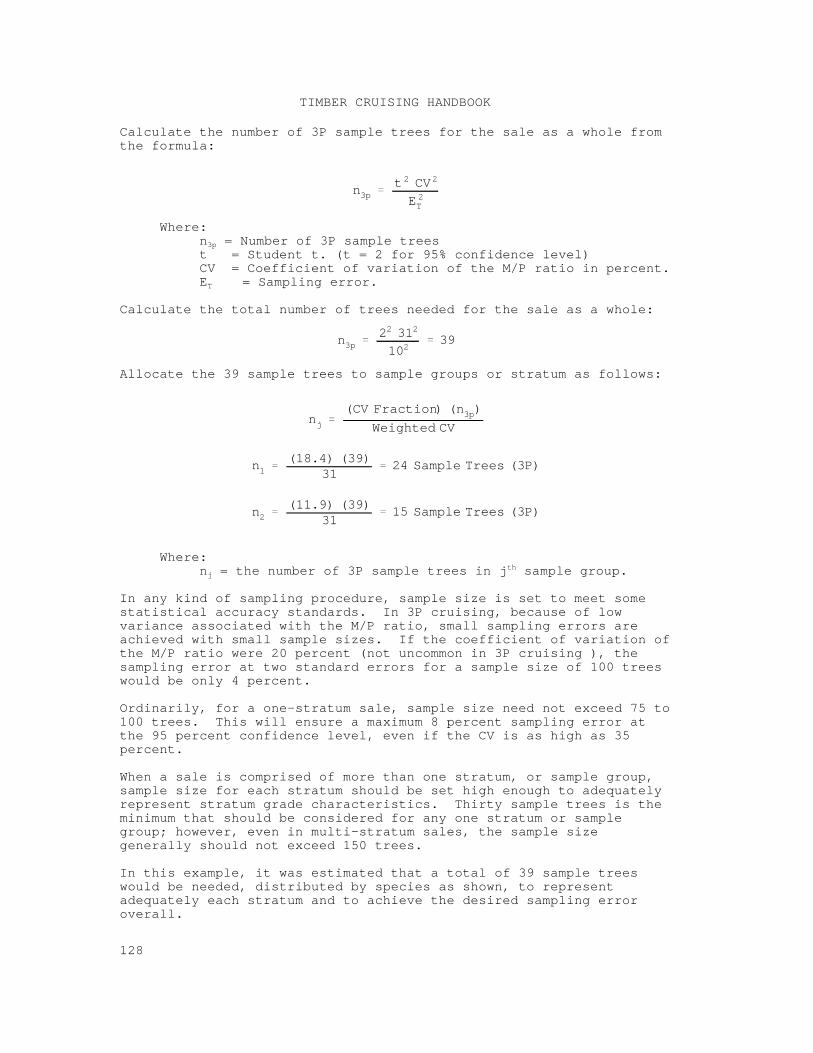
n3pt 2 CV2
E 2T
n3p22 312
10239
nj(CV Fraction) (n3p)
Weighted CV
n1(18.4) (39)
3124 Sample Trees (3P)
n2(11.9) (39)
3115 Sample Trees (3P)
TIMBER CRUISING HANDBOOK
128
Calculate the number of 3P sample trees for the sale as a whole fromthe formula:
Where:n = Number of 3P sample trees3p
t = Student t. (t = 2 for 95% confidence level)CV = Coefficient of variation of the M/P ratio in percent.E = Sampling error.T
Calculate the total number of trees needed for the sale as a whole:
Allocate the 39 sample trees to sample groups or stratum as follows:
Where:n = the number of 3P sample trees in j sample group.j
th
In any kind of sampling procedure, sample size is set to meet somestatistical accuracy standards. In 3P cruising, because of lowvariance associated with the M/P ratio, small sampling errors areachieved with small sample sizes. If the coefficient of variation ofthe M/P ratio were 20 percent (not uncommon in 3P cruising ), thesampling error at two standard errors for a sample size of 100 treeswould be only 4 percent.
Ordinarily, for a one-stratum sale, sample size need not exceed 75 to100 trees. This will ensure a maximum 8 percent sampling error atthe 95 percent confidence level, even if the CV is as high as 35percent.
When a sale is comprised of more than one stratum, or sample group,sample size for each stratum should be set high enough to adequatelyrepresent stratum grade characteristics. Thirty sample trees is theminimum that should be considered for any one stratum or samplegroup; however, even in multi-stratum sales, the sample sizegenerally should not exceed 150 trees.
In this example, it was estimated that a total of 39 sample treeswould be needed, distributed by species as shown, to representadequately each stratum and to achieve the desired sampling erroroverall.
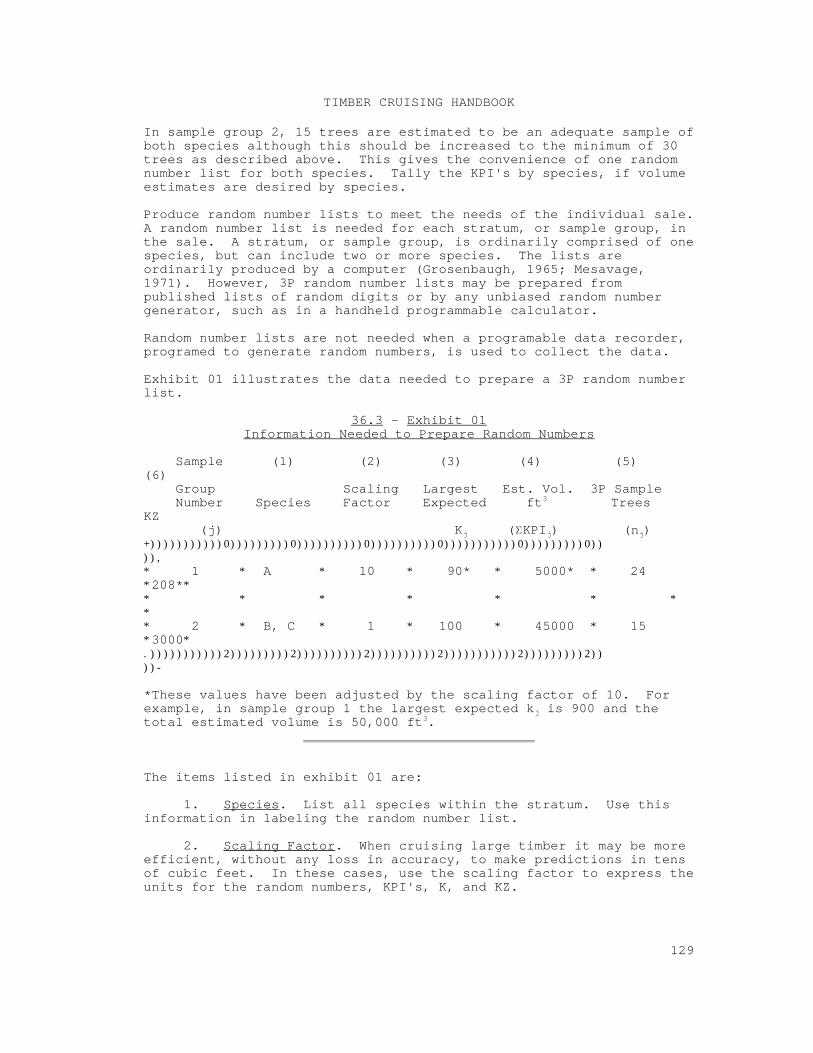
TIMBER CRUISING HANDBOOK
129
In sample group 2, 15 trees are estimated to be an adequate sample ofboth species although this should be increased to the minimum of 30trees as described above. This gives the convenience of one randomnumber list for both species. Tally the KPI's by species, if volumeestimates are desired by species.
Produce random number lists to meet the needs of the individual sale. A random number list is needed for each stratum, or sample group, inthe sale. A stratum, or sample group, is ordinarily comprised of onespecies, but can include two or more species. The lists areordinarily produced by a computer (Grosenbaugh, 1965; Mesavage,1971). However, 3P random number lists may be prepared frompublished lists of random digits or by any unbiased random numbergenerator, such as in a handheld programmable calculator.
Random number lists are not needed when a programable data recorder,programed to generate random numbers, is used to collect the data.
Exhibit 01 illustrates the data needed to prepare a 3P random numberlist.
36.3 - Exhibit 01Information Needed to Prepare Random Numbers
Sample (1) (2) (3) (4) (5) (6) Group Scaling Largest Est. Vol. 3P Sample Number Species Factor Expected ft Trees 3
KZ (j) K ( KPI ) (n )j j j
+)))))))))))0)))))))))0))))))))))0))))))))))0)))))))))))0)))))))))0)))),* 1 * A * 10 * 90* * 5000* * 24 *208*** * * * * * * ** 2 * B, C * 1 * 100 * 45000 * 15 *3000*.)))))))))))2)))))))))2))))))))))2))))))))))2)))))))))))2)))))))))2))))-
*These values have been adjusted by the scaling factor of 10. Forexample, in sample group 1 the largest expected k is 900 and thej
total estimated volume is 50,000 ft .3
The items listed in exhibit 01 are:
1. Species. List all species within the stratum. Use thisinformation in labeling the random number list.
2. Scaling Factor. When cruising large timber it may be moreefficient, without any loss in accuracy, to make predictions in tensof cubic feet. In these cases, use the scaling factor to express theunits for the random numbers, KPI's, K, and KZ.
TIMBER CRUISING HANDBOOK
130
In this example, K for Species A is 90 with a scaling factor of 10. This means that the random numbers are produced in terms of tens ofcubic feet and that no Species A tree larger than 900 cubic feet isexpected on the sale. The Species B and C are not scaled and have aK of 100. More precision in the volume estimates is desired in thisstratum because the trees are generally small. Random numbers forSpecies B and C are produced in terms of cubic feet, and the largestexpected tree in the stratum is 100 cubic feet.
3. K. The term K is associated with the volume of the largesttree in the stratum; the scaling factor (item 2) is applied to thisvalue. A prediction (KPI) cannot exceed this value. Thus, set K atleast as high as the expected volume of the largest tree. When atree is encountered that is larger than expected (that is, largerthan K) do one of two things: 1) 100 percent cruise the tree(Sure-Measured and not a part of the 3P cruise), or 2) record KPIbeing equal to K. Avoid either alternative by setting K artificiallyhigh. Setting K high will not affect the sampling rate.
4. Est. Vol. Make a preliminary estimate of stratum netvolume or an advance estimate of stratum sum KPI. In the example, itis shown in cubic feet; the scaling factor (item 2) is applied tothis value. Use this information to estimate KZ. If KPI's are tobe in terms of some other variable, such as DBH squared, make theadvance estimate of stratum sum KPI in terms of DBH squared.
5. 3P Sample Trees. This is the sample size estimated to beneeded to satisfy sampling error standards.
6. KZ. KZ is the sampling rate and is equal to EstimatedStratum Volume (Item 4) divided by number of 3P Sample Trees (Item5); the scaling factor is applied to this value. It is not necessarythat item 4, estimated net stratum volume, be very accurate (±30percent perhaps).
If a preliminary estimate of stratum volume is low, the actual numberof 3P sample trees will tend to exceed the presale estimate of Item(5), number of 3P sample trees. Conversely, if the preliminaryestimate of the sum of KPI is high, the actual number of 3P sampletrees will tend to be less than predicted. Sample error may also belower or higher, respectively, than originally planned.
On the average, one sample tree can be expected for each group oftree estimates (KPI's) totaling KZ, the sampling rate (Item 6). The probability of any tree being selected as a sample unit is equal toKPI/KZ.
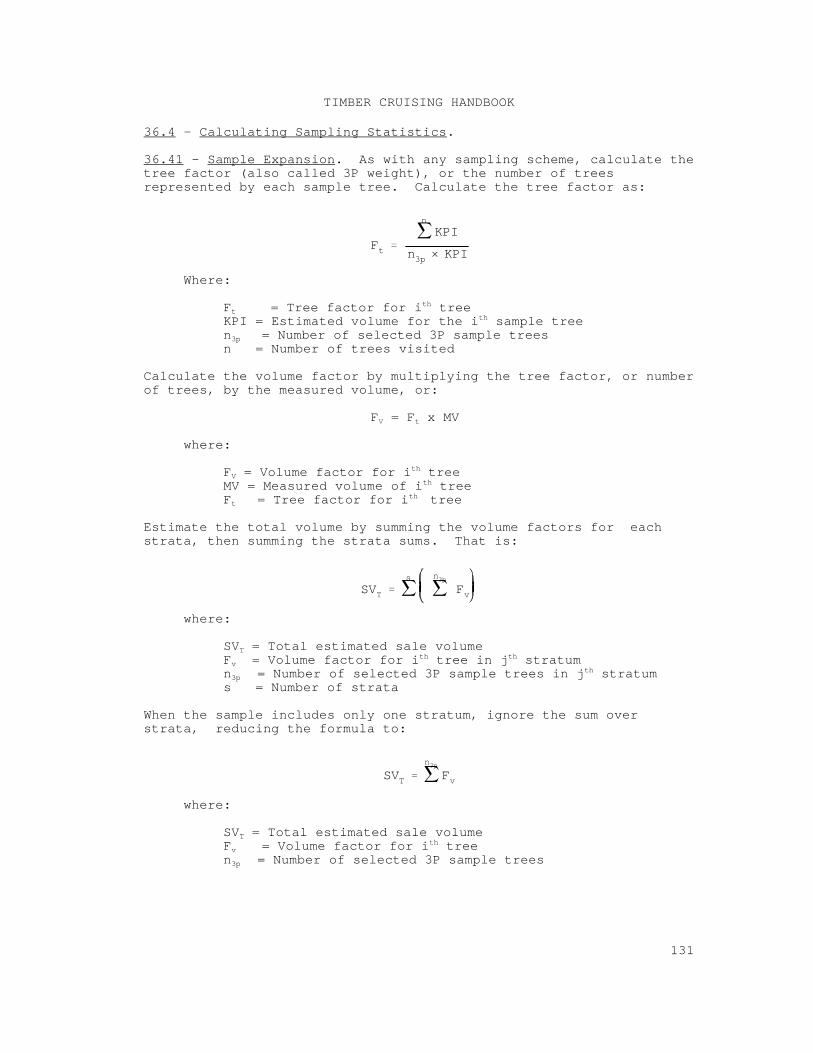
Ft
n
KPI
n3p × KPI
SVTs n3p
Fv
SVT
n3p
Fv
TIMBER CRUISING HANDBOOK
131
36.4 - Calculating Sampling Statistics.
36.41 - Sample Expansion. As with any sampling scheme, calculate thetree factor (also called 3P weight), or the number of treesrepresented by each sample tree. Calculate the tree factor as:
Where:
F = Tree factor for i treet th
KPI = Estimated volume for the i sample treeth
n = Number of selected 3P sample trees3p
n = Number of trees visited
Calculate the volume factor by multiplying the tree factor, or numberof trees, by the measured volume, or:
F = F x MV V t
where:
F = Volume factor for i treeVth
MV = Measured volume of i treeth
F = Tree factor for i treet th
Estimate the total volume by summing the volume factors for eachstrata, then summing the strata sums. That is:
where:
SV = Total estimated sale volumeT
F = Volume factor for i tree in j stratumvth th
n = Number of selected 3P sample trees in j stratum3p th
s = Number of strata
When the sample includes only one stratum, ignore the sum overstrata, reducing the formula to:
where:
SV = Total estimated sale volumeT
F = Volume factor for i treev th
n = Number of selected 3P sample trees3p
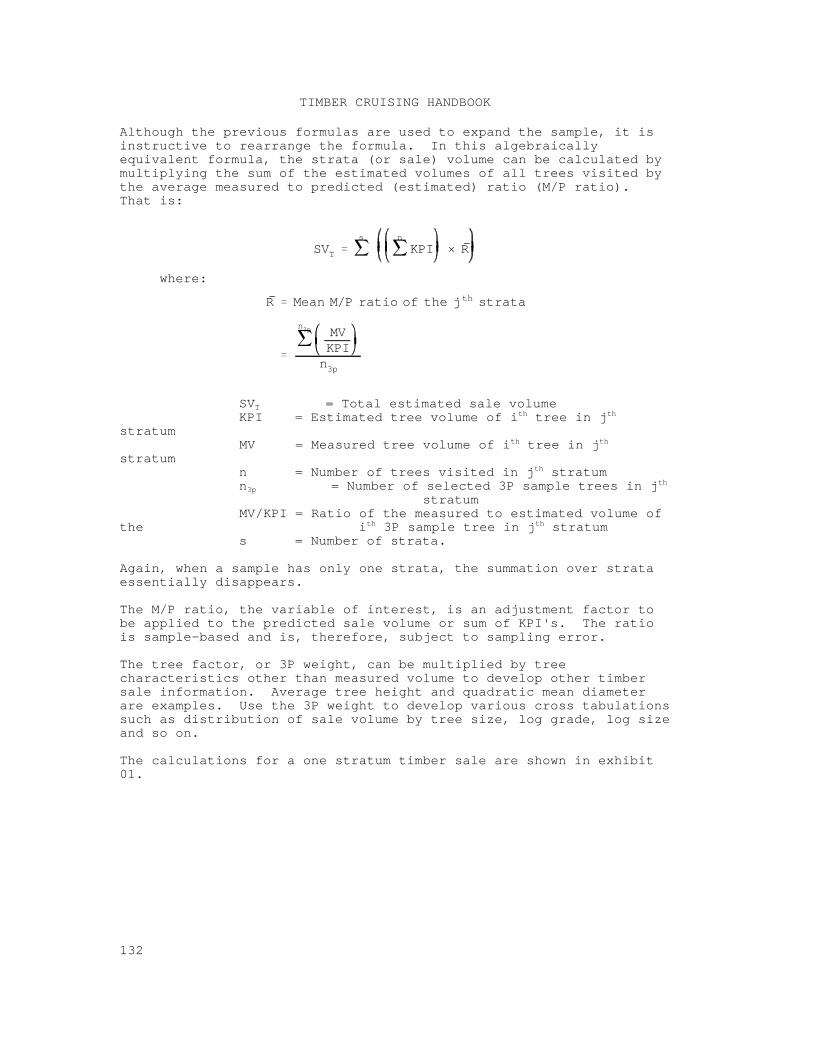
SVTs n
KPI × R
R Mean M/P ratio of the j th strata
n3p MVKPIn3p
TIMBER CRUISING HANDBOOK
132
Although the previous formulas are used to expand the sample, it isinstructive to rearrange the formula. In this algebraicallyequivalent formula, the strata (or sale) volume can be calculated bymultiplying the sum of the estimated volumes of all trees visited bythe average measured to predicted (estimated) ratio (M/P ratio). That is:
where:
SV = Total estimated sale volumeT
KPI = Estimated tree volume of i tree in jth th
stratum MV = Measured tree volume of i tree in jth th
stratum n = Number of trees visited in j stratumth
n = Number of selected 3P sample trees in j 3p th
stratum MV/KPI = Ratio of the measured to estimated volume of
the i 3P sample tree in j stratumth th
s = Number of strata.
Again, when a sample has only one strata, the summation over strata essentially disappears.
The M/P ratio, the variable of interest, is an adjustment factor tobe applied to the predicted sale volume or sum of KPI's. The ratiois sample-based and is, therefore, subject to sampling error.
The tree factor, or 3P weight, can be multiplied by treecharacteristics other than measured volume to develop other timbersale information. Average tree height and quadratic mean diameterare examples. Use the 3P weight to develop various cross tabulationssuch as distribution of sale volume by tree size, log grade, log sizeand so on.
The calculations for a one stratum timber sale are shown in exhibit01.
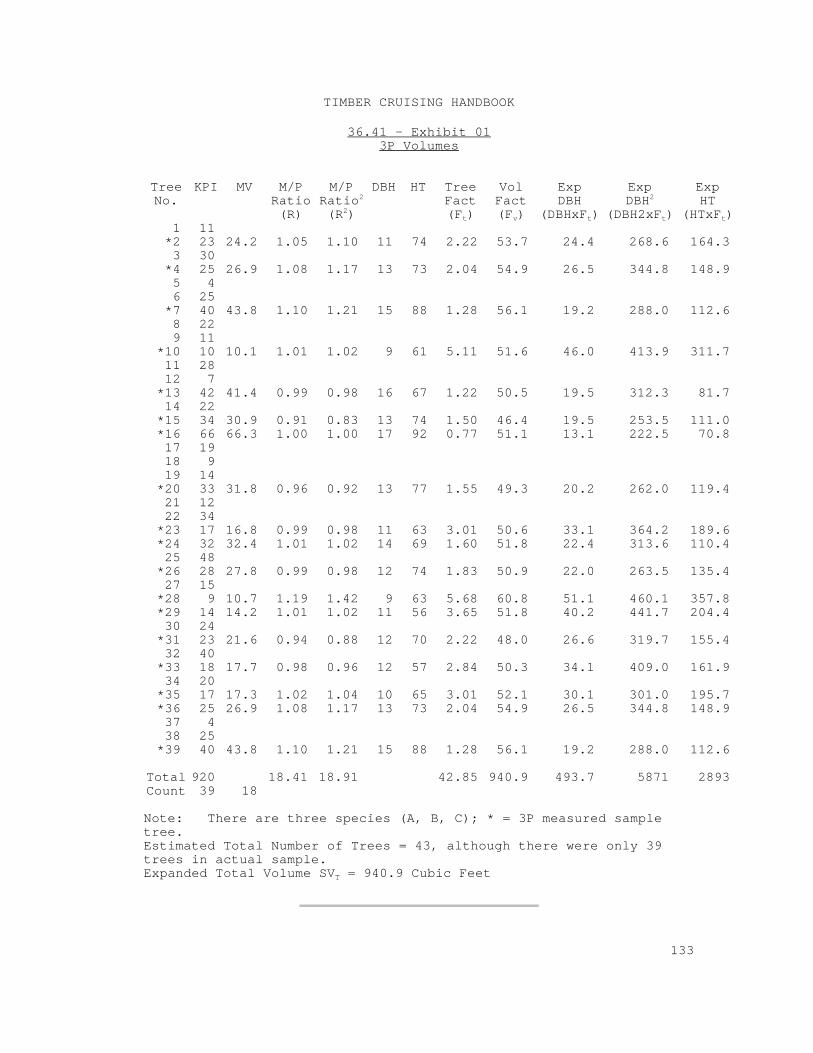
TIMBER CRUISING HANDBOOK
133
36.41 - Exhibit 013P Volumes
Tree KPI MV M/P M/P DBH HT Tree Vol Exp Exp ExpNo. Ratio Ratio Fact Fact DBH DBH HT
(R) (R ) (F ) (F ) (DBHxF ) (DBH2xF ) (HTxF )
2
2t v t
2
t t
1 11 *2 23 24.2 1.05 1.10 11 74 2.22 53.7 24.4 268.6 164.3 3 30
*4 25 26.9 1.08 1.17 13 73 2.04 54.9 26.5 344.8 148.9 5 4 6 25
*7 40 43.8 1.10 1.21 15 88 1.28 56.1 19.2 288.0 112.6 8 22 9 11
*10 10 10.1 1.01 1.02 9 61 5.11 51.6 46.0 413.9 311.7 11 28 12 7
*13 42 41.4 0.99 0.98 16 67 1.22 50.5 19.5 312.3 81.7 14 22
*15 34 30.9 0.91 0.83 13 74 1.50 46.4 19.5 253.5 111.0 *16 66 66.3 1.00 1.00 17 92 0.77 51.1 13.1 222.5 70.8 17 19 18 9 19 14
*20 33 31.8 0.96 0.92 13 77 1.55 49.3 20.2 262.0 119.4 21 12 22 34
*23 17 16.8 0.99 0.98 11 63 3.01 50.6 33.1 364.2 189.6 *24 32 32.4 1.01 1.02 14 69 1.60 51.8 22.4 313.6 110.4 25 48
*26 28 27.8 0.99 0.98 12 74 1.83 50.9 22.0 263.5 135.4 27 15
*28 9 10.7 1.19 1.42 9 63 5.68 60.8 51.1 460.1 357.8 *29 14 14.2 1.01 1.02 11 56 3.65 51.8 40.2 441.7 204.4 30 24
*31 23 21.6 0.94 0.88 12 70 2.22 48.0 26.6 319.7 155.4 32 40
*33 18 17.7 0.98 0.96 12 57 2.84 50.3 34.1 409.0 161.9 34 20
*35 17 17.3 1.02 1.04 10 65 3.01 52.1 30.1 301.0 195.7 *36 25 26.9 1.08 1.17 13 73 2.04 54.9 26.5 344.8 148.9 37 4 38 25
*39 40 43.8 1.10 1.21 15 88 1.28 56.1 19.2 288.0 112.6
Total 920 18.41 18.91 42.85 940.9 493.7 5871 2893 Count 39 18
Note: There are three species (A, B, C); * = 3P measured sampletree.Estimated Total Number of Trees = 43, although there were only 39trees in actual sample.Expanded Total Volume SV = 940.9 Cubic FeetT
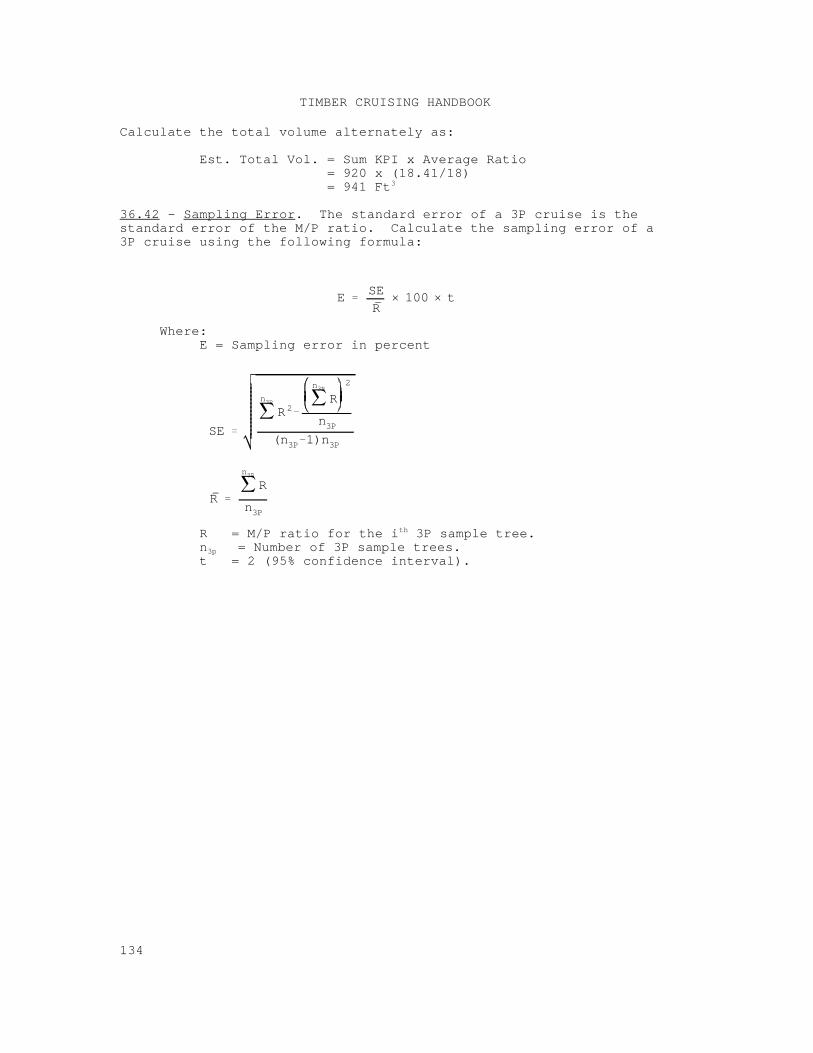
ESE
R× 100 × t
SE
n3P
R 2
n3P
R2
n3P(n3P 1)n3P
R
n3P
R
n3P
TIMBER CRUISING HANDBOOK
134
Calculate the total volume alternately as:
Est. Total Vol. = Sum KPI x Average Ratio = 920 x (18.41/18) = 941 Ft3
36.42 - Sampling Error. The standard error of a 3P cruise is thestandard error of the M/P ratio. Calculate the sampling error of a3P cruise using the following formula:
Where:E = Sampling error in percent
R = M/P ratio for the i 3P sample tree.th
n = Number of 3P sample trees.3p
t = 2 (95% confidence interval).
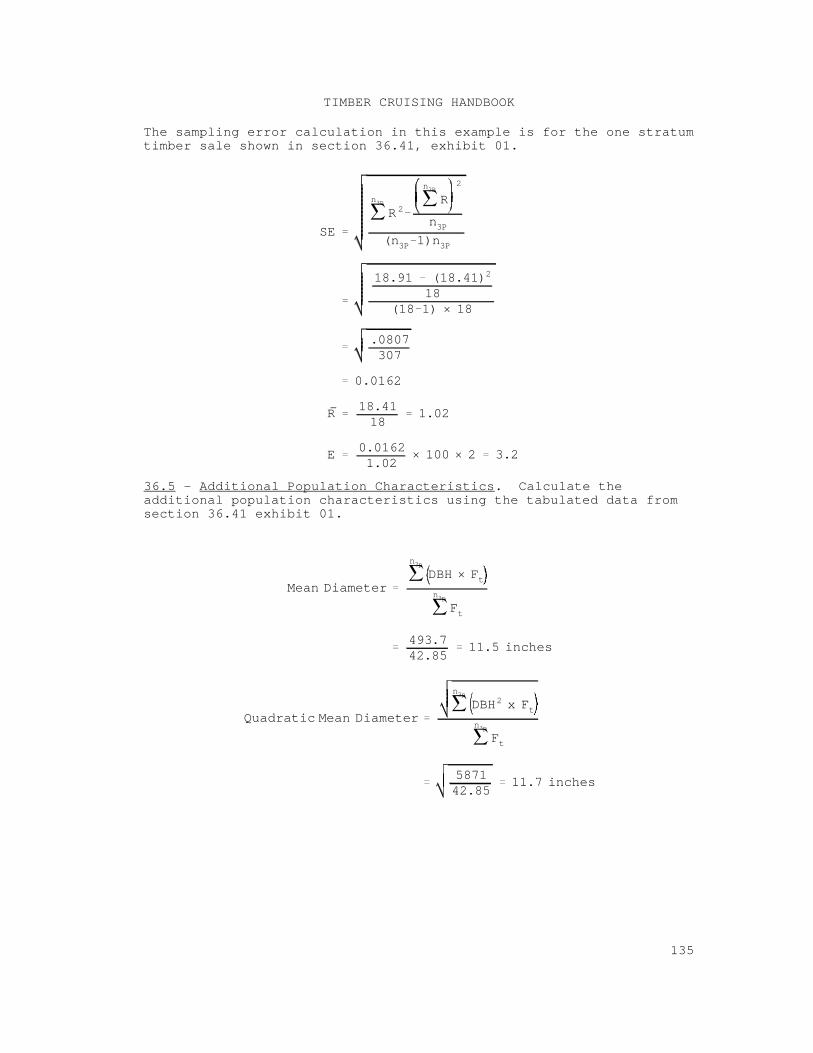
SE
n3P
R 2
n3P
R2
n3P(n3P 1)n3P
18.91 (18.41)2
18(18 1) × 18
.0807307
0.0162
R18.4118
1.02
E0.01621.02
× 100 × 2 3.2
Mean Diameter
n3p
DBH × Ftn3p
Ft
493.742.85
11.5 inches
Quadratic Mean Diameter
n3p
DBH2 x Ftn3p
Ft
587142.85
11.7 inches
TIMBER CRUISING HANDBOOK
135
The sampling error calculation in this example is for the one stratumtimber sale shown in section 36.41, exhibit 01.
36.5 - Additional Population Characteristics. Calculate theadditional population characteristics using the tabulated data fromsection 36.41 exhibit 01.
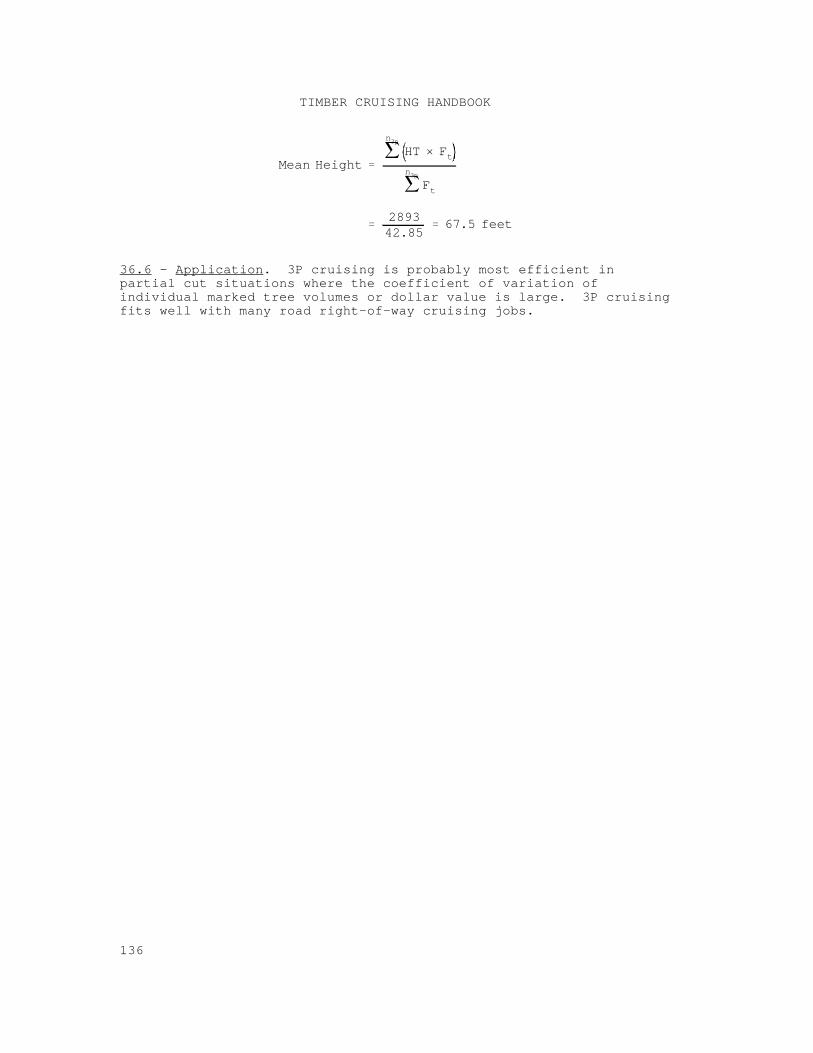
Mean Height
n3p
HT × Ftn3p
Ft
289342.85
67.5 feet
TIMBER CRUISING HANDBOOK
136
36.6 - Application. 3P cruising is probably most efficient inpartial cut situations where the coefficient of variation ofindividual marked tree volumes or dollar value is large. 3P cruisingfits well with many road right-of-way cruising jobs.

TIMBER CRUISING HANDBOOK
137
TIMBER CRUISING HANDBOOK
138
37 - TWO-STAGE SAMPLING. There are several methods of two-stagesampling. Common variants are discussed in this section.
37.1 - Sample-Tree With 3P Subsampling Method. Sample tree with 3Pis a two-stage sampling method. The first stage is an equalprobability sample where the probability of a tree being selected asa sampling unit is proportional to the tree frequency in thepopulation. Trees are selected randomly or systematically and KPI isestimated for each first stage sample tree.
The second stage is a 3P sample of the trees selected with equalprobability in the first stage. Select 3P sample trees by comparingthe volume prediction (KPI) for a sample tree with a random number. If the KPI is equal to or greater than the random number, measure asa 3P sample tree.
37.12 - Operational Features. The operational features ofsample-tree cruising are described in section 33 and the operationalfeatures for 3P sampling are described in section 36. The 3Pprocedure for sample-tree 3P is the same, except that KPI isestimated and recorded only for the sample trees selected in thefirst stage.
37.13 - Statistical Features. Sample-tree 3P sampling includes equalprobability sampling at the first stage and variable probability (3P)sampling at the second stage. The variable of interest at the firststage is generally volume per tree, while the variable of interest atthe second stage is the measured to predicted (M/P) ratio.
There are two sources of statistical error in a sample-tree 3Psample: the estimate of the stratum sum KPI and the estimate of thestratum mean M/P ratio. The population parameter for which samplingerror is estimated in the first stage is mean tree KPI. In thesecond or 3P stage, sampling error is estimated for the mean M/Pratio which is ordinarily measured tree volume divided by estimatedtree volume in sample-tree 3P cruising.
37.14 - Calculating Sample Size. Calculate combined sampling errorin order to determine sample size for sample-tree 3P cruising. Determine sample size (number of trees) for the sample-tree sampleand for the 3P sample to satisfy the desired sampling error for thestratum.
The combined sampling error includes the sample tree (first stage)error and the 3P (second stage) error.
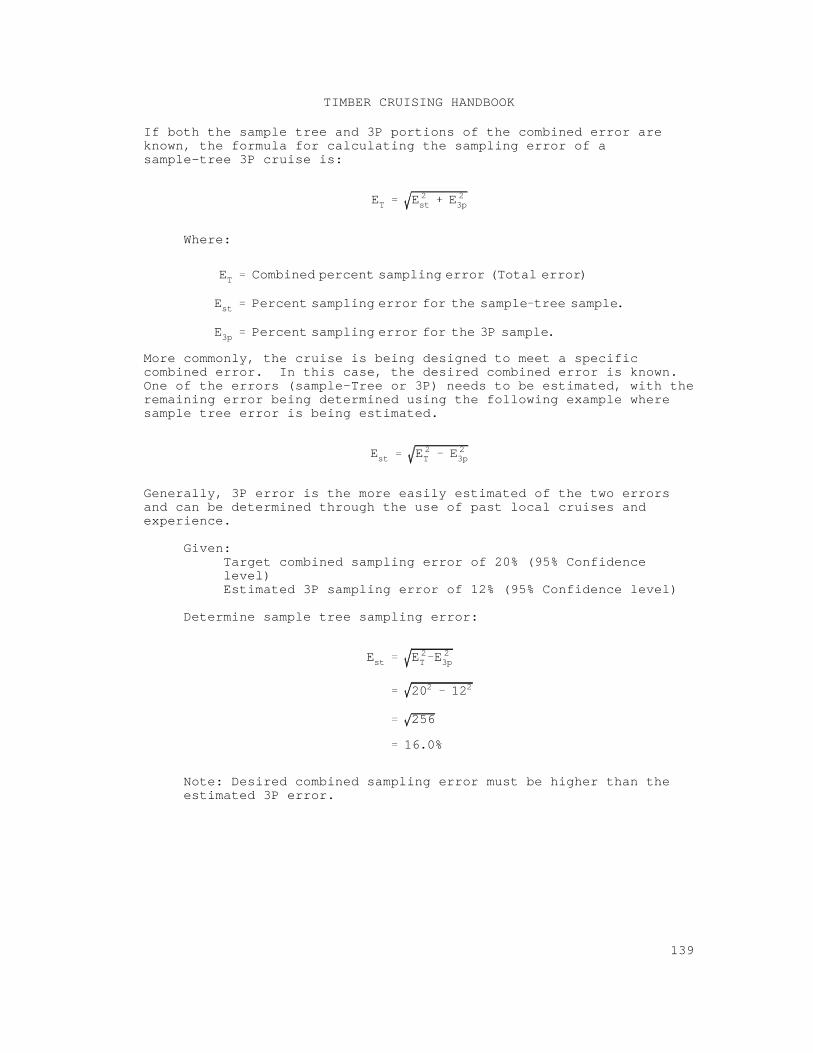
ET E 2st E 2
3p
ET Combined percent sampling error (Total error)
Est Percent sampling error for the sample tree sample.
E3p Percent sampling error for the 3P sample.
Est E 2T E 2
3p
Est E 2T E 2
3p
202 122
256
16.0%
TIMBER CRUISING HANDBOOK
139
If both the sample tree and 3P portions of the combined error areknown, the formula for calculating the sampling error of asample-tree 3P cruise is:
Where:
More commonly, the cruise is being designed to meet a specificcombined error. In this case, the desired combined error is known. One of the errors (sample-Tree or 3P) needs to be estimated, with theremaining error being determined using the following example wheresample tree error is being estimated.
Generally, 3P error is the more easily estimated of the two errorsand can be determined through the use of past local cruises andexperience.
Given:Target combined sampling error of 20% (95% Confidencelevel)Estimated 3P sampling error of 12% (95% Confidence level)
Determine sample tree sampling error:
Note: Desired combined sampling error must be higher than theestimated 3P error.

TIMBER CRUISING HANDBOOK
140
To determine the number of samples needed to attain the errorsidentified for each stage of the sample tree with 3P cruise, estimatethe coefficient of variation between sample trees in the first stage,and between predicted and actual measurements in the second stage. This estimate can be based on preliminary sample data, past cruisesin the area in similar types, or inventory data.
First Stage Second Stage
Assumed Coefficient Assumed Coefficient of Variation = 80% of Variation = 25% t = 2 t = 2
Sampling error = 16% Sampling error = 12%
n = (t ) (CV ) n =st st 3p2 2
(t ) (CV ) 2 23p
E Est 3p2 2
= (2 ) (80 ) = (2 ) (25 ) 2 2 2 2
16 12 2 2
= 100 trees = 18 trees
37.15 - Producing Random Number List. Random numbers for sample-treewith 3P cruises are ordinarily in terms of per tree volume.
Use the following information to prepare a random number list:
1. Estimate of the sum of the KPI's (estimated tree volumes)for all the first stage sample trees (trees for which a KPI will bemade).
2. Estimate of the largest tree volume in the population (K).
3. Estimate of the total number of first stage sample trees.
4. Number of 3P sample trees desired.
5. Sampling rate (KZ) (see below).
6. Number of first stage sample trees n = 100st
7. Number of 3P sample trees n = 183p
TIMBER CRUISING HANDBOOK
141
In addition, estimates of largest volume (K = 80 ft in example) and3
average KPI (22 ft in the example) are used. This information can3
come from precruise data, inventory data, prior cruises, and personalknowledge of the area. For example:
Estimated Sum KPI = 22 x 100 = 2,200 Ft .3
Sampling rate (KZ) = Sum KPI No. of 3P sample trees
= 2,200 18
= 122.2 (rounded to next whole number)
= 123
For this example, the set of random numbers would have thefollowing characteristics:
K = 80 ft .3
KZ = 123 or one 3P sample tree per 123 Ft .3
37.16 - Calculating Sampling Statistics.
37.16a - Sample Expansion. The expansion of the sample-tree 3Psample trees to the stratum level involves calculating the combinedsample tree weight or frequency considering both the sample-treesample and the 3P sample.
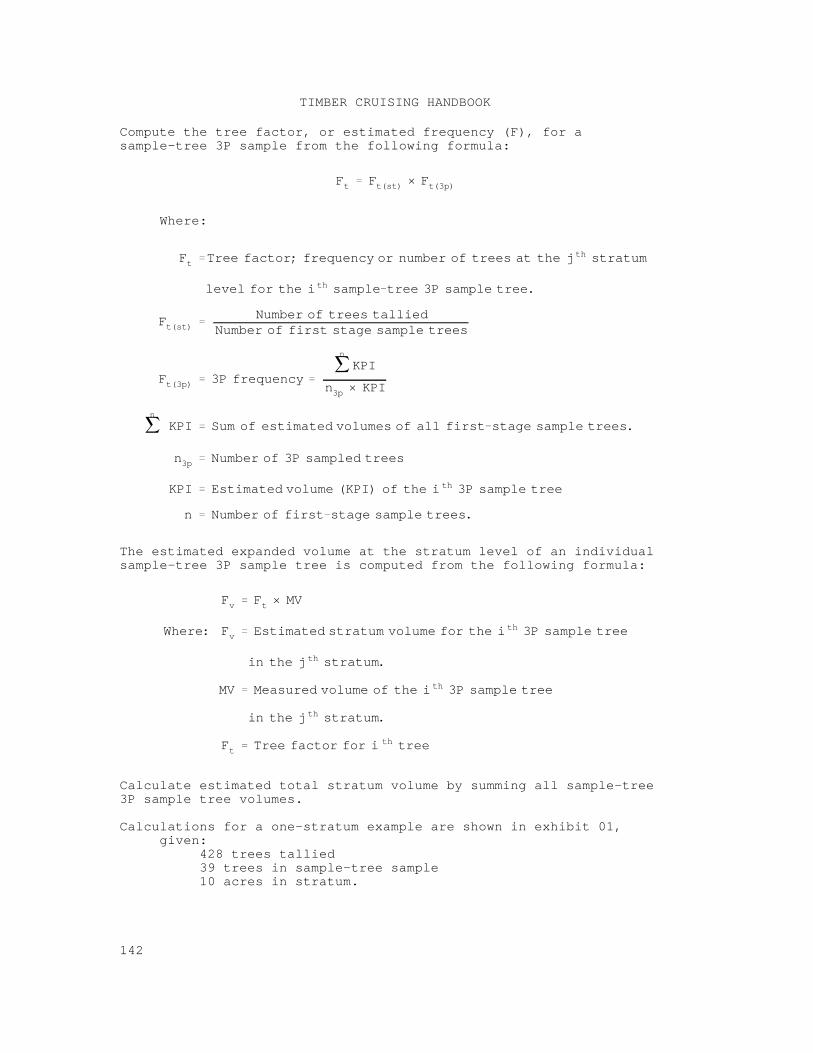
Ft Ft(st) × Ft(3p)
Ft Tree factor; frequency or number of trees at the j th stratum
level for the i th sample tree 3P sample tree.
Ft(st)Number of trees tallied
Number of first stage sample trees
Ft(3p) 3P frequency
n
KPI
n3p × KPI
n
KPI Sum of estimated volumes of all first stage sample trees.
n3p Number of 3P sampled trees
KPI Estimated volume (KPI) of the i th 3P sample tree
n Number of first stage sample trees.
Fv Ft × MV
Where: Fv Estimated stratum volume for the i th 3P sample tree
in the j th stratum.
MV Measured volume of the i th 3P sample tree
in the j th stratum.
Ft Tree factor for i th tree
TIMBER CRUISING HANDBOOK
142
Compute the tree factor, or estimated frequency (F), for asample-tree 3P sample from the following formula:
Where:
The estimated expanded volume at the stratum level of an individualsample-tree 3P sample tree is computed from the following formula:
Calculate estimated total stratum volume by summing all sample-tree3P sample tree volumes.
Calculations for a one-stratum example are shown in exhibit 01,given:
428 trees tallied39 trees in sample-tree sample10 acres in stratum.
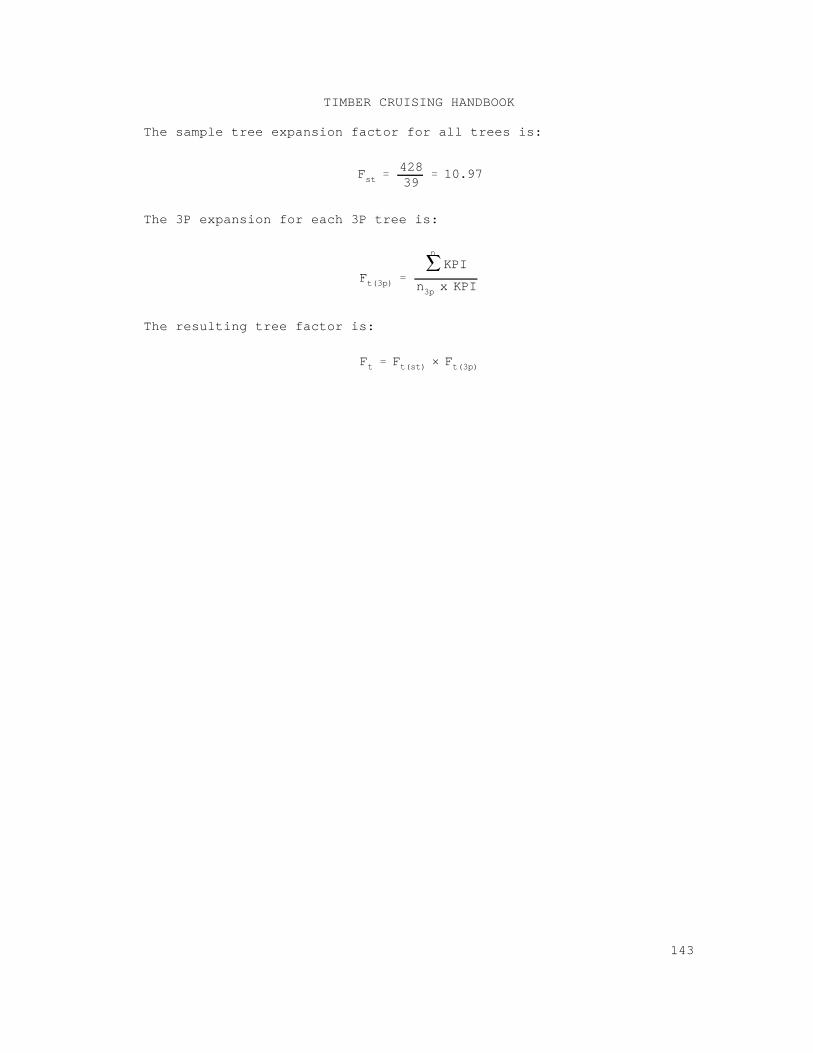
Fst42839
10.97
Ft(3p)
n
KPI
n3p x KPI
Ft Ft(st) × Ft(3p)
TIMBER CRUISING HANDBOOK
143
The sample tree expansion factor for all trees is:
The 3P expansion for each 3P tree is:
The resulting tree factor is:
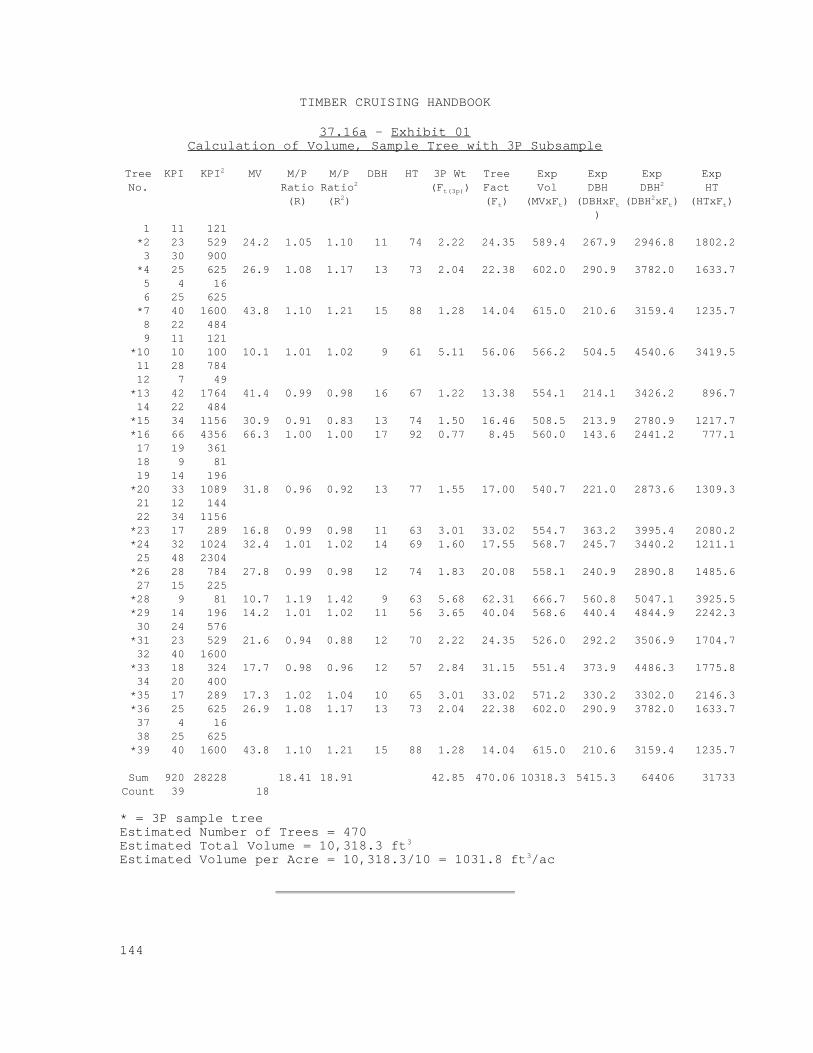
TIMBER CRUISING HANDBOOK
144
37.16a - Exhibit 01Calculation of Volume, Sample Tree with 3P Subsample
Tree KPI KPI MV M/P M/P DBH HT 3P Wt Tree Exp Exp Exp ExpNo. Ratio Ratio (F ) Fact Vol DBH DBH HT
2
(R) (R ) (F ) (MVxF ) (DBHxF (DBH xF ) (HTxF )
2
2t(3p)
t t t
)
2
2t t
1 11 121 *2 23 529 24.2 1.05 1.10 11 74 2.22 24.35 589.4 267.9 2946.8 1802.2 3 30 900
*4 25 625 26.9 1.08 1.17 13 73 2.04 22.38 602.0 290.9 3782.0 1633.7 5 4 16 6 25 625
*7 40 1600 43.8 1.10 1.21 15 88 1.28 14.04 615.0 210.6 3159.4 1235.7 8 22 484 9 11 121
*10 10 100 10.1 1.01 1.02 9 61 5.11 56.06 566.2 504.5 4540.6 3419.5 11 28 784 12 7 49
*13 42 1764 41.4 0.99 0.98 16 67 1.22 13.38 554.1 214.1 3426.2 896.7 14 22 484
*15 34 1156 30.9 0.91 0.83 13 74 1.50 16.46 508.5 213.9 2780.9 1217.7 *16 66 4356 66.3 1.00 1.00 17 92 0.77 8.45 560.0 143.6 2441.2 777.1 17 19 361 18 9 81 19 14 196
*20 33 1089 31.8 0.96 0.92 13 77 1.55 17.00 540.7 221.0 2873.6 1309.3 21 12 144 22 34 1156
*23 17 289 16.8 0.99 0.98 11 63 3.01 33.02 554.7 363.2 3995.4 2080.2 *24 32 1024 32.4 1.01 1.02 14 69 1.60 17.55 568.7 245.7 3440.2 1211.1 25 48 2304
*26 28 784 27.8 0.99 0.98 12 74 1.83 20.08 558.1 240.9 2890.8 1485.6 27 15 225
*28 9 81 10.7 1.19 1.42 9 63 5.68 62.31 666.7 560.8 5047.1 3925.5 *29 14 196 14.2 1.01 1.02 11 56 3.65 40.04 568.6 440.4 4844.9 2242.3 30 24 576
*31 23 529 21.6 0.94 0.88 12 70 2.22 24.35 526.0 292.2 3506.9 1704.7 32 40 1600
*33 18 324 17.7 0.98 0.96 12 57 2.84 31.15 551.4 373.9 4486.3 1775.8 34 20 400
*35 17 289 17.3 1.02 1.04 10 65 3.01 33.02 571.2 330.2 3302.0 2146.3 *36 25 625 26.9 1.08 1.17 13 73 2.04 22.38 602.0 290.9 3782.0 1633.7 37 4 16 38 25 625
*39 40 1600 43.8 1.10 1.21 15 88 1.28 14.04 615.0 210.6 3159.4 1235.7
Sum 920 28228 18.41 18.91 42.85 470.06 10318.3 5415.3 64406 31733 Count 39 18
* = 3P sample treeEstimated Number of Trees = 470Estimated Total Volume = 10,318.3 ft3
Estimated Volume per Acre = 10,318.3/10 = 1031.8 ft /ac3
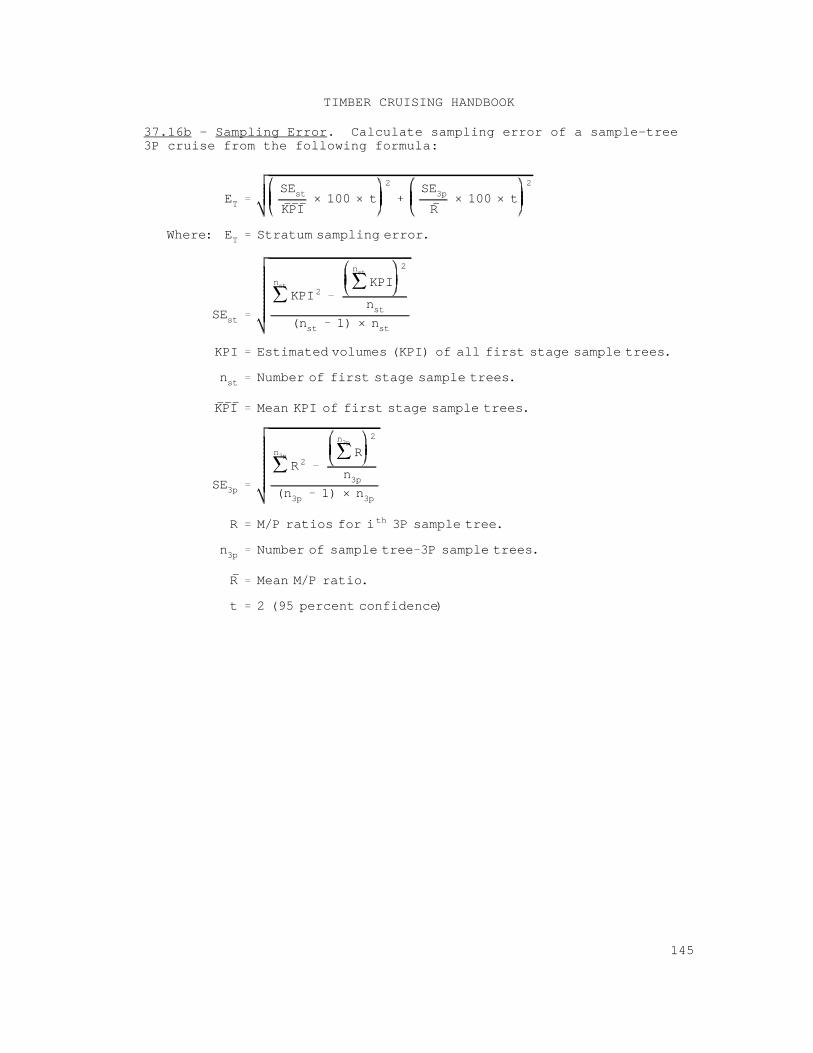
ETSEstKPI
× 100 × t2 SE3p
R× 100 × t
2
Where: ET Stratum sampling error.
SEst
nst
KPI2
nst
KPI2
nst(nst 1) × nst
KPI Estimated volumes (KPI) of all first stage sample trees.
nst Number of first stage sample trees.
KPI Mean KPI of first stage sample trees.
SE3p
n3p
R 2
n3p
R2
n3p(n3p 1) × n3p
R M/P ratios for i th 3P sample tree.
n3p Number of sample tree 3P sample trees.
R Mean M/P ratio.
t 2 (95 percent confidence)
TIMBER CRUISING HANDBOOK
145
37.16b - Sampling Error. Calculate sampling error of a sample-tree3P cruise from the following formula:
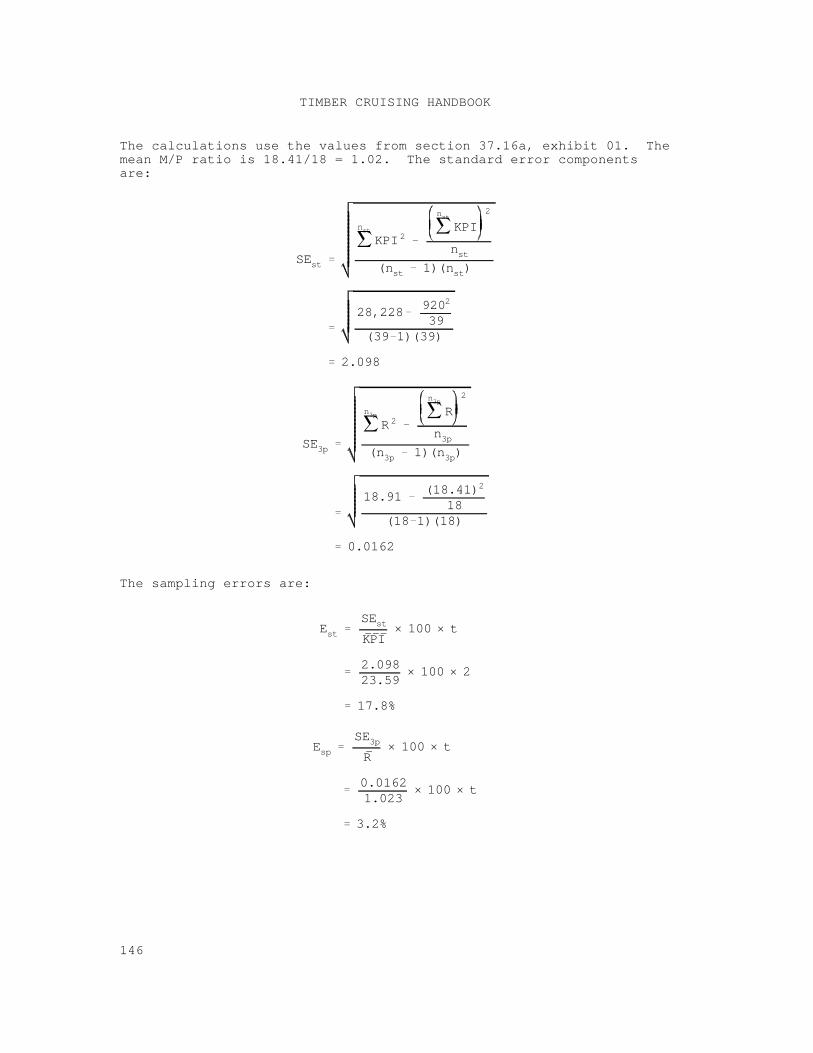
SEst
nst
KPI2
nst
KPI2
nst(nst 1)(nst)
28,2289202
39(39 1)(39)
2.098
SE3p
n3p
R 2
n3p
R2
n3p(n3p 1)(n3p)
18.91(18.41)2
18(18 1)(18)
0.0162
EstSEstKPI
× 100 × t
2.09823.59
× 100 × 2
17.8%
EspSE3pR
× 100 × t
0.01621.023
× 100 × t
3.2%
TIMBER CRUISING HANDBOOK
146
The calculations use the values from section 37.16a, exhibit 01. Themean M/P ratio is 18.41/18 = 1.02. The standard error componentsare:
The sampling errors are:
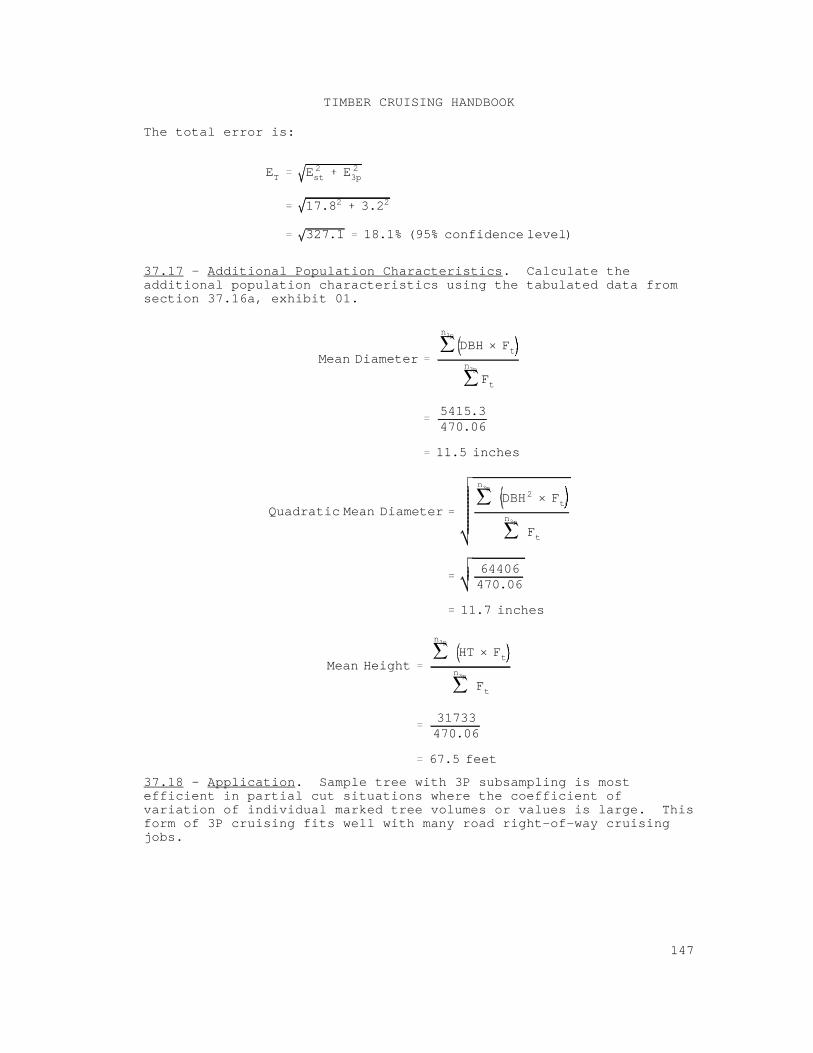
ET E 2st E 2
3p
17.82 3.22
327.1 18.1% (95% confidence level)
Mean Diameter
n3p
DBH × Ftn3p
Ft
5415.3470.06
11.5 inches
Quadratic Mean Diameter
n3p
DBH2 × Ftn3p
Ft
64406470.06
11.7 inches
Mean Height
n3p
HT × Ftn3p
Ft
31733470.06
67.5 feet
TIMBER CRUISING HANDBOOK
147
The total error is:
37.17 - Additional Population Characteristics. Calculate theadditional population characteristics using the tabulated data fromsection 37.16a, exhibit 01.
37.18 - Application. Sample tree with 3P subsampling is mostefficient in partial cut situations where the coefficient ofvariation of individual marked tree volumes or values is large. Thisform of 3P cruising fits well with many road right-of-way cruisingjobs.
TIMBER CRUISING HANDBOOK
148
37.2 - Fixed Area Plot With 3P Subsampling.
37.21 - Fixed Area Plot With 3P Subsampling Method. Plot-3P is atwo-stage sampling system. The first stage is a fixed area samplewhere the probability of a tree being selected as a sample unit isproportional to the tree frequency in the population. The secondstage is a 3P sample of the sample trees on the fixed area plots.
In the second or 3P stage, estimate and record volume (KPI) of eachsample tree on the fixed area plot. Select 3P sample trees bycomparing the volume estimate (KPI) for a sample tree with a randomnumber. If the KPI is equal to or greater than the random number,measure the tree as a sample tree.
37.22 - Operational Features. The operational features of the firststage fixed area plot cruising are described in section 34. Thepurpose of the plot sample in plot-3P cruising is to estimate thestratum sum of KPI's. KPI is in terms of tree volume.
Operational features for the second stage 3P sampling are describedin section 36. The 3P procedure for plot-3P cruising is the sameexcept that KPI is estimated and recorded only for the trees on theplot.
37.23 - Statistical Features. Plot-3P sampling includes equalprobability sampling at the first stage and variable probability (3P)sampling at the second stage. The variable of interest at the firststage is generally volume per acre while the variable of interest atthe second stage is the measured to predicted (M/P) ratio.
There are two sources of statistical error in plot-3P sampling: theestimate of the stratum sum KPI (estimated volume) and the estimateof the stratum mean M/P ratio. In the first stage, the populationparameter for which sampling error is estimated is mean sum estimatedvolume (KPI) for each plot.
In the second or 3P stage, sampling error is estimated for the meanM/P ratio which is measured tree volume divided by estimated treevolume in plot-3P cruising. The sampling error for each stratumincludes both sources of error.
37.24 - Calculating Sample Size. Combined sampling error must becalculated in order to determine sample size for fixed plot-3Pcruising. Sample size is determined for both the sample fixed plot(number of plots) and for the 3P sample (number of trees) to satisfythe desired sampling error for the stratum.
The combined sampling error includes the fixed plot (first stage)error and the 3P (second stage) error.
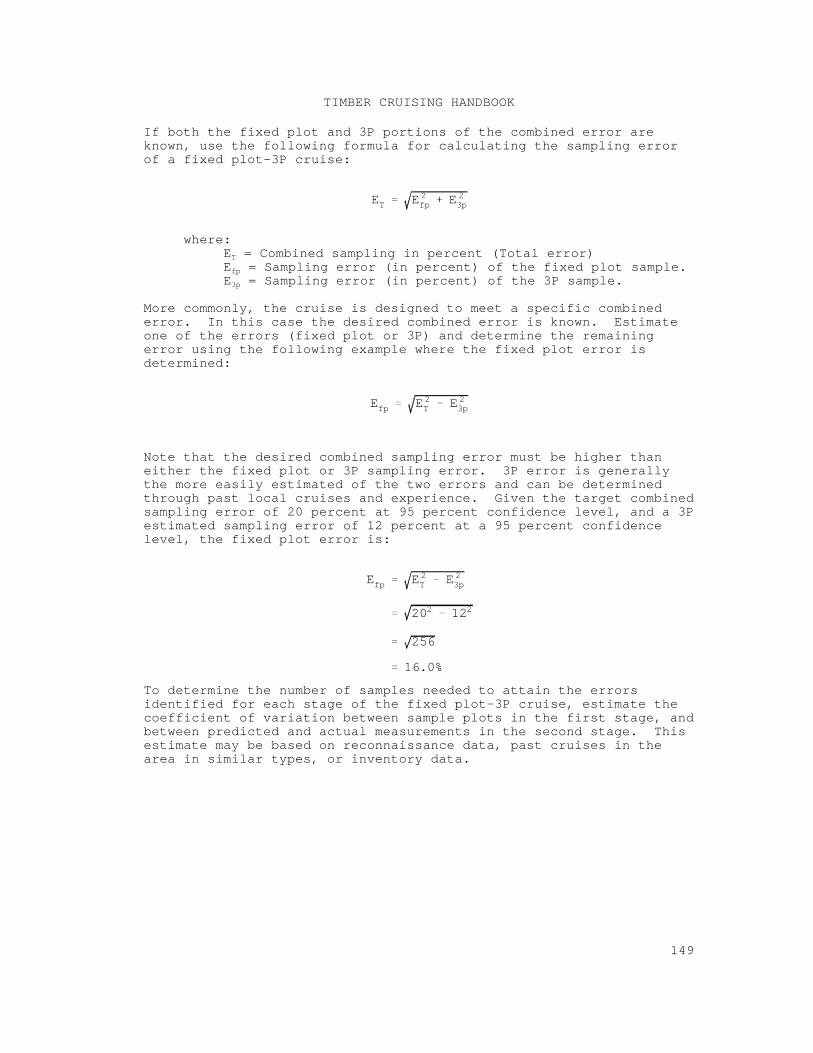
ET E 2fp E 2
3p
Efp E 2T E 2
3p
Efp E 2T E 2
3p
202 122
256
16.0%
TIMBER CRUISING HANDBOOK
149
If both the fixed plot and 3P portions of the combined error areknown, use the following formula for calculating the sampling errorof a fixed plot-3P cruise:
where:E = Combined sampling in percent (Total error)T
E = Sampling error (in percent) of the fixed plot sample.fp
E = Sampling error (in percent) of the 3P sample.3p
More commonly, the cruise is designed to meet a specific combinederror. In this case the desired combined error is known. Estimateone of the errors (fixed plot or 3P) and determine the remainingerror using the following example where the fixed plot error isdetermined:
Note that the desired combined sampling error must be higher thaneither the fixed plot or 3P sampling error. 3P error is generallythe more easily estimated of the two errors and can be determinedthrough past local cruises and experience. Given the target combinedsampling error of 20 percent at 95 percent confidence level, and a 3Pestimated sampling error of 12 percent at a 95 percent confidencelevel, the fixed plot error is:
To determine the number of samples needed to attain the errorsidentified for each stage of the fixed plot-3P cruise, estimate thecoefficient of variation between sample plots in the first stage, andbetween predicted and actual measurements in the second stage. Thisestimate may be based on reconnaissance data, past cruises in thearea in similar types, or inventory data.

nfp(CV 2
fp) (t 2)
E 2fp
(502) (22)
162
39 points
n3p(CV 2
3p) (t 2)
E 23p
(252)(22)
122
18 trees
TIMBER CRUISING HANDBOOK
150
First Stage (Plots) Second Stage (Trees) Assumed Coefficient Assumed Coefficient of Variation = 50% of Variation = 25%
Confidence Level = 95% (t=2) Confidence Level = 95% (t=2)
37.25 - Producing Random Number List. Random numbers for plot-3Pcruises are in terms per tree of volume.
Use the following example to prepare a random number list:
1. Estimate of the sum of KPI's (estimated tree volumes) onall the sample plots.
2. Estimate of the largest tree volume in the population (K).
3. Estimate of the total number sample trees on all the plots.
4. Number of 3P sample trees desired.
5. Sampling rate (KZ).
6. Number of plots = 39
7. Number of 3P sample trees = 18
In addition, it is estimated:
Largest volume (K) = 80 ft .3
Average KPI = 23.1 ft .3
Average number of sample trees per plot = 4.3
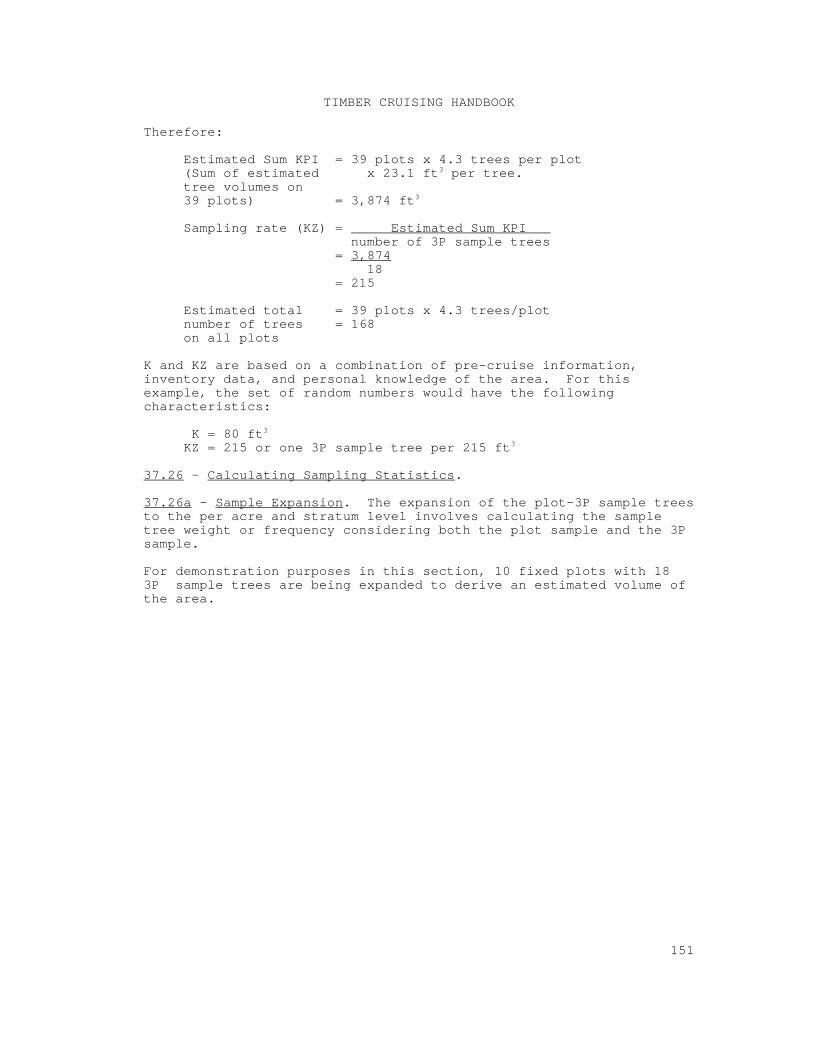
TIMBER CRUISING HANDBOOK
151
Therefore:
Estimated Sum KPI = 39 plots x 4.3 trees per plot(Sum of estimated x 23.1 ft per tree.3
tree volumes on39 plots) = 3,874 ft3
Sampling rate (KZ) = Estimated Sum KPI number of 3P sample trees
= 3,874 18
= 215
Estimated total = 39 plots x 4.3 trees/plotnumber of trees = 168
on all plots
K and KZ are based on a combination of pre-cruise information,inventory data, and personal knowledge of the area. For thisexample, the set of random numbers would have the followingcharacteristics:
K = 80 ft3
KZ = 215 or one 3P sample tree per 215 ft3
37.26 - Calculating Sampling Statistics.
37.26a - Sample Expansion. The expansion of the plot-3P sample treesto the per acre and stratum level involves calculating the sampletree weight or frequency considering both the plot sample and the 3Psample.
For demonstration purposes in this section, 10 fixed plots with 183P sample trees are being expanded to derive an estimated volume ofthe area.
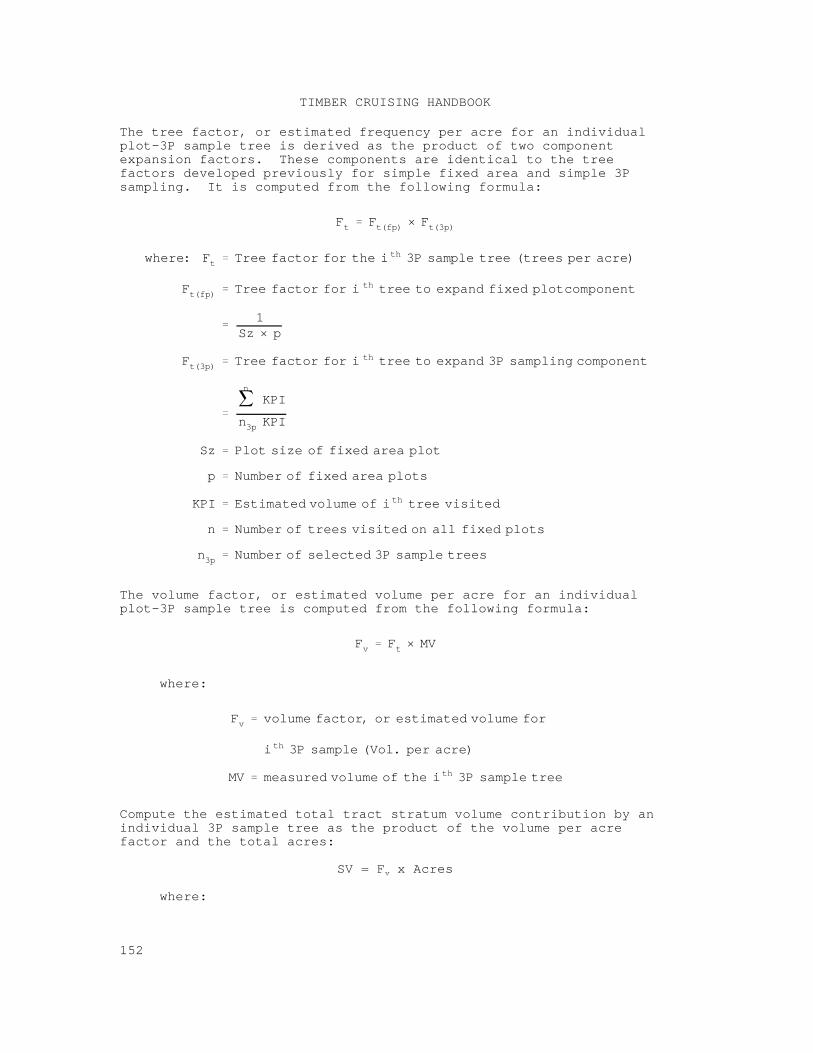
Ft Ft(fp) × Ft(3p)
where: Ft Tree factor for the i th 3P sample tree (trees per acre)
Ft(fp) Tree factor for i th tree to expand fixed plotcomponent
1Sz × p
Ft(3p) Tree factor for i th tree to expand 3P sampling component
n
KPI
n3p KPI
Sz Plot size of fixed area plot
p Number of fixed area plots
KPI Estimated volume of i th tree visited
n Number of trees visited on all fixed plots
n3p Number of selected 3P sample trees
Fv Ft × MV
Fv volume factor, or estimated volume for
i th 3P sample (Vol. per acre)
MV measured volume of the i th 3P sample tree
TIMBER CRUISING HANDBOOK
152
The tree factor, or estimated frequency per acre for an individualplot-3P sample tree is derived as the product of two componentexpansion factors. These components are identical to the treefactors developed previously for simple fixed area and simple 3Psampling. It is computed from the following formula:
The volume factor, or estimated volume per acre for an individualplot-3P sample tree is computed from the following formula:
where:
Compute the estimated total tract stratum volume contribution by anindividual 3P sample tree as the product of the volume per acrefactor and the total acres:
SV = F x Acresv
where:
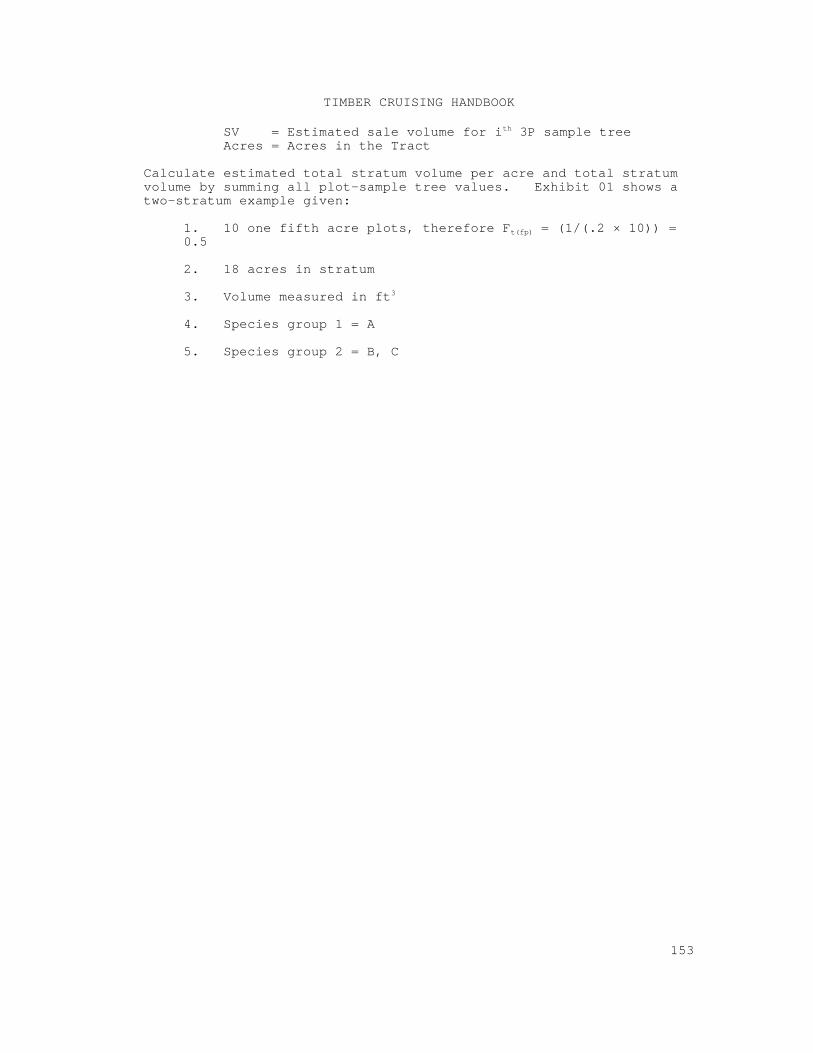
TIMBER CRUISING HANDBOOK
153
SV = Estimated sale volume for i 3P sample treeth
Acres = Acres in the Tract
Calculate estimated total stratum volume per acre and total stratumvolume by summing all plot-sample tree values. Exhibit 01 shows atwo-stratum example given:
1. 10 one fifth acre plots, therefore F = (1/(.2 × 10)) =t(fp)
0.5
2. 18 acres in stratum
3. Volume measured in ft3
4. Species group 1 = A
5. Species group 2 = B, C
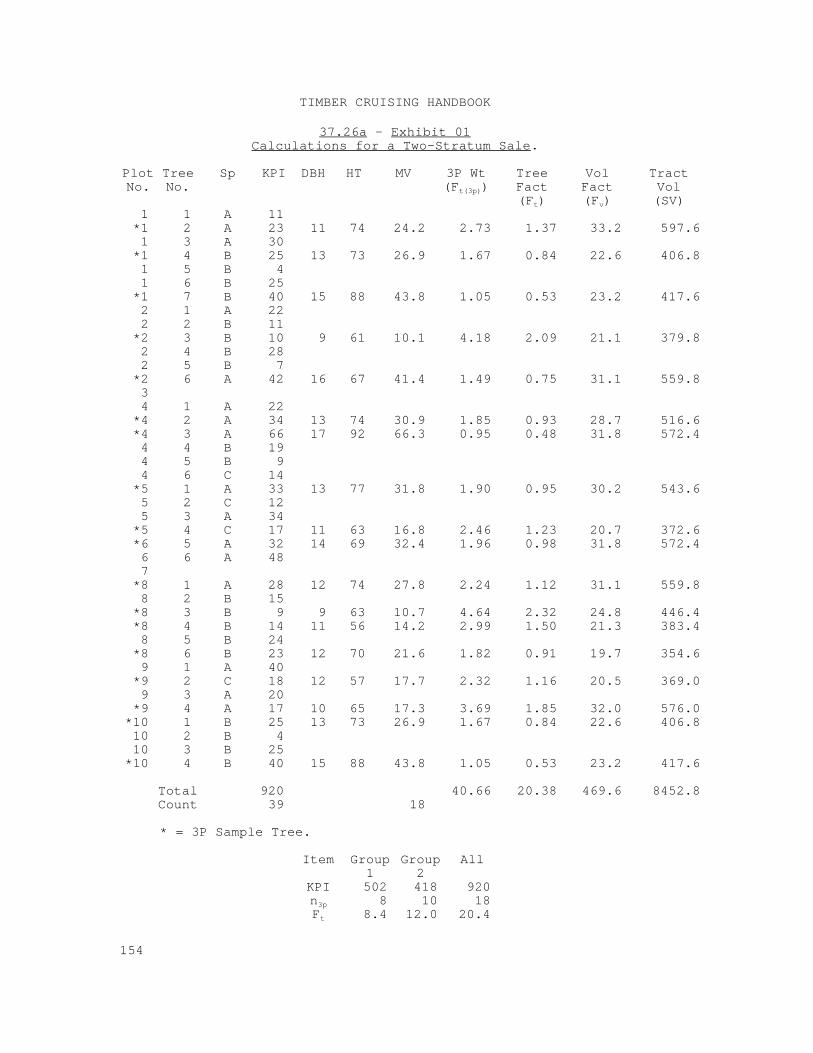
TIMBER CRUISING HANDBOOK
154
37.26a - Exhibit 01Calculations for a Two-Stratum Sale.
Plot Tree Sp KPI DBH HT MV 3P Wt Tree Vol TractNo. No. (F ) Fact Fact Volt(3p)
(F ) (F ) (SV)t v
1 1 A 11 *1 2 A 23 11 74 24.2 2.73 1.37 33.2 597.6 1 3 A 30
*1 4 B 25 13 73 26.9 1.67 0.84 22.6 406.8 1 5 B 4 1 6 B 25
*1 7 B 40 15 88 43.8 1.05 0.53 23.2 417.6 2 1 A 22 2 2 B 11
*2 3 B 10 9 61 10.1 4.18 2.09 21.1 379.8 2 4 B 28 2 5 B 7
*2 6 A 42 16 67 41.4 1.49 0.75 31.1 559.8 3 4 1 A 22
*4 2 A 34 13 74 30.9 1.85 0.93 28.7 516.6 *4 3 A 66 17 92 66.3 0.95 0.48 31.8 572.4 4 4 B 19 4 5 B 9 4 6 C 14
*5 1 A 33 13 77 31.8 1.90 0.95 30.2 543.6 5 2 C 12 5 3 A 34
*5 4 C 17 11 63 16.8 2.46 1.23 20.7 372.6 *6 5 A 32 14 69 32.4 1.96 0.98 31.8 572.4 6 6 A 48 7
*8 1 A 28 12 74 27.8 2.24 1.12 31.1 559.8 8 2 B 15
*8 3 B 9 9 63 10.7 4.64 2.32 24.8 446.4 *8 4 B 14 11 56 14.2 2.99 1.50 21.3 383.4 8 5 B 24
*8 6 B 23 12 70 21.6 1.82 0.91 19.7 354.6 9 1 A 40
*9 2 C 18 12 57 17.7 2.32 1.16 20.5 369.0 9 3 A 20
*9 4 A 17 10 65 17.3 3.69 1.85 32.0 576.0 *10 1 B 25 13 73 26.9 1.67 0.84 22.6 406.8 10 2 B 4 10 3 B 25
*10 4 B 40 15 88 43.8 1.05 0.53 23.2 417.6
Total 920 40.66 20.38 469.6 8452.8 Count 39 18
* = 3P Sample Tree.
Item Group Group All1 2
KPI 502 418 920 n 8 10 18 3p
F 8.4 12.0 20.4 t
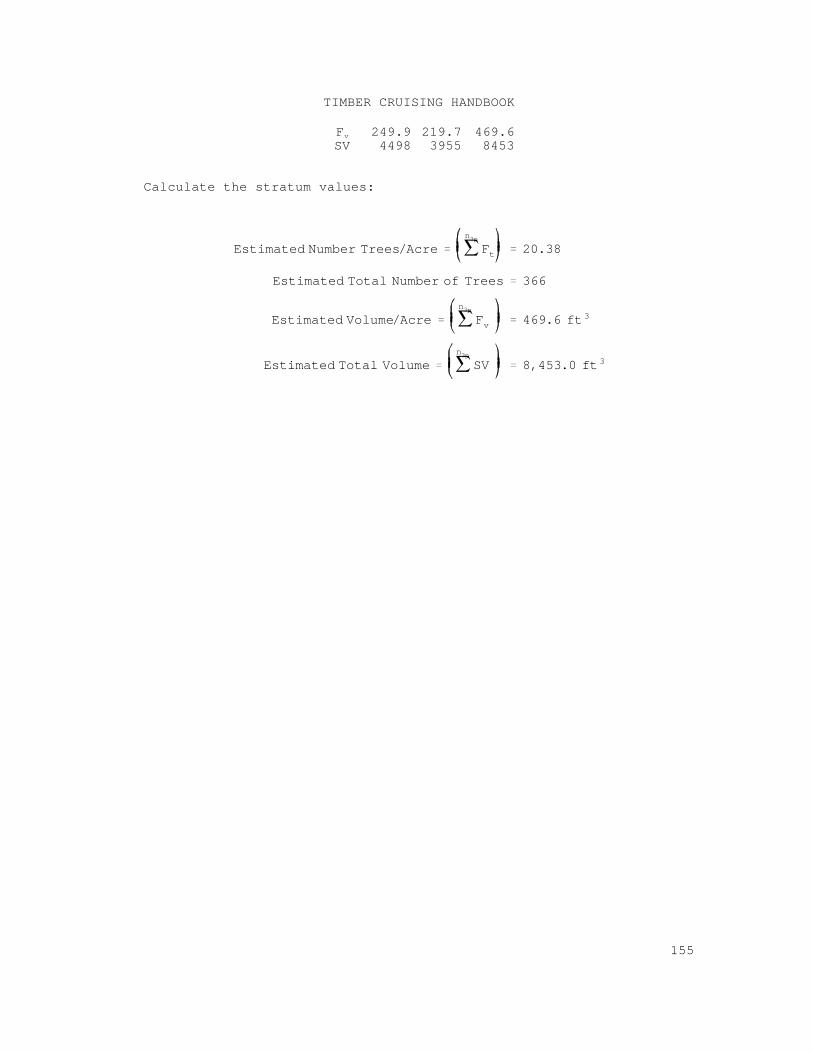
Estimated Number Trees/Acren3p
Ft 20.38
Estimated Total Number of Trees 366
Estimated Volume/Acren3p
Fv 469.6 ft 3
Estimated Total Volumen3p
SV 8,453.0 ft 3
TIMBER CRUISING HANDBOOK
155
F 249.9 219.7 469.6 v
SV 4498 3955 8453
Calculate the stratum values:
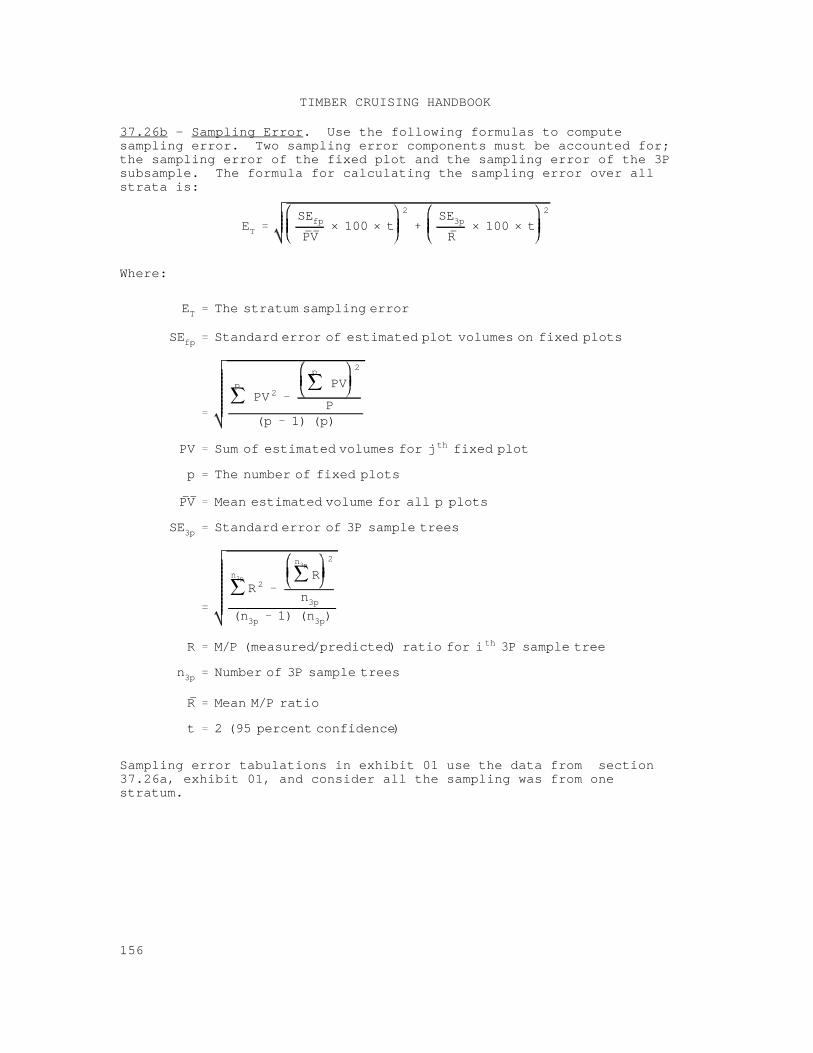
ETSEfpPV
× 100 × t2 SE3p
R× 100 × t
2
ET The stratum sampling error
SEfp Standard error of estimated plot volumes on fixed plots
p
PV 2
p
PV2
P(p 1) (p)
PV Sum of estimated volumes for j th fixed plot
p The number of fixed plots
PV Mean estimated volume for all p plots
SE3p Standard error of 3P sample trees
n3p
R 2
n3p
R2
n3p(n3p 1) (n3p)
R M/P (measured/predicted) ratio for i th 3P sample tree
n3p Number of 3P sample trees
R Mean M/P ratio
t 2 (95 percent confidence)
TIMBER CRUISING HANDBOOK
156
37.26b - Sampling Error. Use the following formulas to computesampling error. Two sampling error components must be accounted for;the sampling error of the fixed plot and the sampling error of the 3Psubsample. The formula for calculating the sampling error over allstrata is:
Where:
Sampling error tabulations in exhibit 01 use the data from section37.26a, exhibit 01, and consider all the sampling was from onestratum.
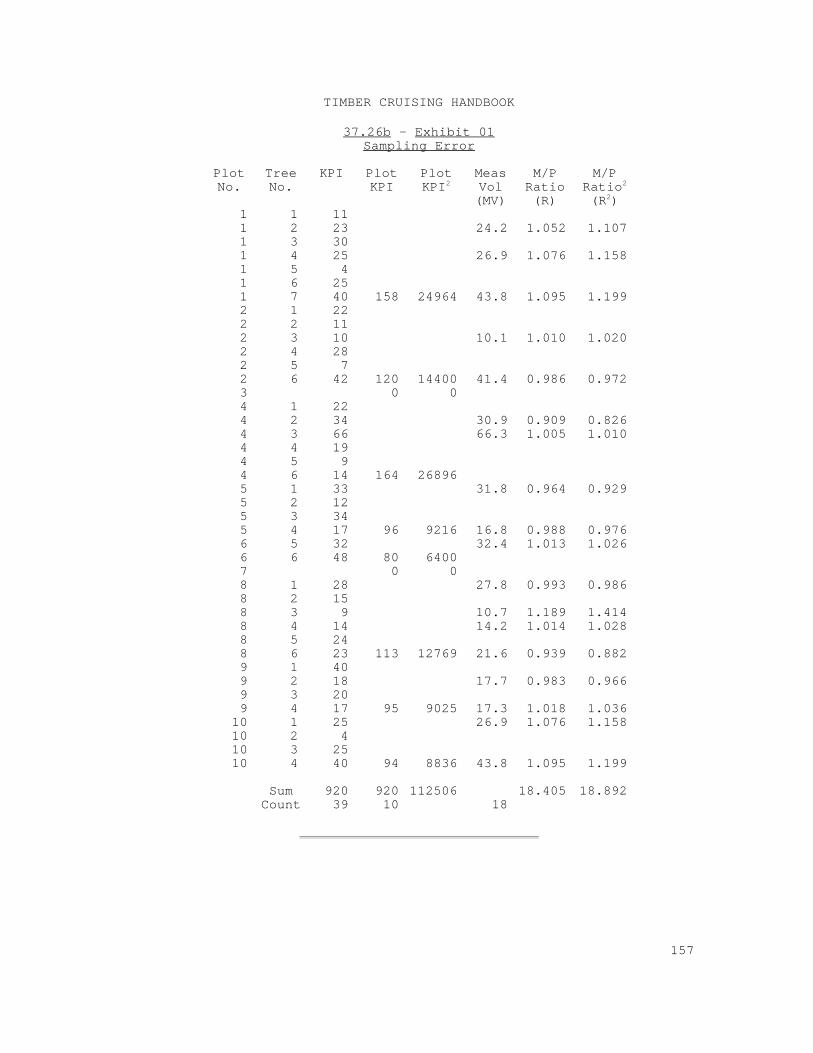
TIMBER CRUISING HANDBOOK
157
37.26b - Exhibit 01Sampling Error
Plot Tree KPI Plot Plot Meas M/P M/PNo. No. KPI KPI Vol Ratio Ratio2
(MV) (R) (R )
2
2
1 1 11 1 2 23 24.2 1.052 1.107 1 3 30 1 4 25 26.9 1.076 1.158 1 5 4 1 6 25 1 7 40 158 24964 43.8 1.095 1.199 2 1 22 2 2 11 2 3 10 10.1 1.010 1.020 2 4 28 2 5 7 2 6 42 120 14400 41.4 0.986 0.972 3 0 0 4 1 22 4 2 34 30.9 0.909 0.826 4 3 66 66.3 1.005 1.010 4 4 19 4 5 9 4 6 14 164 26896 5 1 33 31.8 0.964 0.929 5 2 12 5 3 34 5 4 17 96 9216 16.8 0.988 0.976 6 5 32 32.4 1.013 1.026 6 6 48 80 6400 7 0 0 8 1 28 27.8 0.993 0.986 8 2 15 8 3 9 10.7 1.189 1.414 8 4 14 14.2 1.014 1.028 8 5 24 8 6 23 113 12769 21.6 0.939 0.882 9 1 40 9 2 18 17.7 0.983 0.966 9 3 20 9 4 17 95 9025 17.3 1.018 1.036
10 1 25 26.9 1.076 1.158 10 2 4 10 3 25 10 4 40 94 8836 43.8 1.095 1.199
Sum 920 920 112506 18.405 18.892 Count 39 10 18
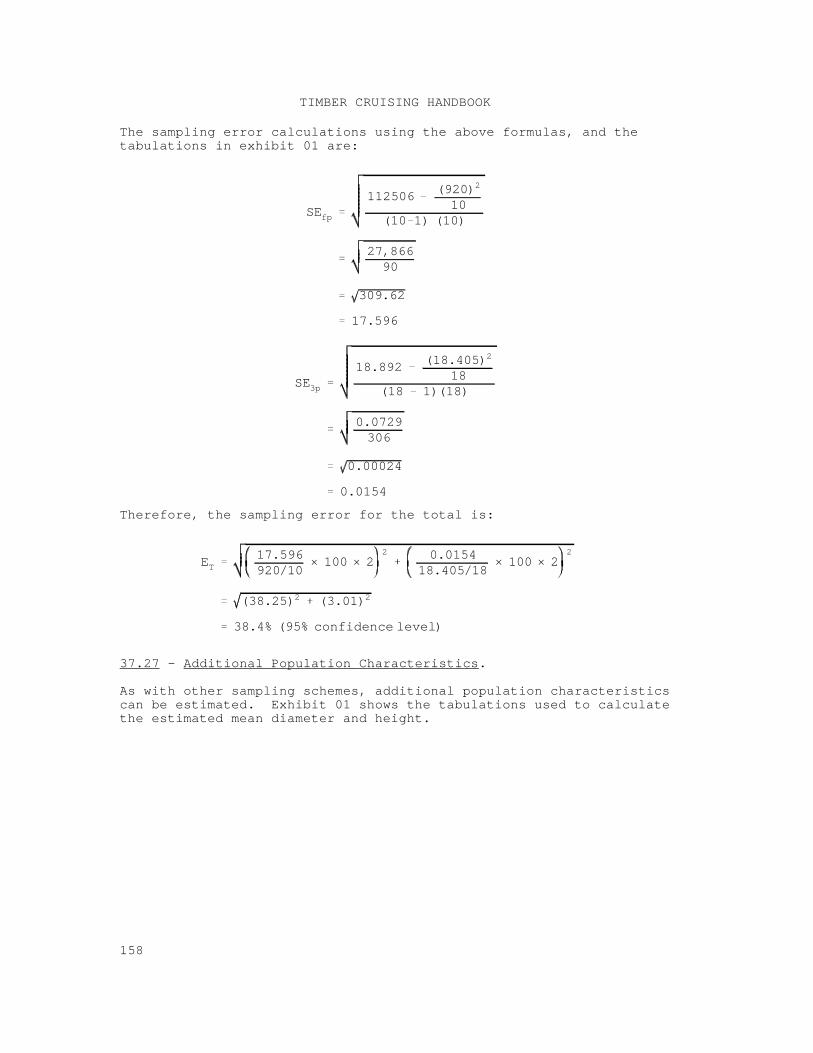
SEfp
112506(920)2
10(10 1) (10)
27,86690
309.62
17.596
SE3p
18.892(18.405)2
18(18 1)(18)
0.0729306
0.00024
0.0154
ET17.596920/10
× 100 × 22 0.0154
18.405/18× 100 × 2
2
(38.25)2 (3.01)2
38.4% (95% confidence level)
TIMBER CRUISING HANDBOOK
158
The sampling error calculations using the above formulas, and thetabulations in exhibit 01 are:
Therefore, the sampling error for the total is:
37.27 - Additional Population Characteristics.
As with other sampling schemes, additional population characteristicscan be estimated. Exhibit 01 shows the tabulations used to calculatethe estimated mean diameter and height.
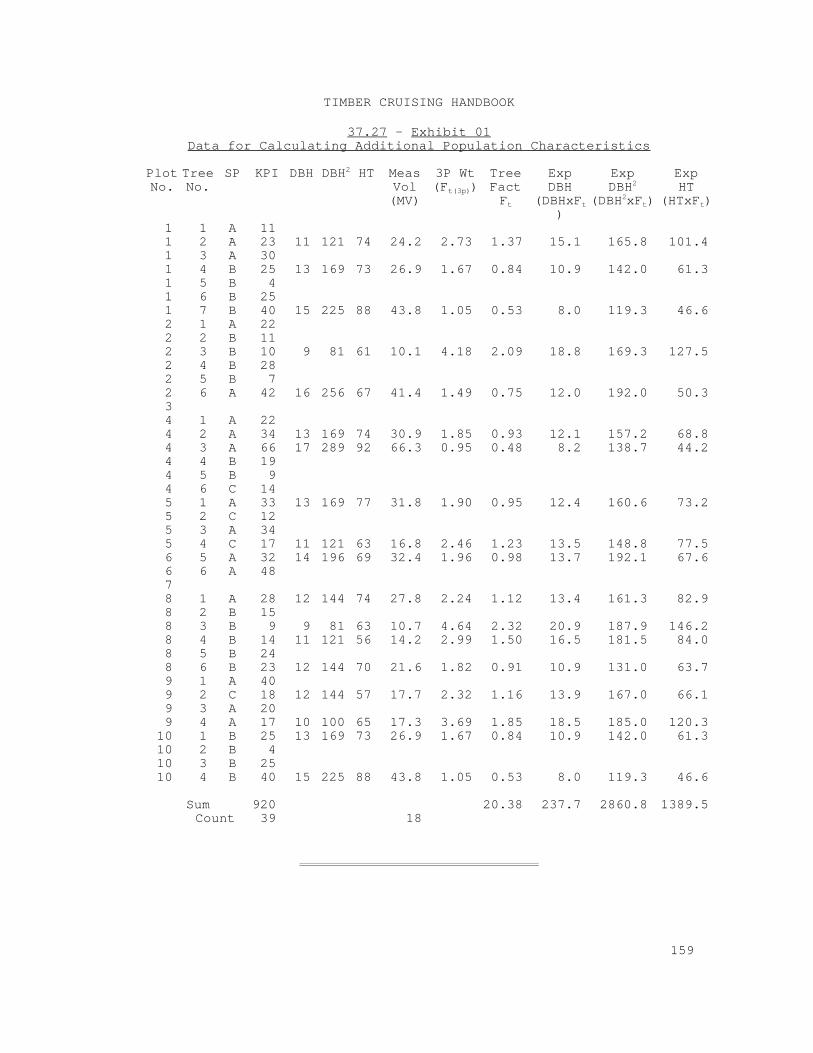
TIMBER CRUISING HANDBOOK
159
37.27 - Exhibit 01Data for Calculating Additional Population Characteristics
Plot Tree SP KPI DBH DBH HT Meas 3P Wt Tree Exp Exp ExpNo. No. Vol (F ) Fact DBH DBH HT
2
(MV) F (DBHxF (DBH xF ) (HTxF )t(3p)
t t
)
2
2t t
1 1 A 11 1 2 A 23 11 121 74 24.2 2.73 1.37 15.1 165.8 101.4 1 3 A 30 1 4 B 25 13 169 73 26.9 1.67 0.84 10.9 142.0 61.3 1 5 B 4 1 6 B 25 1 7 B 40 15 225 88 43.8 1.05 0.53 8.0 119.3 46.6 2 1 A 22 2 2 B 11 2 3 B 10 9 81 61 10.1 4.18 2.09 18.8 169.3 127.5 2 4 B 28 2 5 B 7 2 6 A 42 16 256 67 41.4 1.49 0.75 12.0 192.0 50.3 3 4 1 A 22 4 2 A 34 13 169 74 30.9 1.85 0.93 12.1 157.2 68.8 4 3 A 66 17 289 92 66.3 0.95 0.48 8.2 138.7 44.2 4 4 B 19 4 5 B 9 4 6 C 14 5 1 A 33 13 169 77 31.8 1.90 0.95 12.4 160.6 73.2 5 2 C 12 5 3 A 34 5 4 C 17 11 121 63 16.8 2.46 1.23 13.5 148.8 77.5 6 5 A 32 14 196 69 32.4 1.96 0.98 13.7 192.1 67.6 6 6 A 48 7 8 1 A 28 12 144 74 27.8 2.24 1.12 13.4 161.3 82.9 8 2 B 15 8 3 B 9 9 81 63 10.7 4.64 2.32 20.9 187.9 146.2 8 4 B 14 11 121 56 14.2 2.99 1.50 16.5 181.5 84.0 8 5 B 24 8 6 B 23 12 144 70 21.6 1.82 0.91 10.9 131.0 63.7 9 1 A 40 9 2 C 18 12 144 57 17.7 2.32 1.16 13.9 167.0 66.1 9 3 A 20 9 4 A 17 10 100 65 17.3 3.69 1.85 18.5 185.0 120.3
10 1 B 25 13 169 73 26.9 1.67 0.84 10.9 142.0 61.3 10 2 B 4 10 3 B 25 10 4 B 40 15 225 88 43.8 1.05 0.53 8.0 119.3 46.6
Sum 920 20.38 237.7 2860.8 1389.5 Count 39 18
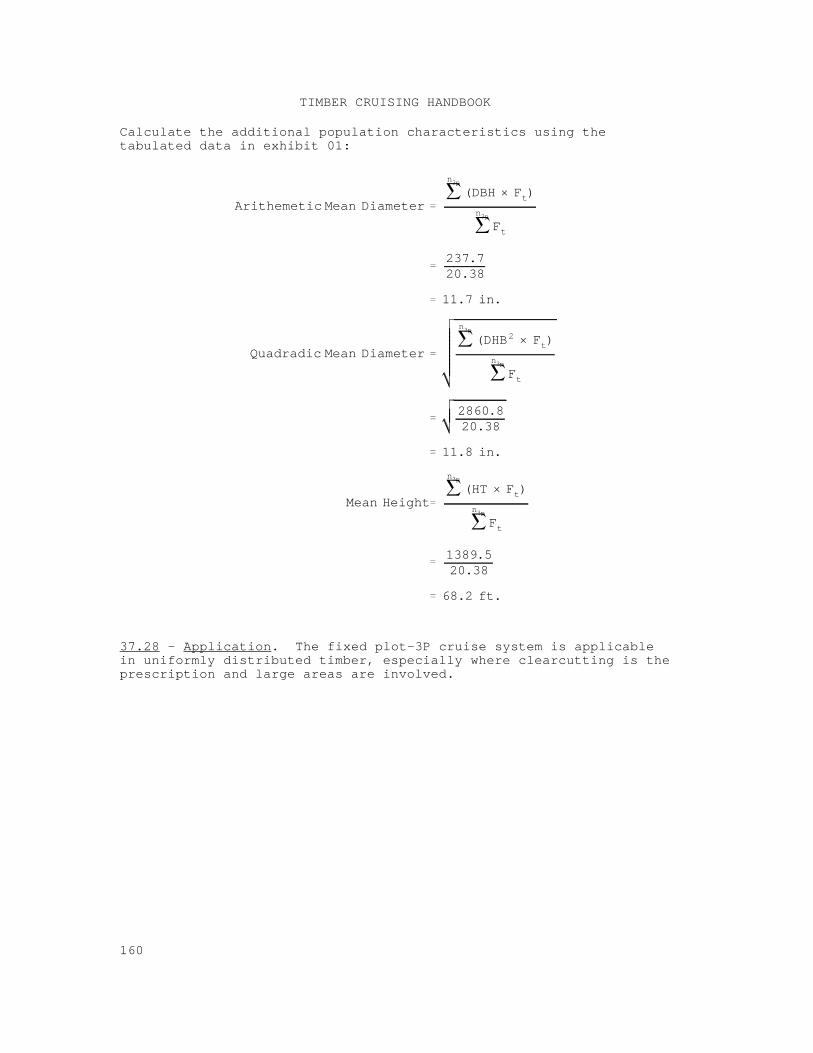
Arithemetic Mean Diameter
n3p
(DBH × Ft)
n3p
Ft
237.720.38
11.7 in.
Quadradic Mean Diameter
n3p
(DHB2 × Ft)
n3p
Ft
2860.820.38
11.8 in.
Mean Height
n3p
(HT × Ft)
n3p
Ft
1389.520.38
68.2 ft.
TIMBER CRUISING HANDBOOK
160
Calculate the additional population characteristics using thetabulated data in exhibit 01:
37.28 - Application. The fixed plot-3P cruise system is applicablein uniformly distributed timber, especially where clearcutting is theprescription and large areas are involved.
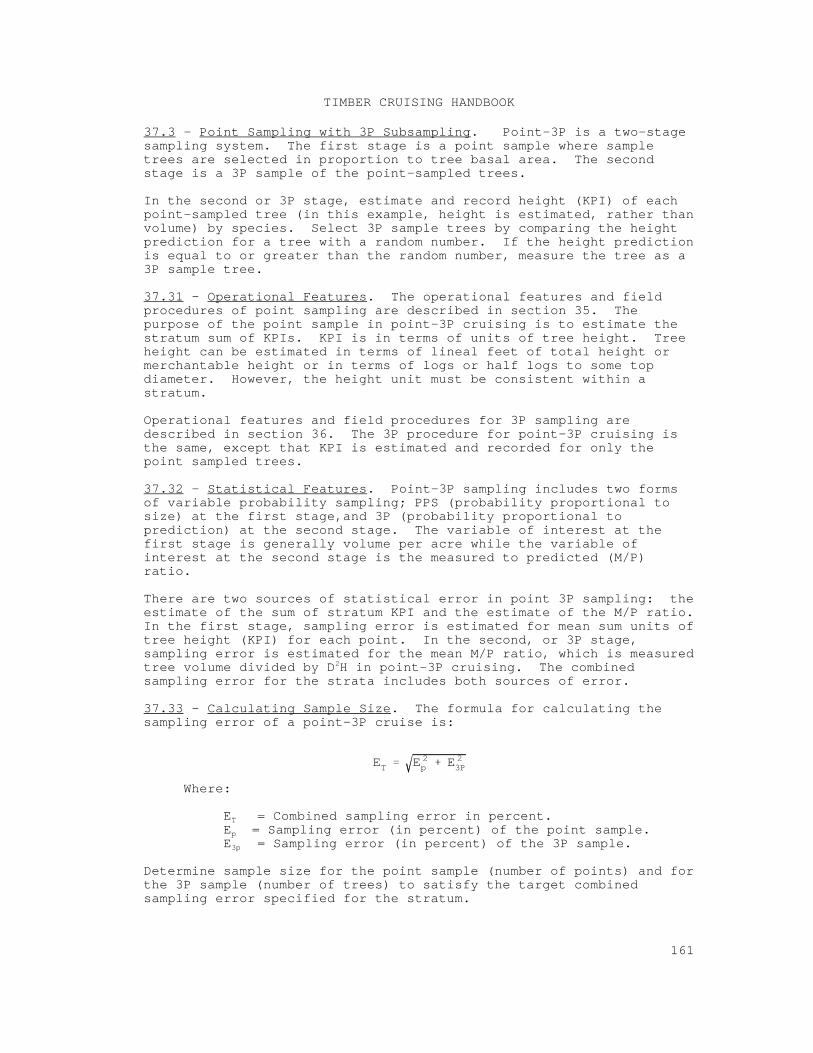
ET E 2p E 2
3P
TIMBER CRUISING HANDBOOK
161
37.3 - Point Sampling with 3P Subsampling. Point-3P is a two-stagesampling system. The first stage is a point sample where sampletrees are selected in proportion to tree basal area. The secondstage is a 3P sample of the point-sampled trees.
In the second or 3P stage, estimate and record height (KPI) of eachpoint-sampled tree (in this example, height is estimated, rather thanvolume) by species. Select 3P sample trees by comparing the heightprediction for a tree with a random number. If the height predictionis equal to or greater than the random number, measure the tree as a3P sample tree.
37.31 - Operational Features. The operational features and fieldprocedures of point sampling are described in section 35. Thepurpose of the point sample in point-3P cruising is to estimate thestratum sum of KPIs. KPI is in terms of units of tree height. Treeheight can be estimated in terms of lineal feet of total height ormerchantable height or in terms of logs or half logs to some topdiameter. However, the height unit must be consistent within astratum.
Operational features and field procedures for 3P sampling aredescribed in section 36. The 3P procedure for point-3P cruising isthe same, except that KPI is estimated and recorded for only thepoint sampled trees.
37.32 - Statistical Features. Point-3P sampling includes two formsof variable probability sampling; PPS (probability proportional tosize) at the first stage,and 3P (probability proportional toprediction) at the second stage. The variable of interest at thefirst stage is generally volume per acre while the variable ofinterest at the second stage is the measured to predicted (M/P)ratio.
There are two sources of statistical error in point 3P sampling: theestimate of the sum of stratum KPI and the estimate of the M/P ratio. In the first stage, sampling error is estimated for mean sum units oftree height (KPI) for each point. In the second, or 3P stage,sampling error is estimated for the mean M/P ratio, which is measuredtree volume divided by D H in point-3P cruising. The combined2
sampling error for the strata includes both sources of error.
37.33 - Calculating Sample Size. The formula for calculating thesampling error of a point-3P cruise is:
Where:
E = Combined sampling error in percent.T
E = Sampling error (in percent) of the point sample.p
E = Sampling error (in percent) of the 3P sample.3p
Determine sample size for the point sample (number of points) and forthe 3P sample (number of trees) to satisfy the target combinedsampling error specified for the stratum.
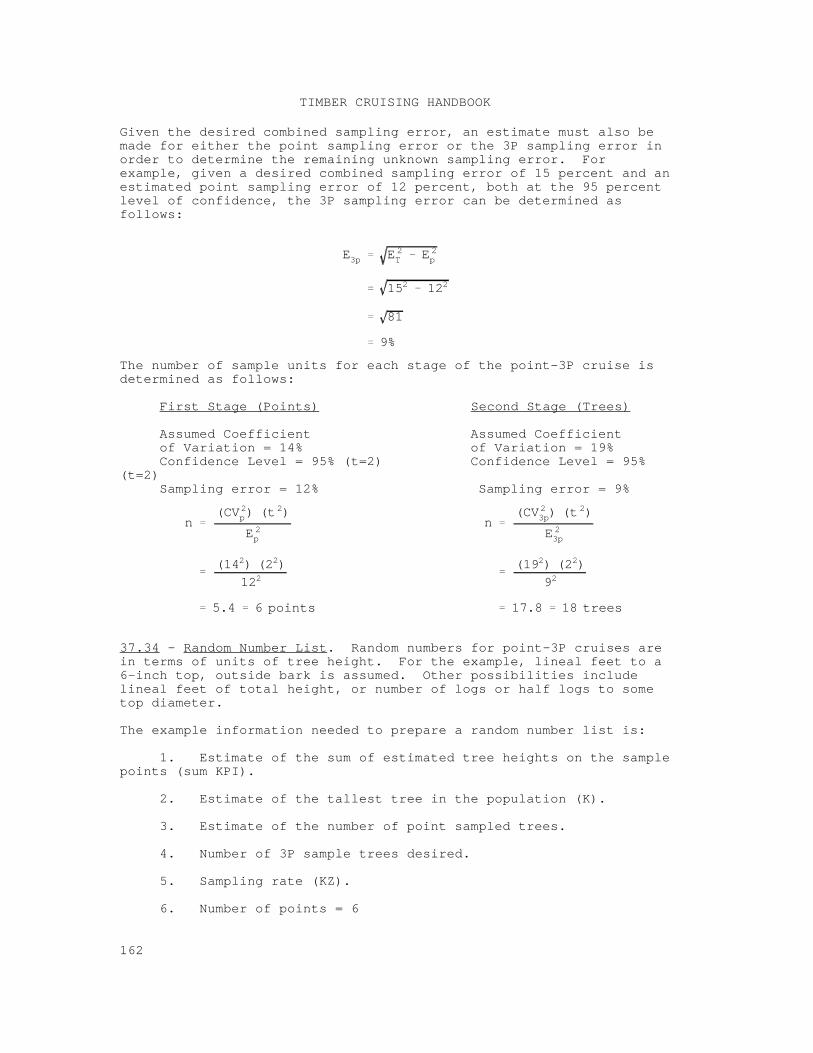
E3p E 2T E 2
p
152 122
81
9%
n(CV2
p) (t 2)
E 2p
(142) (22)
122
5.4 6 points
n(CV2
3p) (t 2)
E 23p
(192) (22)
92
17.8 18 trees
TIMBER CRUISING HANDBOOK
162
Given the desired combined sampling error, an estimate must also bemade for either the point sampling error or the 3P sampling error inorder to determine the remaining unknown sampling error. Forexample, given a desired combined sampling error of 15 percent and anestimated point sampling error of 12 percent, both at the 95 percentlevel of confidence, the 3P sampling error can be determined asfollows:
The number of sample units for each stage of the point-3P cruise isdetermined as follows:
First Stage (Points) Second Stage (Trees)
Assumed Coefficient Assumed Coefficient of Variation = 14% of Variation = 19% Confidence Level = 95% (t=2) Confidence Level = 95%(t=2) Sampling error = 12% Sampling error = 9%
37.34 - Random Number List. Random numbers for point-3P cruises arein terms of units of tree height. For the example, lineal feet to a6-inch top, outside bark is assumed. Other possibilities includelineal feet of total height, or number of logs or half logs to sometop diameter.
The example information needed to prepare a random number list is:
1. Estimate of the sum of estimated tree heights on the samplepoints (sum KPI).
2. Estimate of the tallest tree in the population (K).
3. Estimate of the number of point sampled trees.
4. Number of 3P sample trees desired.
5. Sampling rate (KZ).
6. Number of points = 6
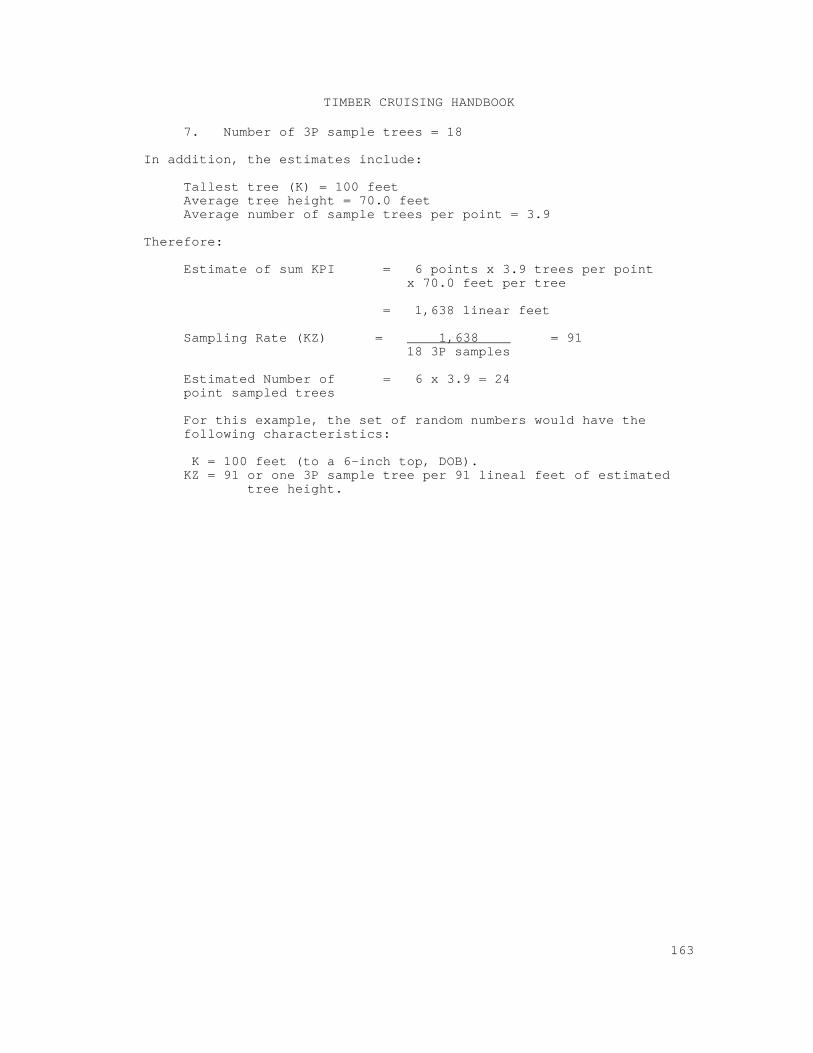
TIMBER CRUISING HANDBOOK
163
7. Number of 3P sample trees = 18
In addition, the estimates include:
Tallest tree (K) = 100 feetAverage tree height = 70.0 feetAverage number of sample trees per point = 3.9
Therefore:
Estimate of sum KPI = 6 points x 3.9 trees per point x 70.0 feet per tree
= 1,638 linear feet
Sampling Rate (KZ) = 1,638 = 91 18 3P samples
Estimated Number of = 6 x 3.9 = 24 point sampled trees
For this example, the set of random numbers would have thefollowing characteristics:
K = 100 feet (to a 6-inch top, DOB).KZ = 91 or one 3P sample tree per 91 lineal feet of estimated
tree height.
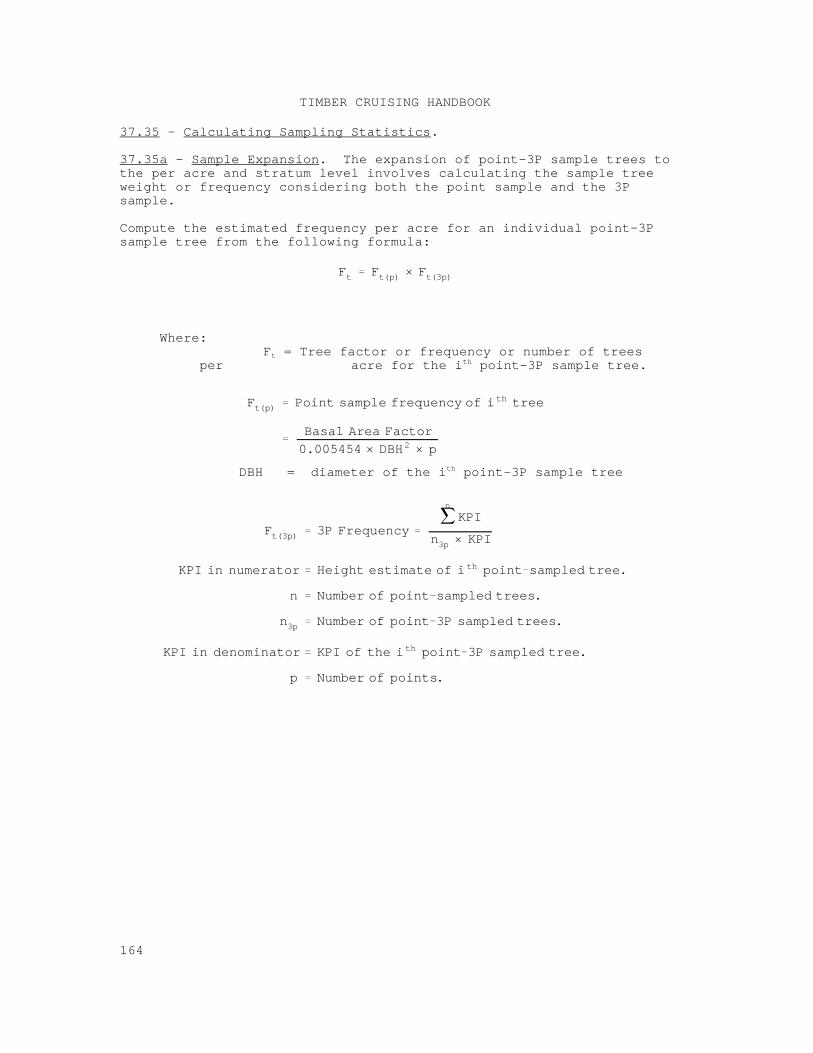
Ft Ft(p) × Ft(3p)
Ft(p) Point sample frequency of i th tree
Basal Area Factor
0.005454 × DBH2 × p
Ft(3p) 3P Frequency
n
KPI
n3p × KPI
KPI in numerator Height estimate of i th point sampled tree.
n Number of point sampled trees.
n3p Number of point 3P sampled trees.
KPI in denominator KPI of the i th point 3P sampled tree.
p Number of points.
TIMBER CRUISING HANDBOOK
164
37.35 - Calculating Sampling Statistics.
37.35a - Sample Expansion. The expansion of point-3P sample trees tothe per acre and stratum level involves calculating the sample treeweight or frequency considering both the point sample and the 3Psample.
Compute the estimated frequency per acre for an individual point-3Psample tree from the following formula:
Where: F = Tree factor or frequency or number of treest
per acre for the i point-3P sample tree.th
DBH = diameter of the i point-3P sample treeth
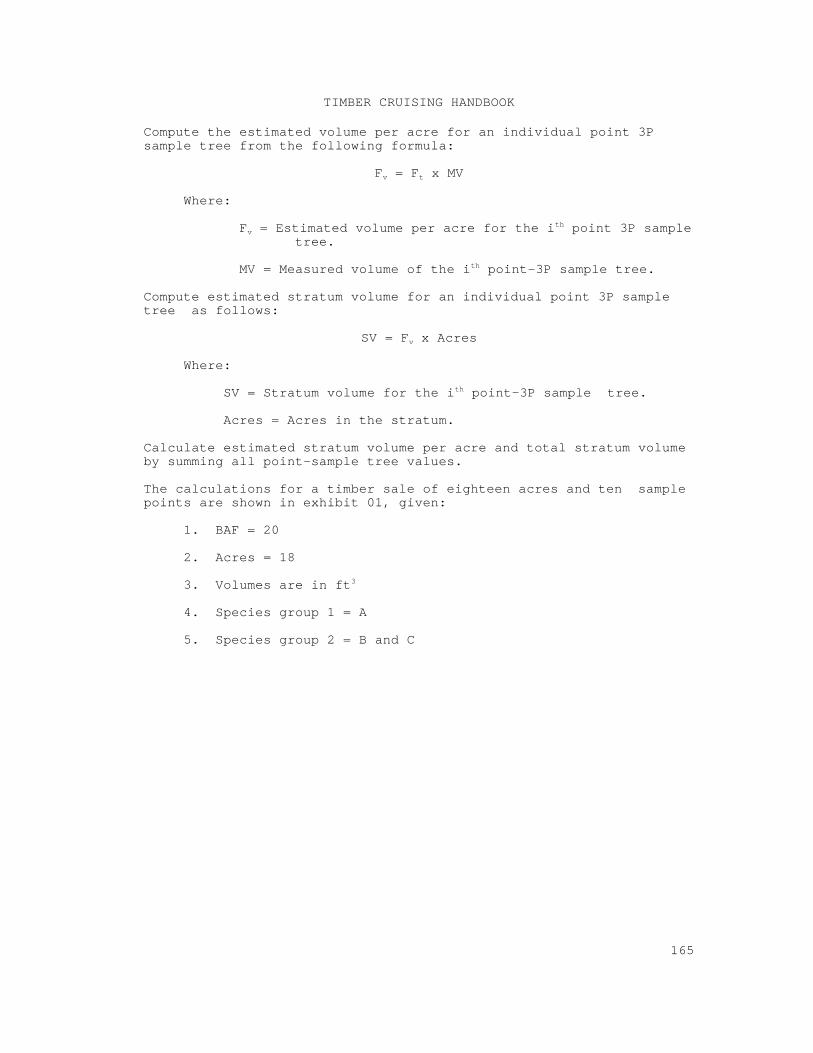
TIMBER CRUISING HANDBOOK
165
Compute the estimated volume per acre for an individual point 3Psample tree from the following formula:
F = F x MVv t
Where:
F = Estimated volume per acre for the i point 3P sample vth
tree.
MV = Measured volume of the i point-3P sample tree.th
Compute estimated stratum volume for an individual point 3P sampletree as follows:
SV = F x Acresv
Where:
SV = Stratum volume for the i point-3P sample tree.th
Acres = Acres in the stratum.
Calculate estimated stratum volume per acre and total stratum volumeby summing all point-sample tree values.
The calculations for a timber sale of eighteen acres and ten samplepoints are shown in exhibit 01, given:
1. BAF = 20
2. Acres = 18
3. Volumes are in ft3
4. Species group 1 = A
5. Species group 2 = B and C
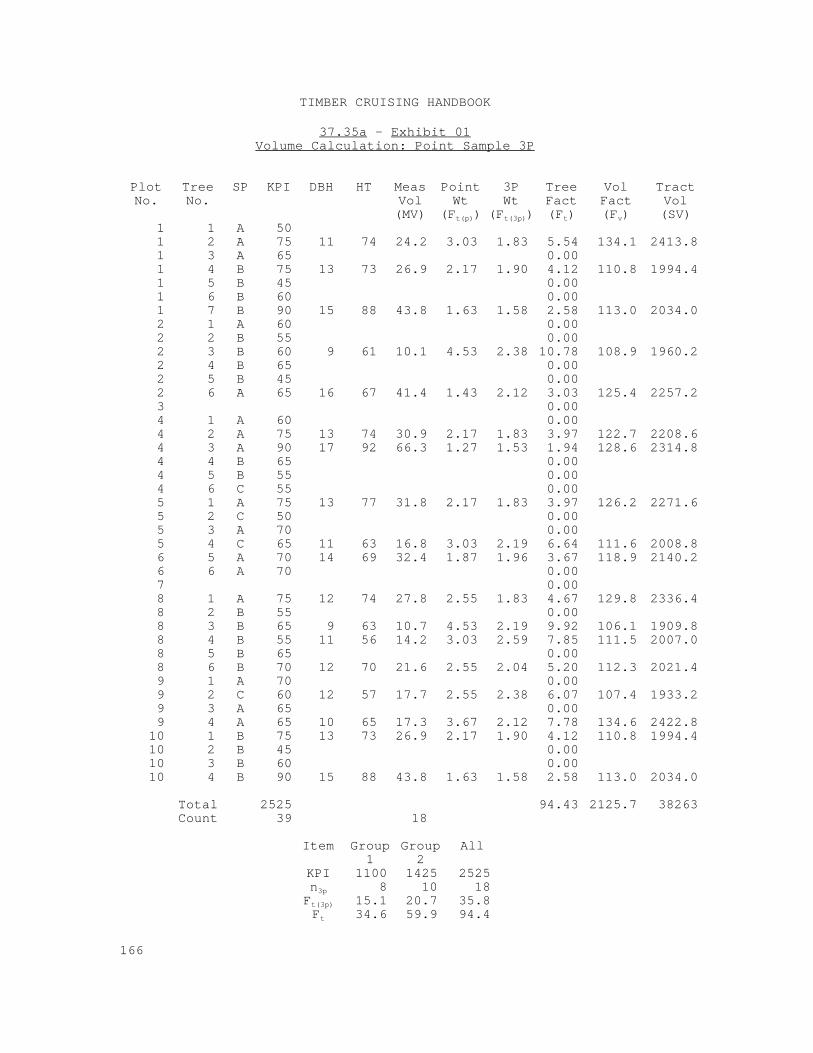
TIMBER CRUISING HANDBOOK
166
37.35a - Exhibit 01Volume Calculation: Point Sample 3P
Plot Tree SP KPI DBH HT Meas Point 3P Tree Vol TractNo. No. Vol Wt Wt Fact Fact Vol
(MV) (F ) (F ) (F ) (F ) (SV)t(p) t(3p) t v
1 1 A 50 1 2 A 75 11 74 24.2 3.03 1.83 5.54 134.1 2413.8 1 3 A 65 0.00 1 4 B 75 13 73 26.9 2.17 1.90 4.12 110.8 1994.4 1 5 B 45 0.00 1 6 B 60 0.00 1 7 B 90 15 88 43.8 1.63 1.58 2.58 113.0 2034.0 2 1 A 60 0.00 2 2 B 55 0.00 2 3 B 60 9 61 10.1 4.53 2.38 10.78 108.9 1960.2 2 4 B 65 0.00 2 5 B 45 0.00 2 6 A 65 16 67 41.4 1.43 2.12 3.03 125.4 2257.2 3 0.00 4 1 A 60 0.00 4 2 A 75 13 74 30.9 2.17 1.83 3.97 122.7 2208.6 4 3 A 90 17 92 66.3 1.27 1.53 1.94 128.6 2314.8 4 4 B 65 0.00 4 5 B 55 0.00 4 6 C 55 0.00 5 1 A 75 13 77 31.8 2.17 1.83 3.97 126.2 2271.6 5 2 C 50 0.00 5 3 A 70 0.00 5 4 C 65 11 63 16.8 3.03 2.19 6.64 111.6 2008.8 6 5 A 70 14 69 32.4 1.87 1.96 3.67 118.9 2140.2 6 6 A 70 0.00 7 0.00 8 1 A 75 12 74 27.8 2.55 1.83 4.67 129.8 2336.4 8 2 B 55 0.00 8 3 B 65 9 63 10.7 4.53 2.19 9.92 106.1 1909.8 8 4 B 55 11 56 14.2 3.03 2.59 7.85 111.5 2007.0 8 5 B 65 0.00 8 6 B 70 12 70 21.6 2.55 2.04 5.20 112.3 2021.4 9 1 A 70 0.00 9 2 C 60 12 57 17.7 2.55 2.38 6.07 107.4 1933.2 9 3 A 65 0.00 9 4 A 65 10 65 17.3 3.67 2.12 7.78 134.6 2422.8
10 1 B 75 13 73 26.9 2.17 1.90 4.12 110.8 1994.4 10 2 B 45 0.00 10 3 B 60 0.00 10 4 B 90 15 88 43.8 1.63 1.58 2.58 113.0 2034.0
Total 2525 94.43 2125.7 38263 Count 39 18
Item Group Group All1 2
KPI 1100 1425 2525 n 8 10 18 3p
F 15.1 20.7 35.8 t(3p)
F 34.6 59.9 94.4 t
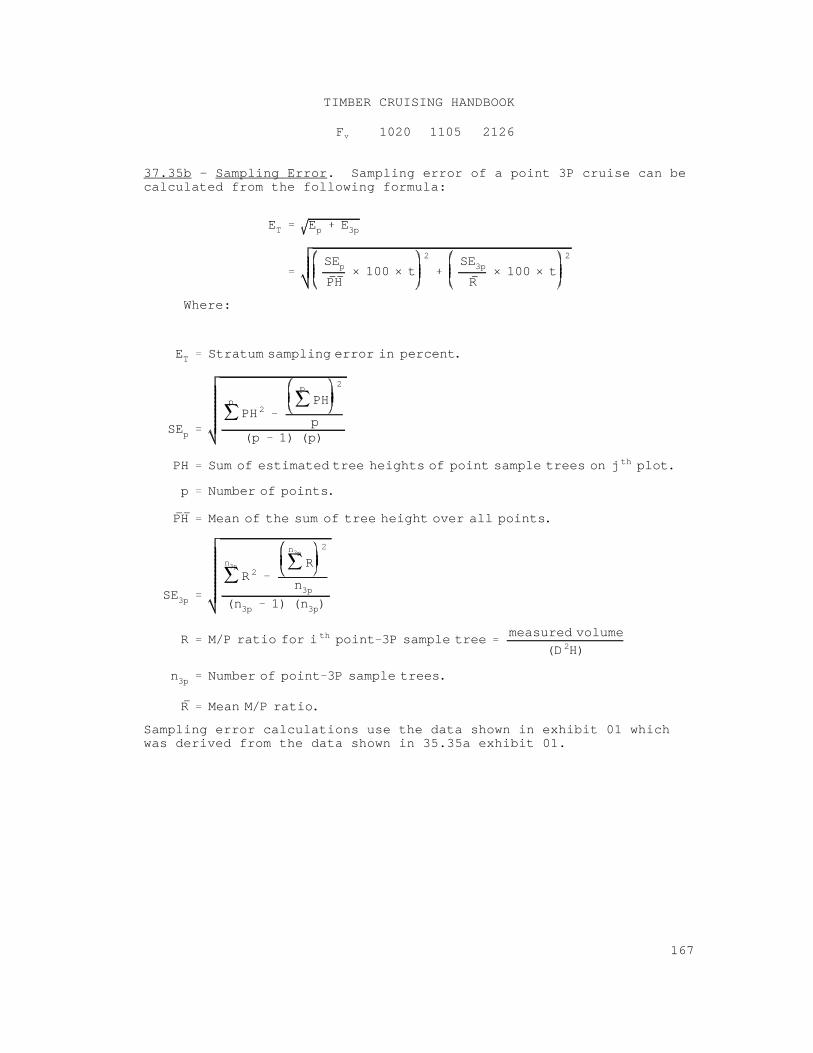
ET Ep E3p
SEpPH
× 100 × t2 SE3p
R× 100 × t
2
ET Stratum sampling error in percent.
SEp
p
PH 2
p
PH2
p(p 1) (p)
PH Sum of estimated tree heights of point sample trees on j th plot.
p Number of points.
PH Mean of the sum of tree height over all points.
SE3p
n3p
R 2
n3p
R2
n3p(n3p 1) (n3p)
R M/P ratio for i th point 3P sample treemeasured volume
(D 2H)
n3p Number of point 3P sample trees.
R Mean M/P ratio.
TIMBER CRUISING HANDBOOK
167
F 1020 1105 2126 v
37.35b - Sampling Error. Sampling error of a point 3P cruise can becalculated from the following formula:
Where:
Sampling error calculations use the data shown in exhibit 01 whichwas derived from the data shown in 35.35a exhibit 01.
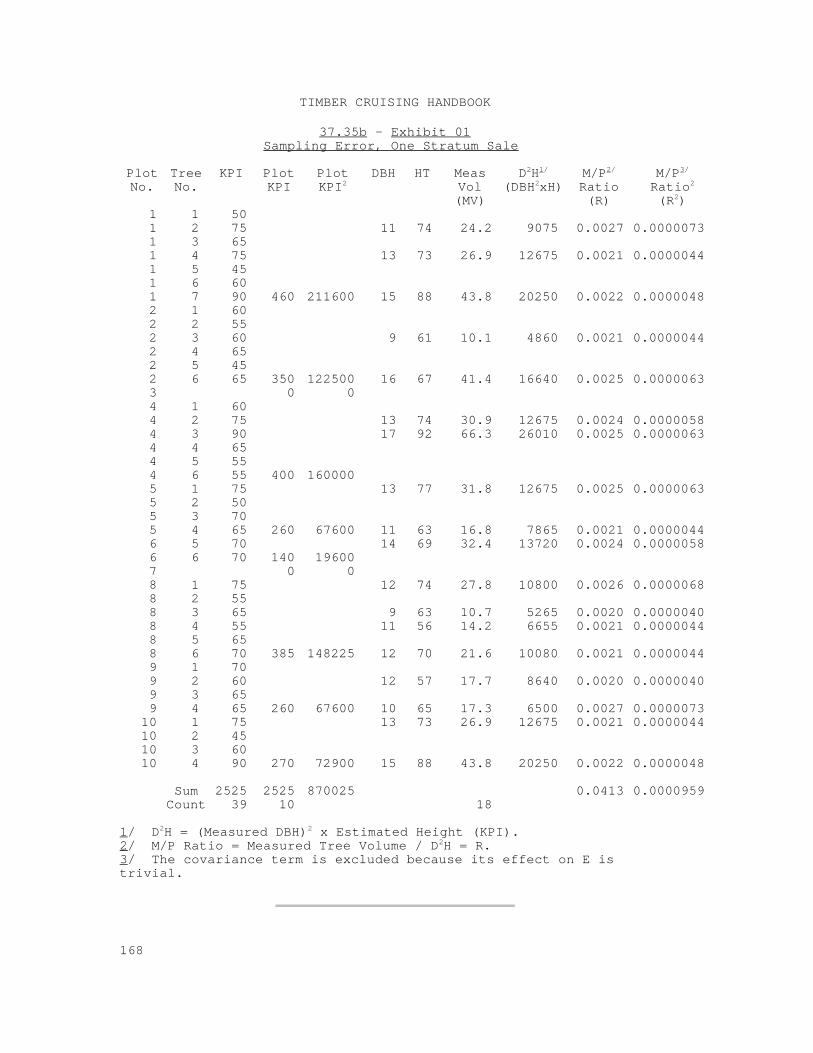
TIMBER CRUISING HANDBOOK
168
37.35b - Exhibit 01Sampling Error, One Stratum Sale
Plot Tree KPI Plot Plot DBH HT Meas D H M/P M/PNo. No. KPI KPI Vol (DBH xH) Ratio Ratio2
(MV) (R) (R )
2 1/
2
2/ 3/
2
2
1 1 50 1 2 75 11 74 24.2 9075 0.0027 0.0000073 1 3 65 1 4 75 13 73 26.9 12675 0.0021 0.0000044 1 5 45 1 6 60 1 7 90 460 211600 15 88 43.8 20250 0.0022 0.0000048 2 1 60 2 2 55 2 3 60 9 61 10.1 4860 0.0021 0.0000044 2 4 65 2 5 45 2 6 65 350 122500 16 67 41.4 16640 0.0025 0.0000063 3 0 0 4 1 60 4 2 75 13 74 30.9 12675 0.0024 0.0000058 4 3 90 17 92 66.3 26010 0.0025 0.0000063 4 4 65 4 5 55 4 6 55 400 160000 5 1 75 13 77 31.8 12675 0.0025 0.0000063 5 2 50 5 3 70 5 4 65 260 67600 11 63 16.8 7865 0.0021 0.0000044 6 5 70 14 69 32.4 13720 0.0024 0.0000058 6 6 70 140 19600 7 0 0 8 1 75 12 74 27.8 10800 0.0026 0.0000068 8 2 55 8 3 65 9 63 10.7 5265 0.0020 0.0000040 8 4 55 11 56 14.2 6655 0.0021 0.0000044 8 5 65 8 6 70 385 148225 12 70 21.6 10080 0.0021 0.0000044 9 1 70 9 2 60 12 57 17.7 8640 0.0020 0.0000040 9 3 65 9 4 65 260 67600 10 65 17.3 6500 0.0027 0.0000073
10 1 75 13 73 26.9 12675 0.0021 0.0000044 10 2 45 10 3 60 10 4 90 270 72900 15 88 43.8 20250 0.0022 0.0000048
Sum 2525 2525 870025 0.0413 0.0000959 Count 39 10 18
1/ D H = (Measured DBH) x Estimated Height (KPI).2 2
2/ M/P Ratio = Measured Tree Volume / D H = R.2
3/ The covariance term is excluded because its effect on E istrivial.
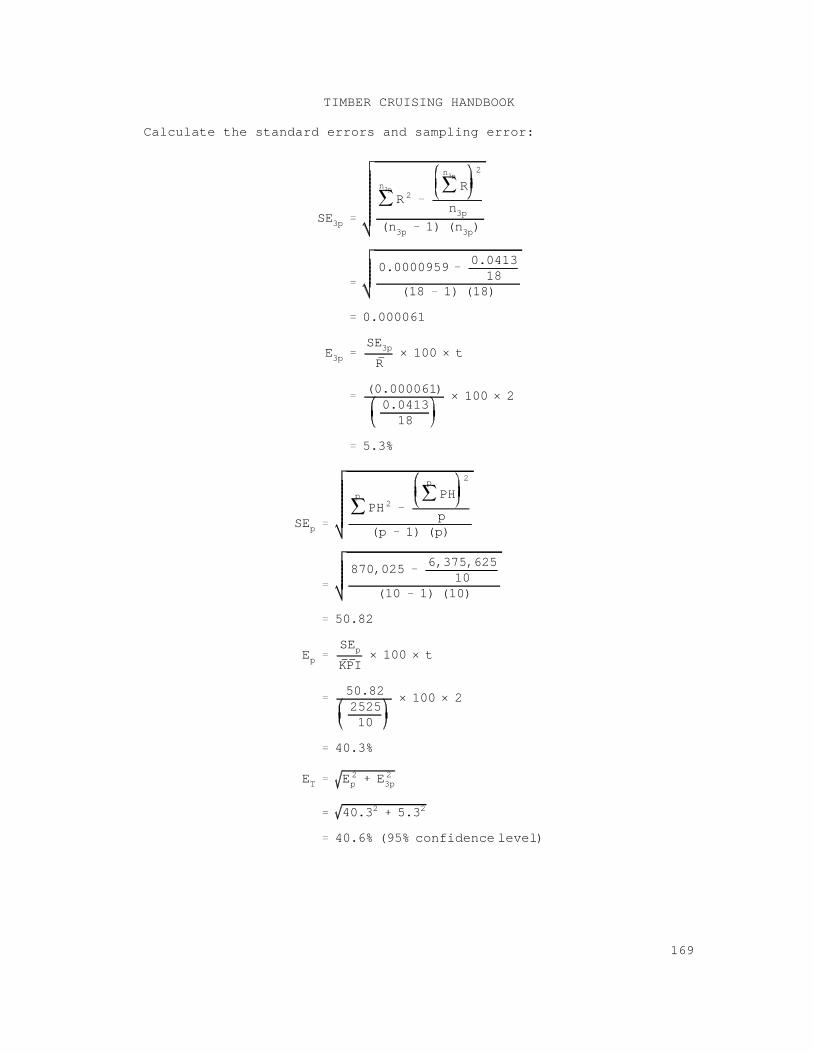
SE3p
n3p
R 2
n3p
R2
n3p(n3p 1) (n3p)
0.00009590.041318
(18 1) (18)
0.000061
E3pSE3pR
× 100 × t
(0.000061)0.041318
× 100 × 2
5.3%
SEp
p
PH 2
p
PH2
p(p 1) (p)
870,0256,375,625
10(10 1) (10)
50.82
EpSEpKPI
× 100 × t
50.82252510
× 100 × 2
40.3%
ET E 2p E 2
3p
40.32 5.32
40.6% (95% confidence level)
TIMBER CRUISING HANDBOOK
169
Calculate the standard errors and sampling error:
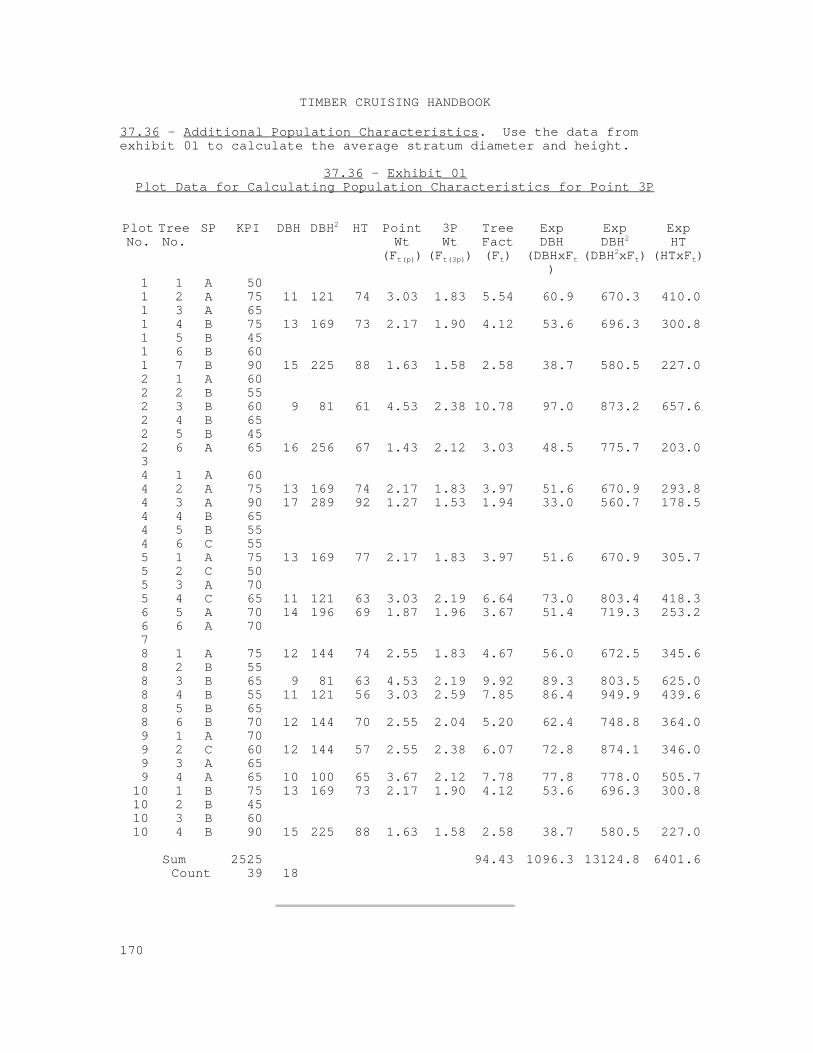
TIMBER CRUISING HANDBOOK
170
37.36 - Additional Population Characteristics. Use the data fromexhibit 01 to calculate the average stratum diameter and height.
37.36 - Exhibit 01Plot Data for Calculating Population Characteristics for Point 3P
Plot Tree SP KPI DBH DBH HT Point 3P Tree Exp Exp ExpNo. No. Wt Wt Fact DBH DBH HT
2
(F ) (F ) (F ) (DBHxF (DBH xF ) (HTxF )t(p) t(3p) t t
)
2
2t t
1 1 A 50 1 2 A 75 11 121 74 3.03 1.83 5.54 60.9 670.3 410.0 1 3 A 65 1 4 B 75 13 169 73 2.17 1.90 4.12 53.6 696.3 300.8 1 5 B 45 1 6 B 60 1 7 B 90 15 225 88 1.63 1.58 2.58 38.7 580.5 227.0 2 1 A 60 2 2 B 55 2 3 B 60 9 81 61 4.53 2.38 10.78 97.0 873.2 657.6 2 4 B 65 2 5 B 45 2 6 A 65 16 256 67 1.43 2.12 3.03 48.5 775.7 203.0 3 4 1 A 60 4 2 A 75 13 169 74 2.17 1.83 3.97 51.6 670.9 293.8 4 3 A 90 17 289 92 1.27 1.53 1.94 33.0 560.7 178.5 4 4 B 65 4 5 B 55 4 6 C 55 5 1 A 75 13 169 77 2.17 1.83 3.97 51.6 670.9 305.7 5 2 C 50 5 3 A 70 5 4 C 65 11 121 63 3.03 2.19 6.64 73.0 803.4 418.3 6 5 A 70 14 196 69 1.87 1.96 3.67 51.4 719.3 253.2 6 6 A 70 7 8 1 A 75 12 144 74 2.55 1.83 4.67 56.0 672.5 345.6 8 2 B 55 8 3 B 65 9 81 63 4.53 2.19 9.92 89.3 803.5 625.0 8 4 B 55 11 121 56 3.03 2.59 7.85 86.4 949.9 439.6 8 5 B 65 8 6 B 70 12 144 70 2.55 2.04 5.20 62.4 748.8 364.0 9 1 A 70 9 2 C 60 12 144 57 2.55 2.38 6.07 72.8 874.1 346.0 9 3 A 65 9 4 A 65 10 100 65 3.67 2.12 7.78 77.8 778.0 505.7
10 1 B 75 13 169 73 2.17 1.90 4.12 53.6 696.3 300.8 10 2 B 45 10 3 B 60 10 4 B 90 15 225 88 1.63 1.58 2.58 38.7 580.5 227.0
Sum 2525 94.43 1096.3 13124.8 6401.6 Count 39 18
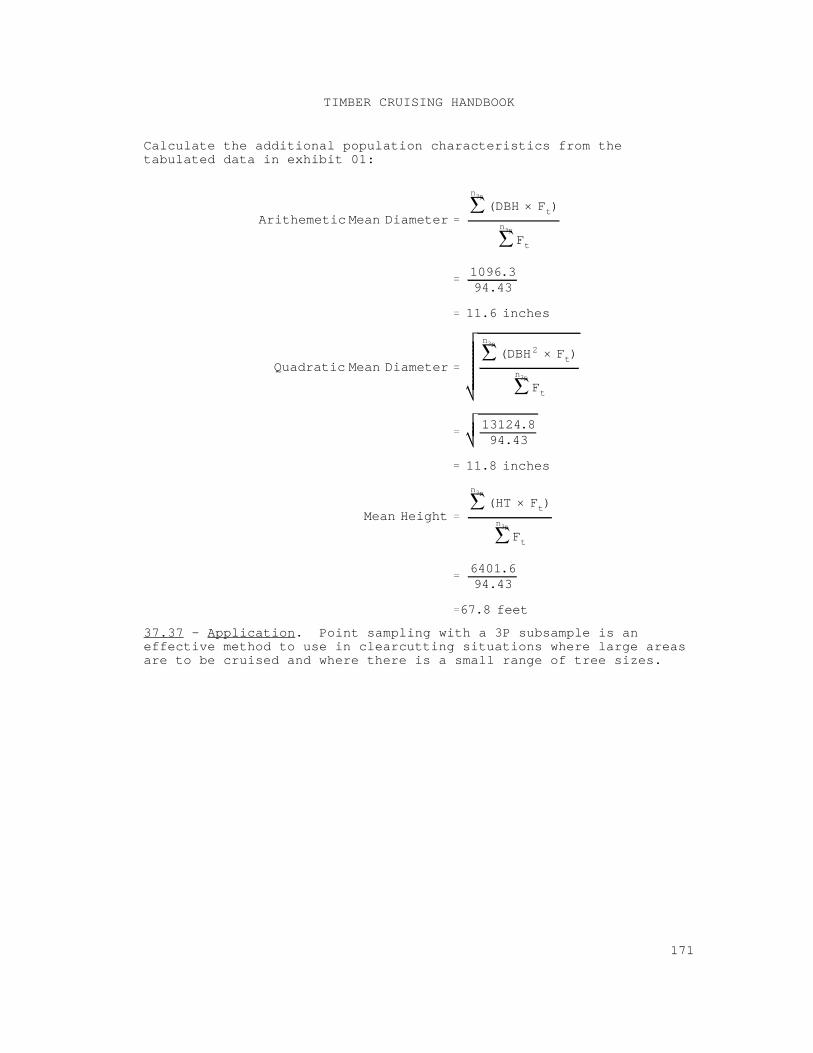
Arithemetic Mean Diameter
n3p
(DBH × Ft)
n3p
Ft
1096.394.43
11.6 inches
Quadratic Mean Diameter
n3p
(DBH2 × Ft)
n3p
Ft
13124.894.43
11.8 inches
Mean Height
n3p
(HT × Ft)
n3p
Ft
6401.694.43
67.8 feet
TIMBER CRUISING HANDBOOK
171
Calculate the additional population characteristics from thetabulated data in exhibit 01:
37.37 - Application. Point sampling with a 3P subsample is aneffective method to use in clearcutting situations where large areasare to be cruised and where there is a small range of tree sizes.
n k(1.732) r
Where: n Total number of count points plus measure points.
k Number of measured pointsCV2
E 2
0.433
r0.25
TIMBER CRUISING HANDBOOK
172
37.4 - Point Count/Measure-Plot Method. In ratio double sampling,count sample trees at all points but measure volume only on someproportion of the points. Use the data from the points on whichsample trees are measured to estimate a ratio of volume to basalarea. Apply this ratio, called V-BAR, to the estimated basal areafor the tract to arrive at an estimate of tract volume. There aretwo sources of statistical error in double sampling: estimatedaverage basal area per acre and estimated average V-BAR.
37.41 - Operational Features. The operational and field proceduresof point sampling are described in section 35. The purpose of thefirst stage point sample is to estimate strata basal area. Thepurpose of the second stage sample is to collect measured treeinformation for the development of volume to basal area ratios.
37.42 - Statistical Features. Ratio double sampling can be done witheither a completely random or a systematic design. Determine theinitial number of plots (or count plots), then select a subsample ofthese plots for measurement plots based on some proportion of theinitial plots.
The advantage of ratio double sampling results from the time saved incounting the trees on some of the plots instead of measuring all thetrees on all the plots. This advantage is reduced if the time savedis not appreciable or if the relationship between the volume perbasal area ratio and the number of count trees is weakly correlated.
37.43 - Calculating Sample Size. Calculate the sample size as inJohnson (1965). An example for determining the sample size in ratiodouble sampling for the west side forests in Washington is:
r = Cost of measuring all trees on a point divided by costof counting all trees on a point.
CV = Coefficient of variation for volume/basal area ratio (V-BAR).
E = Sampling error percent.
See the chapter 90 for tables giving the number of points needed tomeet a specified sampling error, given the coefficient of variationand relative cost of measuring versus counting sample trees on apoint. These tables are presented as examples and should be modifiedfor local conditions.
37.44 - Calculating Sampling Statistics.
37.44a - Sample Expansion. Two methods are commonly used inexpanding point sample data: the factor method, (Beers and Miller,
TIMBER CRUISING HANDBOOK
173
1964) and the V-BAR method, (Beers and Miller, 1964; Dilworth andBell, 1981). Both methods give identical results except for trivialrounding differences. Computations are given in this section foreach method.
1. Factor Method. The factor expansion method involvescalculating the sample tree weight or frequency using the proportionof the measured trees as a weighting factor. Compute the expansionfactor for each tree from the following formula:
F = F x F t t(p) t(c)
Where:
F = Number of trees per acre for the i measured tree.t th
F = Tree expansion factor due to point samplingt(p)
= Basal Area Factor 0.005454 x DBH x p2
F = Frequency of count trees = n/kt(c)
n = Number of measured trees plus number of count trees.
k = Number of measured trees.
p = Number of plots established.
Compute the estimated volume per acre for the i individual measuredth
tree from the following formula:
F = F x MVv t
Where:
F = Estimated volume per acre for the i sample tree.vth
F = Number of trees for i measured tree.t th
MV = Measured volume for the i measured tree.th
TIMBER CRUISING HANDBOOK
174
2. V-BAR Method. The V-BAR method calculates the volume peracre by calculating the average volume to basal area ratio andmultiplying it by average basal area per acre. Using the V-BARmethod, calculate the volume per acre for each tree using thefollowing formula:
F = VBAR x BAPAv
Where:
F = Estimated volume per acre for i measured tree.vth
VBAR = Volume to BA ratio of i treeth
= MV (0.005454 x DBH )2
MV = Volume of the i measured tree.th
____ BAPA = Average BA per acre = (BAF x n/p) / k
BAF = Basal Area Factor n = Number of count trees + number of measured trees.
p = Number of sample points.
k = Number of measured trees
Compute the estimated total volume for the individual measured treesfor both methods as follows:
SV = F x Acres.v
Where:
SV = Total volume for the i measured tree.th
F = Volume factor for i measured tree.v th
Acres = Number of acres in the stand.
In exhibits 01 - 02, sample trees are counted at all points andmeasured for volume at some fraction of the points, separated byspecies type.
Given:
1. number of count points = 5;2. number of measure points = 5;3. BAF = 20;4. tract acres = 18.
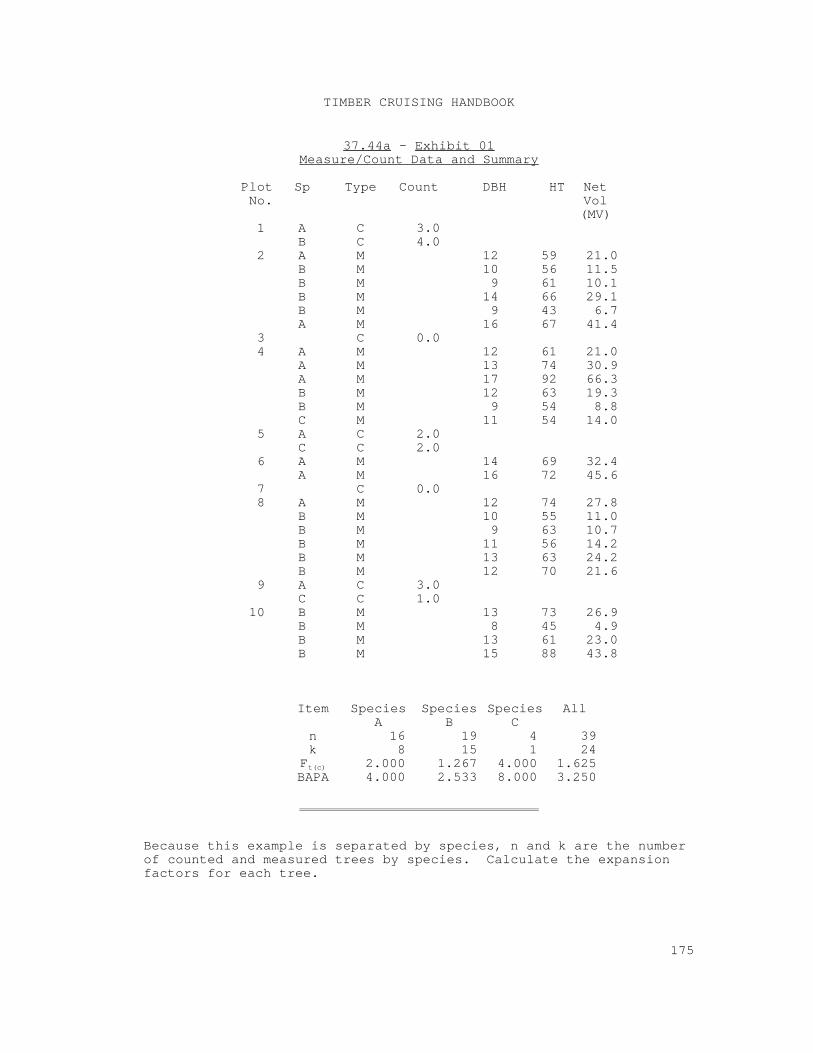
TIMBER CRUISING HANDBOOK
175
37.44a - Exhibit 01Measure/Count Data and Summary
Plot Sp Type Count DBH HT NetNo. Vol
(MV)1 A C 3.0
B C 4.0 2 A M 12 59 21.0
B M 10 56 11.5 B M 9 61 10.1 B M 14 66 29.1 B M 9 43 6.7 A M 16 67 41.4
3 C 0.0 4 A M 12 61 21.0
A M 13 74 30.9 A M 17 92 66.3 B M 12 63 19.3 B M 9 54 8.8 C M 11 54 14.0
5 A C 2.0 C C 2.0
6 A M 14 69 32.4 A M 16 72 45.6
7 C 0.0 8 A M 12 74 27.8
B M 10 55 11.0 B M 9 63 10.7 B M 11 56 14.2 B M 13 63 24.2 B M 12 70 21.6
9 A C 3.0 C C 1.0
10 B M 13 73 26.9 B M 8 45 4.9 B M 13 61 23.0 B M 15 88 43.8
Item Species Species Species AllA B C
n 16 19 4 39 k 8 15 1 24
F 2.000 1.267 4.000 1.625 t(c)
BAPA 4.000 2.533 8.000 3.250
Because this example is separated by species, n and k are the numberof counted and measured trees by species. Calculate the expansionfactors for each tree.
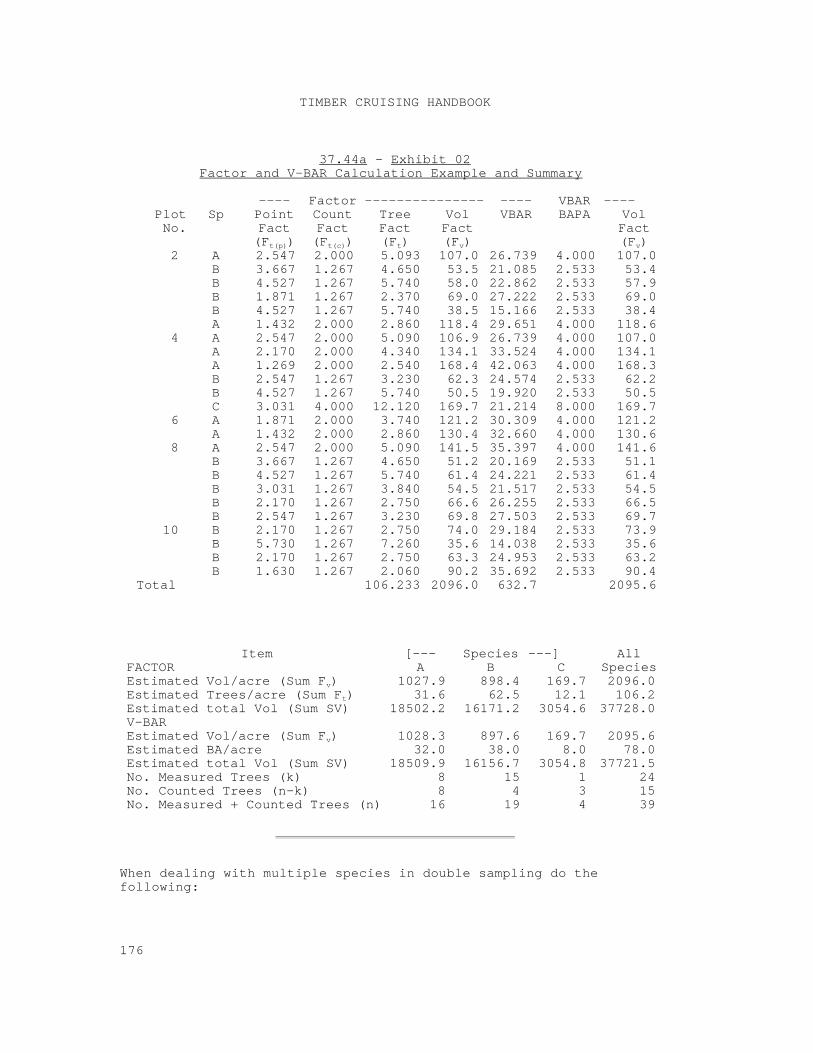
TIMBER CRUISING HANDBOOK
176
37.44a - Exhibit 02Factor and V-BAR Calculation Example and Summary
---- Factor --------------- ---- VBAR ----Plot Sp Point Count Tree Vol VBAR BAPA VolNo. Fact Fact Fact Fact Fact
(F ) (F ) (F ) (F ) (F )t(p) t(c) t v v
2 A 2.547 2.000 5.093 107.0 26.739 4.000 107.0 B 3.667 1.267 4.650 53.5 21.085 2.533 53.4 B 4.527 1.267 5.740 58.0 22.862 2.533 57.9 B 1.871 1.267 2.370 69.0 27.222 2.533 69.0 B 4.527 1.267 5.740 38.5 15.166 2.533 38.4 A 1.432 2.000 2.860 118.4 29.651 4.000 118.6
4 A 2.547 2.000 5.090 106.9 26.739 4.000 107.0 A 2.170 2.000 4.340 134.1 33.524 4.000 134.1 A 1.269 2.000 2.540 168.4 42.063 4.000 168.3 B 2.547 1.267 3.230 62.3 24.574 2.533 62.2 B 4.527 1.267 5.740 50.5 19.920 2.533 50.5 C 3.031 4.000 12.120 169.7 21.214 8.000 169.7
6 A 1.871 2.000 3.740 121.2 30.309 4.000 121.2 A 1.432 2.000 2.860 130.4 32.660 4.000 130.6
8 A 2.547 2.000 5.090 141.5 35.397 4.000 141.6 B 3.667 1.267 4.650 51.2 20.169 2.533 51.1 B 4.527 1.267 5.740 61.4 24.221 2.533 61.4 B 3.031 1.267 3.840 54.5 21.517 2.533 54.5 B 2.170 1.267 2.750 66.6 26.255 2.533 66.5 B 2.547 1.267 3.230 69.8 27.503 2.533 69.7
10 B 2.170 1.267 2.750 74.0 29.184 2.533 73.9 B 5.730 1.267 7.260 35.6 14.038 2.533 35.6 B 2.170 1.267 2.750 63.3 24.953 2.533 63.2 B 1.630 1.267 2.060 90.2 35.692 2.533 90.4
Total 106.233 2096.0 632.7 2095.6
Item [--- Species ---] AllFACTOR A B C SpeciesEstimated Vol/acre (Sum F ) 1027.9 898.4 169.7 2096.0 v
Estimated Trees/acre (Sum F ) 31.6 62.5 12.1 106.2 t
Estimated total Vol (Sum SV) 18502.2 16171.2 3054.6 37728.0 V-BAREstimated Vol/acre (Sum F ) 1028.3 897.6 169.7 2095.6 v
Estimated BA/acre 32.0 38.0 8.0 78.0 Estimated total Vol (Sum SV) 18509.9 16156.7 3054.8 37721.5 No. Measured Trees (k) 8 15 1 24 No. Counted Trees (n-k) 8 4 3 15 No. Measured + Counted Trees (n) 16 19 4 39
When dealing with multiple species in double sampling do thefollowing:
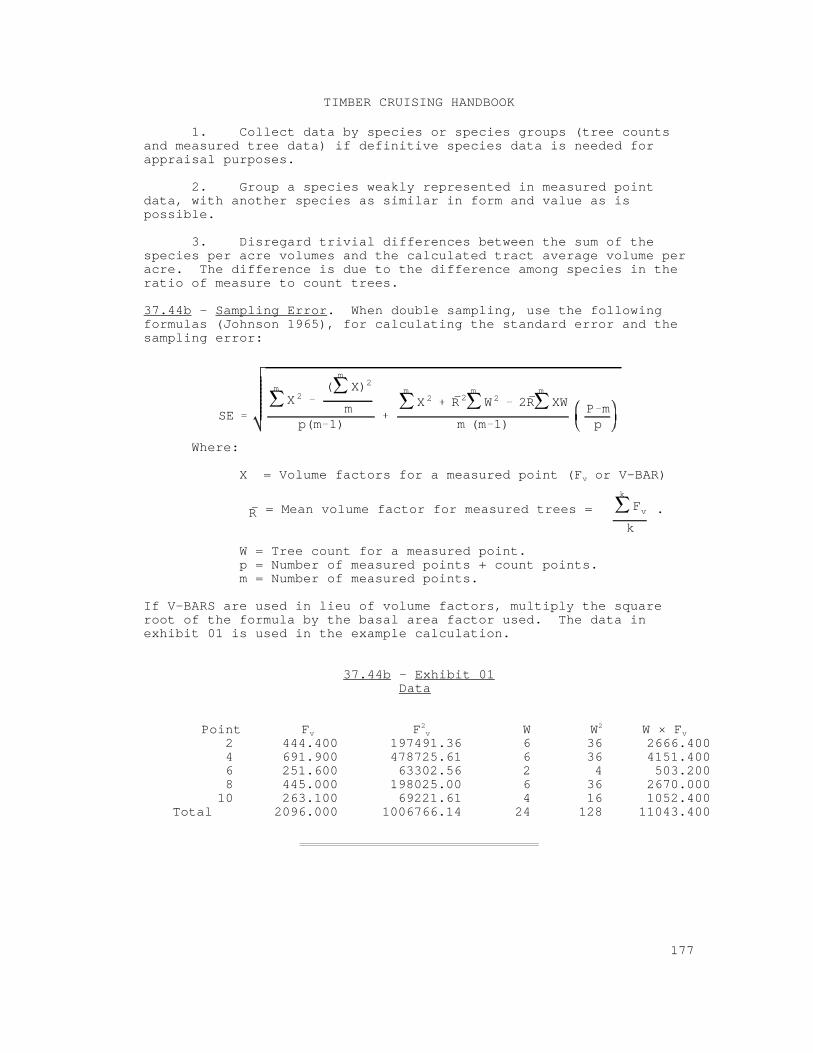
SE
m
X 2(
m
X)2
mp(m 1)
m
X 2 R 2m
W 2 2Rm
XW
m (m 1)P mp
R
k
Fv
k
TIMBER CRUISING HANDBOOK
177
1. Collect data by species or species groups (tree countsand measured tree data) if definitive species data is needed forappraisal purposes.
2. Group a species weakly represented in measured pointdata, with another species as similar in form and value as ispossible.
3. Disregard trivial differences between the sum of thespecies per acre volumes and the calculated tract average volume peracre. The difference is due to the difference among species in theratio of measure to count trees.
37.44b - Sampling Error. When double sampling, use the followingformulas (Johnson 1965), for calculating the standard error and thesampling error:
Where:
X = Volume factors for a measured point (F or V-BAR)v
= Mean volume factor for measured trees = .
W = Tree count for a measured point.p = Number of measured points + count points.m = Number of measured points.
If V-BARS are used in lieu of volume factors, multiply the squareroot of the formula by the basal area factor used. The data inexhibit 01 is used in the example calculation.
37.44b - Exhibit 01Data
Point F F W W W × F v2v
2v
2 444.400 197491.36 6 36 2666.400 4 691.900 478725.61 6 36 4151.400 6 251.600 63302.56 2 4 503.200 8 445.000 198025.00 6 36 2670.000
10 263.100 69221.61 4 16 1052.400 Total 2096.000 1006766.14 24 128 11043.400
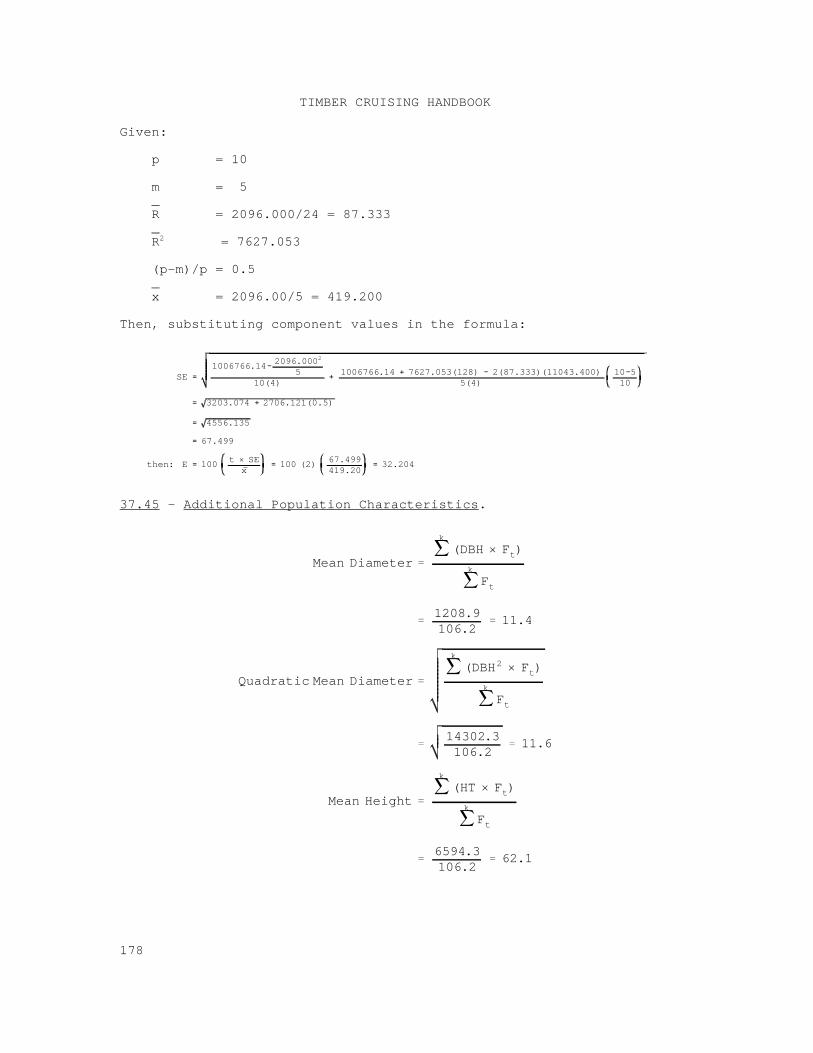
SE1006766.14 2096.0002
510(4)
1006766.14 7627.053(128) 2(87.333)(11043.400)5(4)
10 510
3203.074 2706.121(0.5)
4556.135
67.499
then: E 100 t × SEx
100 (2) 67.499419.20
32.204
Mean Diameter
k
(DBH × Ft)
k
Ft
1208.9106.2
11.4
Quadratic Mean Diameter
k
(DBH2 × Ft)
k
Ft
14302.3106.2
11.6
Mean Height
k
(HT × Ft)
k
Ft
6594.3106.2
62.1
TIMBER CRUISING HANDBOOK
178
Given:
p = 10
m = 5_R = 2096.000/24 = 87.333_R = 7627.0532
(p-m)/p = 0.5 _x = 2096.00/5 = 419.200
Then, substituting component values in the formula:
37.45 - Additional Population Characteristics.

TIMBER CRUISING HANDBOOK
179
37.46 - Application. Point sampling is an effective system to use inclear-cutting situations where large areas are to be cruised andwhere there is a range of tree sizes. This is a very cost effectivemethod where the individual tree VBAR variance is low and the basalarea variance per acre is high. The cost of taking count plots ismuch less than measure plots, and this samples where most of thevariance occurs.
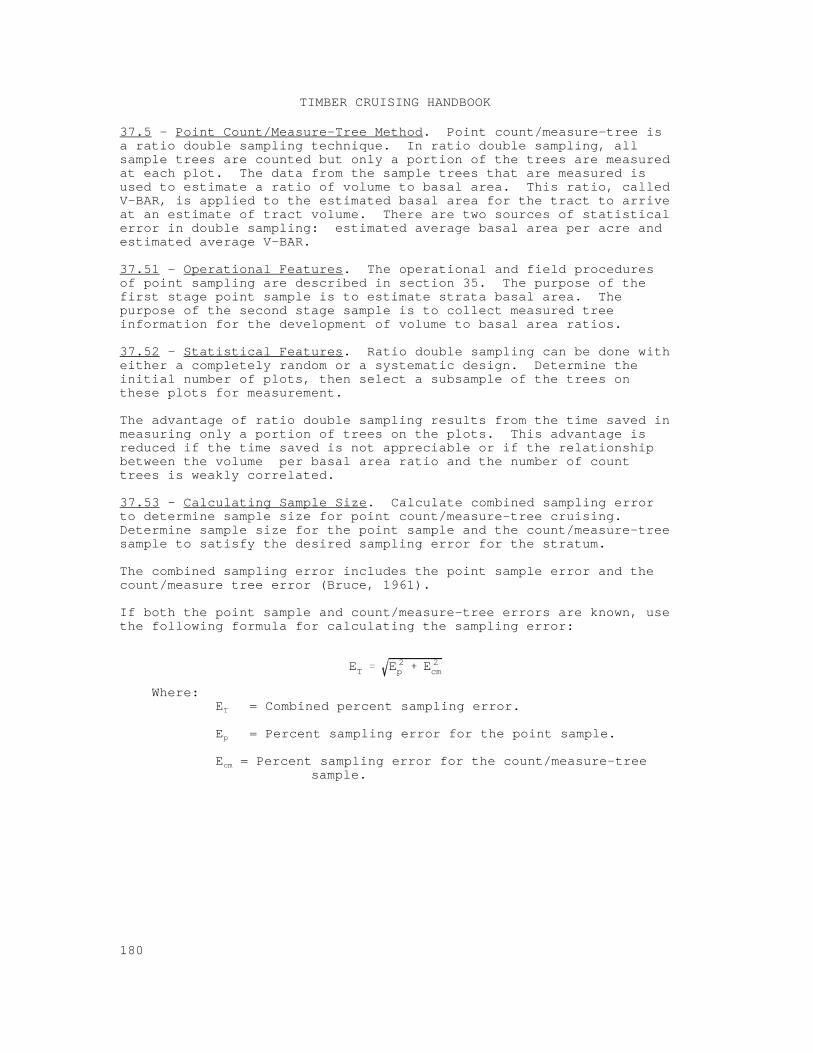
ET E 2p E 2
cm
TIMBER CRUISING HANDBOOK
180
37.5 - Point Count/Measure-Tree Method. Point count/measure-tree isa ratio double sampling technique. In ratio double sampling, allsample trees are counted but only a portion of the trees are measuredat each plot. The data from the sample trees that are measured isused to estimate a ratio of volume to basal area. This ratio, calledV-BAR, is applied to the estimated basal area for the tract to arriveat an estimate of tract volume. There are two sources of statisticalerror in double sampling: estimated average basal area per acre andestimated average V-BAR.
37.51 - Operational Features. The operational and field proceduresof point sampling are described in section 35. The purpose of thefirst stage point sample is to estimate strata basal area. Thepurpose of the second stage sample is to collect measured treeinformation for the development of volume to basal area ratios.
37.52 - Statistical Features. Ratio double sampling can be done witheither a completely random or a systematic design. Determine theinitial number of plots, then select a subsample of the trees onthese plots for measurement.
The advantage of ratio double sampling results from the time saved inmeasuring only a portion of trees on the plots. This advantage isreduced if the time saved is not appreciable or if the relationshipbetween the volume per basal area ratio and the number of counttrees is weakly correlated.
37.53 - Calculating Sample Size. Calculate combined sampling errorto determine sample size for point count/measure-tree cruising. Determine sample size for the point sample and the count/measure-treesample to satisfy the desired sampling error for the stratum.
The combined sampling error includes the point sample error and thecount/measure tree error (Bruce, 1961).
If both the point sample and count/measure-tree errors are known, usethe following formula for calculating the sampling error:
Where:E = Combined percent sampling error.T
E = Percent sampling error for the point sample.p
E = Percent sampling error for the count/measure-tree cm
sample.
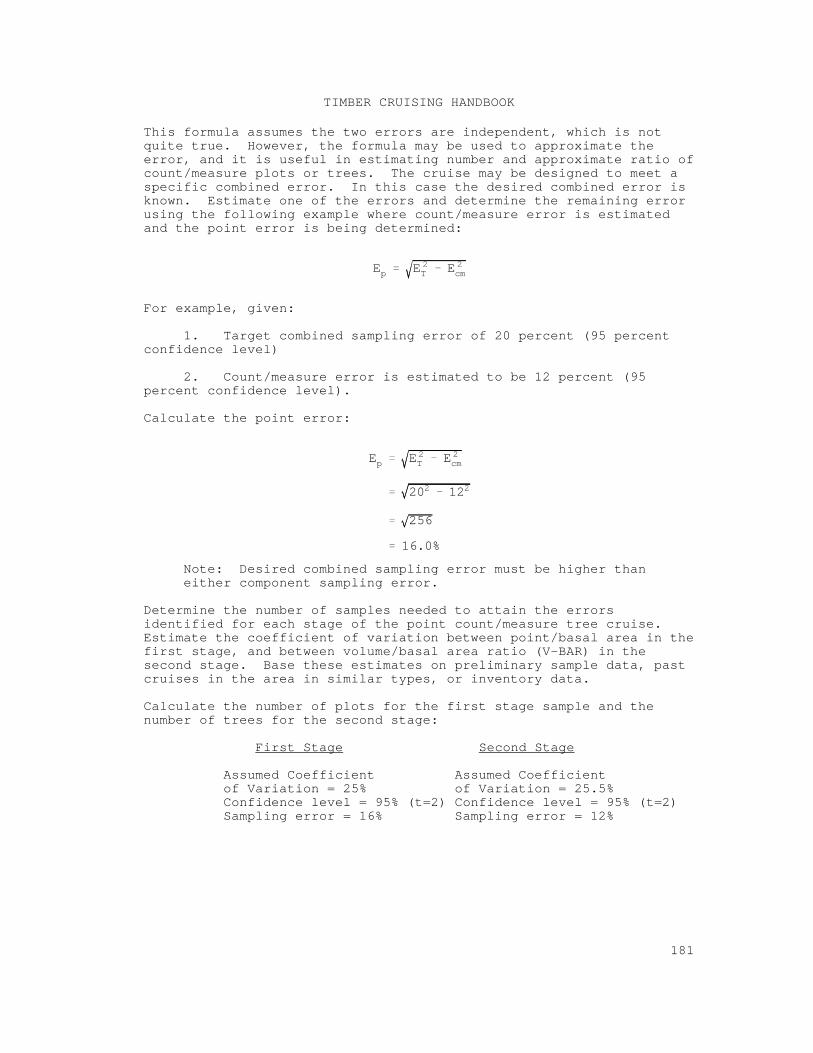
Ep E 2T E 2
cm
Ep E 2T E 2
cm
202 122
256
16.0%
TIMBER CRUISING HANDBOOK
181
This formula assumes the two errors are independent, which is notquite true. However, the formula may be used to approximate theerror, and it is useful in estimating number and approximate ratio ofcount/measure plots or trees. The cruise may be designed to meet aspecific combined error. In this case the desired combined error isknown. Estimate one of the errors and determine the remaining errorusing the following example where count/measure error is estimatedand the point error is being determined:
For example, given:
1. Target combined sampling error of 20 percent (95 percent confidence level)
2. Count/measure error is estimated to be 12 percent (95percent confidence level).
Calculate the point error:
Note: Desired combined sampling error must be higher thaneither component sampling error.
Determine the number of samples needed to attain the errorsidentified for each stage of the point count/measure tree cruise. Estimate the coefficient of variation between point/basal area in thefirst stage, and between volume/basal area ratio (V-BAR) in thesecond stage. Base these estimates on preliminary sample data, pastcruises in the area in similar types, or inventory data.
Calculate the number of plots for the first stage sample and thenumber of trees for the second stage:
First Stage Second Stage
Assumed Coefficient Assumed Coefficientof Variation = 25% of Variation = 25.5%Confidence level = 95% (t=2) Confidence level = 95% (t=2)Sampling error = 16% Sampling error = 12%
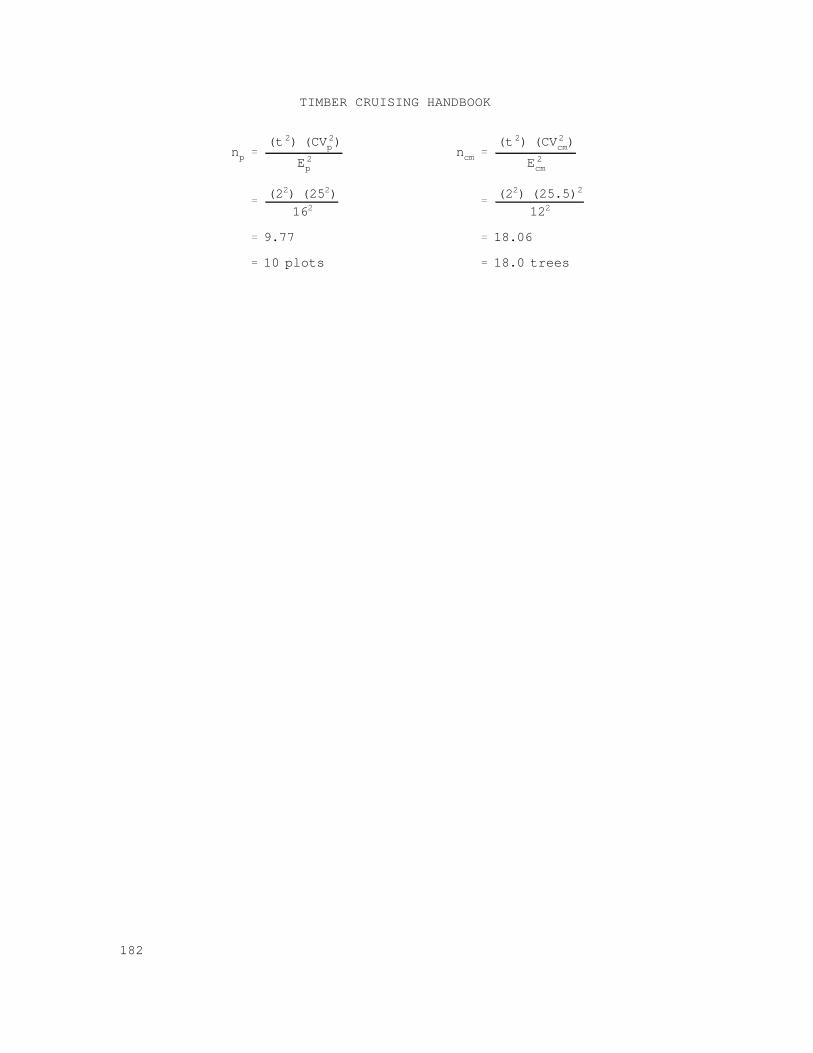
np(t 2) (CV 2
p)
E 2p
(22) (252)
162
9.77
10 plots
ncm(t 2) (CV2
cm)
E 2cm
(22) (25.5)2
122
18.06
18.0 trees
TIMBER CRUISING HANDBOOK
182
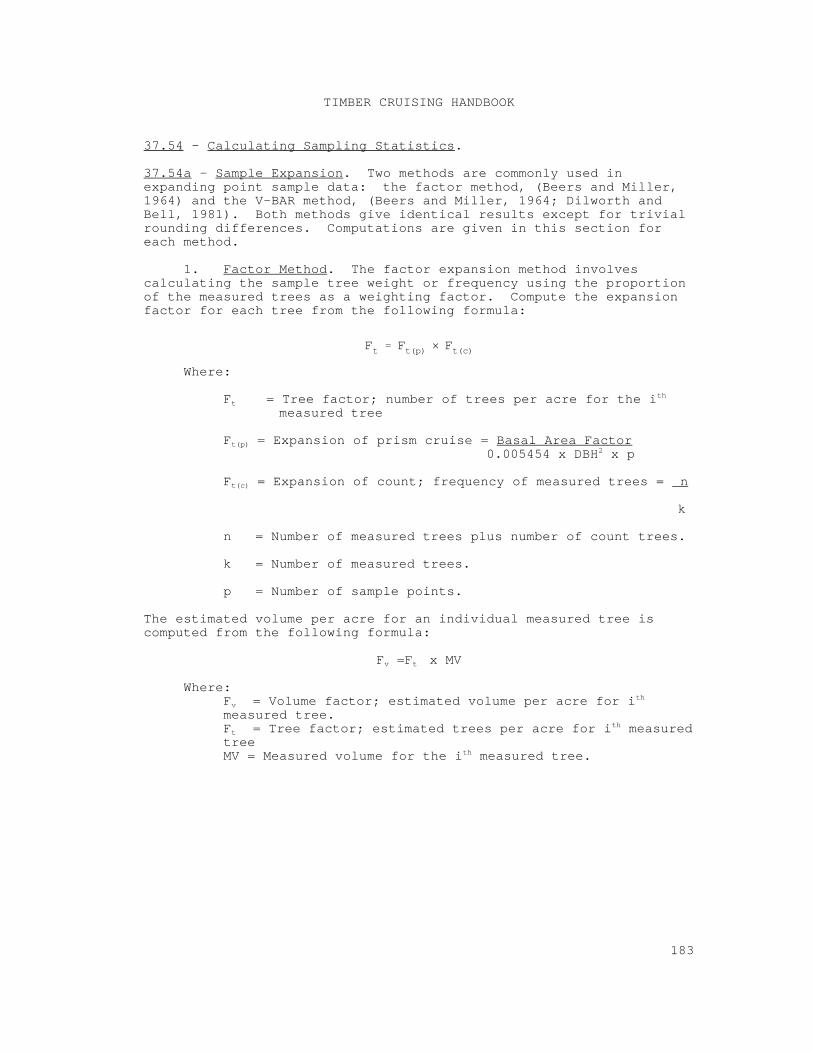
Ft Ft(p) × Ft(c)
TIMBER CRUISING HANDBOOK
183
37.54 - Calculating Sampling Statistics.
37.54a - Sample Expansion. Two methods are commonly used inexpanding point sample data: the factor method, (Beers and Miller,1964) and the V-BAR method, (Beers and Miller, 1964; Dilworth andBell, 1981). Both methods give identical results except for trivialrounding differences. Computations are given in this section foreach method.
1. Factor Method. The factor expansion method involvescalculating the sample tree weight or frequency using the proportionof the measured trees as a weighting factor. Compute the expansionfactor for each tree from the following formula:
Where:
F = Tree factor; number of trees per acre for the it th
measured tree
F = Expansion of prism cruise = Basal Area Factort(p)
0.005454 x DBH x p2
F = Expansion of count; frequency of measured trees = nt(c)
k
n = Number of measured trees plus number of count trees.
k = Number of measured trees.
p = Number of sample points.
The estimated volume per acre for an individual measured tree iscomputed from the following formula:
F =F x MVv t
Where:F = Volume factor; estimated volume per acre for iv
th
measured tree.F = Tree factor; estimated trees per acre for i measured t
th
treeMV = Measured volume for the i measured tree.th
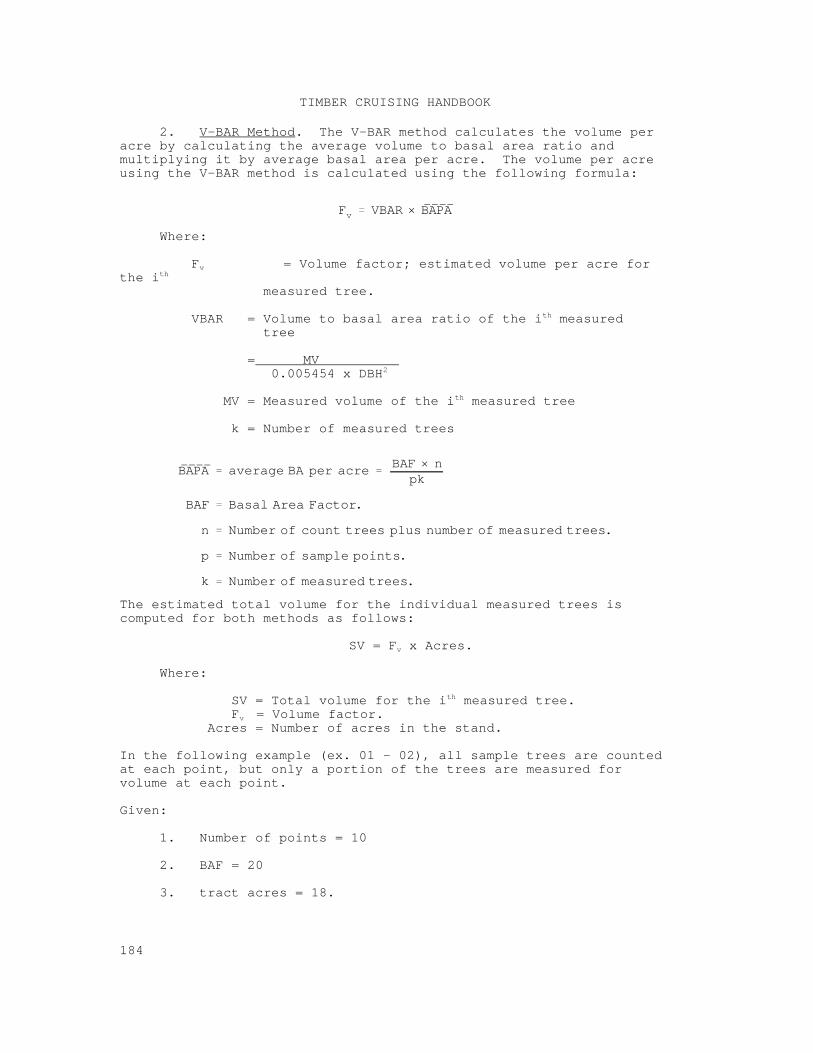
Fv VBAR × BAPA
BAPA average BA per acreBAF × n
pk
BAF Basal Area Factor.
n Number of count trees plus number of measured trees.
p Number of sample points.
k Number of measured trees.
TIMBER CRUISING HANDBOOK
184
2. V-BAR Method. The V-BAR method calculates the volume peracre by calculating the average volume to basal area ratio andmultiplying it by average basal area per acre. The volume per acreusing the V-BAR method is calculated using the following formula:
Where:
F = Volume factor; estimated volume per acre forv
the ith
measured tree.
VBAR = Volume to basal area ratio of the i measured th
tree
= MV 0.005454 x DBH 2
MV = Measured volume of the i measured treeth
k = Number of measured trees
The estimated total volume for the individual measured trees iscomputed for both methods as follows:
SV = F x Acres.v
Where:
SV = Total volume for the i measured tree.th
F = Volume factor.v
Acres = Number of acres in the stand.
In the following example (ex. 01 - 02), all sample trees are countedat each point, but only a portion of the trees are measured forvolume at each point.
Given:
1. Number of points = 10
2. BAF = 20
3. tract acres = 18.
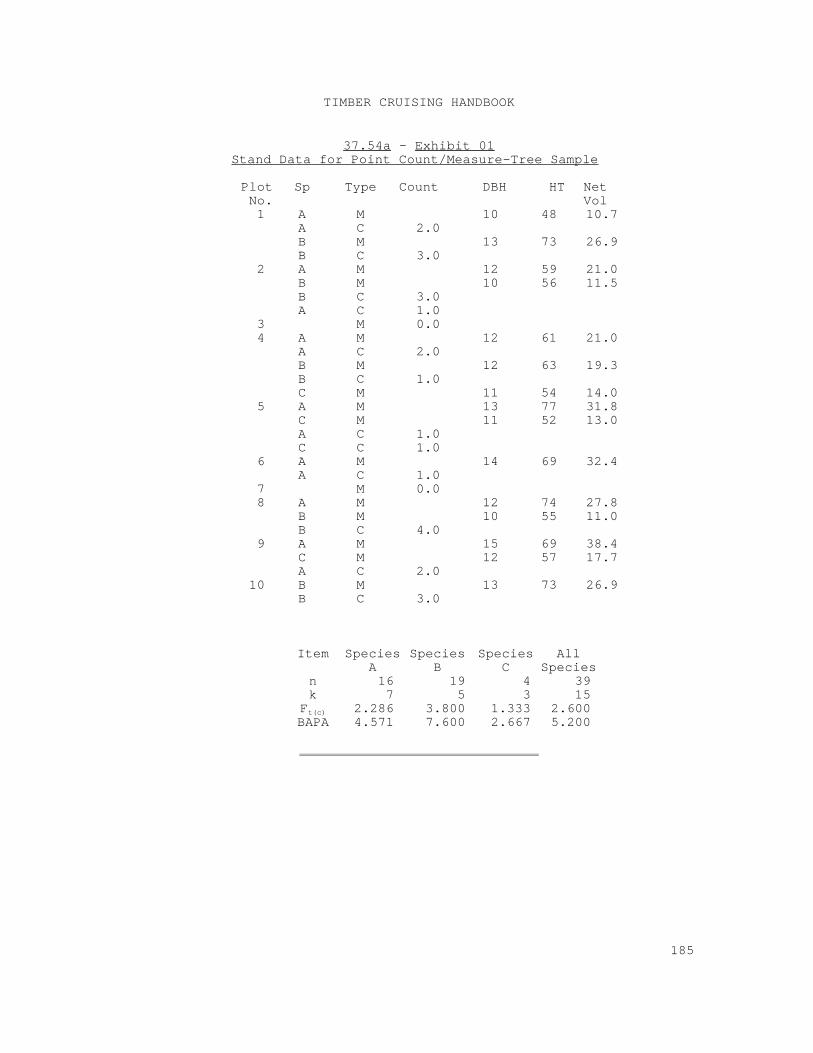
TIMBER CRUISING HANDBOOK
185
37.54a - Exhibit 01Stand Data for Point Count/Measure-Tree Sample
Plot Sp Type Count DBH HT NetNo. Vol1 A M 10 48 10.7
A C 2.0 B M 13 73 26.9 B C 3.0
2 A M 12 59 21.0 B M 10 56 11.5 B C 3.0 A C 1.0
3 M 0.0 4 A M 12 61 21.0
A C 2.0 B M 12 63 19.3 B C 1.0 C M 11 54 14.0
5 A M 13 77 31.8 C M 11 52 13.0 A C 1.0 C C 1.0
6 A M 14 69 32.4 A C 1.0
7 M 0.0 8 A M 12 74 27.8
B M 10 55 11.0 B C 4.0
9 A M 15 69 38.4 C M 12 57 17.7 A C 2.0
10 B M 13 73 26.9 B C 3.0
Item Species Species Species AllA B C Species
n 16 19 4 39 k 7 5 3 15
F 2.286 3.800 1.333 2.600 t(c)
BAPA 4.571 7.600 2.667 5.200
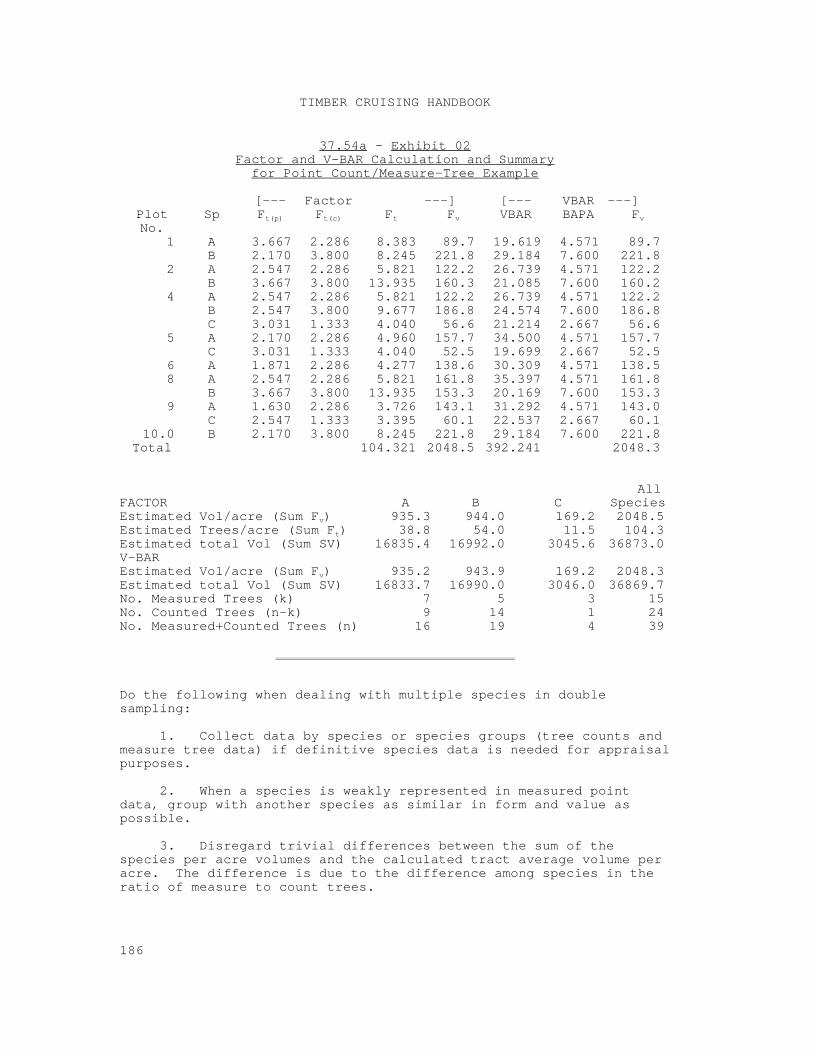
TIMBER CRUISING HANDBOOK
186
37.54a - Exhibit 02Factor and V-BAR Calculation and Summary
for Point Count/Measure-Tree Example
[--- Factor ---] [--- VBAR ---]Plot Sp F F F F VBAR BAPA FNo.
t(p) t(c) t v v
1 A 3.667 2.286 8.383 89.7 19.619 4.571 89.7 B 2.170 3.800 8.245 221.8 29.184 7.600 221.8
2 A 2.547 2.286 5.821 122.2 26.739 4.571 122.2 B 3.667 3.800 13.935 160.3 21.085 7.600 160.2
4 A 2.547 2.286 5.821 122.2 26.739 4.571 122.2 B 2.547 3.800 9.677 186.8 24.574 7.600 186.8 C 3.031 1.333 4.040 56.6 21.214 2.667 56.6
5 A 2.170 2.286 4.960 157.7 34.500 4.571 157.7 C 3.031 1.333 4.040 52.5 19.699 2.667 52.5
6 A 1.871 2.286 4.277 138.6 30.309 4.571 138.5 8 A 2.547 2.286 5.821 161.8 35.397 4.571 161.8
B 3.667 3.800 13.935 153.3 20.169 7.600 153.3 9 A 1.630 2.286 3.726 143.1 31.292 4.571 143.0
C 2.547 1.333 3.395 60.1 22.537 2.667 60.1 10.0 B 2.170 3.800 8.245 221.8 29.184 7.600 221.8
Total 104.321 2048.5 392.241 2048.3
AllFACTOR A B C SpeciesEstimated Vol/acre (Sum F ) 935.3 944.0 169.2 2048.5 v
Estimated Trees/acre (Sum F ) 38.8 54.0 11.5 104.3 t
Estimated total Vol (Sum SV) 16835.4 16992.0 3045.6 36873.0 V-BAREstimated Vol/acre (Sum F ) 935.2 943.9 169.2 2048.3 v
Estimated total Vol (Sum SV) 16833.7 16990.0 3046.0 36869.7 No. Measured Trees (k) 7 5 3 15 No. Counted Trees (n-k) 9 14 1 24 No. Measured+Counted Trees (n) 16 19 4 39
Do the following when dealing with multiple species in doublesampling:
1. Collect data by species or species groups (tree counts andmeasure tree data) if definitive species data is needed for appraisalpurposes.
2. When a species is weakly represented in measured pointdata, group with another species as similar in form and value aspossible.
3. Disregard trivial differences between the sum of thespecies per acre volumes and the calculated tract average volume peracre. The difference is due to the difference among species in theratio of measure to count trees.
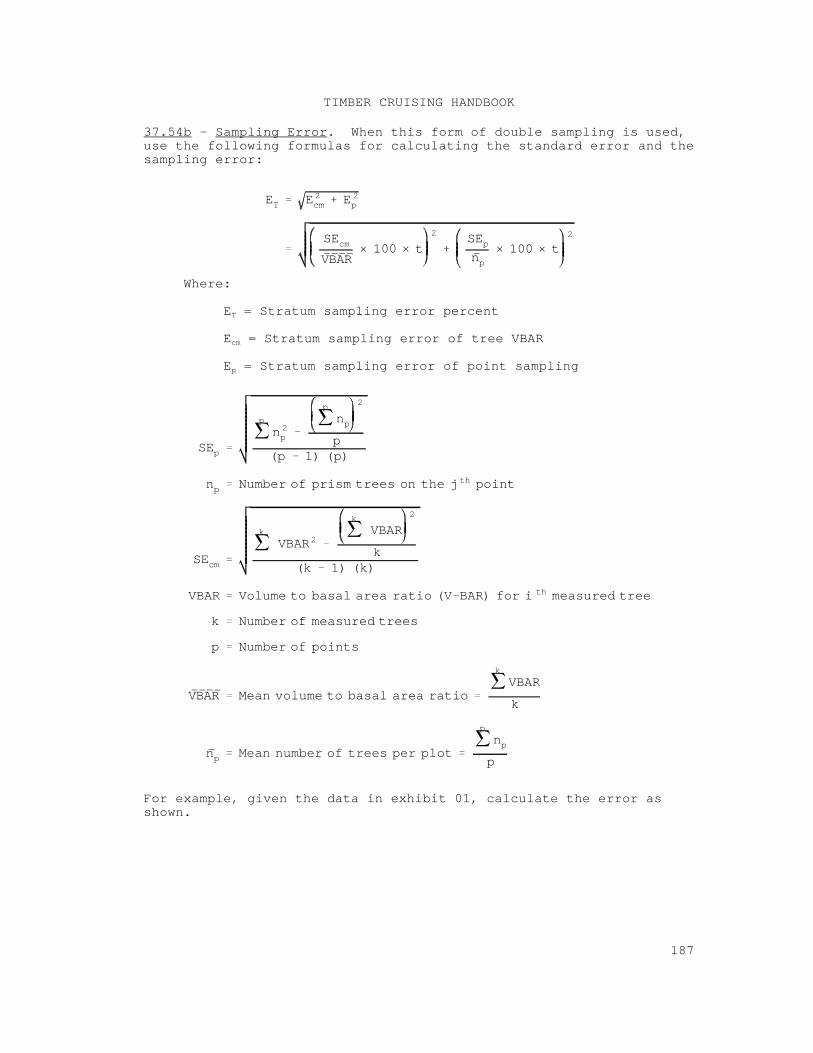
ET E 2cm E 2
p
SEcmVBAR
× 100 × t2 SEp
np× 100 × t
2
SEp
p
n 2p
p
np
2
p(p 1) (p)
np Number of prism trees on the j th point
SEcm
k
VBAR2
k
VBAR2
k(k 1) (k)
VBAR Volume to basal area ratio (V BAR) for i th measured tree
k Number of measured trees
p Number of points
VBAR Mean volume to basal area ratio
k
VBAR
k
np Mean number of trees per plot
p
np
p
TIMBER CRUISING HANDBOOK
187
37.54b - Sampling Error. When this form of double sampling is used,use the following formulas for calculating the standard error and thesampling error:
Where:
E = Stratum sampling error percentT
E = Stratum sampling error of tree VBARcm
E = Stratum sampling error of point samplingp
For example, given the data in exhibit 01, calculate the error asshown.
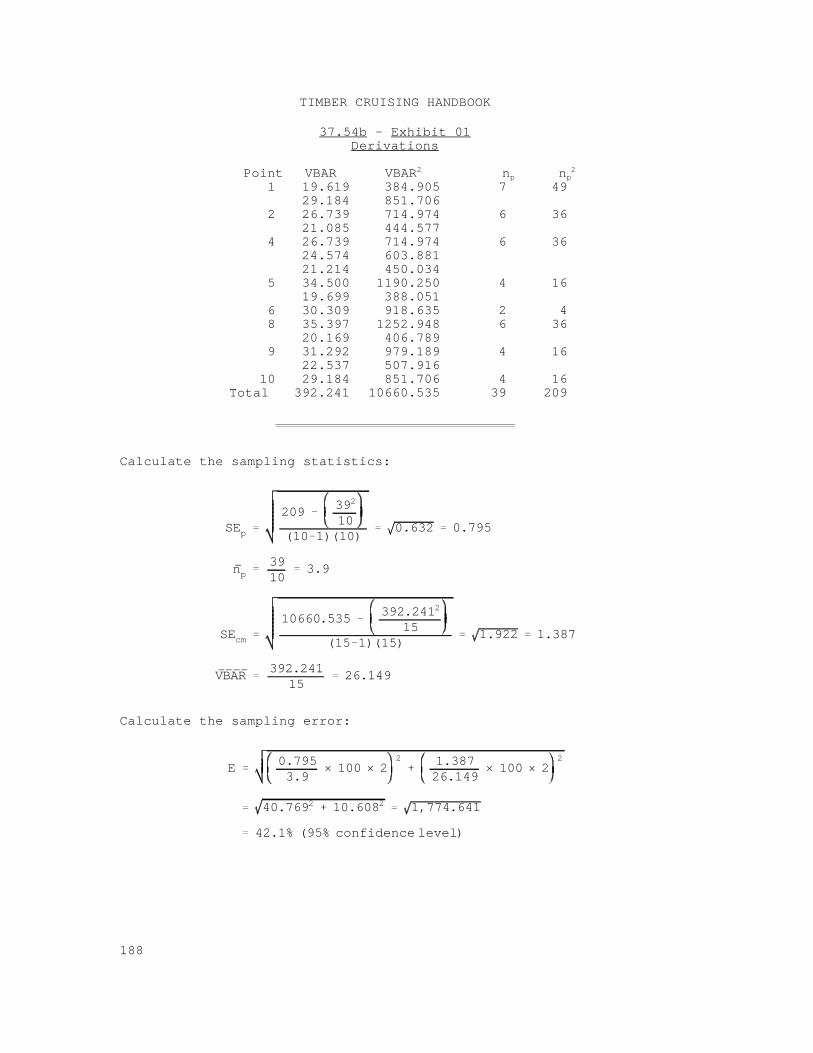
SEp
209392
10(10 1)(10)
0.632 0.795
np3910
3.9
SEcm
10660.535392.2412
15(15 1)(15)
1.922 1.387
VBAR392.241
1526.149
E0.7953.9
× 100 × 22 1.387
26.149× 100 × 2
2
40.7692 10.6082 1,774.641
42.1% (95% confidence level)
TIMBER CRUISING HANDBOOK
188
37.54b - Exhibit 01Derivations
Point VBAR VBAR n n2p p
2
1 19.619 384.905 7 49 29.184 851.706
2 26.739 714.974 6 36 21.085 444.577
4 26.739 714.974 6 36 24.574 603.881 21.214 450.034
5 34.500 1190.250 4 16 19.699 388.051
6 30.309 918.635 2 4 8 35.397 1252.948 6 36
20.169 406.789 9 31.292 979.189 4 16
22.537 507.916 10 29.184 851.706 4 16
Total 392.241 10660.535 39 209
Calculate the sampling statistics:
Calculate the sampling error:
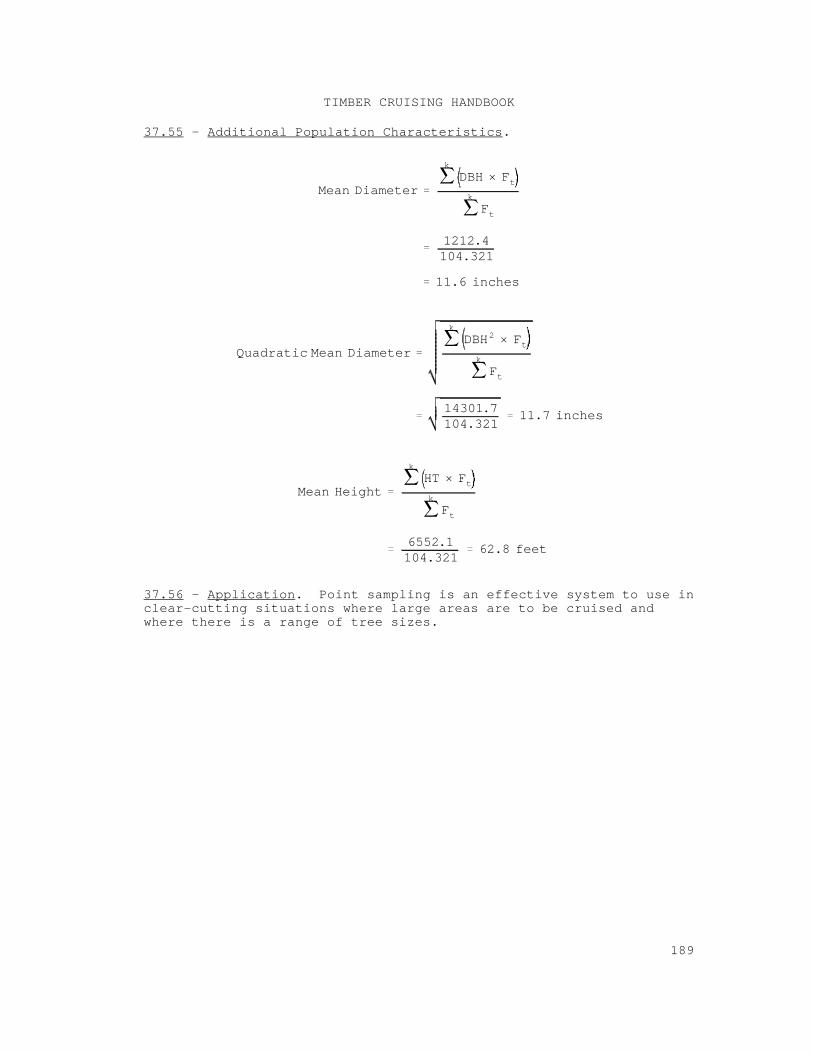
Mean Diameter
k
DBH × Ftk
Ft
1212.4104.321
11.6 inches
Quadratic Mean Diameter
k
DBH2 × Ftk
Ft
14301.7104.321
11.7 inches
Mean Height
k
HT × Ftk
Ft
6552.1104.321
62.8 feet
TIMBER CRUISING HANDBOOK
189
37.55 - Additional Population Characteristics.
37.56 - Application. Point sampling is an effective system to use inclear-cutting situations where large areas are to be cruised andwhere there is a range of tree sizes.
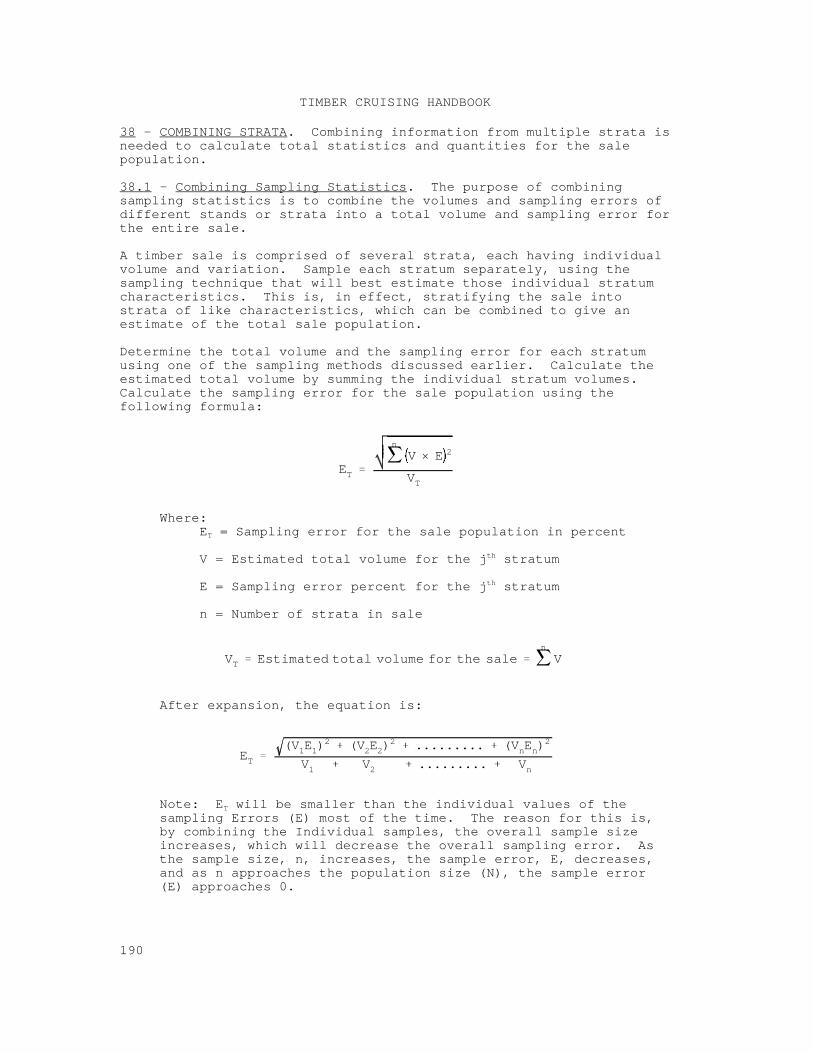
ET
n
V × E 2
VT
VT Estimated total volume for the salen
V
ET(V1E1)
2 (V2E2)2 ......... (VnEn)
2
V1 V2 ......... Vn
TIMBER CRUISING HANDBOOK
190
38 - COMBINING STRATA. Combining information from multiple strata isneeded to calculate total statistics and quantities for the salepopulation.
38.1 - Combining Sampling Statistics. The purpose of combiningsampling statistics is to combine the volumes and sampling errors ofdifferent stands or strata into a total volume and sampling error forthe entire sale.
A timber sale is comprised of several strata, each having individualvolume and variation. Sample each stratum separately, using thesampling technique that will best estimate those individual stratumcharacteristics. This is, in effect, stratifying the sale intostrata of like characteristics, which can be combined to give anestimate of the total sale population.
Determine the total volume and the sampling error for each stratumusing one of the sampling methods discussed earlier. Calculate theestimated total volume by summing the individual stratum volumes. Calculate the sampling error for the sale population using thefollowing formula:
Where:E = Sampling error for the sale population in percentT
V = Estimated total volume for the j stratumth
E = Sampling error percent for the j stratumth
n = Number of strata in sale
After expansion, the equation is:
Note: E will be smaller than the individual values of theT
sampling Errors (E) most of the time. The reason for this is,by combining the Individual samples, the overall sample sizeincreases, which will decrease the overall sampling error. Asthe sample size, n, increases, the sample error, E, decreases,and as n approaches the population size (N), the sample error(E) approaches 0.
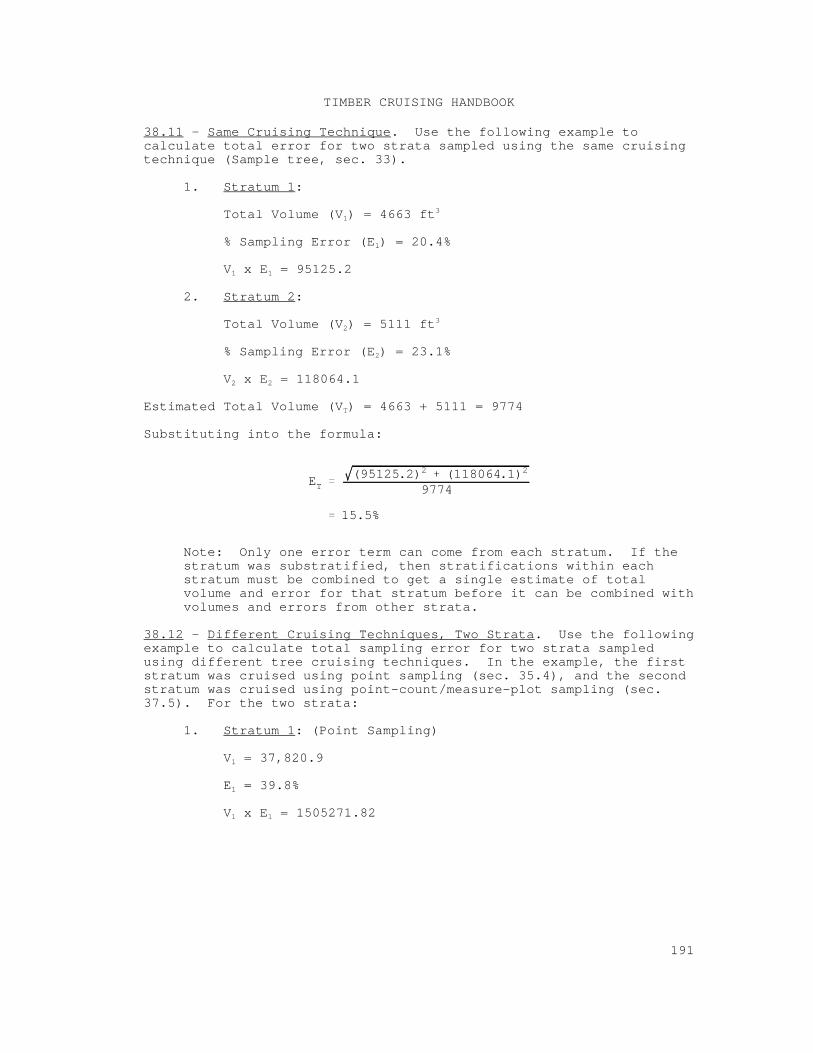
ET(95125.2)2 (118064.1)2
9774
15.5%
TIMBER CRUISING HANDBOOK
191
38.11 - Same Cruising Technique. Use the following example tocalculate total error for two strata sampled using the same cruisingtechnique (Sample tree, sec. 33).
1. Stratum 1:
Total Volume (V ) = 4663 ft13
% Sampling Error (E ) = 20.4%1
V x E = 95125.21 1
2. Stratum 2:
Total Volume (V ) = 5111 ft23
% Sampling Error (E ) = 23.1%2
V x E = 118064.12 2
Estimated Total Volume (V ) = 4663 + 5111 = 9774T
Substituting into the formula:
Note: Only one error term can come from each stratum. If thestratum was substratified, then stratifications within eachstratum must be combined to get a single estimate of totalvolume and error for that stratum before it can be combined withvolumes and errors from other strata.
38.12 - Different Cruising Techniques, Two Strata. Use the followingexample to calculate total sampling error for two strata sampledusing different tree cruising techniques. In the example, the firststratum was cruised using point sampling (sec. 35.4), and the secondstratum was cruised using point-count/measure-plot sampling (sec.37.5). For the two strata:
1. Stratum 1: (Point Sampling)
V = 37,820.91
E = 39.8%1
V x E = 1505271.821 1
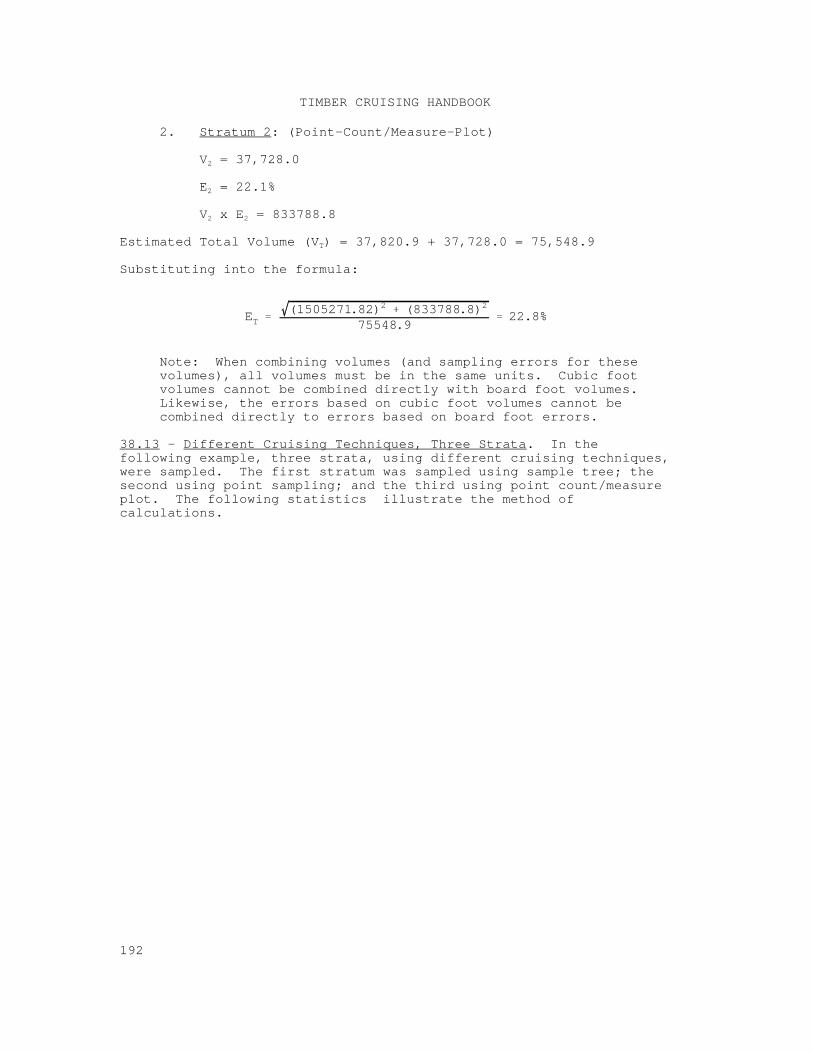
ET(1505271.82)2 (833788.8)2
75548.922.8%
TIMBER CRUISING HANDBOOK
192
2. Stratum 2: (Point-Count/Measure-Plot)
V = 37,728.02
E = 22.1%2
V x E = 833788.82 2
Estimated Total Volume (V ) = 37,820.9 + 37,728.0 = 75,548.9T
Substituting into the formula:
Note: When combining volumes (and sampling errors for thesevolumes), all volumes must be in the same units. Cubic footvolumes cannot be combined directly with board foot volumes. Likewise, the errors based on cubic foot volumes cannot becombined directly to errors based on board foot errors.
38.13 - Different Cruising Techniques, Three Strata. In thefollowing example, three strata, using different cruising techniques,were sampled. The first stratum was sampled using sample tree; thesecond using point sampling; and the third using point count/measureplot. The following statistics illustrate the method ofcalculations.
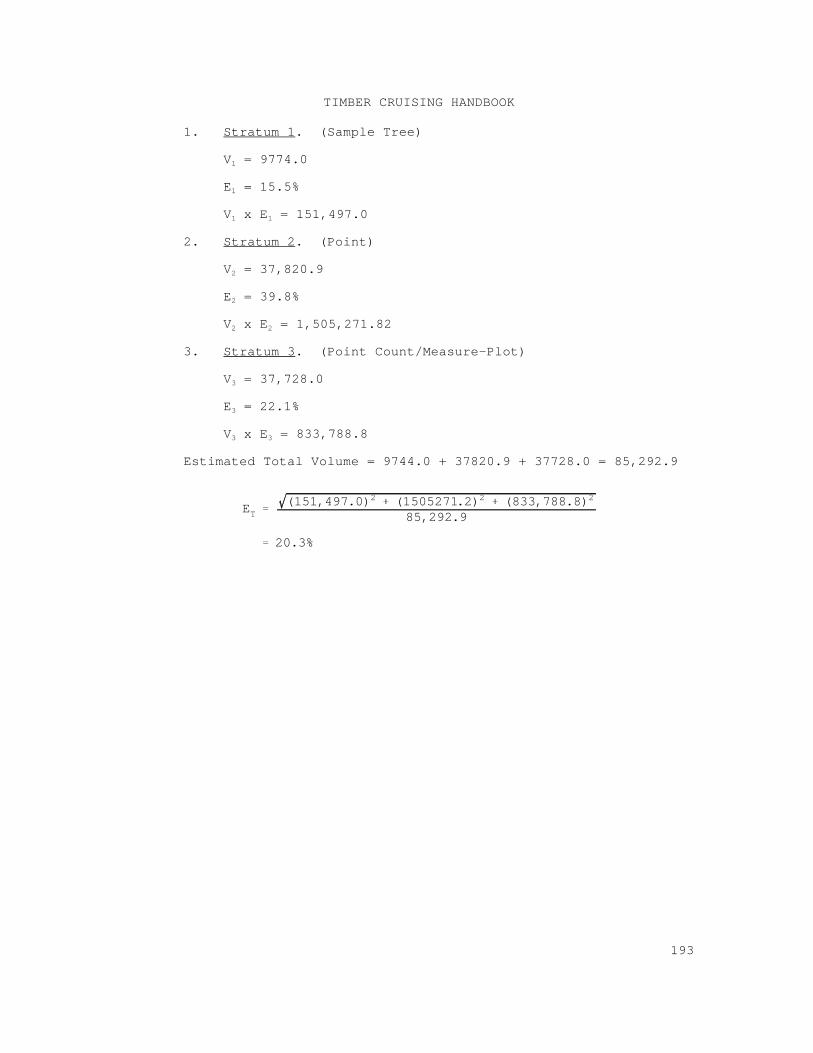
ET(151,497.0)2 (1505271.2)2 (833,788.8)2
85,292.9
20.3%
TIMBER CRUISING HANDBOOK
193
1. Stratum 1. (Sample Tree)
V = 9774.01
E = 15.5%1
V x E = 151,497.01 1
2. Stratum 2. (Point)
V = 37,820.92
E = 39.8%2
V x E = 1,505,271.822 2
3. Stratum 3. (Point Count/Measure-Plot)
V = 37,728.03
E = 22.1%3
V x E = 833,788.83 3
Estimated Total Volume = 9744.0 + 37820.9 + 37728.0 = 85,292.9
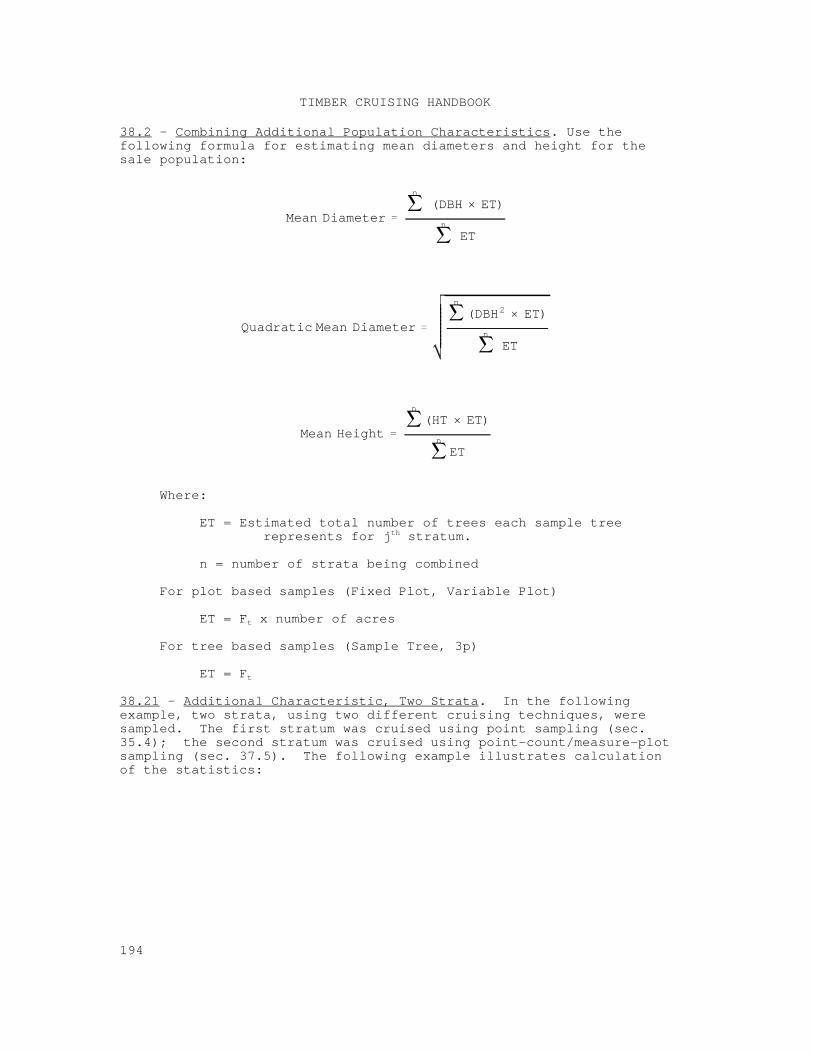
Mean Diameter
n
(DBH × ET)
n
ET
Quadratic Mean Diameter
n
(DBH2 × ET)
n
ET
Mean Height
n
(HT × ET)
n
ET
TIMBER CRUISING HANDBOOK
194
38.2 - Combining Additional Population Characteristics. Use thefollowing formula for estimating mean diameters and height for thesale population:
Where:
ET = Estimated total number of trees each sample tree represents for j stratum.th
n = number of strata being combined
For plot based samples (Fixed Plot, Variable Plot)
ET = F x number of acrest
For tree based samples (Sample Tree, 3p)
ET = Ft
38.21 - Additional Characteristic, Two Strata. In the followingexample, two strata, using two different cruising techniques, weresampled. The first stratum was cruised using point sampling (sec.35.4); the second stratum was cruised using point-count/measure-plotsampling (sec. 37.5). The following example illustrates calculationof the statistics:
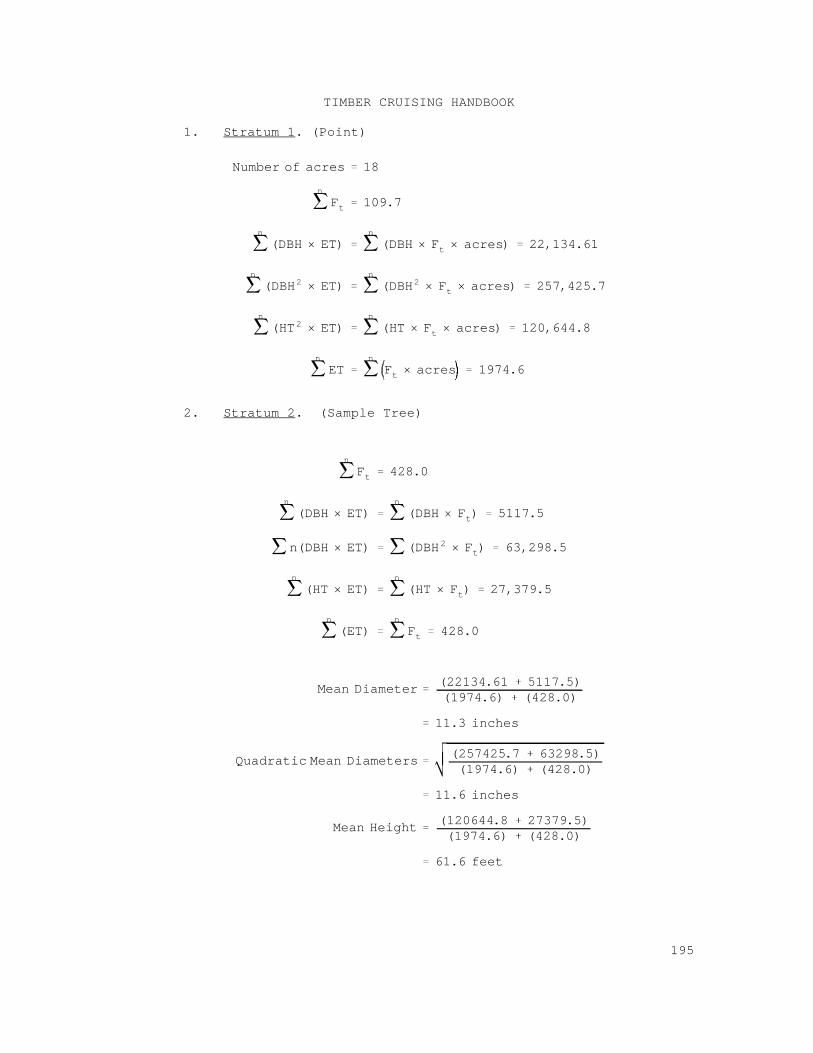
Number of acres 18
n
Ft 109.7
n
(DBH × ET)n
(DBH × Ft × acres) 22,134.61
n
(DBH2 × ET)n
(DBH2 × Ft × acres) 257,425.7
n
(HT2 × ET)n
(HT × Ft × acres) 120,644.8
n
ETn
Ft × acres 1974.6
n
Ft 428.0
n
(DBH × ET)n
(DBH × Ft) 5117.5
n(DBH × ET) (DBH2 × Ft) 63,298.5
n
(HT × ET)n
(HT × Ft) 27,379.5
n
(ET)n
Ft 428.0
Mean Diameter(22134.61 5117.5)(1974.6) (428.0)
11.3 inches
Quadratic Mean Diameters(257425.7 63298.5)(1974.6) (428.0)
11.6 inches
Mean Height(120644.8 27379.5)(1974.6) (428.0)
61.6 feet
TIMBER CRUISING HANDBOOK
195
1. Stratum 1. (Point)
2. Stratum 2. (Sample Tree)

TIMBER CRUISING HANDBOOK
196
38.3 - Applications of Combined Statistics. Use combined statisticsto determine the final sale characteristics after all strata in asale have been cruised.

TIMBER CRUISING HANDBOOK
197

TIMBER CRUISING HANDBOOK
238
2409.12,40 ContentsPage 1 of 2
FOREST SERVICE HANDBOOKWashington, D.C.
FSH 2409.12 - TIMBER CRUISING HANDBOOK
Amendment No. 2409.12-2000-1
Effective April 20, 2000
POSTING NOTICE. Amendments are numbered consecutively by Handbook number and calendar year. Post by document name. Place the Table of Contents in front of chapter 40. Retain this transmittal as the first page of this document. The last amendment to this Handbook was Amendment 2409.12-96-2 to FSH 2409.12,70.
Superseded NewDocument Name (Number of Pages)
2409.12,40 Contents -- 2
Digest:
2409.12,40 Contents - Revises codes and captions to agree with text changes in chapter 40 and creates the chapter table of contents as a separate document.
MIKE DOMBECKChief

WO AMENDMENT 2409.12-2000-1 2409.12,40 ContentsEFFECTIVE 04/20/2000 Page 2 of 2
FSH 2409.12 - TIMBER CRUISING HANDBOOKWO AMENDMENT 2409.12-2000-1
EFFECTIVE 04/20/2000
CHAPTER 40 - CRUISE PLANNING, DATA RECORDING, AND CRUISE REPORTING
Contents
41 CRUISE PLANNING41.1 Sampling Error Standards41.2 Silvicultural Guides41.3 Sampling Methods and Sampling Intensity41.31 How To Use Pre-Cruise Data41.32 Supplemental Samples41.4 Stratification of Cruises41.41 Timber Type41.42 Stand41.43 Payment or Cutting Unit41.44 Species41.45 Diameter41.46 Other Stratification Methods41.5 Merchantability Specifications41.6 Sale Work Maps41.7 Special Instructions41.8 Quality and Value Determination41.9 Safety in Cruising
42 DATA RECORDING42.1 Standard Codes42.2 Tree Tally Techniques42.3 Field Aids and Recording Equipment42.31 Field Aids42.32 Recording Equipment42.4 Forms and Electronic Data Recorders42.41 Forms42.42 Electronic Data Recorders42.5 Other Recording Requirements42.6 Data Security
43 CRUISE REPORTING43.1 Information To Report43.2 Volume, Value, and Sampling Error Reporting43.3 Area Information43.4 Other Information43.5 Certifying Cruise Information43.6 Disposition of Records
2409.12,40Page 1 of 14
FOREST SERVICE HANDBOOKWashington, D.C.
FSH 2409.12 - TIMBER CRUISING HANDBOOK
Amendment No. 2409.12-2000-2
Effective April 20, 2000
POSTING NOTICE. Amendments are numbered consecutively by Handbook number and calendar year. Post by document name. Remove entire document and replace with this amendment. Retain this transmittal as the first page of this document. The last amendment to this Handbook was Amendment 2409.12-2000-1 to FSH 2409.12,40 Contents.
This amendment supersedes Amendment 2409.12-93-1 to chapter 40.
Superseded NewDocument Name (Number of Pages)
40 thru 43.5 11 --
2409.12,40 -- 14
Digest:
Makes minor editorial and grammatical corrections throughout chapter 40.
41.1 - Revises sampling error standards to provide for a sliding scale for sampling errors and to increase the estimated sale value for error standards.
42.6 - Clarifies direction on security data collection forms and data equipment.
43.5 - Revises the caption for section 43.5 from the former Check Cruise Information to the current Certifying Cruise information.
MIKE DOMBECKChief
WO AMENDMENT 2409.12-2000-2 2409.12,40EFFECTIVE 04/20/2000 Page 2 of 14
FSH 2409.12 - TIMBER CRUISING HANDBOOKWO AMENDMENT 2409.12-2000-2
EFFECTIVE 04/20/2000
CHAPTER 40 - CRUISE PLANNING, DATA RECORDING, AND CRUISE REPORTING
41 - CRUISE PLANNING. Prepare a cruise plan for each timber sale (FSM 2442.04 and 2442.2). At a minimum, the cruise plan must include:
1. A definition of the sample population(s).
2. The sampling method(s) and intensity for each population.
3. Product merchantability specifications for each population.
4. Sale area maps.
5. Silvicultural guides, when required.
41.1 - Sampling Error Standards.
1. Use sampling error standards when sales include the following products:
a. Sawtimber;
b. Pulp;
c. Cedar products, such as shakes, posts, and rails split from trees; and
d. Posts and poles, such as power and utility poles.
2. Do not apply sampling error standards when the products are:
a. For administrative use;
b. Non-convertible products;
c. Cull decks;
d. Non-commercial species;
e. For personal use;
f. Sold by the piece; and
g. Biomass, such as hog fuel.
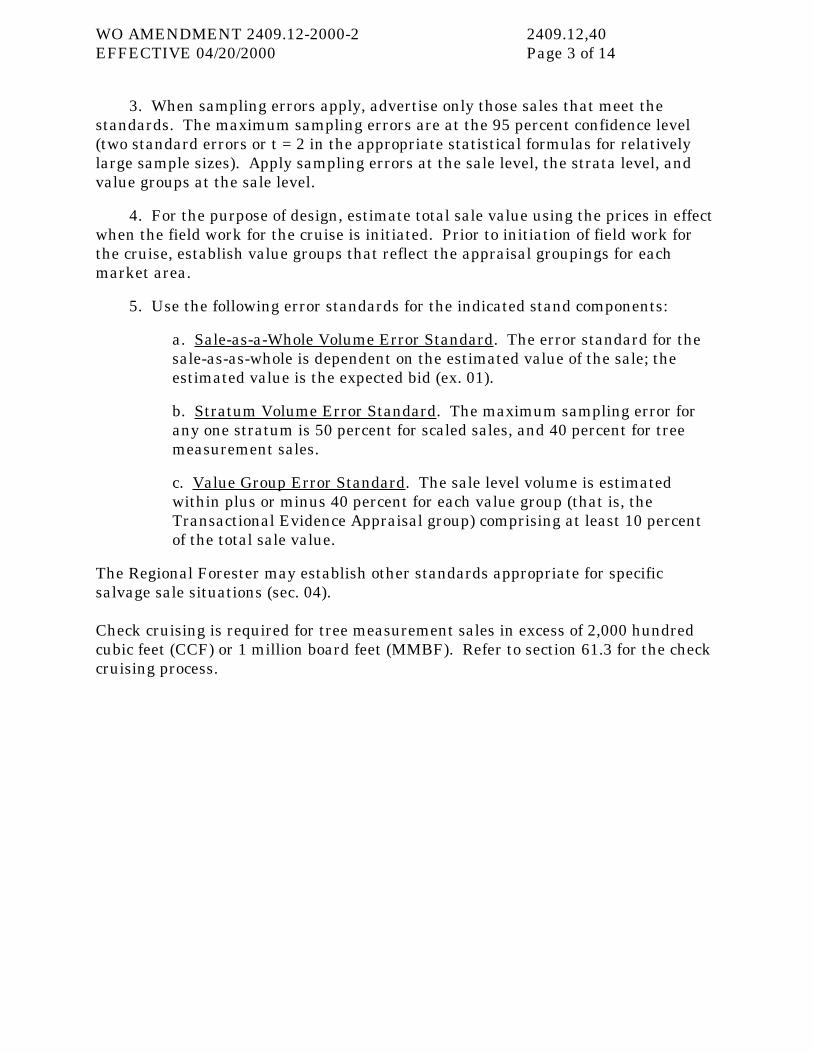
WO AMENDMENT 2409.12-2000-2 2409.12,40EFFECTIVE 04/20/2000 Page 3 of 14
3. When sampling errors apply, advertise only those sales that meet the standards. The maximum sampling errors are at the 95 percent confidence level (two standard errors or t = 2 in the appropriate statistical formulas for relatively large sample sizes). Apply sampling errors at the sale level, the strata level, and value groups at the sale level.
4. For the purpose of design, estimate total sale value using the prices in effect when the field work for the cruise is initiated. Prior to initiation of field work for the cruise, establish value groups that reflect the appraisal groupings for each market area.
5. Use the following error standards for the indicated stand components:
a. Sale-as-a-Whole Volume Error Standard. The error standard for the sale-as-as-whole is dependent on the estimated value of the sale; the estimated value is the expected bid (ex. 01).
b. Stratum Volume Error Standard. The maximum sampling error for any one stratum is 50 percent for scaled sales, and 40 percent for tree measurement sales.
c. Value Group Error Standard. The sale level volume is estimated within plus or minus 40 percent for each value group (that is, the Transactional Evidence Appraisal group) comprising at least 10 percent of the total sale value.
The Regional Forester may establish other standards appropriate for specific salvage sale situations (sec. 04).
Check cruising is required for tree measurement sales in excess of 2,000 hundred cubic feet (CCF) or 1 million board feet (MMBF). Refer to section 61.3 for the check cruising process.
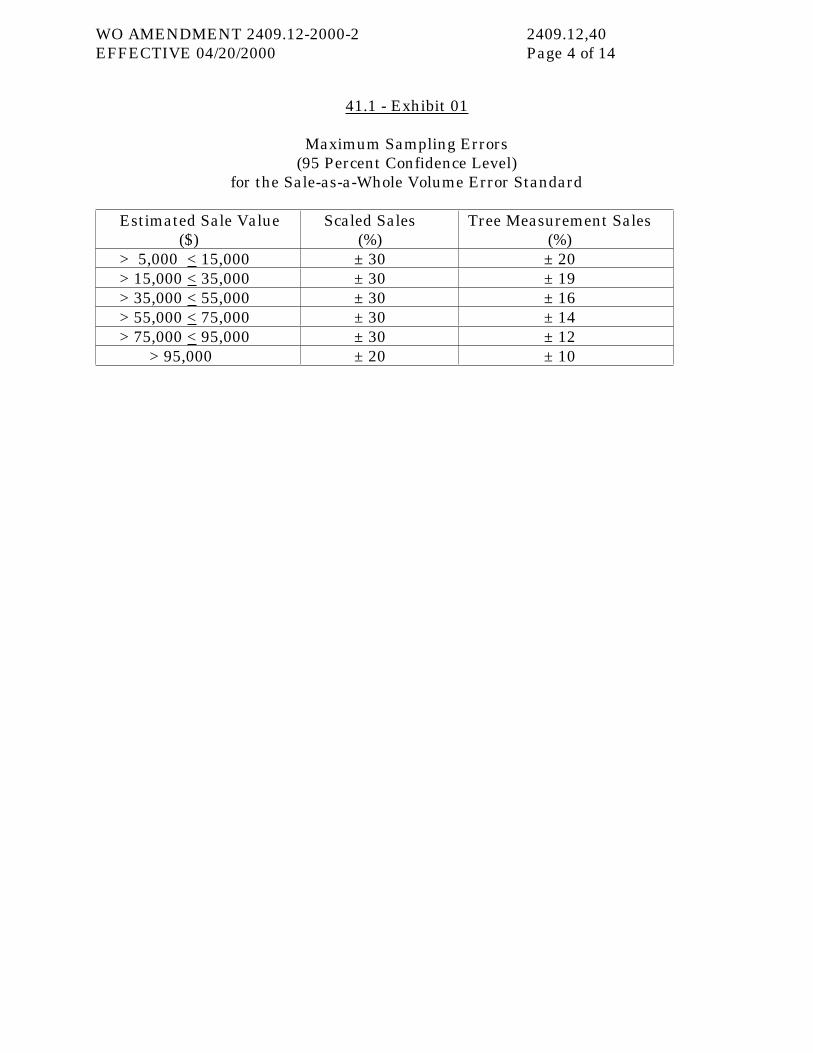
WO AMENDMENT 2409.12-2000-2 2409.12,40EFFECTIVE 04/20/2000 Page 4 of 14
41.1 - Exhibit 01
Maximum Sampling Errors (95 Percent Confidence Level)
for the Sale-as-a-Whole Volume Error Standard
Estimated Sale Value($)
Scaled Sales(%)
Tree Measurement Sales(%)
> 5,000 < 15,000 ± 30 ± 20> 15,000 < 35,000 ± 30 ± 19> 35,000 < 55,000 ± 30 ± 16> 55,000 < 75,000 ± 30 ± 14> 75,000 < 95,000 ± 30 ± 12
> 95,000 ± 20 ± 10
WO AMENDMENT 2409.12-2000-2 2409.12,40EFFECTIVE 04/20/2000 Page 5 of 14
41.2 - Silvicultural Guides. Use the silvicultural prescription to determine the cutting methods. This prescription assists the cruise planner by identifying a stand treatment which can include information about the species to be removed, expected cutting methods, and leave basal area.
Consult with the responsible silviculturist to determine how to integrate the logging needs and conditions of the timber stand with the silvicultural prescription. Ensure that cruise instructions require all marking and cruising to be done within the prescription.
41.3 - Sampling Methods and Sampling Intensity. Use pre-cruise analysis (ch. 30) as the first step in determining cruise methods and sampling intensity. This analysis may use data obtained from one or more of the following sources:
1. Reconnaissance Cruise. Use a reconnaissance cruise of the proposed sale area to provide reliable data for designing a cruise. Randomly locate enough sample units over the proposed sale area to support reliable estimates of coefficients of variation for the possible cruising methods.
2. Compartment Examination. Use compartment data to determine approximate volume, coefficients of variation (CV), and species composition. Ensure that proper comparisons are made; for example, the CV derived from point sampling is not reflective of the CV of individual trees.
3. Comparison Cruises. Use data from an adjacent area to estimate statistics for a proposed sale if the stands are similar in form class, tree spacing, and size variation. Comparison of non-similar stands could result in under-sampling, or over-sampling. If under-sampled, a cruise would have to be redone.
41.31 - How To Use Pre-Cruise Data. To determine the most cost-effective cruise method(s), gather enough pre-cruise information to estimate the cost of each cruise method considered. Estimates may be based on the costs of the following:
1. Pre-cruise estimate of the CV for the variable of interest of the population to be sampled for each cruise system.
2. Pre-cruise volume and area estimates by stratum.
3. Desired sampling error percent.
4. Means of stratifying the sample.
5. Number of sampling units required (such as plots, points, and trees) by stratum.
6. Establishment (plots, points) and measurement of sampling unit (plots, points, and trees).
WO AMENDMENT 2409.12-2000-2 2409.12,40EFFECTIVE 04/20/2000 Page 6 of 14
7. Acreage determination.
8. Tree marking (including paint) or other form of designation.
9. Data recording.
Use the calculations to compare the costs of different cruising methods to arrive at the method of least cost for the sale-as-a-whole and for each of the sampling strata within the sale.
41.32 - Supplemental Samples. In most sampling situations, design the cruise to sample all the species or identified populations for the sale.
1. In rare instances, a minor species or population for which no sample is selected may be recorded in the tally. Without a sample, an expanded volume for the species or population cannot be calculated.
To avoid such a situation, either combine the minor species or population with a larger species group or population or, if that approach is not feasible, make a sample tree of the first tree encountered of a minor species or population (this approach introduces a bias in the sampling but ensures the minor species or populations are included in the sale if no other valid samples are taken).
2. When the original cruise exceeds the desired sampling error and a small number of additional samples are needed to reduce the error to an acceptable level, calculate the total number of additional samples needed, locate and measure unbiased samples in the field, and add these data to the original cruise. Use this method one time only. If the error remains unacceptable, redesign and redo the entire cruise.
41.4 - Stratification of Cruises. Assess the potential benefits of stratification for reducing the overall sampling cost during the cruise design process. No single stratification method fits every situation. Stratified populations must have a valid number of samples to make the population estimates meaningful. Regional Foresters may supplement the direction in sections 41.4 through 41.46 with examples of stratification typical for the Region (sec. 04).
1. For area-based sampling, group the units by stands, timber types, site quality, or other characteristics that reflect a degree of similarity in the volume or value to be cut per acre.
2. For tree-based sampling, group the populations by tree species, size, or value.
3. Do not stratify homogeneous populations, very small jobs, or uniform cuts because this form of stratification does not improve precision and can have a small, negative effect on the confidence limit.
WO AMENDMENT 2409.12-2000-2 2409.12,40EFFECTIVE 04/20/2000 Page 7 of 14
4. Stratify heterogeneous populations to provide more precise estimates of total sale volume or value for a given sample size. Maximize the differences between groupings; minimize the differences within groupings; and ensure that each group has an adequate number of samples. Properly stratified samples improve the estimate; provide a potentially smaller number of samples that meet accuracy standards; and provide a confidence estimate for the different components of a sale, such as for high- and low-value species.
5. Do not over-stratify. Too much stratification causes increased levels of sampling to meet the accuracy standard.
6. Do not post-stratify. Stratification after the field samples are taken does not permit optimum allocation of samples by strata and it introduces bias in the estimate.
41.41 - Timber Type. Consider use of timber type as the basic stratification identifier when both of the following criteria apply:
1. More than one timber type occurs in the cutting area, and
2. The largest differences in volume and value to be cut are accounted for by the difference between the types.
41.42 - Stand. Use stands as the basic stratification identifier when both of the following criteria apply:
1. More than one stand occurs in the area to be cut, and
2. Meaningful differences in volume and value occur between the stands.
41.43 - Payment or Cutting Unit. Use units or groups of units with similar treatments as the basic stratification identifier when all of the following criteria apply:
1. The timber sale is comprised of more than one cutting or payment unit,
2. Meaningful differences in volume, value, or variable of interest occur between the units or groups, and
3. Different marking intensities or sampling methods are used in the individual units or groups of units.
41.44 - Species. Use species as the basic stratification identifier when both of the following criteria apply:
1. More than one species is to be cut, and
2. Major differences in volume, value, defect characteristics, or other variables of interest occur between the species.
WO AMENDMENT 2409.12-2000-2 2409.12,40EFFECTIVE 04/20/2000 Page 8 of 14
41.45 - Diameter. Consider diameter at breast height (DBH) class as a stratification identifier when all of the following criteria apply:
1. A large variation in diameters occurs,
2. Sample tree with complete tally (sec. 33) or 3P-sampling (sec. 36) will be used, and
3. Major differences in volume, value, and defect characteristics are accounted for by the diameter class.
When using diameter class to identify a population, do not change the estimated class of the tree if the DBH measurement is different from the estimate; the measurement of sample trees represents other trees in the class that are incorrectly estimated.
41.46 - Other Stratification Methods. Use any other method of stratification where efficiency and accuracy would be improved over the commonly used stratifications.
41.5 - Merchantability Specifications. In the cruise plan, specify:
1. Minimum tree size,
2. Product specification,
3. Tree diameter,
4. Number of product units,
5. Product length,
6. Diameter inside bark at the small end, and
7. Net scale as a percentage of gross.
Use specifications in effect for the area when completing the cruise plan.
Include utilization standards and timber designation requirements to complete the cruise plan (FSH 2409.15).
When pulpwood and substandard materials are to be cruised as part of the proposed sale, list instructions for measurement and recording of the material in the cruise plan. Use the Region’s merchantability requirements for cruising pulp logs and substandard material.
Include special instructions, such as counting or linear measurements for cruising special products, such as railroad ties, firewood, poles, posts, piling, shake bolts, and mine timbers. Length and strength are often more important for such material than the volume they contain. The cruise design must account for length, diameter limits, and allowable defect for the products specified in the cruise.

WO AMENDMENT 2409.12-2000-2 2409.12,40EFFECTIVE 04/20/2000 Page 9 of 14
41.6 - Sale Work Maps. Include work maps and photographs necessary to execute the cruise. The plats of each cutting unit or other subdivisions must contain locations of lines, plots, or strips. Use cutting unit cards or similar documentation to summarize and record field information and instructions from the interdisciplinary team that completed the environmental analysis and the responsible official (line officer) who made the decision.
41.7 - Special Instructions. Include special instructions for cruising under hazardous conditions, volume estimators, painting requirements, and cruising stands with catastrophic damage.
1. Cruising Under Hazardous Conditions. When the pre-cruise survey shows that abnormal cruising conditions are present, the cruise plan should provide appropriate safety instructions, such as:
a. Staying away from snag areas and broken, wind-damaged tree stands during windy or heavy snow-load periods.
b. Wearing nonslip footwear while cruising heavy concentrations of blown-down timber.
c. Maintaining radio contact when cruising in isolated and remote areas.
2. Volume Estimators. The cruise plan may specify the volume tables to be used on the cruise. Section 22 explains the functions of timber product volume estimators.
3. Painting Requirements. The cruise plan must include security requirements for the use of tracer paint or any special paint marker that may be used. See chapter 70 for tree marking details.
4. Cruising Stands With Catastrophic Damage. The Regional Forester shall provide instructions necessary to cruise stands that contain windthrown and broken trees from major windstorms, fire damage, insect epidemics, and flood damage.
41.8 - Quality and Value Determination. List in the cruise plan the tree and log grading guides to be used when cruising for quality and value on the proposed timber sale, especially in areas with higher-value softwood and hardwood sawtimber.
41.9 - Safety in Cruising. Hazards in cruising require all members of the crew to be safety minded at all times. Each crew leader shall have access to a copy of FSH 6709.11, Health and Safety Code Handbook, and shall provide training and information on safety practices for the cruising crew before and during cruising assignments.

WO AMENDMENT 2409.12-2000-2 2409.12,40EFFECTIVE 04/20/2000 Page 10 of 14
Following are cross-references to subjects in the Health and Safety Code Handbook, FSH 6709.11, that pertain to individuals engaged in cruising projects:
Chapters Subjects
Chapter 10 - Travel • Travel safety for the cruising assignment
Chapter 20 - Work Projects and Activities • Work in remote areas• Scaling while on training
assignment• Scaling on mill decks• Scaling in mill yards• Timber sale administration, while
training or working near logging operations
• Tree felling and bucking
Chapter 40 - Equipment and Machinery • Chopping tools and cutting tools
42 - DATA RECORDING.
42.1 - Standard Codes. Use codes in FSH 2409.14. The Regional Forester shall establish the codes for cruise items not listed in the referenced Handbook.
42.2 - Tree Tally Techniques. Select the tally method based on the method used for processing and summarizing the cruise data.
1. Use the "gate" notation ( ) or lumber tally for tallying small numbers of trees. This method counts in units of five.
2. As the standard method for large tallies, use the dot-and-dash notation ( ) , which counts in units of ten.
42.3 - Field Aids and Recording Equipment.
42.31 - Field Aids. Use the following field aids to promote accuracy and to make the work easier:
1. Species codes.
2. Tree codes.
3. Location codes.
4. Tree and log grading rules.
5. Percentage deduction tables.

WO AMENDMENT 2409.12-2000-2 2409.12,40EFFECTIVE 04/20/2000 Page 11 of 14
6. Standard upper limit diameter outside bark (DOB) by species.
7. Limiting distance tables for point-sampling.
8. Stratification guides.
42.32 - Recording Equipment. Cruisers must be equipped with an electronic data recorder or a clipboard with a receptacle for storing cards.
Pencils with firm (F) grade lead are preferable, but hard black (HB) lead is also acceptable. Other grades are unacceptable: Grades 2H, 3H, or soft grades are difficult to erase cleanly; very hard leads produce especially poor results if the recording paper is damp.
Other equipment typically includes:
1. Compass.
2. Diameter tape.
3. 100-foot metal or cloth measuring tape.
4. Packsack or vest.
5. Ribbon and tree marking paint.
6. Angle gauge.
7. Height measuring instrument.
8. Pacing stick.
9. Marking pens.
10. Tally sheets.
11. Random sample selection device.
42.4 - Forms and Electronic Data Recorders.
42.41 - Forms. Use approved formats for recording in a consistent manner. Avoid recording on notebook sheets or other non-standard sheets for subsequent transcribing to standard tally forms. Subsequent transcribing is inefficient and may result in lost records or transcription errors.
Regions shall maintain consistent and approved formats for recording cruise data (FSM 2442.04). Avoid the use of local forms. Provide standard waterproof forms where cruising must be done under damp conditions. Forms should be printed in green ink on a white background for ease of reading.

WO AMENDMENT 2409.12-2000-2 2409.12,40EFFECTIVE 04/20/2000 Page 12 of 14
42.42 - Electronic Data Recorders. Use electronic data recorders whenever possible. Regions must provide standard programs for data entry; local programs are not permitted.
42.5 - Other Recording Requirements. Cruisers must write numerals and letters legibly to avoid ambiguity when entering cruise data into a computer from source documents. Allow ample space for recording to enable instant, correct recognition by the data entry operator. Edit the data before leaving the plot or point and edit immediately after recording the data for a single tree in sample tree cruises.
42.6 - Data Security. Because timber sale valuation is based on the cruise, it is necessary that cruisers protect any collected data from inadvertent, or willful and fraudulent changes. Use any password or audit trail features available in the data collection software. Secure all completed data collection forms or data recorders in a locked environment to ensure access only by authorized personnel. Scan any paper forms and electronic data for indications of possible unauthorized changes.
43 - CRUISE REPORTING.
43.1 - Information to Report. Compute the information for the particular needs of the timber sale appropriate to the type of timber sale appraisal, prospectus, contract, and payment method. As needed, generate information such as estimates of live-cut volume and numbers of trees by species; cut volume sampling statistics; dead timber volume and trees; timber quality tabulations; unsound sapwood data; and various appraisal tables.
43.2 - Volume, Value, and Sampling Error Reporting. Cruisers may use either the National Cruise Program or the Regional computer programs established by the Regional Forester (FSM 2442.3) for calculating and reporting the results of timber cruises. Follow the procedures in chapter 30 to calculate timber cruise estimates.
Computer programs must accommodate data from all Regional cruising systems. Outputs must satisfy informational needs for preparing the appraisal, prospectus, and contract.
Provide the required volume and value estimates for developing the appraisal, prospectus, contract, and sum for the sale as a whole. Show the sampling error by timber sale component and for the sale as a whole.
Regions may supplement this section with descriptions of, and user instructions for, the selected timber cruise programs.
43.3 - Area Information. Acreage measurements, by total sale and any subdivision, should be as accurate as possible. The magnitude of the volume error is in direct proportion to the area error for area-based cruises. For example, if the error in area is 10 percent high, the volume estimate is also 10 percent high. Summarize point- sample and plot-sample data on a per acre basis, and expand by the number of acres in the tract.
WO AMENDMENT 2409.12-2000-2 2409.12,40EFFECTIVE 04/20/2000 Page 13 of 14
Where a closed traverse is used, state the error of closure. See chapter 50 for detailed information on area determination. Include a statement of the method used to determine area in the timber sale file.
43.4 - Other Information. The cruise report may also include the following elements by payment or logging units:
1. Logging method.
2. Percent slope.
3. Method of cut.
4. Sawtimber weights by DBH (diameter at breast height) classes.
5. Chippable component weights (outside of sawlog portion of stem).
6. Sell-product volumes in terms of local log rules.
7. Sell-product volumes in cubic feet for each product.
8. Cut-basal area per acre.
9. Color of marking paint.
10. Environmentally important items not previously identified.
43.5 - Certifying Cruise Information. Include a copy of the cruise inspection summary (sec. 66) in the timber sale file, and provide a certification signed by the responsible official. The accompanying cruise inspection summary must show names of cruisers and other workers, date of certification, and date of last check. See exhibit 01 for an example of a cruise certification.
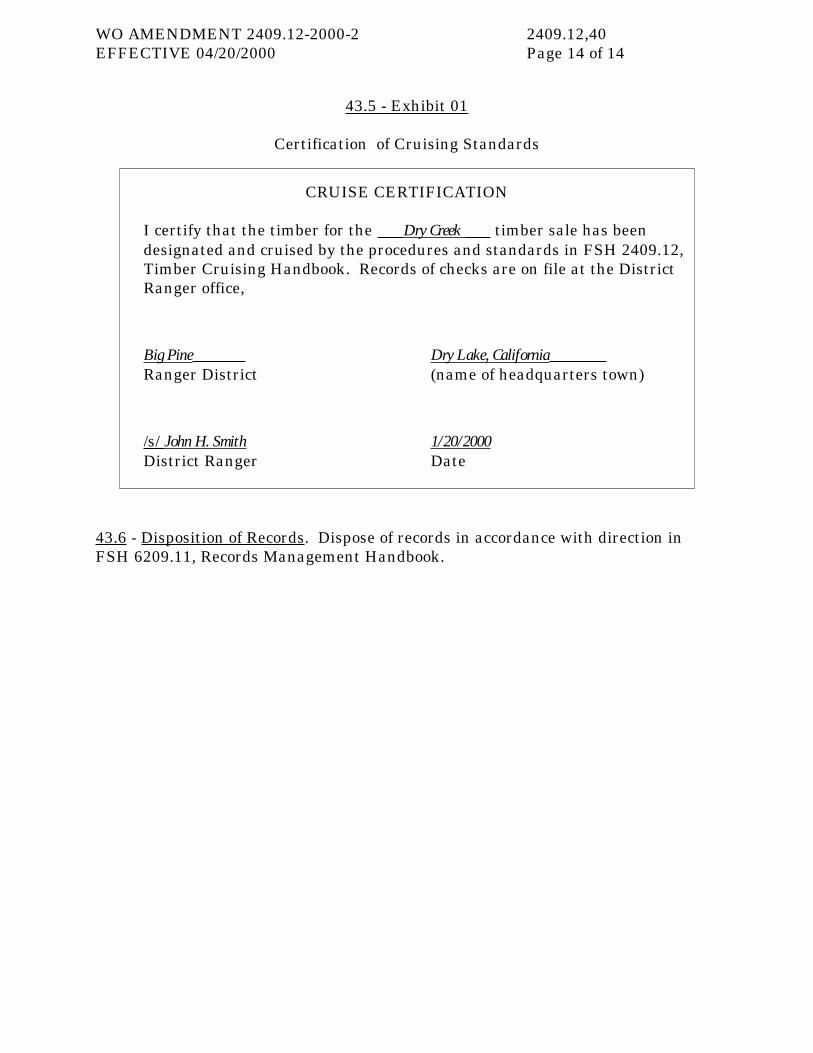
WO AMENDMENT 2409.12-2000-2 2409.12,40EFFECTIVE 04/20/2000 Page 14 of 14
43.5 - Exhibit 01
Certification of Cruising Standards
CRUISE CERTIFICATION
I certify that the timber for the Dry Creek timber sale has been designated and cruised by the procedures and standards in FSH 2409.12, Timber Cruising Handbook. Records of checks are on file at the District Ranger office,
Big Pine Dry Lake, California Ranger District (name of headquarters town)
/s/ John H. Smith 1/20/2000District Ranger Date
43.6 - Disposition of Records. Dispose of records in accordance with direction in FSH 6209.11, Records Management Handbook.
2409.12,50 ContentsPage 1 of 2
FOREST SERVICE HANDBOOKWashington, D.C.
FSH 2409.12 - TIMBER CRUISING HANDBOOK
Amendment No. 2409.12-2000-3
Effective April 20, 2000
POSTING NOTICE. Amendments are numbered consecutively by Handbook number and calendar year. Post by document name. Place the Table of Contents in front of chapter 50. Retain this transmittal as the first page of this document. The last amendment to this Handbook was Amendment 2409.12-2000-2 to FSH 2409.12,40.
Superseded NewDocument Name (Number of Pages)
2409.12,50 Contents -- 2
Digest:
2409.12,50 Contents - Revises codes and captions to agree with text changes in chapter 50 and creates the chapter table of contents as a separate document.
MIKE DOMBECKChief

WO AMENDMENT 2409.12-2000-3 2409.12,50 ContentsEFFECTIVE 04/20/2000 Page 2 of 2
FSH 2409.12 - TIMBER CRUISING HANDBOOKWO AMENDMENT 2409.12-2000-3
EFFECTIVE 04/20/2000
CHAPTER 50 - AREA DETERMINATION
Contents
51 REQUIREMENTS
52 TRAVERSE52.1 Survey52.11 Standards52.12 Procedures52.2 Global Positioning System52.21 Global Positioning System Traverse Standards
53 AERIAL PHOTOGRAPHY AND MAPPING METHODS53.1 Non-Rectified Aerial Photographs53.2 Orthophotographic Maps53.3 Topographic and Planimetric Maps53.4 Determining Area53.41 Dot Grid53.42 Mechanical Planimeter53.43 Digital and Computing Planimeters (Electronic Acreage Counters)
54 ADDITIONAL EQUIPMENT54.1 Data Recorders54.2 Laser Measuring Devices
2409.12,50Page 1 of 9
FOREST SERVICE HANDBOOKWashington, D.C.
FSH 2409.12 - TIMBER CRUISING HANDBOOK
Amendment No. 2409.12-2000-4
Effective April 20, 2000
POSTING NOTICE. Amendments are numbered consecutively by Handbook number and calendar year. Post by document name. Remove entire document and replace with this amendment. Retain this transmittal as the first page of this document. The last amendment to this Handbook was Amendment 2409.12-2000-3 to FSH 2409.12,50 Contents.
This amendment supersedes Amendment 2409.12-93-1 to chapter 50.
Superseded NewDocument Name (Number of Pages)
50 thru 54 7 --
2409.12,50 -- 9
Digest:
Makes minor editorial and grammatical corrections throughout chapter 50.
52.2 - Revises standards for global positioning systems (GPS).
MIKE DOMBECKChief
WO AMENDMENT 2409.12-2000-4 2409.12,50EFFECTIVE 04/20/2000 Page 2 of 9
FSH 2409.12 - TIMBER CRUISING HANDBOOKWO AMENDMENT 2409.12-2000-4
EFFECTIVE 04/20/2000
CHAPTER 50 - AREA DETERMINATION
51 - REQUIREMENTS. An accurate determination of sale area is required to calculate sale volume in area-dependent sampling methods. Sale area-determination is also required for the timber sale appraisal, contract preparation, reporting and monitoring, and various post-sale activities. The following steps are required:
1. Determine the area by traverse when area is a factor in calculating the volume of timber to be sold.
Regional Foresters may approve exceptions, such as orthophotographic mapping, for sales or sale units involving large cut areas where volume may be accurately estimated using a different area-determination technique.
2. Document in the sale case file all acreage specifications and calculations used; also include a map of the area.
52 - TRAVERSE. Determine area by using traditional survey techniques for measuring distances and angles or use a global positioning system (GPS).
52.1 - Survey. Use instruments that meet accuracy standards to take bearings and distances of lines enclosing the areas of interest.
52.11 - Standards. Meet the following standards for each surveyed area:
1. Do not exceed a minimum error of closure ratio of:
a. 1:50 for areas of 20 acres or less, or
b. 1:100 for areas greater than 20 acres.
2. Adjust traverse acreages for any error of closure. Carry unit acreages to the nearest tenth of an acre before rounding so the project acreage is not biased.
3. Accept a traverse not meeting error of closure standards, only if it has one or more verification traverses where the difference in acreage between the original survey and the verification survey is +10 percent. Use a different crew to run the verification traverse.
52.12 - Procedures. To begin a traverse, select a corner of the tract as a point of beginning and mark this point with a stake. Take backsights and foresights on each line and each compass station. Compute the interior angles. If bearings are properly read and recorded, the sum of all the interior angles is equal to (n-2) x 180°, where n is the number of sides in the traverse.

WO AMENDMENT 2409.12-2000-4 2409.12,50EFFECTIVE 04/20/2000 Page 3 of 9
Use computer programs and their data entry forms to close traverses and determine acreage from traverse survey data. Record foresights, backsights, and the allowable closure error necessary to produce a closed traverse. When computer programs are not available, use manual computation as a last resort. Exhibit 01 is an example of field notes.
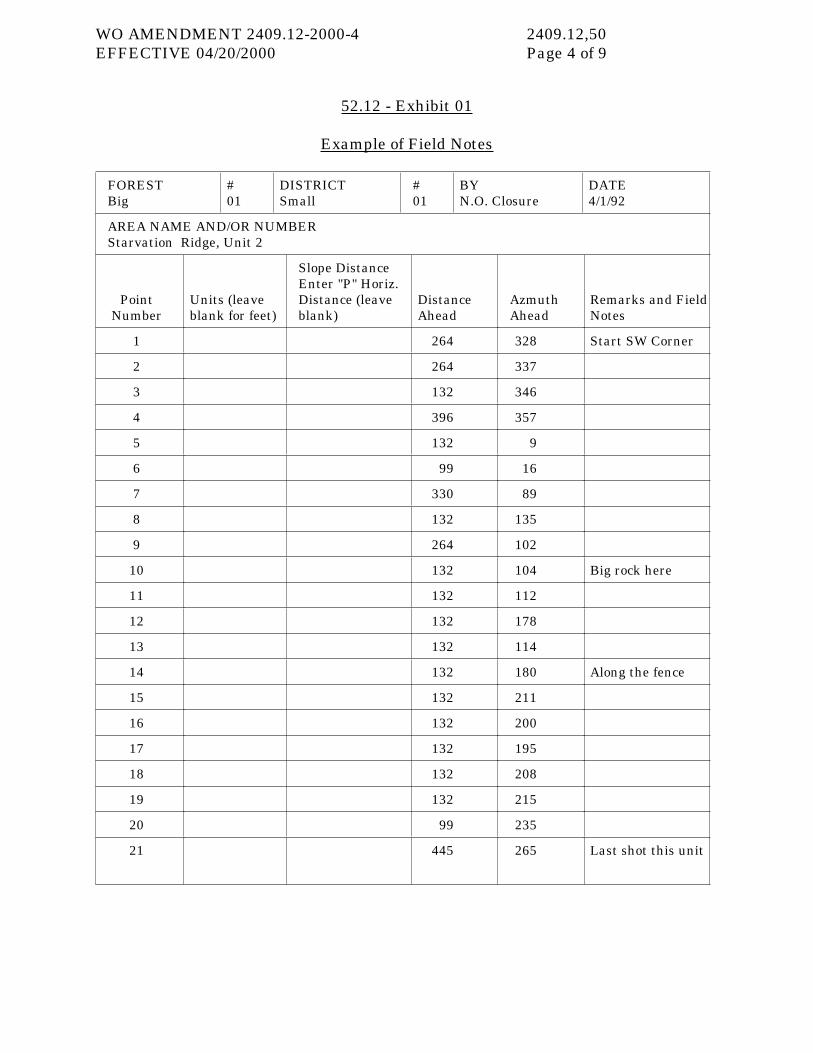
WO AMENDMENT 2409.12-2000-4 2409.12,50EFFECTIVE 04/20/2000 Page 4 of 9
52.12 - Exhibit 01
Example of Field Notes
FOREST Big
#01
DISTRICTSmall
#01
BYN.O. Closure
DATE4/1/92
AREA NAME AND/OR NUMBERStarvation Ridge, Unit 2
Point Number
Units (leave blank for feet)
Slope Distance Enter "P" Horiz. Distance (leave blank)
Distance Ahead
Azmuth Ahead
Remarks and Field Notes
1 264 328 Start SW Corner
2 264 337
3 132 346
4 396 357
5 132 9
6 99 16
7 330 89
8 132 135
9 264 102
10 132 104 Big rock here
11 132 112
12 132 178
13 132 114
14 132 180 Along the fence
15 132 211
16 132 200
17 132 195
18 132 208
19 132 215
20 99 235
21 445 265 Last shot this unit

WO AMENDMENT 2409.12-2000-4 2409.12,50EFFECTIVE 04/20/2000 Page 5 of 9
52.2 - Global Positioning System. A global positioning system (GPS) utilizes signals transmitted from satellites to determine the coordinate location (x, y, z) of points on the ground. When these points are located on the perimeter of a closed traverse, they form a polygon whose area can be calculated.
52.21 - Global Positioning System Traverse Standards. The following standards apply to GPS traverses used for area-dependent timber sale cruises, appraisals, and contracts, and for various post-sale purposes:
1. Train all crew members using the GPS equipment for timber sale preparation to gain a basic understanding before actual use in collecting field data.
2. Differentially correct all position fixes to a reference/base station that is no farther than 500 kilometers (300 miles) away. Collect position fixes by the remote GPS receiver under the following conditions:
a. Position dilution of precision (PDOP) no greater than 6.
b. Minimum satellite elevation angle of 15°.
c. Minimum signal level of 6, or the manufacturer’s recommended level for good signal quality.
d. 3-D manual mode.
3. Use the reference/base station of a third order (or better) NAD 83 datum position.
4. Collect position fixes while moving around the perimeter at a time interval that accurately defines the perimeter of the traverse. In general, use a 5-second interval for a walk file; however, if moving more rapidly, use a 1-second interval. Loss of position fixes (signal) is acceptable for a short duration while moving in a straight line; however, position fixes must be received while moving through all turning points in order to portray the true representation of the traverse.
5. Use only differentially corrected 3-D positions for area determination. Show position fixes lying one after another, in a relative sequential pattern, defining the perimeter of the traverse in a computer display or plot of the file. Allow only slight irregularities (jumping from side to side) of position fixes; if some of these are outliers and do not represent the traverse, delete them from the file. The employee who collects the data should review the computer display or large-scale plot of the data for the following:
a. Consistency of data collection; look for a smooth string of fixes.
b. Large spacing between points. Large spacing indicates loss of signal and the possibility of missing position fixes at critical turning points that define the traverse.
WO AMENDMENT 2409.12-2000-4 2409.12,50EFFECTIVE 04/20/2000 Page 6 of 9
c. Polygon shape. The polygon should resemble the traverse walked in the field.
6. Calculate area using NAD 83 datum when the data collected meet the established standards outlined in the preceding paragraphs 1 to 5.
7. Re-collect the data if the established standards are not met. Data for a portion of a traverse, such as in the case of a large traverse, may be collected at different dates and times as long as collection occurs while moving in the same direction as the original traverse.
8. Keep the following information as part of the final record:
a. The corrected data file containing the differentially corrected position fixes in NAD 83 datum.
b. A plot of the traverse at 1:24,000 scale in the current NAD 27 datum (the agency’s primary base series maps are displayed in the NAD 27 datum).
c. The date and name of the person who collected the data.
d. The name of the reference/base station used for the differential corrections.
e. The method (software) used for area calculation.
53 - AERIAL PHOTOGRAPHY AND MAPPING METHODS. Non-rectified aerial photographs (sec. 53.1), orthophotographs (sec. 53.2), and, in some cases, maps (sec. 53.3) may be used as a data source in determining the acreage of timber to be sold. Each of these methods has different characteristics that affect how and when each is used and the accuracy of results. Use these methods only with cruising systems (ch. 30) that are not dependent on area in determining the volume to be sold (for example, sample tree with complete tally (sec. 33), because they are less accurate than traversing.
53.1 - Non-Rectified Aerial Photographs. When using aerial photographs that have not been dimensionally corrected for flight anomalies (non-rectified), confine mapping for area estimate purposes to the affected area of the photograph to avoid distortion errors. Use terrain features and vegetational characteristics that are sufficiently recognizable on the photograph to permit accurate location of the area boundary. Follow up with ground measurements to verify photographic scale.
53.2 - Orthophotographic Maps. Orthophotographic maps combine the utility of aerial photographs and topographic maps on a single map sheet (although at a small scale), and can be rectified. They are free of the anomalies of scale caused by distortion and elevational differences. They also may have contour lines superimposed on the imagery, producing a three-dimensional visual effect on the flat surface, which lessens the need for stereoscopy and increases usefulness in field situations.

WO AMENDMENT 2409.12-2000-4 2409.12,50EFFECTIVE 04/20/2000 Page 7 of 9
53.3 - Topographic and Planimetric Maps. Maps may be useful in determining acreage when the area to be harvested is large and the boundaries coincide with accurately mapped physical features, such as sharp ridges, roads, or surveyed lines.However, the use of maps for accurately determining boundaries of areas entails considerable guesswork. Maps lack the advantages of aerial photographs due to the absence of imagery. The map scale is usually too small to accurately locate boundaries. Maps have limited suitability for determining the acreage of timber to be sold.
53.4 - Determining Area. Use a dot grid (sec. 53.41), mechanical planimeter (sec. 43.42), or digital or computing planimeter (sec. 53.43), to determine area when non-rectified aerial photographs or maps are used as a base.
53.41 - Dot Grid. Normally, use a dot grid to approximate areas on vertical aerial photographs and maps.
Use this technique if the terrain is mostly level and photographic scales are accurate. In regions of rough topography, however, make area measurements on maps rather than directly on photographic prints. Do not use a dot grid when the volume determination depends on area.
Create a dot grid by placing a piece of clear tracing material over a sheet of graph paper and punching pin holes at all grid intersections. Dot grid and graphical methods of area determination are based on the same principle. Dots representing squares (or rectangular areas) are counted in lieu of the squares themselves. The principal advantage of dots over graphed squares is that the ambiguity of counting fractional squares along tract boundaries is eliminated; whether the dot is in or out determines if the square is tallied.
Estimate the area by counting the number of dots falling within the boundary and multiplying by the proper conversion factor to determine the total acreage.
To correctly use a dot grid:
1. Drop the grid on the area so that it assumes a random position.
2. Take a dot count of whatever the grid orientation happens to be.
3. Count only every other dot that occurs on a boundary line of the area.
4. Take three independent counts and use the average of the three counts.
53.42 - Mechanical Planimeter. Using the mechanical planimeter is simpler and more accurate than using the dot grid method. Use a planimeter for accurately measuring areas of any form. Read the area directly from the measuring wheel and dial by moving the tracer pin or lens around the periphery of the figure.
Mechanical planimeters come with fixed or adjustable arms.

WO AMENDMENT 2409.12-2000-4 2409.12,50EFFECTIVE 04/20/2000 Page 8 of 9
1. Planimeters with fixed arms require no setting adjustment, are easy to operate, and measure areas with accuracy and speed. Although they measure areas only in square inches or square centimeters, they may be used on drawings or maps to any scale. They measure the area in the desired unit (square feet, acres, and so on) by multiplying the result by a factor.
2. Planimeters with adjustable arms offer direct readings of various parameters for a larger variety of ratios than the fixed arm instrument.
To operate the planimeter, move the pointer of the instrument in a clockwise direction around the boundaries of the figure being traced. Trace the perimeter two or three times and use an average reading. Convert the average to the desired units on the basis of the map scale.
53.43 - Digital and Computing Planimeters (Electronic Acreage Counters). This equipment determines acreage and has a digital display and paper printout of area and distance measurements.
1. Digital planimeters have the elements of mechanical planimeters but include electrical features with the following benefits:
a. Greater accuracy by reducing mistakes that are common with conventional equipment.
b. Time savings from the instant readout display and cumulative measuring feature.
2. Computing planimeters provide all the benefits of the digital planimeters and include features such as:
a. Instant digital readout and printouts of automatically computed results.
b. Label printouts for identification.
c. Full processing of results through the calculator without loss of the measuring constant.
d. Conversion of results into other length units.
e. Cumulated and stored results for later processing.
54 - ADDITIONAL EQUIPMENT. Utilize additional equipment as it becomes available and affordable, such as data recorders (sec. 54.1) and laser measuring devices (sec. 54.2).
54.1 - Data Recorders. Some data recorders may have software to record distance and bearings, and they can compute the area immediately in the field or later in the office.

WO AMENDMENT 2409.12-2000-4 2409.12,50EFFECTIVE 04/20/2000 Page 9 of 9
54.2 - Laser Measuring Devices. Laser measuring devices with integral compasses are useful for traverse surveys because they are fast and accurate. Laser technology is best used in conjunction with a global positioning system (GPS) (sec. 52.2), by using GPS to locate one point and using the laser traverse to determine the area. To do this, locate the first survey point or other identifiable boundary point on the survey with GPS; then locate the traversed area on the base map using the GPS coordinates.

2409.12,60 ContentsPage 1 of 2
FOREST SERVICE HANDBOOKWashington, D.C.
FSH 2409.12 - TIMBER CRUISING HANDBOOK
Amendment No. 2409.12-2000-5
Effective April 20, 2000
POSTING NOTICE. Amendments are numbered consecutively by Handbook number and calendar year. Post by document name. Place the Table of Contents in front of chapter 60. Retain this transmittal as the first page of this document. The last amendment to this Handbook was Amendment 2409.12-2000-4 to FSH 2409.12,50.
Superseded NewDocument Name (Number of Pages)
2409.12,60 Contents -- 2
Digest:
2409.12,60 Contents - Revises codes and captions to agree with text changes in chapter 60 and creates the chapter table of contents as a separate document.
MIKE DOMBECKChief

WO AMENDMENT 2409.12-2000-5 2409.12,60 ContentsEFFECTIVE 04/20/2000 Page 2 of 2
FSH 2409.12 - TIMBER CRUISING HANDBOOKWO AMENDMENT 2409.12-2000-5
EFFECTIVE 04/20/2000
CHAPTER 60 - QUALITY CONTROL
Contents
60.2 Objective60.4 Responsibility
61 CRUISER TRAINING AND CERTIFICATION STANDARDS61.1 Qualified Cruiser61.2 Advanced Cruiser61.3 Check Cruiser61.4 Master Cruiser61.5 Maintenance of Certification
62 INSPECTING INDIVIDUAL CRUISER PERFORMANCE62.1 Qualified Cruiser62.2 Advanced Cruiser62.3 Check Cruiser62.4 Cruiser Inspection Frequency
63 INSPECTING SALES63.1 Inspection Elements63.11 Check Cruise Field Measurement Inspection63.12 Other Elements63.2 Sale Inspection Frequency63.3 Certification of Sale
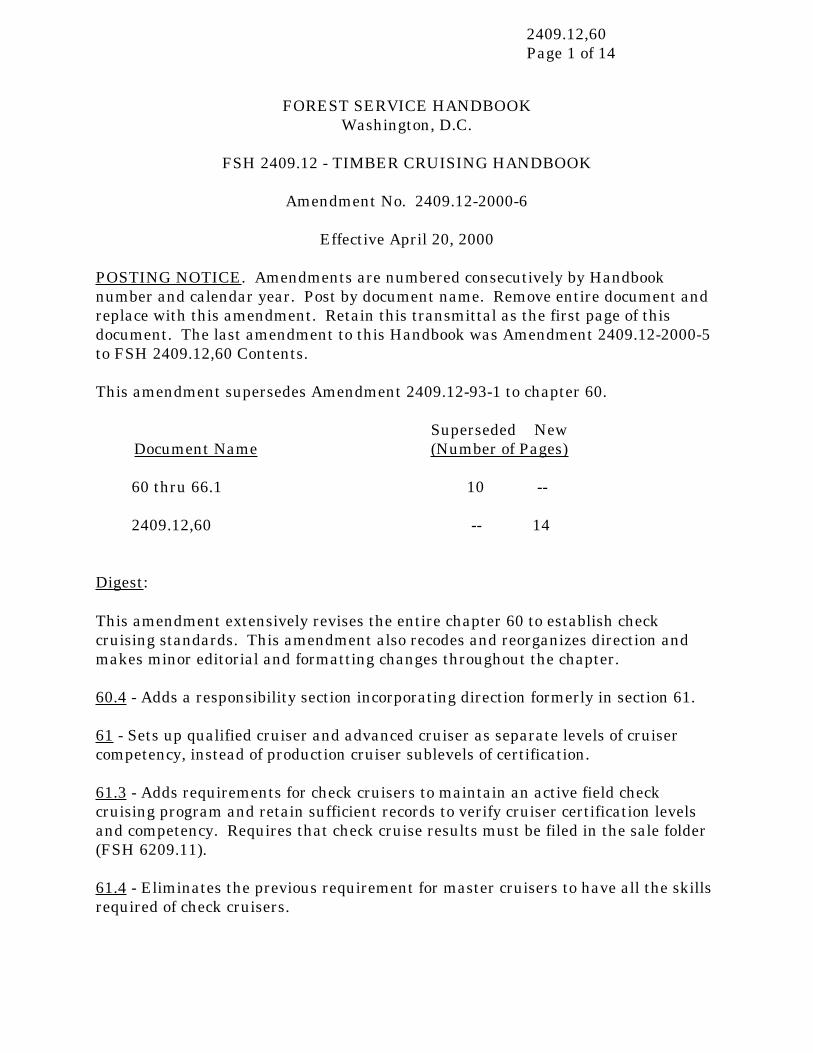
2409.12,60Page 1 of 14
FOREST SERVICE HANDBOOKWashington, D.C.
FSH 2409.12 - TIMBER CRUISING HANDBOOK
Amendment No. 2409.12-2000-6
Effective April 20, 2000
POSTING NOTICE. Amendments are numbered consecutively by Handbook number and calendar year. Post by document name. Remove entire document and replace with this amendment. Retain this transmittal as the first page of this document. The last amendment to this Handbook was Amendment 2409.12-2000-5 to FSH 2409.12,60 Contents.
This amendment supersedes Amendment 2409.12-93-1 to chapter 60.
Superseded NewDocument Name (Number of Pages)
60 thru 66.1 10 --
2409.12,60 -- 14
Digest:
This amendment extensively revises the entire chapter 60 to establish check cruising standards. This amendment also recodes and reorganizes direction and makes minor editorial and formatting changes throughout the chapter.
60.4 - Adds a responsibility section incorporating direction formerly in section 61.
61 - Sets up qualified cruiser and advanced cruiser as separate levels of cruiser competency, instead of production cruiser sublevels of certification.
61.3 - Adds requirements for check cruisers to maintain an active field check cruising program and retain sufficient records to verify cruiser certification levels and competency. Requires that check cruise results must be filed in the sale folder (FSH 6209.11).
61.4 - Eliminates the previous requirement for master cruisers to have all the skills required of check cruisers.

WO AMENDMENT 2409.12-2000-6 2409.12,60EFFECTIVE 04/20/2000 Page 2 of 14
Digest--Continued:
61.5 - Provides for check cruiser and master cruiser certification as indefinite, provided there is evidence that the cruiser’s performance continues at a satisfactory level. (1) For all levels of cruisers, sets minimum requirements for refresher training before a cruiser may resume cruising, if inactive for a period of more than one year, and (2) Continuing education requirements. Loss of check cruiser certification may occur based on unsatisfactory performance.
62 - Sets out evaluation and documentation requirements for inspections, as well as actions necessary in the event of unsatisfactory work.
62.1 - Requires the use of a field measurement evaluation for qualified cruisers and sets out a sample evaluation format in exhibit 01.
62.2 - Eliminates the previous requirement for inspections of an advanced cruiser to be performed by a certified check or master cruiser. Provides an exhibit of a checklist of elements to be used by an advanced cruiser in designing cruises, in addition to the scorecard required for qualified cruisers.
62.3 - Adds requirements for inspection of check cruisers.
62.4 - Sets the minimum frequency for cruiser inspections.
63 - Requires sale inspections to evaluate cruising procedures and sales volume determinations, and provides a sample check sheet and evaluation report format.
MIKE DOMBECKChief

WO AMENDMENT 2409.12-2000-6 2409.12,60EFFECTIVE 04/20/2000 Page 3 of 14
FSH 2409.12 - TIMBER CRUISING HANDBOOKWO AMENDMENT 2409.12-2000-6
EFFECTIVE 04/20/2000
CHAPTER 60 - QUALITY CONTROL
60.2 - Objective. To ensure accurate, objective, and uniform measurement and estimates of product volume and value of National Forest System timber through quality control that includes:
1. Cruiser training and certification.
2. Inspection of cruiser performance.
3. Inspection of timber sale cruises.
60.4 - Responsibility. (FSM 2442.04). Cruise assistants may be used to help in the collection of cruise data. Assistants must complete appropriate training and must be capable of operating necessary measurement equipment. They must be personally supervised on-site by a certified cruiser when collecting data. The certified cruiser in charge remains accountable for the accuracy of work done by assistants.
The Forest Supervisor certifies qualified, advanced, and check cruisers (FSM 2442.04b).
61 - CRUISER TRAINING AND CERTIFICATION STANDARDS. This section specifies the minimum levels of experience, technical knowledge, and field ability a cruiser must have to be certified. The Regional Forester has overall responsibility for the quality control program for cruising in the Region (FSM 2442.04a).
Minimum national standards provide for four levels of cruiser competency: qualified cruiser (sec. 61.1), advanced cruiser (sec. 61.2), check cruiser (sec. 61.3), and master cruiser (sec. 61.4). Standards and requirements for each of the certification levels are specified in the following sections 61.1 to 61.4.
61.1 - Qualified Cruiser. A qualified cruiser is responsible for applying a variety of volume determination techniques. Working alone, as a crew member, or as a crew leader, a qualified cruiser must ensure all necessary field work is completed in compliance with cruise plan instructions. This includes, but is not limited to, preparation of data for computer compilation.
WO AMENDMENT 2409.12-2000-6 2409.12,60EFFECTIVE 04/20/2000 Page 4 of 14
The knowledge and training requirements for qualified cruiser certification are:
1. Proficiency in timber cruising fundamentals, including as a minimum:
a. Tree measurement (diameters and heights).
b. Species identification.
c. Defect recognition and determination.
d. Quality determination.
e. Use of timber cruising tools.
f. Map reading and compass use.
g. Traverses.
h. Elementary use of aerial photography.
2. A working knowledge of the cruise systems (ch. 30) expected to be used.
3. Demonstrated ability to interpret and follow the timber cruise plan and cruise data recording instructions.
4. Passing scores on both a Regionally approved written test and a Regionally approved field test conducted on prepared certification test areas. Topics tested shall include species, measurements, defects, and grading information representative of what the cruiser normally encounters.
61.2 - Advanced Cruiser. An advanced cruiser is fully qualified to perform measurements, train prospective cruisers, conduct all types of timber cruises, and design and implement cruises. Experience, technical interest, training ability, and initiative characterize this classification.
The knowledge and training requirements for advanced cruiser certification are:
1. Documented experience as a qualified cruiser.
2. Training in cruise design, sampling theory, sale preparation, data collection, and cruise processing.
3. Passing score on a Regionally approved written examination. Topics tested shall include elementary statistics, sampling design, and impacts of biased and/or imprecise data on the measurements.
61.3 - Check Cruiser. A check cruiser is responsible for check cruising, cruiser training, and conducting evaluations to recommend certification of qualified and advanced cruisers. The check cruiser must maintain an active field check cruising program and retain records sufficient to verify cruiser certification levels and

WO AMENDMENT 2409.12-2000-6 2409.12,60EFFECTIVE 04/20/2000 Page 5 of 14
competency; check cruise results must be filed in the sale folder (FSH 6209.11). Check cruisers inspect timber sale cruises and recommend acceptance or identify necessary corrective actions. In addition, with the assistance of a master cruiser, the check cruiser establishes Forest certification test areas as needed.
The knowledge and training requirements for a check cruiser are:
1. Must be currently certified as an advanced cruiser and have at least two years of experience as an advanced cruiser.
2. Must be thoroughly familiar with all aspects of timber cruising, including cruise design, sampling theory and systems, statistical analysis, log and tree grading, defects, and use of cruising tools.
3. Must demonstrate training and leadership ability and be capable of setting up continuing training, certification testing, and check cruising programs.
61.4 - Master Cruiser. The level of master cruiser is certified by the Regional Forester. The master cruiser serves as the Regional representative for cruising and coordinates the Regional quality control program. This assigned responsibility is based on demonstrated ability in all aspects of cruising and varying timber sale situations common to the Region.
61.5 - Maintenance of Certification. Certification of all levels of cruisers is indefinite, provided there is evidence (sec. 62) that the cruiser’s performance continues at a satisfactory level.
1. If the cruiser has been inactive for a period of more than one year, refresher training is required prior to resuming cruising. This should include, as a minimum, a session in fundamentals, together with field measurement of a sufficient number of plots and trees to update skills.
2. All levels of cruisers, whether inactive or active, must attend formal training or workshops intended to update their skills at least once every four years to maintain knowledge appropriate to the level of certification.
3. Check cruisers may recommend loss of a cruiser’s certification to the certifying official based on unsatisfactory performance.
62 - INSPECTING INDIVIDUAL CRUISER PERFORMANCE. Inspection of the cruiser’s performance includes all components of the timber cruise relevant to the level of certification. Cruiser performance is evaluated from office checks and field measurement checks of the sale. Evaluate and document physical measurements on a timely and continuing basis as each sale check is made; results shall also be reviewed on an annual basis. In the event of unsatisfactory work, take immediate corrective action such as retraining. Continued unsatisfactory performance shall result in loss of certification. Check cruisers shall maintain a historical record of office and field measurement checks identified by each cruiser.

WO AMENDMENT 2409.12-2000-6 2409.12,60EFFECTIVE 04/20/2000 Page 6 of 14
62.1 - Qualified Cruiser. The performance check of a qualified cruiser’s work must:
1. Assess compliance with the cruise plan instructions.
2. Validate the field work by conducting a check cruise that includes:
a. Accuracy of tree measurements and species identification.
b. Accuracy and lack of bias in sample selection.
c. Defect estimates.
b. Tree and log grading (quality or product identification).
e. Area determination measurements.
f. Tree counts for plots on area-based samples.
g. Quality of timber designation.
h. Sample (tree/plot/point) identification.
i. Locally required items.
3. Assess data recording for legibility and accuracy, including timber measurement and area-determination data.
4. Review the care and use of cruising tools.
5. Verify use of appropriate volume and product estimators.
6. Assess knowledge and correct use of marking paint and paint security measures.
7. Use a scorecard for evaluating individual performance on field measurements. The Regional Foresters shall establish:
a. The items to be checked;
b. Tolerances;
c. Error weights; and
d. Acceptable scores with format similar to that shown in exhibit 01.
Assess the cruiser’s measurements and judgments by comparative analysis of check cruise data versus original data.
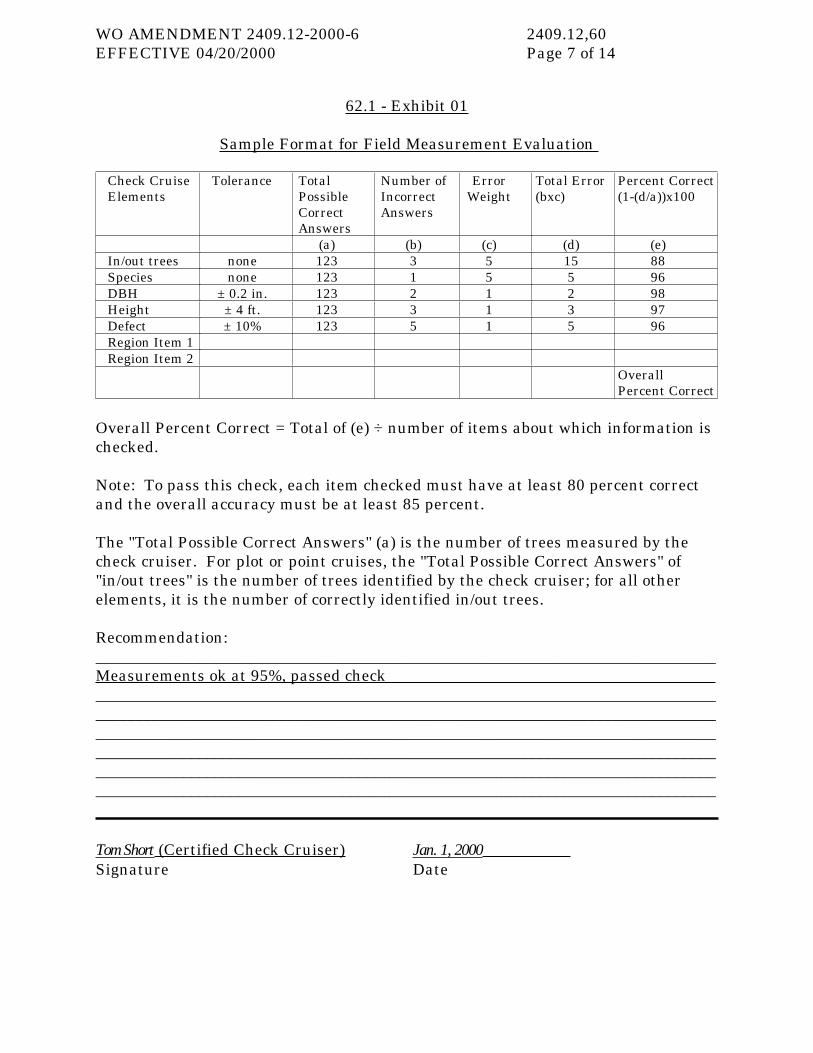
WO AMENDMENT 2409.12-2000-6 2409.12,60EFFECTIVE 04/20/2000 Page 7 of 14
62.1 - Exhibit 01
Sample Format for Field Measurement Evaluation
Check Cruise Elements
Tolerance Total Possible Correct Answers
Number of Incorrect Answers
Error Weight
Total Error (bxc)
Percent Correct (1-(d/a))x100
(a) (b) (c) (d) (e)In/out trees none 123 3 5 15 88Species none 123 1 5 5 96DBH ± 0.2 in. 123 2 1 2 98Height ± 4 ft. 123 3 1 3 97Defect ± 10% 123 5 1 5 96Region Item 1Region Item 2
OverallPercent Correct
Overall Percent Correct = Total of (e) ÷ number of items about which information is checked.
Note: To pass this check, each item checked must have at least 80 percent correct and the overall accuracy must be at least 85 percent.
The "Total Possible Correct Answers" (a) is the number of trees measured by the check cruiser. For plot or point cruises, the "Total Possible Correct Answers" of "in/out trees" is the number of trees identified by the check cruiser; for all other elements, it is the number of correctly identified in/out trees.
Recommendation: ______________________________________________________________________________Measurements ok at 95%, passed check__ ____________________________________________________________________________________________________________________________________________________________________________________________________________________________________________________________________________________________________________________________________________________________________________________________________________________________________________________________________________________
Tom Short (Certified Check Cruiser) Jan. 1, 2000 Signature Date
WO AMENDMENT 2409.12-2000-6 2409.12,60EFFECTIVE 04/20/2000 Page 8 of 14
62.2 - Advanced Cruiser. When an advanced cruiser is designing cruises, check the cruise design and other applicable elements from section 63.1, exhibit 01. For production cruising, check the field cruising procedures as listed under qualified cruiser (sec. 62.1).
62.3 - Check Cruiser. Each check cruiser shall be periodically reviewed by an authorized official at a higher administrative level. Evaluate the check cruiser on the basis of the following items:
1. Maintenance of training records for qualified and advanced cruisers.
2. Maintenance of cruiser roster and individual performance checks.
3. Comprehensive sale inspections.
4. All inspection items listed for the performance check of the advanced cruiser if the check cruiser is also designing sales or production cruising.
Check cruisers need not be checked on a fixed schedule unless they are working as qualified cruisers. If this is the case, check cruises should be performed by a check cruiser from another administrative unit.
62.4 - Cruiser Inspection Frequency. Review qualified or advanced cruiser records for the past year to ensure the following minimum of work checked: 5 plots for plot-based cruises, 25 trees for tree-based cruises, or an equivalent combination of trees and plots for a combination of cruising methods. These annual minimums should be used when checking measurement technique and sample application for an individual, and they constitute a qualified check cruise. The minimum number of plots or trees need not be from a single sale, but can be from several sales. When the minimum has not been checked, either schedule the individual for a check, or consider the cruiser as inactive. Inactive cruisers must demonstrate proficiency prior to resuming production cruising.
63 - INSPECTING SALES. Conduct sale inspections to evaluate cruising procedures and sale volume determination. Sale inspections also serve to monitor cruiser performance. Indicate when results of a sale inspection are unsatisfactory and recommend corrective action needed to make the cruise acceptable. Inspections shall not be used to adjust sale volumes, but to indicate potential problems that need further investigation. Problems identified in the check cruise must be addressed and the resolution documented in the sale folder.
Regional Foresters shall establish the methods and standards for what constitutes an acceptable or satisfactory evaluation.

WO AMENDMENT 2409.12-2000-6 2409.12,60EFFECTIVE 04/20/2000 Page 9 of 14
63.1 - Inspection Elements. Cruises should be systematically reviewed for completeness. Exhibit 01 includes a list of office and field components that should be examined as appropriate; the list also includes cross-references to the sections or chapters in this Handbook and other Handbooks containing related direction. Use this list to develop a unit checklist similar to the sample shown in exhibit 02 that can be initialed, dated, and filed in the sale folder after the inspection has been completed.

WO AMENDMENT 2409.12-2000-6 2409.12,60EFFECTIVE 04/20/2000 Page 10 of 14
63.1 - Exhibit 01
Timber Sale Preparation and Check-Cruise Elements
Element (Cross-References Are to FSH 2409.12 or Other Directives)
A. CRUISE DESIGN PLAN1. Harvest Guidelines
a. Stand Marking Guide (sec. 41)b. Minimum Product Merchantability Specifications (sec. 41)
2. Sample Method Analysisa. Population Stratification Identification (sec. 31.5, 41.4)b. Precruise Documentation (sec. 41.31)c. Sampling Intensity and Allocation Documentation (sec. 33.2, 34.3, 35.3, 36.3)d. Sample Error Standards (sec. 41.1)
3. Sampling Controlsa. Sample Tree/Plot Distribution and Location (sec. 33.11, 34.21, 35.21)b. Plot Monumentation (sec. 34.21, 35.21 )c. Cruise Trees Numbered (sec. 33.11, 34.21, 35.21 )d. Supplemental Samples (sec. 41.32)e. Limiting Distance/Mirage Method (Plot Edge Effect) (sec. 35.22)f. 3P KPI Estimates and Random Number List (sec. 36.2)
B. TREE VOLUME DETERMINATION1. Volume Estimators (sec. 22)2. Form Class (sec. 14.3)3. Visible Defect Deduction Instructions (sec. 22.3, 22.31a-d)4. Hidden Defect and Breakage Instructions (sec. 22.31e)5. Tree Height Instructions (sec. 14.2)6. Special Measurement Techniques (ch. 10)
C. TIMBER DESIGNATION AND PRODUCT ACCOUNTABILITY1. Unit Boundary Instructions/Applications (sec. 71.22, 71.4)2. Tree Designation Instructions/Applications (sec. 71.3, 72.2)3. Tracer Paint Testing and Security (sec. 72.11, 72.12, 72.6)
D. TREE VALUE DETERMINATION1. Approved Log/Tree Grade Instructions
E. AREA DETERMINATION1. Traverse Notes Security (sec. 50)2. Traverse Maps Available (sec. 50)3. Area Determination Standards (sec. 50)4. First Station Marked with Stake (sec. 52.12)

WO AMENDMENT 2409.12-2000-6 2409.12,60EFFECTIVE 04/20/2000 Page 11 of 14
63.1 - Exhibit 01--Continued
F. FINAL CRUISE PRINTOUT AUDIT1. Sample Error Standards Met (sec. 41.1)2. Validation of Cruise Data and Reports (sec. 65, 66)
G. SALE AREA MAP1. Unit and Road Locations (FSH 2409.18, sec. 53.24, 54.2)2. Unit Designation (CC, ITM, LTM) (Timber Sale Contract Provision B&C Sale Area Map)
H. SAFETY CONSIDERATIONS1. Tailgate Safety Meetings Prior to Cruising (FSH 6709.11, Health and Safety Code Handbook, sec. 04.2, 05, and 22.4)2. Local Safety Issues (for example, paint safety films)
I. CRUISED BY CERTIFIED CRUISERS (FSM 2442.03)
J. TIMBER SALE MEASUREMENTS EVALUATION (sec. 41.1)
K. JUSTIFICATION DOCUMENTATION FOR NOT SELLING TREE MEASUREMENT TIMBER SALES (TMS)
L. CERTIFICATION OF CRUISE STANDARDS DOCUMENTED AND SIGNED (sec. 43.5)
M. DOCUMENTATION OF CRUISE PLAN CHANGES

WO AMENDMENT 2409.12-2000-6 2409.12,60EFFECTIVE 04/20/2000 Page 12 of 14
63.1 - Exhibit 02
Timber Sale Evaluation Report
TIMBER SALE CRUISE EVALUATION REPORT - PAGE 1FOREST: My Forest CHECK CRUISER: JoeDISTRICT: My District DATE INSPECTED: Jan. 1, 2000SALE NAME: My Sale CRUISE METHOD(S): Sample TreeTYPE OF SALE: SCALE | | TMS |x| DATE CRUISED: Nov. 5, 1999SALE PREPARATION ELEMENTS OFFICE-FIELD O F SATIS UNSAT NAA. CRUISE DESIGN PLAN
1. Harvest Guidelines a. Stand marking guide X b. Minimum product merchantability specifications X
2. Sample Method Analysis a. Population stratification identification X b. Precruise sample documentation X b. Precruise sample documentation X c. Sampling intensity and allocation documentation X d. Cost analysis of cruise methods X e. Sample error standards X
3. Sample Controls a. Sample tree/plot distribution and location X b. Plot monumentation X c. Cruise trees numbered X d. Supplemental samples X e. Plot/point edge effect (Mirage Method) X f. Guide for KPI estimates XB. TREE VOLUME DETERMINATION
1. Volume Estimators X2. Form Class X3. Visible Defect Deduction Instructions X4. Hidden Defect and Breakage Instructions X5. Tree Height Instructions X6. Special Measurement Techniques X
C. TIMBER DESIGNATION AND PRODUCT ACCOUNTABILITY1. Unit Boundary X2. Quality of Tree Designation X3. Tracer Paint Analysis X4. Documentation for Sale Modifications X
D. TREE VALUE DETERMINATION1. Approved Log/Tree Grade Instructions X
E. AREA DETERMINATION1. Traverse Notes Available/Secure X2. Traverse Maps Available X3. Error of Closure (N/A for GPS) X4. First Station Marked with Stake X5. Traverse Boundary follows Posted Unit Boundary X
F. FINAL CRUISE PRINTOUT AUDIT1. Data Recorded Accurately X2. Sample Error Standards met X3. Validate Volume Reports X4. Validate Species X

WO AMENDMENT 2409.12-2000-6 2409.12,60EFFECTIVE 04/20/2000 Page 13 of 14
63.1 - Exhibit 02--Continued
TIMBER SALE CRUISE EVALUATION REPORT - PAGE 2SALE PREPARATION ELEMENTS OFFICE-FIELD O F SATIS UNSAT NAG. SALE AREA MAP
1. Unit Locations X2. Road Locations X3. Unit designation (CC, ITM, LTM) X
H. SAFETY CONSIDERATIONS1. Local Safety Issues (for example, Paint Safety Films) X2. Tailgate Safety Meeting Prior to Cruising X
I. CRUISED BY CERTIFIED CRUISERS XJ. TIMBER SALE CHECK CRUISE
1. Met Gross Volume Standards X2. Met Net Volume Standards X3. Met Value Standards X4. Met Field Measurement Evaluation Standards X
K. CERTIFICATION OF CRUISE STANDARDS DOCUMENTED AND SIGNED
X
L. DOCUMENTATION OF CRUISE PLAN CHANGES/ACCOMPLISHMENTS
X
Following are: comments on the performance or unsatisfactory work under the above cruise plan elements. Make reference in Item No. below for the element listed above.
Item No. Description

WO AMENDMENT 2409.12-2000-6 2409.12,60EFFECTIVE 04/20/2000 Page 14 of 14
63.11 - Check Cruise Field Measurement Inspection. Measurement checks should be designed to obtain a representative sample of the original number of sample units and not to concentrate on individual cruisers. The sample should be dispersed throughout the cutting units in the sale area to determine if all significant variables, including measurement problems, species, larger trees, or defect, have been identified. Consider the amount of time required to conduct a check cruise, and vary requirements depending on the sampling system being used, the number of cruisers, and the complexity of the particular sale being checked.
On a sale check, 25 to 150 trees may need to be checked, depending on the number of cruise methods used and other factors. Take a reasonable, quantitative sample of all conditions.
Compare the measurements and results against the original cruise data to determine accuracy.
If fundamental errors are noted on an individual cruiser’s measurements during a sale check, such as incorrect species identification or missing trees on plots, all of the individual’s work on the sale may need to be examined.
63.12 - Other Elements. When data are being entered from handwritten cruise cards, make a 10 percent minimum spot comparison between the computer output and the information on the cards. If errors are found, perform a 100 percent audit.
Check the management of data recorded by the cruiser. The cruiser should follow a system designed to prevent loss of recorded data; for example, each day’s data should be stored in the timber sale file. Electronic field data recorder files should be deleted only after the data manager has ensured that all data have been successfully transferred to the personal computer.
63.2 - Sale Inspection Frequency. As a minimum, conduct sale cruise inspections at the following target frequencies. Perform office checks on all sales. Office checks ensure that the cruise was performed according to direction in this Handbook. Perform field measurement checks with the following frequencies and use a random draw to determine each sale in the sample to be checked:
Sale Size Scaled Sales Tree Measurement Sales
> $10,000 and ≤ 2000 CCF ≥ 2000 CCF
Not applicable1:4 (25 %)
1:10 (10 %)1:1 (100 %)
63.3 - Certification of Sale. Each sale cruise must be certified by the District Ranger or Forest Supervisor (see the sample certification in sec. 43.5). Do not advertise a timber sale for bid if the cruise inspection indicates that the timber sale does not meet sampling error standards (sec. 41.1).
2409.12,70 ContentsPage 1 of 2
FOREST SERVICE HANDBOOKWASHINGTON
FSH 2409.12 - TIMBER CRUISING HANDBOOK
Amendment No. 2409.12-96-1
Effective September 18, 1996
POSTING NOTICE. Amendments are numbered consecutively by Handbook number and calendar year. Post by document name. Place the Table of Contents in front of chapter 70. Retain this transmittal as the first page of this document. The last amendment to this Handbook was Amendment 2409.12-93-1 to FSH 2409.12.
Superseded NewDocument Name (Number of Pages)
2409.12,70 Contents - 2
Digest:
70 Contents - Revises codes and captions to agree with text changes in chapter 70.
JACK WARD THOMASChief

WO AMENDMENT 2409.12-96-1 2409.12,70 ContentsEFFECTIVE 9/18/96 Page 2 of 2
FSH 2409.12 - TIMBER CRUISING HANDBOOKWO AMENDMENT 2409.12-96-1
EFFECTIVE 9/18/96
CHAPTER 70 - DESIGNATING TIMBER FOR CUTTING
Contents
71 TIMBER MARKING71.1 Marking Timber in Advance of Sale71.2 Marking Guides71.21 Marking With Paint71.22 Marking Boundaries71.3 Checking Timber Marking Quality71.4 Designating Without Marking Individual Trees71.5 Protecting Special Trees71.51 Witness Trees71.52 Wildlife and Other Trees
72 TRESPASS PREVENTION72.1 Tracers72.11 Paint Testing72.12 Tracer Paint Security72.13 Paint Purchase72.14 Paint Use72.2 Stump Marks
2409.12,70Page 1 of 8
FOREST SERVICE HANDBOOKWASHINGTON
FSH 2409.12 - TIMBER CRUISING HANDBOOK
Amendment No. 2409.12-96-2
Effective September 18, 1996
POSTING NOTICE. Amendments are numbered consecutively by Handbook number and calendar year. Post by document name. Remove entire document and replace with this amendment. Retain this transmittal as the first page of this document. The last amendment to this Handbook was Amendment 2409.15-96-1 to FSH 2409.12,70 Contents.
Superseded NewDocument Name (Number of Pages)
70 thru 72.2 4 -
2409.12,70 - 8
Digest:
72.12 - Changes caption. Revises standards for providing security of tracer paint. Establishes responsibility for District Ranger to designate a property custodian and accountable property officer for tracer paint. Establishes auditing and reporting requirements for inventory and use of tracer paint.
72.13 - Adds new caption and provides guidelines for purchase of tracer paint. Changes contact for assistance from Missoula to San Dimas Technology and Development Center.
72.14 - Adds new caption and provides guidelines for use of tracer paint.
JACK WARD THOMASChief

WO AMENDMENT 2409.12-96-2 2409.12,70EFFECTIVE 9/18/96 Page 2 of 8
FSH 2409.12 - TIMBER CRUISING HANDBOOKWO AMENDMENT 2409.12-96-2
EFFECTIVE 9/18/96
CHAPTER 70 - DESIGNATING TIMBER FOR CUTTING
71 - TIMBER MARKING. Designate timber for cutting only within the sale area boundary unless the contract also includes timber outside the boundary to be cur in clearing for roads or other improvements.
Use only tree marking paint containing registered tracers(s) in designating any National Forest tree for removal, measurement, tallying, scaling, and so forth, and in designating the area where these activities will take place.
Regions shall provide guides to achieve quality standards for designating timber, including control methods and measures (FSM 2441).
71.1 - Marking Timber in Advance of Sale. Mark or designate all timber to be cut prior to sale. This permits the prospective bidder to determine the volume and quality of the offered timber. Long-term sales, salvage sales, or cutting to control active insect infestations may necessitate exceptions.
Complete the marking of unit planned for cutting within a rate redetermination period, before establishing rates.
71.2 - Marking Guides. Ensure that written guides have been prepared which will achieve the silvicultural objectives (FSM 2441.03). If established marking guides are not available, develop detailed guides for marking units. These guides shall include:
1. Desired residual stocking
2. Selection criteria for cut and leave trees.
3. Boundaries.
4. Special trees.
5. Paint colors to use for each purpose.
71.21 - Marking With Paint. The primary methods for designating timber to be cut include marking with paint containing registered tracer(s) the trees to be cut or to be left, and marking the boundaries around the area in which the cutting will take place.
Know the planned timber sale contract requirement and the marking plan. Mark or designate timber for cutting in accordance with the plan. Use a paint mark at or

WO AMENDMENT 2409.12-96-2 2409.12,70EFFECTIVE 9/18/96 Page 3 of 8
above eye level and another below stump height for each cut tree, leave tree, or boundary tree to be marked.
71.22 - Marking Boundaries. Use paper or plastic signs, as needed, to identify the cutting units. payment units, and sale area boundaries in addition to painted or other boundary identifications. Boundaries may be unmarked if natural or man-made features are so conspicuous that they can be identified from the sale area map alone and if doing so would not cause mistakes to be made when the trees are cut.
71.3 - Checking Timber Marking Quality. Individuals designated to ensure the quality of timber marking must inspect timber marking activities to ensure compliance with written marking guides. File written documentation that relates marking crew compliance with marking guides in each timber sale case folder.
Determine compliance with marking guides and plans by systematically checking crew performance on a sample basis.
71.4 - Designating Without Marking Individual Trees. Use designation by clearcut units, overstory or understory removal, or similar designations to reduce sale layout costs when such methods will accomplish the sale objectives.
Clearly mark the cutting unit boundaries (sec. 71.22) with tree marking paint containing registered tracer(s). Leave no question of which trees are designated for removal.
Ensure that the sale area map agrees with boundaries placed on the ground.
71.5 - Protecting Special Trees. Highly valuable trees often need to be retained on the site while trees around them are cut or removed. Mark such trees clearly and in a manner that will avoid the likelihood of these trees being cut through error.
71.51 - Witness Trees. Do not designate witness and corner trees for cutting. If, for some reason, destruction of such trees is inevitable, coordinate with the Forest cadastral surveyor or preservation or replacement of such monuments before destruction occurs.
71.52 - Wildlife and Other Trees. Mark trees needed for wildlife habitat, tree improvements, or other purposes as identified in the plan or as instructed. Use the appropriate color of marking paint and metal or plastic signs to identify the reason for protecting the tree and/or the penalty for cutting it.
72 - TRESPASS PREVENTION. Ensure that designation methods minimize the chance of trespass and maximize the probability of early detection and successful prosecution if trespass does occur.
72.1 - Tracers. Paint with tracer(s) helps reduce unauthorized cutting and may provide evidence when such cutting does occur.

WO AMENDMENT 2409.12-96-2 2409.12,70EFFECTIVE 9/18/96 Page 4 of 8
72.11 - Paint Testing. Use the field test kit available from the paint manufacturer on a sample of the marked trees to verify that the special additives (tracer(s)) are present and that the intended paint was used. Document the results along with the date, name of the tester and other pertinent details. File any test results in the sale case folder. Ordinarily, few fields tests are needed if other records can verity the paint used for the timber marking.
When test of a more thorough depth are desired, they must be made in a laboratory analysis. The Federal Bureau of Investigation, State police, General Services Administration, or private testing labs make such analyses.
72.12 - Tracer Paint Security. Tracer marking paint is specially prepared for Forest Service use and must be safeguarded.
Each District Ranger shall designate a property custodian(s) to issue paint and maintain the paint inventory and an accountable property officer responsible for quantity audits. These positions must be separate individuals. There may be one primary and one backup property custodian. This should ensure a minimum number of personnel have access to the tracer paint storage area.
1. Property Custodian.
a. Paint Storage.
(1) Store all tracer paint in a locked area away from other paints. Do not use a Forest Service lock.
(2) Store tracer paint separately from any non-tracer marking paint. Non-tracer marking paint must be disposed of since it does not meet safety requirements.
(3) Organize paint in the storage area by color, brand, batch number, and container size for easy counting and accountability.
(4) Apply the same care and labeling procedures to solvent that has been used to wash cans of tracer paint as that used to protect and identify tracer paint.
(5) Store, on a separate shelf in the tracer paint storage area, solvent that is in tracer paint cans.
b. Paint Inventory.
(1) Record tracer paint by paint color, brand name, batch number, and container size, and for full, partially full, and empty containers. Record and maintain this inventory in a format similar to exhibit 01.
(2) Reconcile the inventory at least once monthly.
WO AMENDMENT 2409.12-96-2 2409.12,70EFFECTIVE 9/18/96 Page 5 of 8
c. Disposal of Containers.
(1) Keep all empty containers in the storage area until proper disposal can occur.
(2) Dispose of all tracer paint containers at least monthly.
(3) Ensure that all paint has hardened prior to disposal.
2. Accountable Property Officer.
a. Audit tracer paint inventory, at least, once per quarter and report results to the Forest Supervisor through the District Ranger. This audit must also include compliance with the policy and procedures, as stated throughout sections 72.12 through 72.14.
b. Shortages must be reported after each quarterly audit on Form AD-112, Report of Unserviceable, Lost, or Damaged Property.
3. Forest Staff. The Forest staff officers must audit each District annually. This audit should be scheduled with the District Ranger, without the knowledge of the property custodian and accountable property officer

WO AMENDMENT 2409.12-96-2 2409.12,70EFFECTIVE 9/18/96 Page 6 of 8
72.12 - Exhibit 01
Daily Records of Issues - Tree Marking Paint (Tracer)
SEE THE PAPER COPY OF THE MASTER SETFOR THE SECTION 72.12 - EXHIBIT 01

WO AMENDMENT 2409.12-96-2 2409.12,70EFFECTIVE 9/18/96 Page 7 of 8
72.13 - Paint Purchase.
1. Purchase only approved tracer paint through the normal procurement channels. Specifications for paint limit the tracer solely to Forest Service use. The tracer is registered with the Missoula Technology and Development Center.
2. Contact the Missoula Technology and Development Center for information and assistance with marking paint questions.
72.14 - Paint Use.
1. When paint orders are received, and prior to its use, check for presence of tracer. Document information on the inventory form.
2. Use tracer paint for all sale designations where paint is needed, including the following:
a. Cut tree marking.
b. Leave tree marking.
c. Posting sale or unit boundaries.
d. Reserve trees.
e. Special area protection zones.
f. Streamside zones.
g. Designating additional timber.
3. Follow all safety requirements as stated on the manufacturer’s label.
4. Keep all tracer paint carried to the field in a locked tool box when not in use. Do not use a Forest Service lock.
5. When contract marking is used, require a daily accounting for all paint used. Consider including contract provisions to level fines for missing paint cans.
6. Sale administrators must check use of tracer paint on each active sale unit as a function of normal sale administration. Document findings on an inspection report (FSH 2409.15, 13.42).
72.2 - Stump Marks. Always use stump marks for any tree marked with the intention of designating for, or protecting from, cutting. Ensure that the mark is at or near the ground line, but on the tree and not the ground. Make it large enough to be conspicuous if scraped or chipped off. Avoid marking thick moss or loose bark

WO AMENDMENT 2409.12-96-2 2409.12,70EFFECTIVE 9/18/96 Page 8 of 8
that could easily be removed from the tree. When possible, mark on the low side or where it is less likely that the mark could be removed by cutting the tree.

TIMBER CRUISING HANDBOOK
239
CHAPTER 80 - MISCELLANEOUS TIMBER CRUISING SUBJECTS
Contents
81 TRESPASS CRUISES81.1 Requirements for Trespass Cruises81.2 Conducting the Trespass Cruise

TIMBER CRUISING HANDBOOK
240
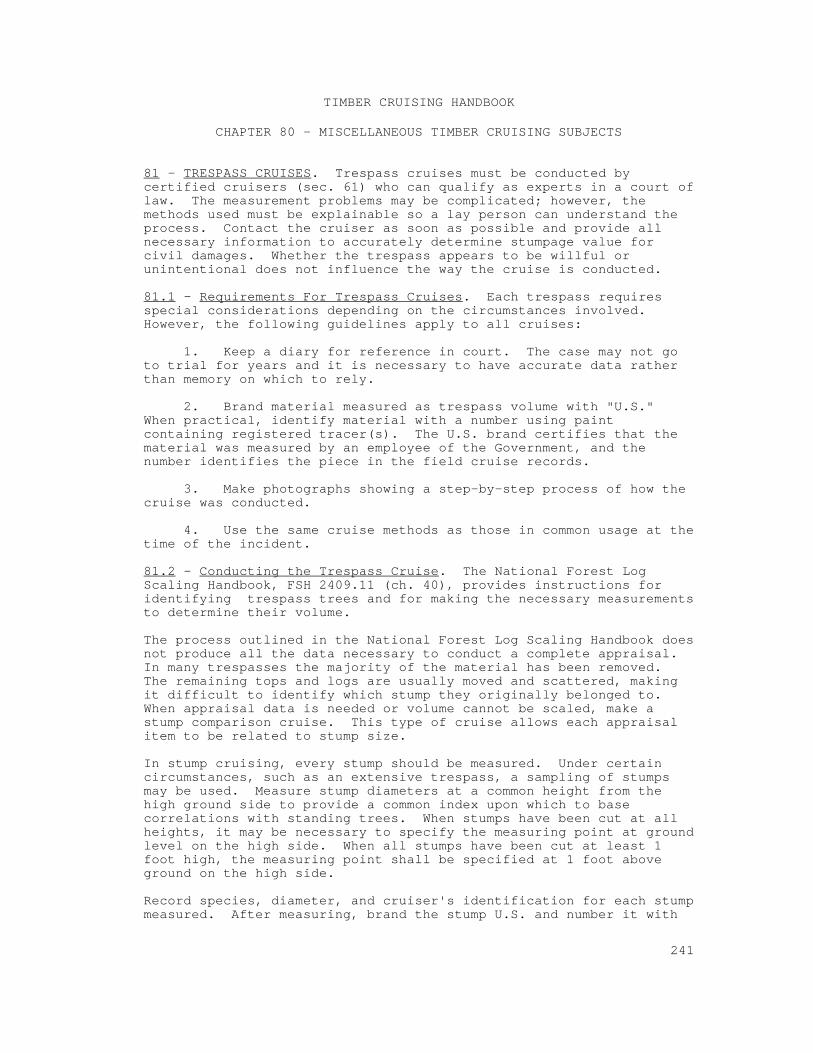
TIMBER CRUISING HANDBOOK
241
CHAPTER 80 - MISCELLANEOUS TIMBER CRUISING SUBJECTS
81 - TRESPASS CRUISES. Trespass cruises must be conducted bycertified cruisers (sec. 61) who can qualify as experts in a court oflaw. The measurement problems may be complicated; however, themethods used must be explainable so a lay person can understand theprocess. Contact the cruiser as soon as possible and provide allnecessary information to accurately determine stumpage value forcivil damages. Whether the trespass appears to be willful orunintentional does not influence the way the cruise is conducted.
81.1 - Requirements For Trespass Cruises. Each trespass requiresspecial considerations depending on the circumstances involved. However, the following guidelines apply to all cruises:
1. Keep a diary for reference in court. The case may not goto trial for years and it is necessary to have accurate data ratherthan memory on which to rely.
2. Brand material measured as trespass volume with "U.S." When practical, identify material with a number using paintcontaining registered tracer(s). The U.S. brand certifies that thematerial was measured by an employee of the Government, and thenumber identifies the piece in the field cruise records.
3. Make photographs showing a step-by-step process of how thecruise was conducted.
4. Use the same cruise methods as those in common usage at thetime of the incident.
81.2 - Conducting the Trespass Cruise. The National Forest LogScaling Handbook, FSH 2409.11 (ch. 40), provides instructions foridentifying trespass trees and for making the necessary measurementsto determine their volume.
The process outlined in the National Forest Log Scaling Handbook doesnot produce all the data necessary to conduct a complete appraisal. In many trespasses the majority of the material has been removed. The remaining tops and logs are usually moved and scattered, makingit difficult to identify which stump they originally belonged to. When appraisal data is needed or volume cannot be scaled, make astump comparison cruise. This type of cruise allows each appraisalitem to be related to stump size.
In stump cruising, every stump should be measured. Under certaincircumstances, such as an extensive trespass, a sampling of stumpsmay be used. Measure stump diameters at a common height from thehigh ground side to provide a common index upon which to basecorrelations with standing trees. When stumps have been cut at allheights, it may be necessary to specify the measuring point at groundlevel on the high side. When all stumps have been cut at least 1foot high, the measuring point shall be specified at 1 foot aboveground on the high side.
Record species, diameter, and cruiser's identification for each stumpmeasured. After measuring, brand the stump U.S. and number it with
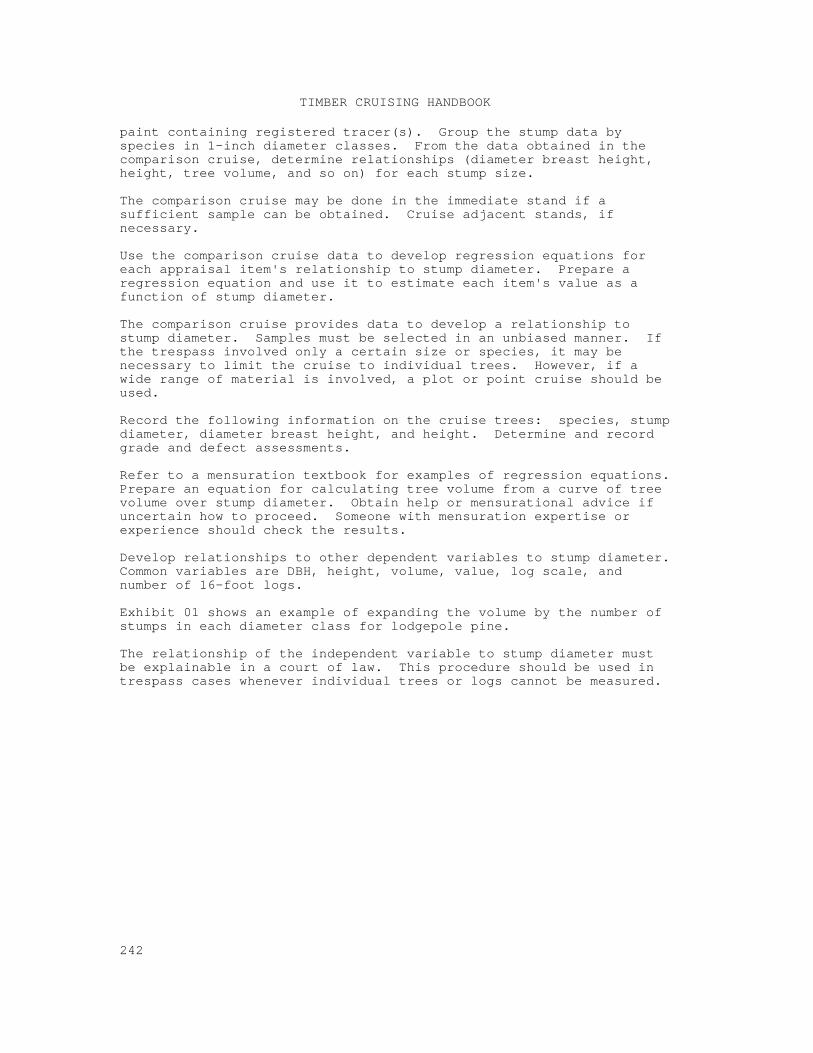
TIMBER CRUISING HANDBOOK
242
paint containing registered tracer(s). Group the stump data byspecies in 1-inch diameter classes. From the data obtained in thecomparison cruise, determine relationships (diameter breast height,height, tree volume, and so on) for each stump size.
The comparison cruise may be done in the immediate stand if asufficient sample can be obtained. Cruise adjacent stands, ifnecessary.
Use the comparison cruise data to develop regression equations foreach appraisal item's relationship to stump diameter. Prepare aregression equation and use it to estimate each item's value as afunction of stump diameter.
The comparison cruise provides data to develop a relationship tostump diameter. Samples must be selected in an unbiased manner. Ifthe trespass involved only a certain size or species, it may benecessary to limit the cruise to individual trees. However, if awide range of material is involved, a plot or point cruise should beused.
Record the following information on the cruise trees: species, stumpdiameter, diameter breast height, and height. Determine and recordgrade and defect assessments.
Refer to a mensuration textbook for examples of regression equations. Prepare an equation for calculating tree volume from a curve of treevolume over stump diameter. Obtain help or mensurational advice ifuncertain how to proceed. Someone with mensuration expertise orexperience should check the results.
Develop relationships to other dependent variables to stump diameter.Common variables are DBH, height, volume, value, log scale, andnumber of 16-foot logs.
Exhibit 01 shows an example of expanding the volume by the number ofstumps in each diameter class for lodgepole pine.
The relationship of the independent variable to stump diameter mustbe explainable in a court of law. This procedure should be used intrespass cases whenever individual trees or logs cannot be measured.
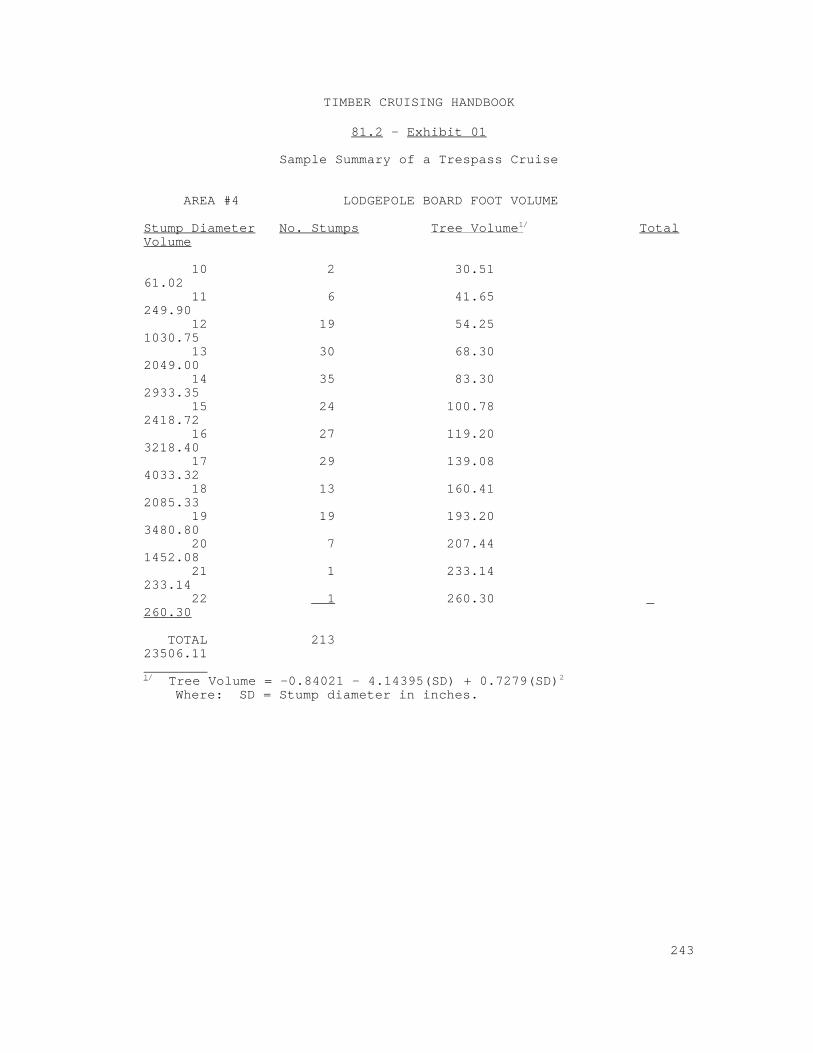
TIMBER CRUISING HANDBOOK
243
81.2 - Exhibit 01
Sample Summary of a Trespass Cruise
AREA #4 LODGEPOLE BOARD FOOT VOLUME Stump Diameter No. Stumps Tree Volume Total1/
Volume
10 2 30.51 61.02
11 6 41.65 249.90
12 19 54.25 1030.75
13 30 68.30 2049.00
14 35 83.30 2933.35
15 24 100.78 2418.72
16 27 119.20 3218.40
17 29 139.08 4033.32
18 13 160.41 2085.33
19 19 193.20 3480.80
20 7 207.44 1452.08
21 1 233.14 233.14
22 1 260.30 260.30
TOTAL 213 23506.11 Tree Volume = -0.84021 - 4.14395(SD) + 0.7279(SD)1/ 2
Where: SD = Stump diameter in inches.

TIMBER CRUISING HANDBOOK
244

TIMBER CRUISING HANDBOOK
245
CHAPTER 90 - MISCELLANEOUS TABLES
Contents
91 EXHIBITS

TIMBER CRUISING HANDBOOK
246
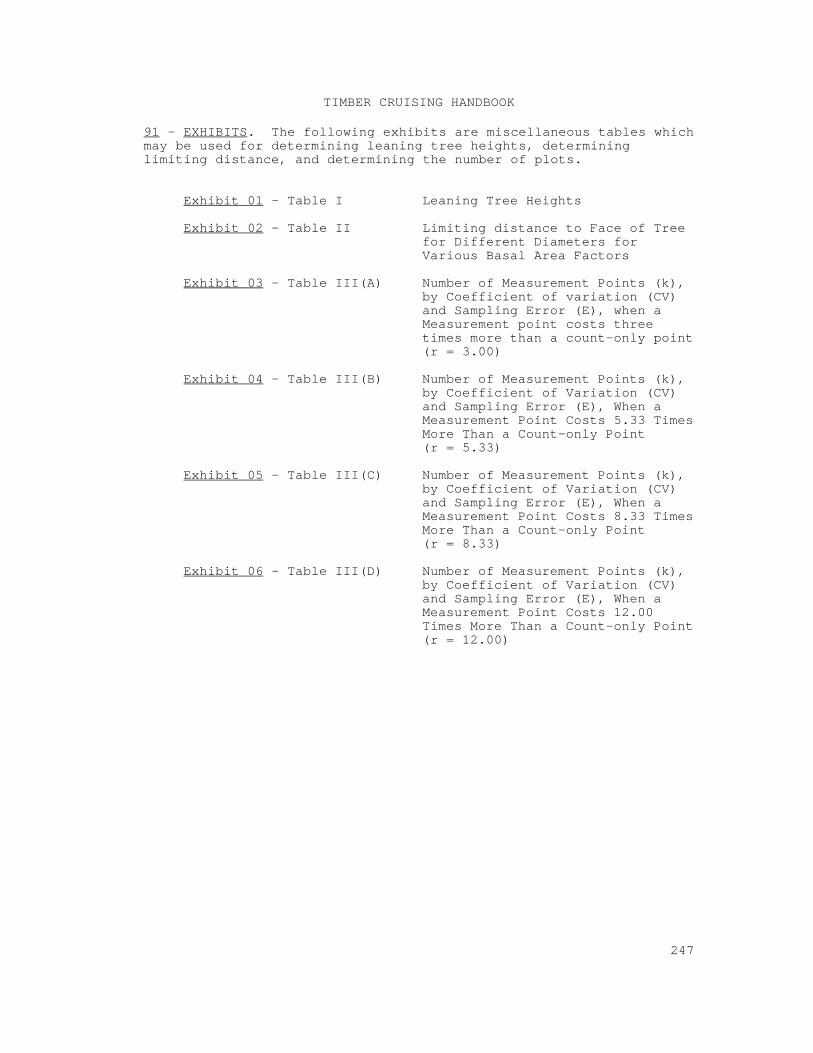
TIMBER CRUISING HANDBOOK
247
91 - EXHIBITS. The following exhibits are miscellaneous tables whichmay be used for determining leaning tree heights, determininglimiting distance, and determining the number of plots.
Exhibit 01 - Table I Leaning Tree Heights
Exhibit 02 - Table II Limiting distance to Face of Treefor Different Diameters forVarious Basal Area Factors
Exhibit 03 - Table III(A) Number of Measurement Points (k),by Coefficient of variation (CV)and Sampling Error (E), when aMeasurement point costs threetimes more than a count-only point(r = 3.00)
Exhibit 04 - Table III(B) Number of Measurement Points (k),by Coefficient of Variation (CV)and Sampling Error (E), When aMeasurement Point Costs 5.33 TimesMore Than a Count-only Point(r = 5.33)
Exhibit 05 - Table III(C) Number of Measurement Points (k),by Coefficient of Variation (CV)and Sampling Error (E), When aMeasurement Point Costs 8.33 TimesMore Than a Count-only Point(r = 8.33)
Exhibit 06 - Table III(D) Number of Measurement Points (k),by Coefficient of Variation (CV)and Sampling Error (E), When aMeasurement Point Costs 12.00Times More Than a Count-only Point(r = 12.00)
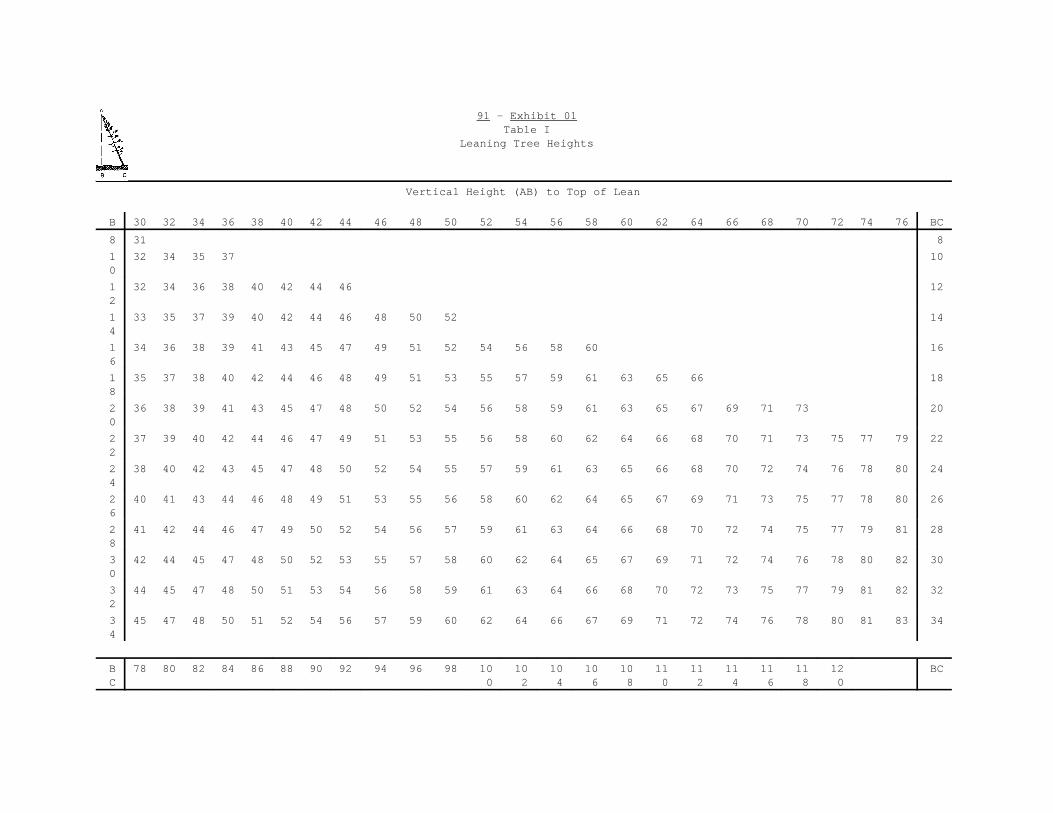
91 - Exhibit 01Table I
Leaning Tree Heights
Vertical Height (AB) to Top of Lean
B 30 32 34 36 38 40 42 44 46 48 50 52 54 56 58 60 62 64 66 68 70 72 74 76 BC
8 31 81 32 34 35 37 1001 32 34 36 38 40 42 44 46 1221 33 35 37 39 40 42 44 46 48 50 52 1441 34 36 38 39 41 43 45 47 49 51 52 54 56 58 60 1661 35 37 38 40 42 44 46 48 49 51 53 55 57 59 61 63 65 66 1882 36 38 39 41 43 45 47 48 50 52 54 56 58 59 61 63 65 67 69 71 73 2002 37 39 40 42 44 46 47 49 51 53 55 56 58 60 62 64 66 68 70 71 73 75 77 79 2222 38 40 42 43 45 47 48 50 52 54 55 57 59 61 63 65 66 68 70 72 74 76 78 80 2442 40 41 43 44 46 48 49 51 53 55 56 58 60 62 64 65 67 69 71 73 75 77 78 80 2662 41 42 44 46 47 49 50 52 54 56 57 59 61 63 64 66 68 70 72 74 75 77 79 81 2883 42 44 45 47 48 50 52 53 55 57 58 60 62 64 65 67 69 71 72 74 76 78 80 82 3003 44 45 47 48 50 51 53 54 56 58 59 61 63 64 66 68 70 72 73 75 77 79 81 82 3223 45 47 48 50 51 52 54 56 57 59 60 62 64 66 67 69 71 72 74 76 78 80 81 83 344
B 78 80 82 84 86 88 90 92 94 96 98 10 10 10 10 10 11 11 11 11 11 12 BCC 0 2 4 6 8 0 2 4 6 8 0

TIMBER CRUISING HANDBOOK
Vertical Height (AB) to Top of Lean
B 30 32 34 36 38 40 42 44 46 48 50 52 54 56 58 60 62 64 66 68 70 72 74 76 BC
8 31 8
249
2 81 2222 82 84 85 87 2442 82 84 86 88 90 92 94 96 2662 83 85 87 89 90 92 94 96 98 10 10 288 0 23 84 85 87 89 91 93 95 97 99 10 10 10 10 10 11 300 1 2 4 6 8 03 84 86 88 90 92 94 96 97 99 10 10 10 10 10 11 11 11 11 322 1 3 5 7 9 1 3 5 63 85 87 89 91 92 94 96 98 10 10 10 10 10 10 11 11 11 11 11 12 12 12 344 0 2 4 6 8 9 1 3 5 7 9 1 3 5
Measure height AB (nearest foot) to tip, or to any point on the leaning stem to which slant height is needed.Measure horizontal distance BC to base of leaning tree. Read slant height from table. Interpolate as needed.
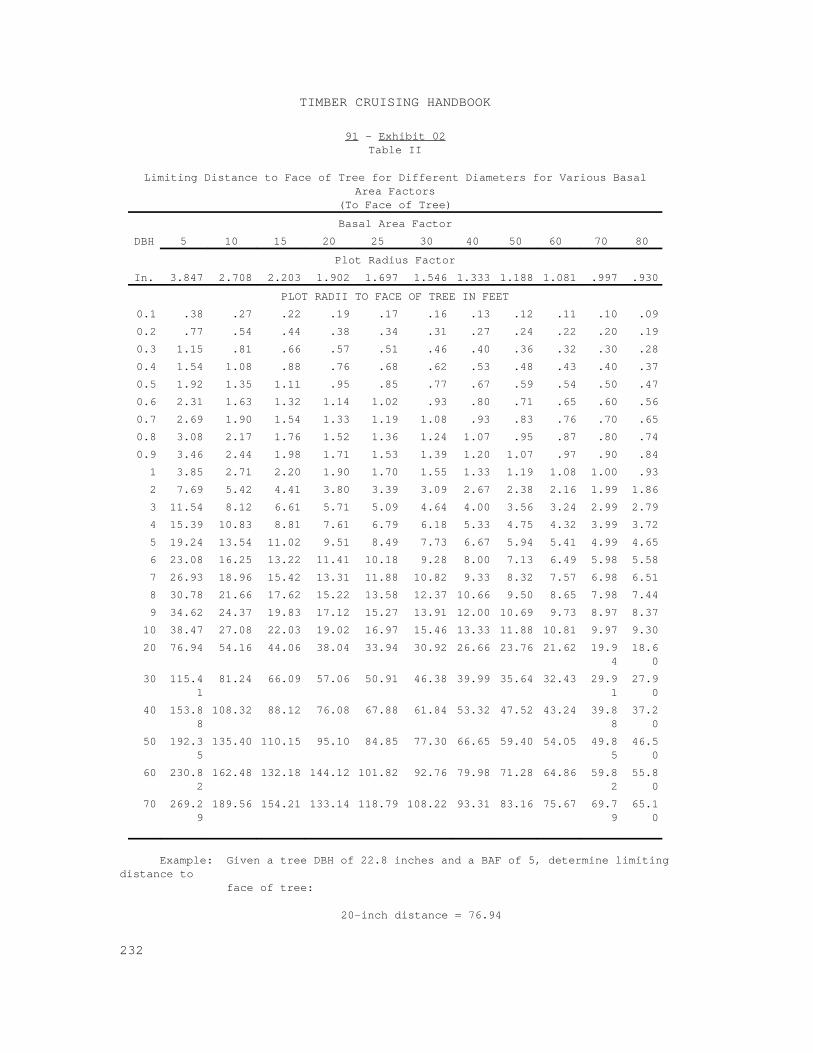
TIMBER CRUISING HANDBOOK
232
91 - Exhibit 02Table II
Limiting Distance to Face of Tree for Different Diameters for Various BasalArea Factors
(To Face of Tree)
Basal Area Factor
DBH 5 10 15 20 25 30 40 50 60 70 80
Plot Radius Factor
In. 3.847 2.708 2.203 1.902 1.697 1.546 1.333 1.188 1.081 .997 .930
PLOT RADII TO FACE OF TREE IN FEET
0.1 .38 .27 .22 .19 .17 .16 .13 .12 .11 .10 .09
0.2 .77 .54 .44 .38 .34 .31 .27 .24 .22 .20 .19
0.3 1.15 .81 .66 .57 .51 .46 .40 .36 .32 .30 .28
0.4 1.54 1.08 .88 .76 .68 .62 .53 .48 .43 .40 .37
0.5 1.92 1.35 1.11 .95 .85 .77 .67 .59 .54 .50 .47
0.6 2.31 1.63 1.32 1.14 1.02 .93 .80 .71 .65 .60 .56
0.7 2.69 1.90 1.54 1.33 1.19 1.08 .93 .83 .76 .70 .65
0.8 3.08 2.17 1.76 1.52 1.36 1.24 1.07 .95 .87 .80 .74
0.9 3.46 2.44 1.98 1.71 1.53 1.39 1.20 1.07 .97 .90 .84
1 3.85 2.71 2.20 1.90 1.70 1.55 1.33 1.19 1.08 1.00 .93
2 7.69 5.42 4.41 3.80 3.39 3.09 2.67 2.38 2.16 1.99 1.86
3 11.54 8.12 6.61 5.71 5.09 4.64 4.00 3.56 3.24 2.99 2.79
4 15.39 10.83 8.81 7.61 6.79 6.18 5.33 4.75 4.32 3.99 3.72
5 19.24 13.54 11.02 9.51 8.49 7.73 6.67 5.94 5.41 4.99 4.65
6 23.08 16.25 13.22 11.41 10.18 9.28 8.00 7.13 6.49 5.98 5.58
7 26.93 18.96 15.42 13.31 11.88 10.82 9.33 8.32 7.57 6.98 6.51
8 30.78 21.66 17.62 15.22 13.58 12.37 10.66 9.50 8.65 7.98 7.44
9 34.62 24.37 19.83 17.12 15.27 13.91 12.00 10.69 9.73 8.97 8.37
10 38.47 27.08 22.03 19.02 16.97 15.46 13.33 11.88 10.81 9.97 9.30
20 76.94 54.16 44.06 38.04 33.94 30.92 26.66 23.76 21.62 19.9 18.64 0
30 115.4 81.24 66.09 57.06 50.91 46.38 39.99 35.64 32.43 29.9 27.91 1 0
40 153.8 108.32 88.12 76.08 67.88 61.84 53.32 47.52 43.24 39.8 37.28 8 0
50 192.3 135.40 110.15 95.10 84.85 77.30 66.65 59.40 54.05 49.8 46.55 5 0
60 230.8 162.48 132.18 144.12 101.82 92.76 79.98 71.28 64.86 59.8 55.82 2 0
70 269.2 189.56 154.21 133.14 118.79 108.22 93.31 83.16 75.67 69.7 65.19 9 0
Example: Given a tree DBH of 22.8 inches and a BAF of 5, determine limitingdistance to
face of tree:
20-inch distance = 76.94

TIMBER CRUISING HANDBOOK
233
2-inch distance = 7.69 0.8-inch distance = 3.08
Limiting distance to face of 22.8-inch tree = 87.71 feet
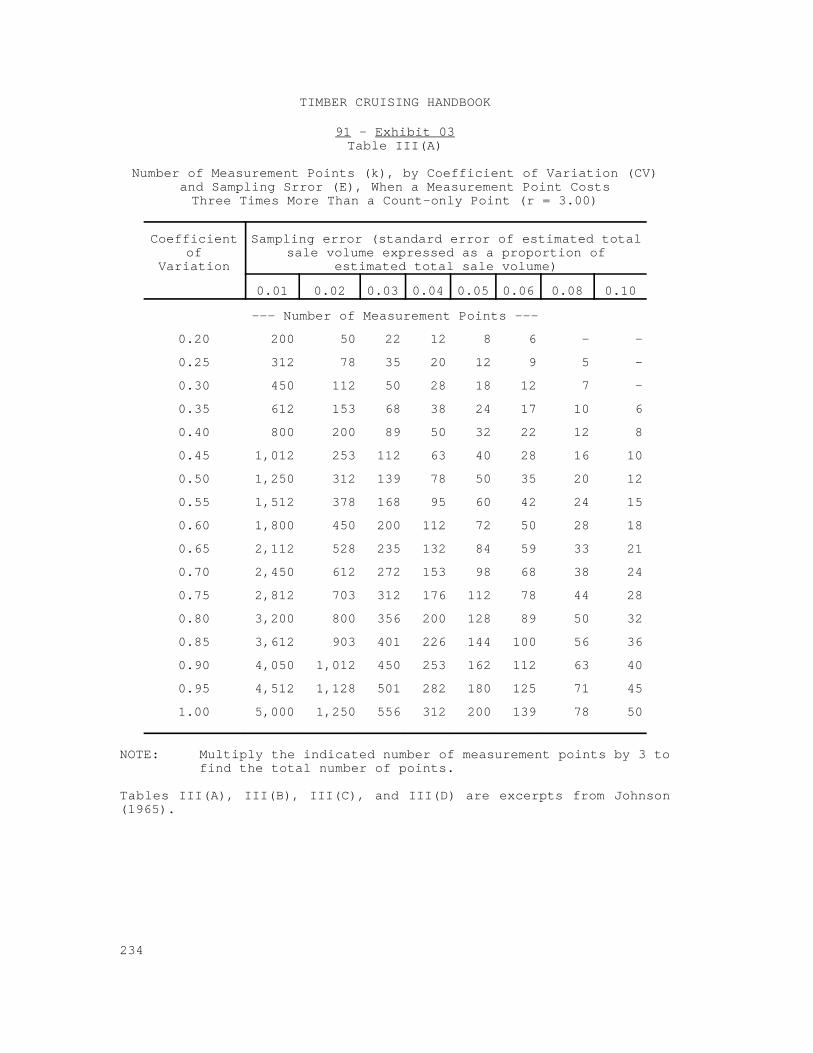
TIMBER CRUISING HANDBOOK
234
91 - Exhibit 03Table III(A)
Number of Measurement Points (k), by Coefficient of Variation (CV)and Sampling Srror (E), When a Measurement Point CostsThree Times More Than a Count-only Point (r = 3.00)
Coefficient Sampling error (standard error of estimated totalof sale volume expressed as a proportion of
Variation estimated total sale volume)
0.01 0.02 0.03 0.04 0.05 0.06 0.08 0.10
--- Number of Measurement Points ---
0.20 200 50 22 12 8 6 - -
0.25 312 78 35 20 12 9 5 -
0.30 450 112 50 28 18 12 7 -
0.35 612 153 68 38 24 17 10 6
0.40 800 200 89 50 32 22 12 8
0.45 1,012 253 112 63 40 28 16 10
0.50 1,250 312 139 78 50 35 20 12
0.55 1,512 378 168 95 60 42 24 15
0.60 1,800 450 200 112 72 50 28 18
0.65 2,112 528 235 132 84 59 33 21
0.70 2,450 612 272 153 98 68 38 24
0.75 2,812 703 312 176 112 78 44 28
0.80 3,200 800 356 200 128 89 50 32
0.85 3,612 903 401 226 144 100 56 36
0.90 4,050 1,012 450 253 162 112 63 40
0.95 4,512 1,128 501 282 180 125 71 45
1.00 5,000 1,250 556 312 200 139 78 50
NOTE: Multiply the indicated number of measurement points by 3 tofind the total number of points.
Tables III(A), III(B), III(C), and III(D) are excerpts from Johnson(1965).
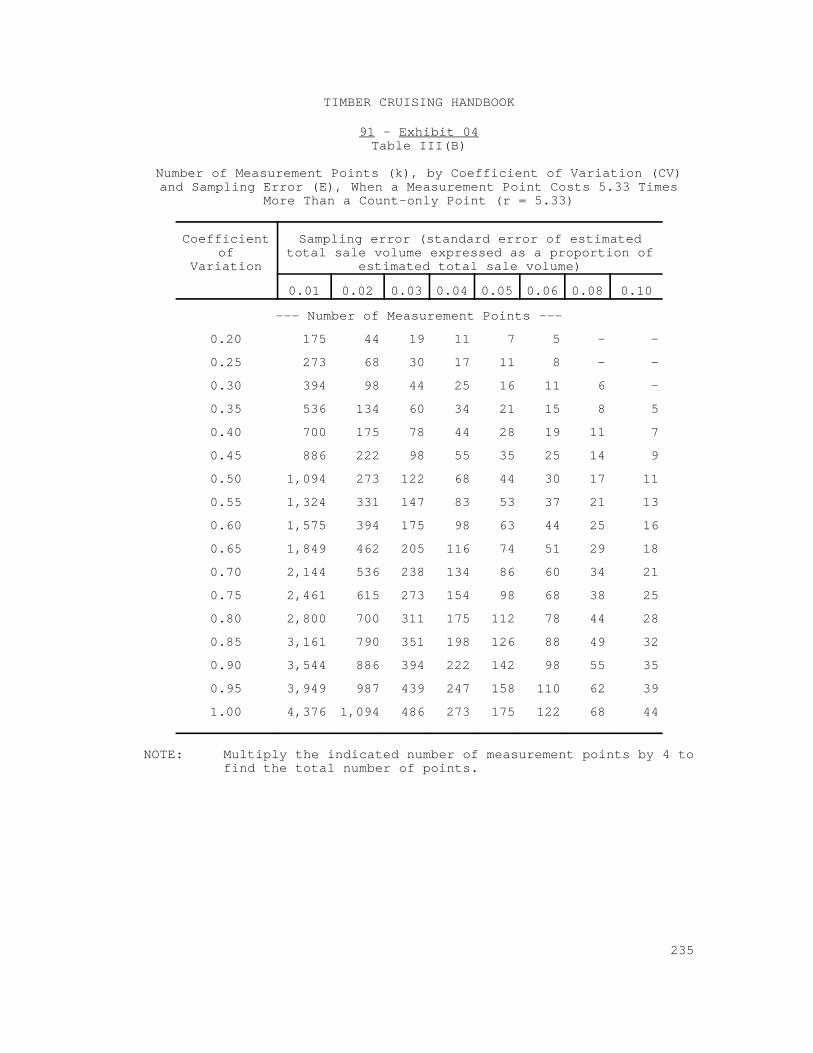
TIMBER CRUISING HANDBOOK
235
91 - Exhibit 04Table III(B)
Number of Measurement Points (k), by Coefficient of Variation (CV)and Sampling Error (E), When a Measurement Point Costs 5.33 Times
More Than a Count-only Point (r = 5.33)
Coefficient Sampling error (standard error of estimatedof total sale volume expressed as a proportion of
Variation estimated total sale volume)
0.01 0.02 0.03 0.04 0.05 0.06 0.08 0.10
--- Number of Measurement Points ---
0.20 175 44 19 11 7 5 - -
0.25 273 68 30 17 11 8 - -
0.30 394 98 44 25 16 11 6 -
0.35 536 134 60 34 21 15 8 5
0.40 700 175 78 44 28 19 11 7
0.45 886 222 98 55 35 25 14 9
0.50 1,094 273 122 68 44 30 17 11
0.55 1,324 331 147 83 53 37 21 13
0.60 1,575 394 175 98 63 44 25 16
0.65 1,849 462 205 116 74 51 29 18
0.70 2,144 536 238 134 86 60 34 21
0.75 2,461 615 273 154 98 68 38 25
0.80 2,800 700 311 175 112 78 44 28
0.85 3,161 790 351 198 126 88 49 32
0.90 3,544 886 394 222 142 98 55 35
0.95 3,949 987 439 247 158 110 62 39
1.00 4,376 1,094 486 273 175 122 68 44
NOTE: Multiply the indicated number of measurement points by 4 tofind the total number of points.
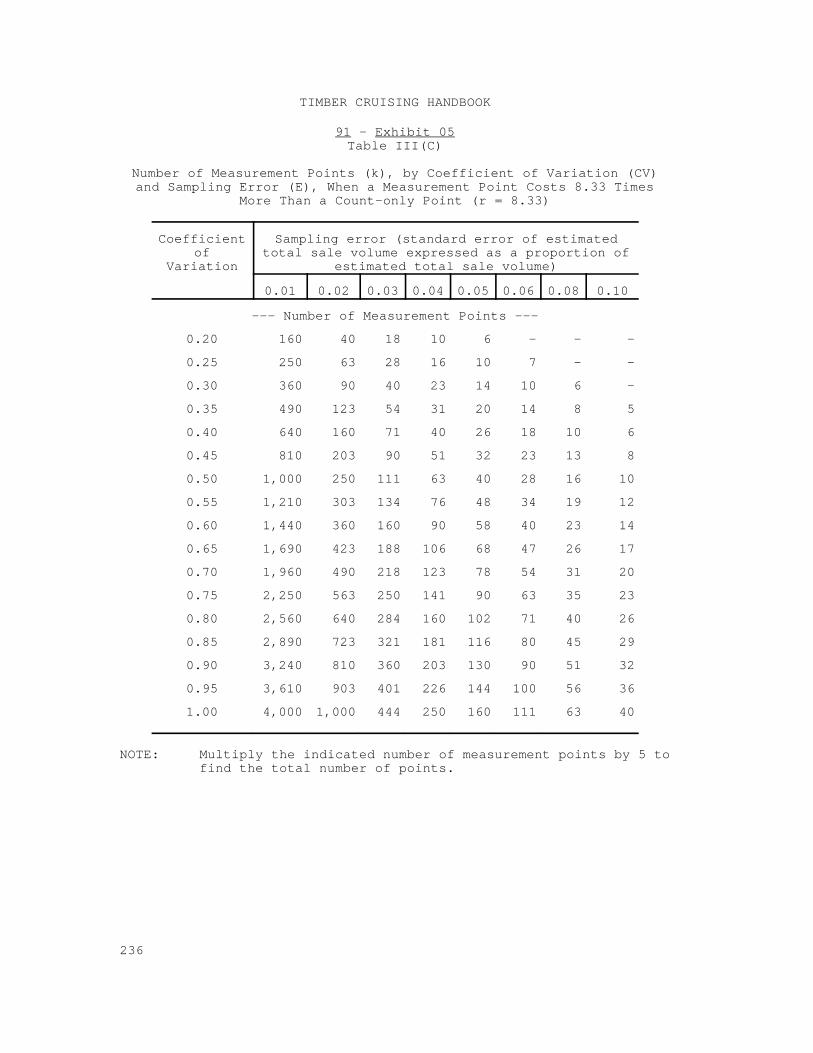
TIMBER CRUISING HANDBOOK
236
91 - Exhibit 05Table III(C)
Number of Measurement Points (k), by Coefficient of Variation (CV)and Sampling Error (E), When a Measurement Point Costs 8.33 Times
More Than a Count-only Point (r = 8.33)
Coefficient Sampling error (standard error of estimatedof total sale volume expressed as a proportion of
Variation estimated total sale volume)
0.01 0.02 0.03 0.04 0.05 0.06 0.08 0.10
--- Number of Measurement Points ---
0.20 160 40 18 10 6 - - -
0.25 250 63 28 16 10 7 - -
0.30 360 90 40 23 14 10 6 -
0.35 490 123 54 31 20 14 8 5
0.40 640 160 71 40 26 18 10 6
0.45 810 203 90 51 32 23 13 8
0.50 1,000 250 111 63 40 28 16 10
0.55 1,210 303 134 76 48 34 19 12
0.60 1,440 360 160 90 58 40 23 14
0.65 1,690 423 188 106 68 47 26 17
0.70 1,960 490 218 123 78 54 31 20
0.75 2,250 563 250 141 90 63 35 23
0.80 2,560 640 284 160 102 71 40 26
0.85 2,890 723 321 181 116 80 45 29
0.90 3,240 810 360 203 130 90 51 32
0.95 3,610 903 401 226 144 100 56 36
1.00 4,000 1,000 444 250 160 111 63 40
NOTE: Multiply the indicated number of measurement points by 5 tofind the total number of points.
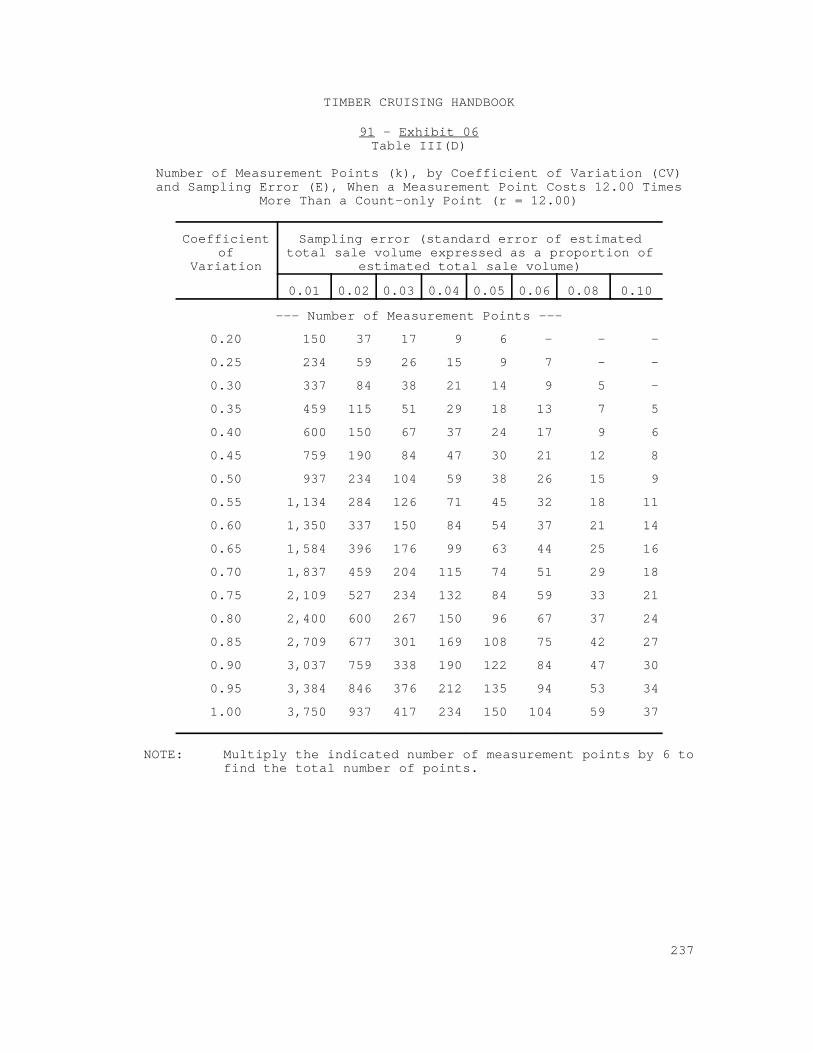
TIMBER CRUISING HANDBOOK
237
91 - Exhibit 06Table III(D)
Number of Measurement Points (k), by Coefficient of Variation (CV)and Sampling Error (E), When a Measurement Point Costs 12.00 Times
More Than a Count-only Point (r = 12.00)
Coefficient Sampling error (standard error of estimatedof total sale volume expressed as a proportion of
Variation estimated total sale volume)
0.01 0.02 0.03 0.04 0.05 0.06 0.08 0.10
--- Number of Measurement Points ---
0.20 150 37 17 9 6 - - -
0.25 234 59 26 15 9 7 - -
0.30 337 84 38 21 14 9 5 -
0.35 459 115 51 29 18 13 7 5
0.40 600 150 67 37 24 17 9 6
0.45 759 190 84 47 30 21 12 8
0.50 937 234 104 59 38 26 15 9
0.55 1,134 284 126 71 45 32 18 11
0.60 1,350 337 150 84 54 37 21 14
0.65 1,584 396 176 99 63 44 25 16
0.70 1,837 459 204 115 74 51 29 18
0.75 2,109 527 234 132 84 59 33 21
0.80 2,400 600 267 150 96 67 37 24
0.85 2,709 677 301 169 108 75 42 27
0.90 3,037 759 338 190 122 84 47 30
0.95 3,384 846 376 212 135 94 53 34
1.00 3,750 937 417 234 150 104 59 37
NOTE: Multiply the indicated number of measurement points by 6 tofind the total number of points.