food processing 2010 manufacturing trends survey · 2013-10-17 · food processing 2010...
TRANSCRIPT

Food Processing 2010 Manufacturing Trends Survey 1. For the coming year, please rank, 1st place through 10th place, the importance to your plant of the following manufacturing issues:
Item 1st 2nd 3rd 4th 5th 6th 7th 8th 9th 10th Average Total Automation 11.4%
42 7.1% 26
8.2% 30
9.8% 36
13.9% 51
9.2% 34
5.2% 19
10.6% 39
9.2% 34
15.5% 57 5.3 368
Consolidation challenges 8.7% 32
7.6% 28
8.7% 32
9.8% 36
9.8% 36
9.8% 36
8.7% 32
7.3% 27
13.0% 48
16.8% 62 5.0 369
Energy issues 15.5% 57
12.2% 45
13.3% 49
13.0% 48
11.1% 41
7.3% 27
9.0% 33
7.9% 29
7.1% 26
3.5% 13 6.4 368
Environmental concerns 12.0% 44
16.0% 59
12.5% 46
9.2% 34
10.3% 38
8.4% 31
6.8% 25
6.3% 23
9.0% 33
9.5% 35 6.1 368
Food safety 59.9% 221
11.9% 44
5.7% 21
5.1% 19
1.4% 5
3.0% 11
2.2% 8
1.9% 7
1.6% 6
7.3% 27 8.4 369
Labor 14.2% 52
14.4% 53
13.1% 48
12.3% 45
11.7% 43
9.8% 36
8.7% 32
7.6% 28
3.0% 11
5.2% 19 6.5 367
Sourcing and materials 15.2% 56
16.3% 60
14.7% 54
8.2% 30
10.3% 38
7.6% 28
7.6% 28
8.4% 31
6.8% 25
4.9% 18 6.5 368
Logistics 6.5% 24
10.3% 38
10.9% 40
9.2% 34
10.6% 39
11.4% 42
12.0% 44
12.5% 46
11.4% 42
5.2% 19 5.4 368
Plant security 12.2% 45
7.9% 29
10.1% 37
9.8% 36
10.1% 37
7.9% 29
10.1% 37
10.6% 39
10.9% 40
10.6% 39 5.5 368
Inspections/certifications 17.7% 65
16.8% 62
10.1% 37
7.6% 28
6.8% 25
8.2% 30
7.3% 27
7.3% 27
7.6% 28
10.6% 39 6.2 368
Average % 17.3% 12.1% 10.7% 9.4% 9.6% 8.3% 7.7% 8.0% 8.0% 8.9% 6.1 3,681.0

2. How is your company dealing with the economy? (You may choose more than one answer)
Item Count Percent % We're growing 135 36.68% Staff reductions 126 34.24% No great changes 119 32.34% Closing plants/consolidating 54 14.67% Widespread salary cuts 34 9.24% Outsourcing to overseas manufacturers 22 5.98% Outsourcing to U.S. or Canadian contract manufacturers 15 4.08% salary freeze 2 0.54% Salary Freezes 2 0.54% Advertising 1 0.27% automation 1 0.27% Consolidating 1 0.27% Controlling labor and commissions 1 0.27% cost reduction efforts 1 0.27%
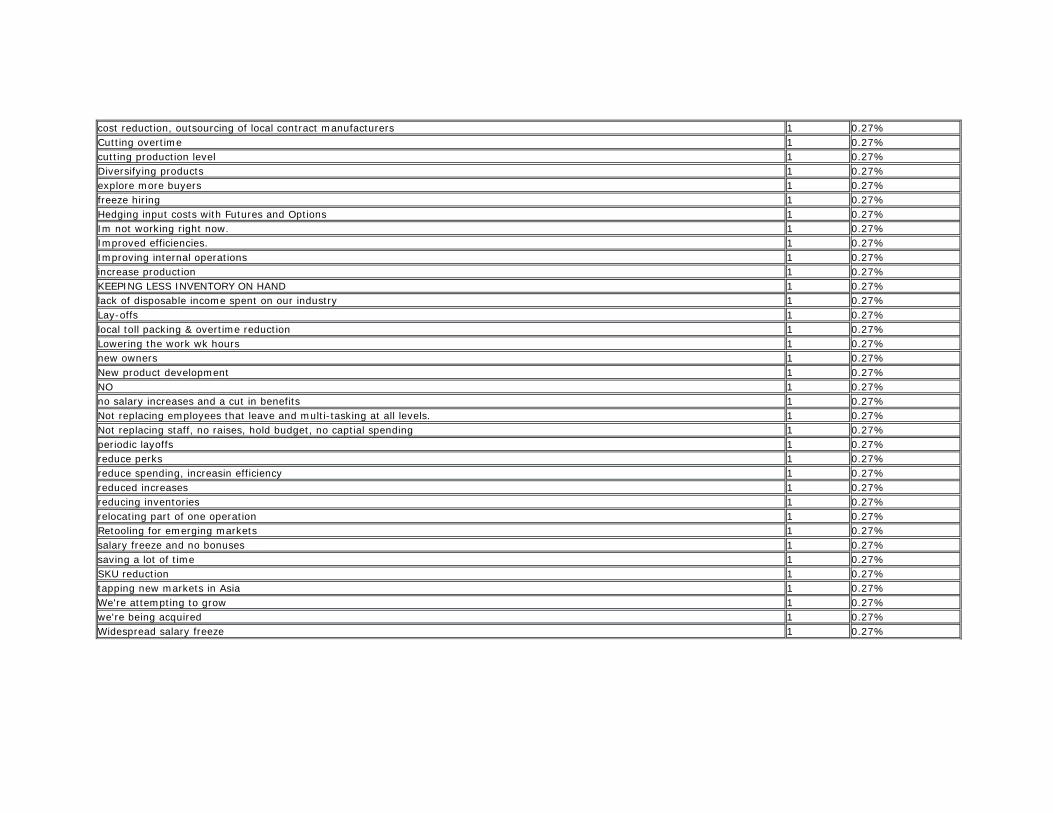
cost reduction, outsourcing of local contract manufacturers 1 0.27% Cutting overtime 1 0.27% cutting production level 1 0.27% Diversifying products 1 0.27% explore more buyers 1 0.27% freeze hiring 1 0.27% Hedging input costs with Futures and Options 1 0.27% Im not working right now. 1 0.27% Improved efficiencies. 1 0.27% Improving internal operations 1 0.27% increase production 1 0.27% KEEPING LESS INVENTORY ON HAND 1 0.27% lack of disposable income spent on our industry 1 0.27% Lay-offs 1 0.27% local toll packing & overtime reduction 1 0.27% Lowering the work wk hours 1 0.27% new owners 1 0.27% New product development 1 0.27% NO 1 0.27% no salary increases and a cut in benefits 1 0.27% Not replacing employees that leave and multi-tasking at all levels. 1 0.27% Not replacing staff, no raises, hold budget, no captial spending 1 0.27% periodic layoffs 1 0.27% reduce perks 1 0.27% reduce spending, increasin efficiency 1 0.27% reduced increases 1 0.27% reducing inventories 1 0.27% relocating part of one operation 1 0.27% Retooling for emerging markets 1 0.27% salary freeze and no bonuses 1 0.27% saving a lot of time 1 0.27% SKU reduction 1 0.27% tapping new markets in Asia 1 0.27% We're attempting to grow 1 0.27% we're being acquired 1 0.27% Widespread salary freeze 1 0.27%

3. Do you anticipate your plant's production in 2010 to:
Item Count Percent % Increase 3-9% 120 32.43% Stay about the same 85 22.97% Increase 10-19% 75 20.27% Increase 20% or more 58 15.68% Decrease 3-9% 20 5.41% Decrease 10-19% 8 2.16% Decrease 20% or more 4 1.08%

4. For 2010, is your company planning to:
Item Count Percent % Stay the same 158 42.70% Expand production/number of manufacturing plants 107 28.92% Don't know/does not apply 55 14.86% Consolidate production/number of manufacturing plants 50 13.51%

5. In 2010, does your facility plan to:
Item Count Percent % Maintain staffing level 178 48.11% Add to the workforce 91 24.59% Don't know 39 10.54% Passively reduce workforce (i.e. through attrition) 37 10.00% Actively reduce workforce 25 6.76%

6. Did your facility increase, decrease, or maintain salaries in 2009?
Item Count Percent % Maintain 205 55.26% Increase 112 30.19% Decrease 40 10.78% Don't know 14 3.77%

7. Will your facility increase, decrease, or maintain salaries in 2010?
Item Count Percent % Maintain 146 39.35% Increase 131 35.31% Don't know 82 22.10% Decrease 12 3.23%

8. How do you feel going into 2010?
Item Count Percent % Optimistic 243 65.50% Neutral/I'm not sure 102 27.49% Pessimistic 26 7.01%

9. What portion of your plant has been automated? (Please check all that apply.)
Item Count Percent % Production sections 181 53.55% Packaging sections 155 45.86% None 64 18.93% Entire production line 40 11.83% Logistics/warehousing 38 11.24% Maintenance, repair & operations 20 5.92% Entire plant 17 5.03% aseptic tetrapak filling 1 0.30% AUTOMATION IS THE KEY FOR SUCCESS TODAY AS LABOUR COST IS GROWING RAPIDLY AND OUTPUT IS POOR. WE NEED TO BRING IN AUTOMATION IN COMING YEARS TO REDUCE LABOUR INTENSIVE ACTIVITIES AND CUT THE COST 1 0.30% NA 1 0.30% Only partly automated 1 0.30% palletizing - w/ robots 1 0.30%

10. If you are automating a component or components of your manufacturing process, are you automating through: (please check all that apply)
Item Count Percent % Programmable controls (PC or PLC) in a network 87 31.29% PC-based control 67 24.10% Manufacturing execution or operations management system 57 20.50% Standalone controls with no networking 47 16.91% In-plant use of Internet to access plant data 36 12.95% Integrated systems 28 10.07% Integration with an enterprise resource planning system 23 8.27% Remote use of Internet to access plant data 21 7.55%

Standalone PLCs 21 7.55% Off-the-shelf software 18 6.47% Custom software 11 3.96% Robotics 10 3.60%
11. Did you implement new food safety measures in 2009?
Item Count Percent % Yes 239 70.71% No 78 23.08% Don't know 21 6.21%
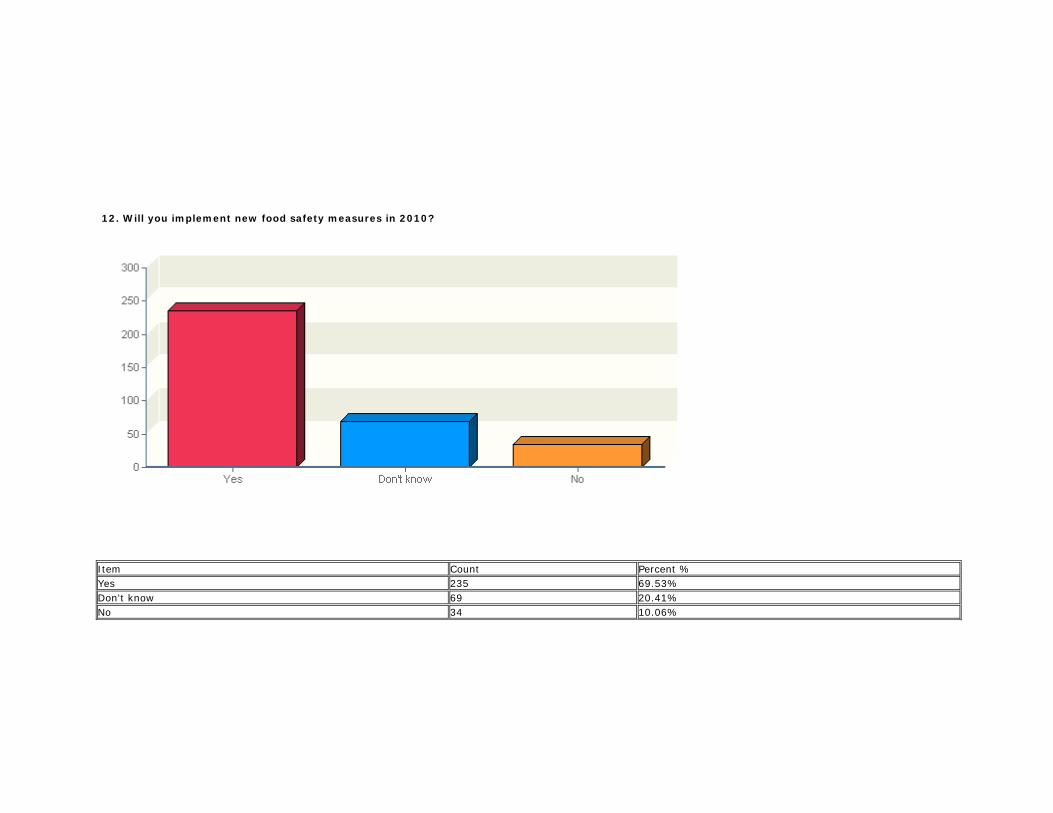
12. Will you implement new food safety measures in 2010?
Item Count Percent % Yes 235 69.53% Don't know 69 20.41% No 34 10.06%
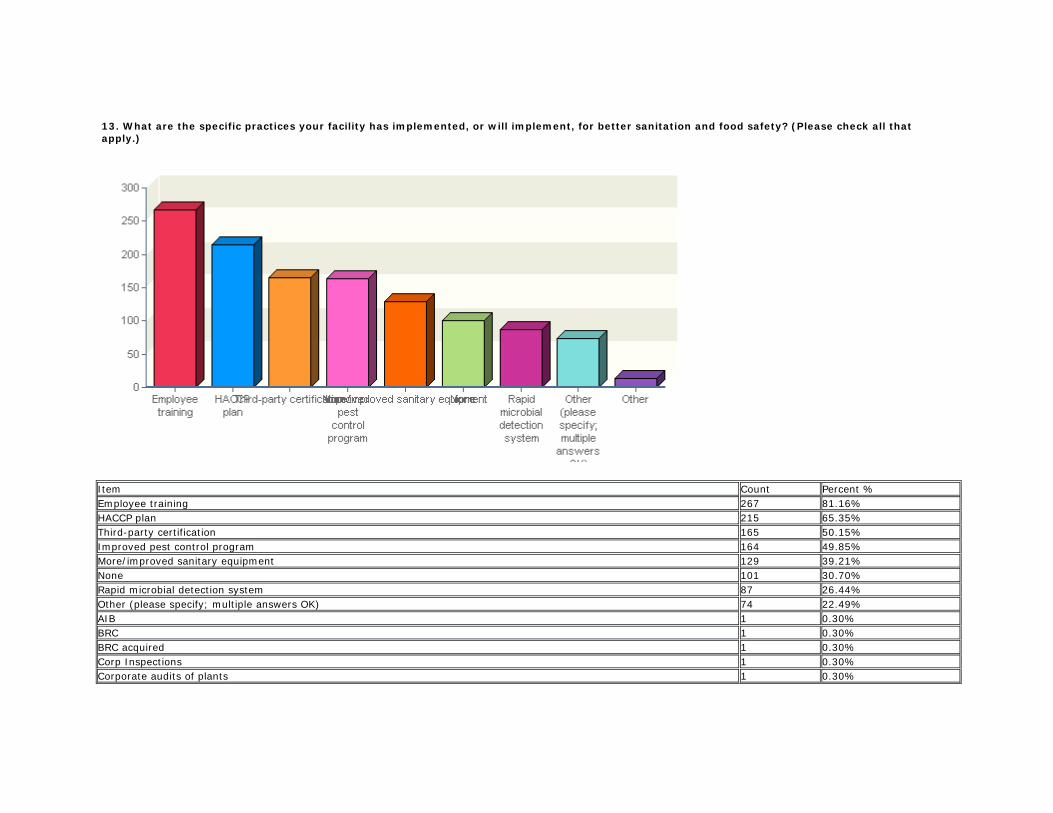
13. What are the specific practices your facility has implemented, or will implement, for better sanitation and food safety? (Please check all that apply.)
Item Count Percent % Employee training 267 81.16% HACCP plan 215 65.35% Third-party certification 165 50.15% Improved pest control program 164 49.85% More/improved sanitary equipment 129 39.21% None 101 30.70% Rapid microbial detection system 87 26.44% Other (please specify; multiple answers OK) 74 22.49% AIB 1 0.30% BRC 1 0.30% BRC acquired 1 0.30% Corp Inspections 1 0.30% Corporate audits of plants 1 0.30%

Corporate-wide inspections and certifications 1 0.30% Environmental Management System (ISO14001) 1 0.30% held the iso 22000 certificate 1 0.30% Improved cleaning and sanitation program 1 0.30% Improved GMP and HSE 1 0.30% ISO22000 1 0.30% NA 1 0.30% upgrade Metal detector procedures 1 0.30%
15. Compared to last year at this time, how concerned are you about E. coli, Salmonella, listeria or other pathogens?
Item Count Percent %

Same level of concern--These worries never go away 204 60.36% More concerned--I think more incidents are coming 83 24.56% Less concerned--I think we have things under control now 51 15.09%
16. Do you currently have an ingredient / food tracking or tracing program in place?
Item Count Percent % Yes 249 75.91% Don't know/Does not apply 45 13.72% No 34 10.37%

17. Regarding the existing system of U.S.-based third party auditing systems, please check any of these programs that you have used in the last year (please check all that apply).
Item Count Percent % AIB 103 44.40% Silliker 78 33.62% Cook & Thurber 40 17.24% EcoSure 20 8.62% Randolph & Associates 10 4.31% None 6 2.59% Harold Wainess & Associates 3 1.29%

n/a 3 1.29% GMA-Safe 2 0.86% Bureau Veritas Nigeria Limited 1 0.43% Chi Alph Consulting LLC 1 0.43% Corp Sanitation & Quality 1 0.43% Crown Audits 1 0.43% DNV (IFS Audit) 1 0.43% don't know the name of agency 1 0.43% EcoCertr (South Africa) 1 0.43% European Based 1 0.43% FDA 1 0.43% FDA, 1 0.43% FSNS Food Safety Net Services and FSA thru FSIS 1 0.43% GFTC 1 0.43% HACCP International Pty Ltd 1 0.43% in house computerized tracking program 1 0.43% local Third party auditors 1 0.43% Malaysian SIRIM Board 1 0.43% Maxxam Analytical 1 0.43% My plant is just under construction now. 1 0.43% NA 1 0.43% NFPA 1 0.43% None done through own developed process in line with HACCP 1 0.43% None from US 1 0.43% none they are not reliable 1 0.43% none yet 1 0.43% Not applicable 1 0.43% not bases in the u.s 1 0.43% Not from U.S. 1 0.43% not in US 1 0.43% NSF 1 0.43% OIA 1 0.43% Organic certification 1 0.43% other 1 0.43% QMS 1 0.43% Ross 1 0.43% RQA 1 0.43% sgs 1 0.43% SGS Canada 1 0.43%

SQF 1 0.43% UKAS 1 0.43% W.E. Long 1 0.43% WE ARE BASED IN INDIA AND PRODUCTS ARE FOR INTERNAL DOMESTIC MARKET AND WE FOLLOW haccp QUALITY MANAGEMENT SYSTEM. 1 0.43% we are in europe 1 0.43% we use SAI Global 1 0.43%

18. If you know your company's capital spending budget for 2010, compared to 2009 is it...
Item Count Percent % Don't know 95 28.70% About the same 66 19.94% Up 5 to 10 percent 64 19.34% Up less than 5 percent 37 11.18% Up more than 10 percent 29 8.76% Down 5 to 10 percent 21 6.34% Down more than 10 percent 12 3.63% Down less than 5 percent 7 2.11%
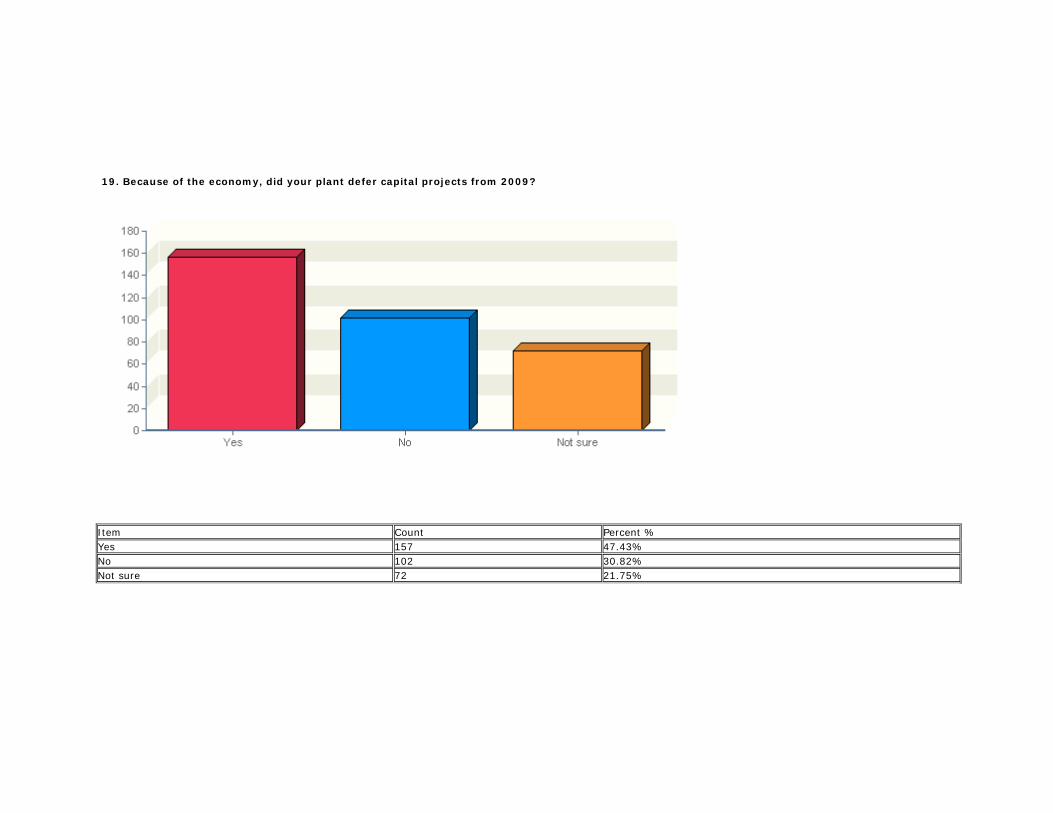
19. Because of the economy, did your plant defer capital projects from 2009?
Item Count Percent % Yes 157 47.43% No 102 30.82% Not sure 72 21.75%

20. How were you impacted by energy costs in 2009?
Item Count Percent % Not significantly impacted 166 52.53% What we use went up significantly 108 34.18% Costs went down significantly 42 13.29%

21. How are you approaching energy management?
Item Count Percent % Taking steps in energy conservation 187 60.13% Conducting energy audits 94 30.23% Not a burning issue right now 75 24.12% Recycling energy (i.e. through redirection systems) 71 22.83% Negotiating with energy providers 64 20.58% Seeking alternate energy sources 48 15.43% Looking to energy management consultants 26 8.36% Looking at co-generation 21 6.75% already installed co-generation system 1 0.32% already on liquified gas power usage 1 0.32% Heding with Heating Oil and Nat Gas Futures and Options 1 0.32% Installing solar panels 1 0.32% Internal research and design. 1 0.32% moved locations 1 0.32%

NA 1 0.32% Plants going green via LEEDS 1 0.32% Relamp Facility 1 0.32%
22. Given the state of the economy, are your company’s or plant's green initiatives…
Item Count Percent % Becoming more important than they were in 2009 230 69.49% This is not important to us 66 19.94% Becoming less important 35 10.57%

23. How many employees at your facility?
Item Count Percent % 101 to 500 124 39.74% 11 to 50 59 18.91% 51 to 100 45 14.42% Fewer than 10 32 10.26% 501 to 1000 30 9.62% 1000 to 2500 9 2.88% 2500 to 5000 7 2.24% More than 5000 6 1.92%

24. Which one of these best describes the dominant end product of your facility?
Item Count Percent % Other 71 22.76% Meats/poultry (fresh or frozen) 35 11.22% Fruits and vegetables 32 10.26% Further processed foods and specialties 30 9.62% Baked goods 29 9.29% Beverages (non-dairy) 27 8.65% Dairy (includes milk, cheese, ice cream or any dairy product) 22 7.05% Breakfast cereals/grain products/pasta 15 4.81%

Herbs/Spices/Dry flavorings 14 4.49% Confectionery 11 3.53% Condiments/Jams/Jellies 9 2.88% Seafood (fresh or frozen) 7 2.24% Frozen Dinners 6 1.92% Snack foods/chip 4 1.28%