florida’s real estate market the...
TRANSCRIPT

FloridaFlorida’’s Real Estate s Real Estate MarketMarket
The ChallengesThe Challenges
Presented to the House Interim Workgroup on Affordable HousingPresented to the House Interim Workgroup on Affordable HousingSeptember 20, 2006September 20, 2006
Legislative Office of Economic and Demographic ResearchLegislative Office of Economic and Demographic Research

Real Estate Market ConditionsReal Estate Market Conditions
• Builder Confidence
•Existing Home Sales
•New Home Sales
•Permits/starts and new construction
•Sale Prices
• Rate of Price Appreciation
Unsold Inventories
&
Interest Rates

Market StagnationMarket Stagnation
The real estate market has already weakened and will The real estate market has already weakened and will weaken further in the months ahead (through 2007).weaken further in the months ahead (through 2007).Existing home sales are forecast to fall 7.6% this year.Existing home sales are forecast to fall 7.6% this year.NewNew--home sales should drop 16.1% this year.home sales should drop 16.1% this year.The 30The 30--year, fixedyear, fixed--rate mortgage is likely to rise to an rate mortgage is likely to rise to an average of 6.7% in the fourth quarter, according to the average of 6.7% in the fourth quarter, according to the RealtorsRealtors®® forecast.forecast.The Florida forecast is for a soft landing, reflected in The Florida forecast is for a soft landing, reflected in weak home prices and even weaker measures of weak home prices and even weaker measures of housing activity.housing activity.

Price AppreciationPrice Appreciation
Over the longOver the long--run, home prices grow at the pace of run, home prices grow at the pace of inflation, plus one or two percentage points.inflation, plus one or two percentage points.According to OFHEO, the second quarter of this year had According to OFHEO, the second quarter of this year had the lowest rate of quarterthe lowest rate of quarter--toto--quarter appreciation since the quarter appreciation since the fourth quarter of 1999. And the decline in appreciation over fourth quarter of 1999. And the decline in appreciation over the past year is the sharpest since the beginning of the the past year is the sharpest since the beginning of the House Price Index in 1975.House Price Index in 1975.According to the National Association of Realtors, the According to the National Association of Realtors, the national median existingnational median existing--home price for all housing types is home price for all housing types is expected to grow 2.8% this year, to $225,900, with the expected to grow 2.8% this year, to $225,900, with the median newmedian new--home price rising only 0.2% to $241,400 home price rising only 0.2% to $241,400

Home Price Increases Outpaced Gains in IncomeHome Price Increases Outpaced Gains in Income
Florida PricesFlorida Prices
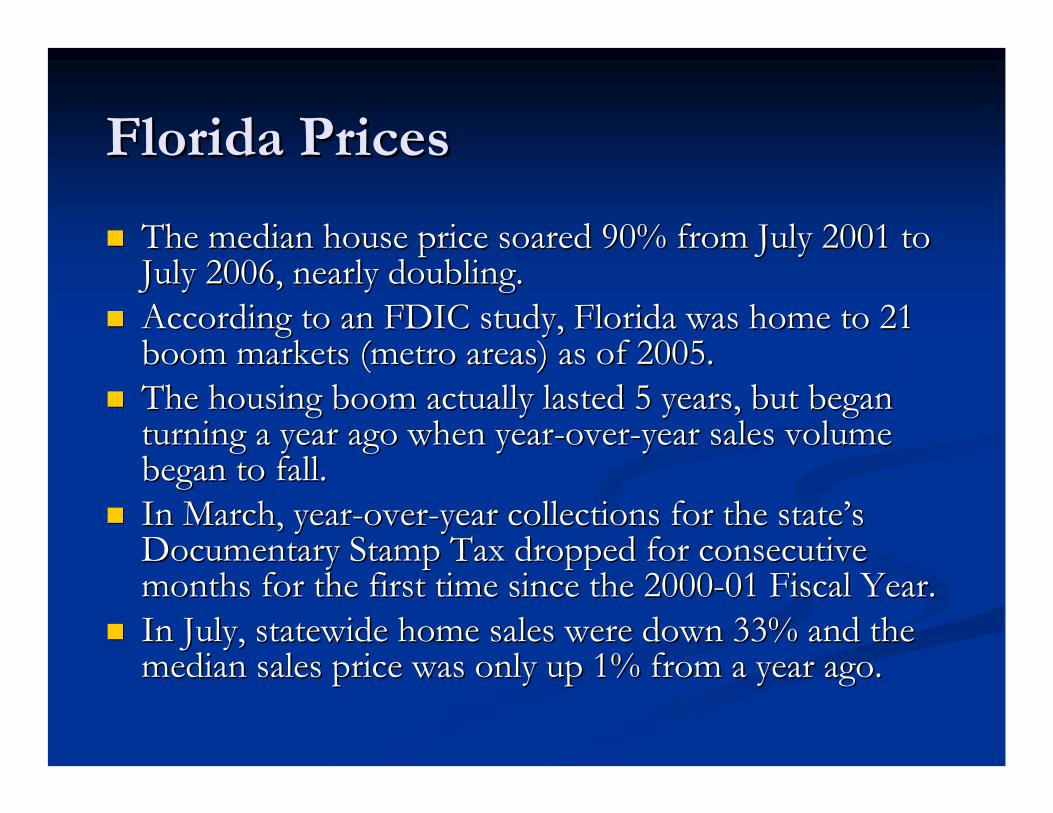
The median house price soared 90% from July 2001 to The median house price soared 90% from July 2001 to July 2006, nearly doubling.July 2006, nearly doubling.According to an FDIC study, Florida was home to 21 According to an FDIC study, Florida was home to 21 boom markets (metro areas) as of 2005.boom markets (metro areas) as of 2005.The housing boom actually lasted 5 years, but began The housing boom actually lasted 5 years, but began turning a year ago when yearturning a year ago when year--overover--year sales volume year sales volume began to fall.began to fall.In March, yearIn March, year--overover--year collections for the stateyear collections for the state’’s s Documentary Stamp Tax dropped for consecutive Documentary Stamp Tax dropped for consecutive months for the first time since the 2000months for the first time since the 2000--01 Fiscal Year.01 Fiscal Year.In July, statewide home sales were down 33% and the In July, statewide home sales were down 33% and the median sales price was only up 1% from a year ago.median sales price was only up 1% from a year ago.

Recent MonthRecent Month--OverOver--Month Appreciation RatesMonth Appreciation Rates

Future PricesFuture Prices““In the past, significant nominal price declines generally have bIn the past, significant nominal price declines generally have been associated with local or een associated with local or regional economic recession, but the exceptional size of some ofregional economic recession, but the exceptional size of some of the recent increases could the recent increases could make them vulnerable without a recession, especially if interestmake them vulnerable without a recession, especially if interest rates continue to rise.rates continue to rise.””
OFHEO, 2006OFHEO, 2006
““National average price appreciation is likely to be quite limiteNational average price appreciation is likely to be quite limited in the near term. d in the near term. Indeed, some decline is a distinct possibility, and the rate of Indeed, some decline is a distinct possibility, and the rate of price appreciation should price appreciation should remain below trend for some time.remain below trend for some time.””
NAHB, 2006NAHB, 2006
““These areas [Florida, California, Arizona, Nevada, Virginia, andThese areas [Florida, California, Arizona, Nevada, Virginia, and Maryland] are Maryland] are vulnerable to outright price declines, particularly if interest vulnerable to outright price declines, particularly if interest rates were to rise further.rates were to rise further.””
NAR, 2006NAR, 2006
““Prices of new and existing homes are also weaker, and actually dPrices of new and existing homes are also weaker, and actually decline in calendar year ecline in calendar year 2007. This will be the first nominal annual decline in the exis2007. This will be the first nominal annual decline in the existing home sales price, a ting home sales price, a series that dates back to 1969.series that dates back to 1969.””
Global Insight, 2006Global Insight, 2006

Florida Demographics Florida Demographics –– Pushing Up CostsPushing Up Costs
The sales and construction associated with the housing boom The sales and construction associated with the housing boom well exceeded underlying population and income changes.well exceeded underlying population and income changes.The annual population growth rate is expected to stay above 2% The annual population growth rate is expected to stay above 2% through 2010.through 2010.
In Fiscal Year 2006In Fiscal Year 2006--07, there are nearly 7.4 million 07, there are nearly 7.4 million households, with household size fairly consistent at 2.5 households, with household size fairly consistent at 2.5 persons per household.persons per household.
Aging boomers are reaching their peak earning and investing Aging boomers are reaching their peak earning and investing years, ultimately leading to higher demand for second homes.years, ultimately leading to higher demand for second homes.While real per capita wages and salaries have continued to rise While real per capita wages and salaries have continued to rise modestly, not everyone has seen better times. Pay gains as modestly, not everyone has seen better times. Pay gains as measured by the employment cost index have fallen short of measured by the employment cost index have fallen short of energyenergy--driven consumer price inflation. driven consumer price inflation. The household financial obligations ratio climbed to a record The household financial obligations ratio climbed to a record high of 18.7% of disposable income in early 2006 and will high of 18.7% of disposable income in early 2006 and will continue to climb to a peak of 20.3% in 2008.continue to climb to a peak of 20.3% in 2008.
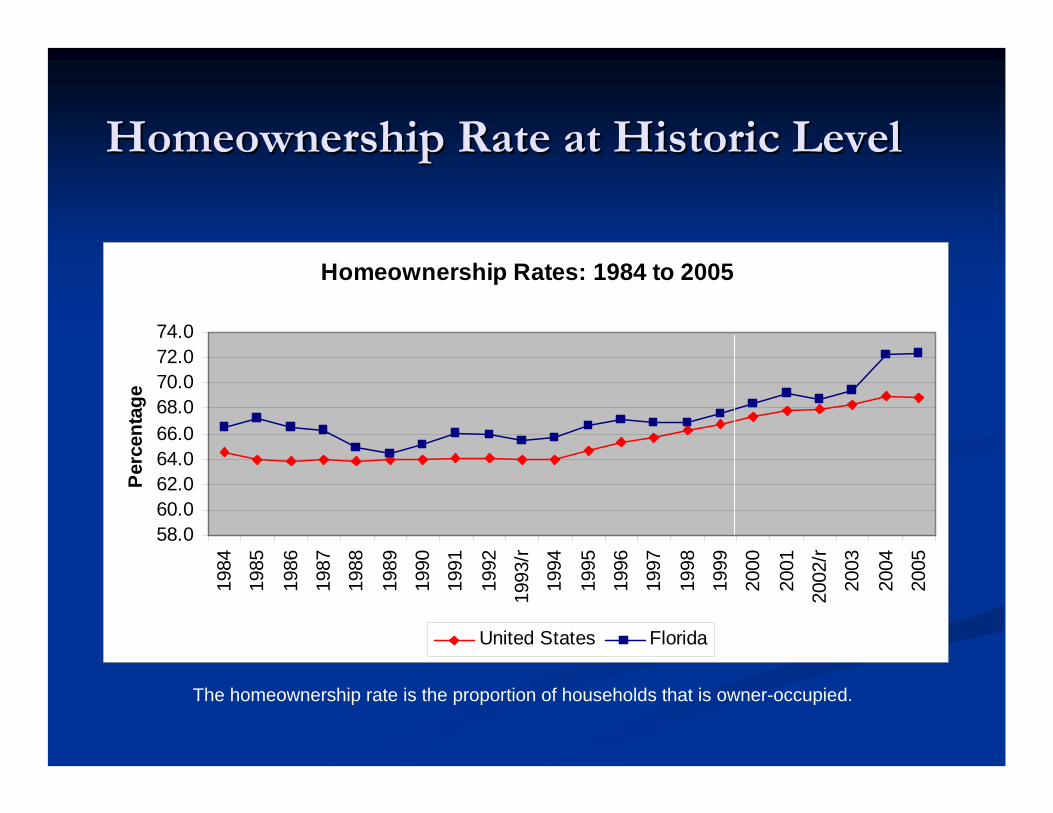
Homeownership Rate at Historic LevelHomeownership Rate at Historic Level
The homeownership rate is the proportion of households that is owner-occupied.
Homeownership Rates: 1984 to 2005
58.060.062.064.066.068.070.072.074.0
1984
1985
1986
1987
1988
1989
1990
1991
1992
1993
/r
1994
1995
1996
1997
1998
1999
2000
2001
2002
/r
2003
2004
2005
Perc
enta
ge
United States Florida

Rental Supply is High, but Beginning to TightenRental Supply is High, but Beginning to Tighten
The rental vacancy rate is the proportion of the rental inventory that is vacant.
Rental Vacancy Rates
0.02.04.06.08.0
10.012.014.0
1986
1987
1988
1989
/r
1990
1991
1992
1993
/r
1994
1995
1996
1997
1998
1999
2000
2001
2002
/r
2003
2004
2005
United States Florida

Historically Low Interest RatesHistorically Low Interest Rates
Monthly Mortgage Rate: 1970 to 2005
0
2
4
6
8
10
12
14
16
18
1970
1971
1972
1973
1974
1975
1976
1977
1978
1979
1980
1981
1982
1983
1984
1985
1986
1987
1988
1989
1990
1991
1992
1993
1994
1995
1996
1997
1998
1999
2000
2001
2002
2003
2004
2005
Inte
rest
Rat
es

Mortgages and ForeclosuresMortgages and Foreclosures
The recent use of speculative financing arrangements is making The recent use of speculative financing arrangements is making Floridians particularly vulnerable to interest rate risks.Floridians particularly vulnerable to interest rate risks.Of the total mortgages written in Florida in 2004, over 30% wereOf the total mortgages written in Florida in 2004, over 30% wereexotic mortgages, such as interestexotic mortgages, such as interest--only. 2005 was even higher.only. 2005 was even higher.Exotic and Exotic and subprimesubprime mortgages are more apt to default mortgages are more apt to default (loosened lending standards).(loosened lending standards).First wave of rate resets and repayments of principal are hittinFirst wave of rate resets and repayments of principal are hitting g now.now.When the real estate market was hot, people in trouble could selWhen the real estate market was hot, people in trouble could sell l or refinance using increased equity from appreciation or refinance using increased equity from appreciation –– those those options are evaporating.options are evaporating.The number of foreclosures in Florida is rising The number of foreclosures in Florida is rising –– the number of the number of homes in some stage of foreclosure is up 62% compared to the homes in some stage of foreclosure is up 62% compared to the nationnation’’s 53% (years 53% (year--overover--year).year).FloridaFlorida’’s 16,533 homes in foreclosure leads all states.s 16,533 homes in foreclosure leads all states.

What is affordability?What is affordability?
Calculations are somewhat arbitrary because Calculations are somewhat arbitrary because they are based on what households they are based on what households ‘‘shouldshould’’ pay pay for housing.for housing.Most Most ‘‘acceptedaccepted’’ rule (used by HUD) is that rule (used by HUD) is that spending more than 30% of household income spending more than 30% of household income on housing implies that housing is not on housing implies that housing is not affordable.affordable.Florida uses a similar definition.Florida uses a similar definition.Economists use Economists use ‘‘revealed willingness to pay,revealed willingness to pay,’’that is, an observation of what people are that is, an observation of what people are actually paying. actually paying.

Affordability of OwnerAffordability of Owner--Occupied MarketOccupied Market
National Association of RealtorsNational Association of Realtors’’ Housing Housing Affordability Index measures whether a typical Affordability Index measures whether a typical family could qualify for a mortgage loan on a family could qualify for a mortgage loan on a typical home. (median family income ~ mediantypical home. (median family income ~ median--priced, existing singlepriced, existing single--family home ~ 20% family home ~ 20% downpaymentdownpayment ~ qualifying ratio of 25%)~ qualifying ratio of 25%)100 = exactly enough income; greater than 100 100 = exactly enough income; greater than 100 = more than enough income.= more than enough income.It has been declining since 2003.It has been declining since 2003.In July, the Index was 102.8 or 102.8% of the In July, the Index was 102.8 or 102.8% of the income needed.income needed.

Housing Affordability IndexHousing Affordability Index
Housing Affordability Index: 1970 to 2005
0.020.040.060.080.0
100.0120.0140.0160.0180.0
1970
1971
1972
1973
1974
1975
1976
1977
1978
1979
1980
1981
1982
1983
1984
1985
1986
1987
1988
1989
1990
1991
1992
1993
1994
1995
1996
1997
1998
1999
2000
2001
2002
2003
2004
2005

Applying the Index to FloridaApplying the Index to Florida
Median Sales Price (July)Median Sales Price (July) $250,800$250,80020% Down20% Down -- 50,16050,160Amount to be FinancedAmount to be Financed $200,640$200,640
Median Household Income*Median Household Income* $ 45,736$ 45,73625% Qualifying Ratio25% Qualifying Ratio $182,944$182,944ShortfallShortfall $ 17,696$ 17,696*EDR Estimation for July*EDR Estimation for July

Affordability of Rental MarketAffordability of Rental Market
Renter households, especially the young and the poor, are Renter households, especially the young and the poor, are spending a greater portion of income on housing than they spending a greater portion of income on housing than they did 10 and 20 years ago.did 10 and 20 years ago.As high interest rates and lower affordability continue to As high interest rates and lower affordability continue to crowd out firstcrowd out first--time homebuyers, vacancy rates in the time homebuyers, vacancy rates in the apartment rental market will contract. Both increased apartment rental market will contract. Both increased demand and dwindling supply will push rental rates higher. demand and dwindling supply will push rental rates higher. An August survey of rental market builders reported rising An August survey of rental market builders reported rising occupancy rates, rising rents, and increased traffic at all occupancy rates, rising rents, and increased traffic at all classes of rental apartments. classes of rental apartments. NAR expects the average rent to increase 4.8% this year, up NAR expects the average rent to increase 4.8% this year, up markedly from 2.9% last year.markedly from 2.9% last year.

Cost DriversCost Drivers
Continuing supply shortages, such as cement, steel, wall Continuing supply shortages, such as cement, steel, wall board and brick, have raised prices.board and brick, have raised prices.Land use restrictions, environmental and economic Land use restrictions, environmental and economic impact studies, natural barriers and existing high impact studies, natural barriers and existing high densities in some areas have both lengthened the time densities in some areas have both lengthened the time to build and increased the cost of housing.to build and increased the cost of housing.Actual land shortages in some areas have driven up the Actual land shortages in some areas have driven up the price of land.price of land.New singleNew single--family houses are larger in size and have family houses are larger in size and have more amenities than ever before according to the more amenities than ever before according to the recently released 2005 Survey of Construction data.recently released 2005 Survey of Construction data.Increasing property taxes, insurance and energy bills Increasing property taxes, insurance and energy bills have increased the ongoing cost of housing. have increased the ongoing cost of housing.

Conclusion Conclusion –– Below Trend ActivityBelow Trend Activity
The The demanddemand for housing has dropped, at least partially due to higher for housing has dropped, at least partially due to higher prices and affordability issues.prices and affordability issues.
Interest rates will likely increase, further dampening demand.Interest rates will likely increase, further dampening demand.Recent buying surge likely pulled forward some demand.Recent buying surge likely pulled forward some demand.Speculators / investors are pulling out of the market.Speculators / investors are pulling out of the market.
The The supplysupply of of availableavailable housing has increased, mainly because of the housing has increased, mainly because of the lower demand.lower demand.
Some builders are turning from high end projects to more moderatSome builders are turning from high end projects to more moderate e projects, which will increase supply for certain demographic groprojects, which will increase supply for certain demographic groups.ups.CondoCondo--conversion is turning around, restoring the supply of rental uniconversion is turning around, restoring the supply of rental units.ts.
The construction slowdown will drag down the economy, likely The construction slowdown will drag down the economy, likely dampening wagedampening wage--growth and job creation, and further lowering growth and job creation, and further lowering demand.demand.House prices will fall on lower demand, but remain somewhat propHouse prices will fall on lower demand, but remain somewhat propped ped up by continued population growth, strong cost factors and tendeup by continued population growth, strong cost factors and tendencies ncies to be to be ‘‘sticky downward.sticky downward.’’
Risks to FloridaRisks to Florida’’s Economys Economy
Housing Bust or more serious market Housing Bust or more serious market contraction than currently forecast.contraction than currently forecast.Significant foreclosures or forced sales Significant foreclosures or forced sales (dumping).(dumping).Reduced consumer spending arising from Reduced consumer spending arising from ‘‘payment shockpayment shock’’ associated with exotic financing associated with exotic financing and from the loss of the wealth effect eroding and from the loss of the wealth effect eroding the economy more than anticipated the economy more than anticipated (recessionary).(recessionary).