floating lng: origins and future impact on the lng industry€¦ · with relatively minor...
TRANSCRIPT

Floating LNG: Origins and Future
Impact on the LNG Industry
SPE Gulf Coast Region
Ing. Paul Sullivan SVP Global LNG + FLNG - Worley Parsons
13th July 2016

WP LNG Centres
Perth LNG Liquefaction,
Melbourne
LNG Containment system,
Mooring System and FSRU
Singapore
FSRU/FLNG , Regas terminals
London/Teesside LNG Liquefaction,
FLNG, Regas Terminals
Houston
LNG Process I&E
Mumbai HVE Regas Terminals
Beijing LNG
Liquefaction ,
Vancouver
LNG Marine I&E
Brisbane LNG Improve

Worley Parsons LNG/FLNG Experience
3 14-Jul-16

The Origin of the Concept
4 14-Jul-16
Floating LNG (FLNG) was conceived as a means of
developing stranded gas reserves offshore where pipelines
became uneconomic, either by reason of distance or
available reserves.
The early concepts were developed along these lines but in
the process the other economic benefits came to light.
These were controlled yard type construction versus stick
built onshore projects with very high costs and poor
schedule outcomes in isolated onshore locations.
Ultimately the potential for redeployment after field depletion
with relatively minor modifications associated with pre-
treatment was another upside.

Early Implementation
5 14-Jul-16
The early developments were definitely true LNG
liquefaction FPSOs and designed along similar lines taking
the raw product including condensate, LPG and gas directly
from seabed wells.
They included turret systems to take the risers and required
condensate removal pre-treatment and fractionation. They
were effectively Onshore LNG plants transferred on to a
barge (a massive one).
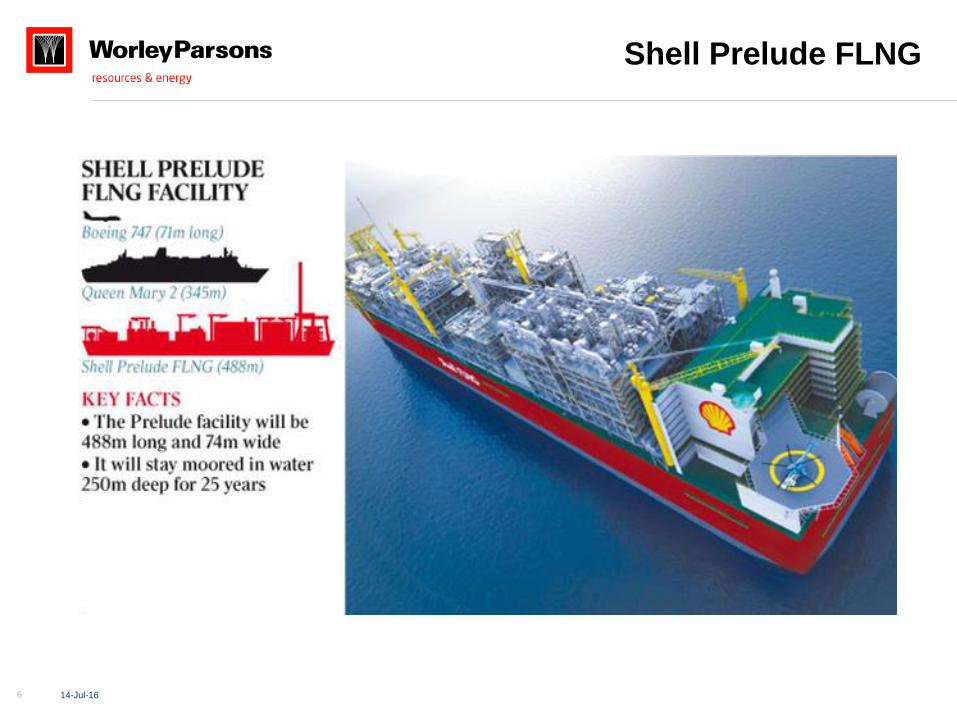
Shell Prelude as the largest FLNG to date is simply
massive. It is the largest floating structure ever built.
Shell Prelude FLNG
6 14-Jul-16

Nearshore Developments
7 14-Jul-16
The parallel development in thinking on liquefaction
technology and the liquefaction plant size “bigger is better
paradigm” began to turn the industry to the consideration
that “mid-scale is more manageable.
Taking the thinking on FLNG hull/storage further the
consideration of building a less complex mid-scale LNG
liquefaction plant on a barge (ship shaped or not) into a
shipyard, appeared to provide an alternative to onshore
development.
The impact on cost paradigms has been immense and this
in turn has influenced thinking on onshore developments
where mid-scale offers good economics and smaller parcels
of LNG to sell.

Liquefaction Process Capacity Ranges LNG Technology Summary
0 1 2 3 4 5 6 7 8 9 10 11
BOC
Cryonorm
Hamworthy
Chicago Bridge& Iron
Linde
Kryopak
Chart Industries
ABB- Niche LNG
APCI - AP-M (For FPSO's)
B&V - Prico
Linde - MFC
Conocco Philips-Optimised Cascade Process
APCI - C3MR or DMR
APCI - C3MR or DMR with SplitMR
APCI - AP-X
Shell - DMR
Shell - PMR
AXENS - LiquefinTM
Million Tonnes Per Annum
Trent
60
Frame 5/
LM2500
Frame 5D,
7 or 9
Frame 5, 6 or
7
Frame 7 or 9
Frame 7 or
9
Frame
9
Frame 7Frame 7 or
9
5 mtpa
3 mtpa
1 to 1.5 mtpa
Sweet spots
LNG Technology Summary
0 1 2 3 4 5 6 7 8 9 10 11
BOC
Cryonorm
Hamworthy
Chicago Bridge& Iron
Linde
Kryopak
Chart Industries
ABB- Niche LNG
APCI - AP-M (For FPSO's)
B&V - Prico
Linde - MFC
Conocco Philips-Optimised Cascade Process
APCI - C3MR or DMR
APCI - C3MR or DMR with SplitMR
APCI - AP-X
Shell - DMR
Shell - PMR
AXENS - LiquefinTM
Million Tonnes Per Annum
Trent
60
Frame 5/
LM2500
Frame 5D,
7 or 9
Frame 5, 6 or
7
Frame 7 or 9
Frame 7 or
9
Frame
9
Frame 7Frame 7 or
9
5 mtpa
3 mtpa
1 to 1.5 mtpa
Sweet spots
At-Shore LNG is at a scale of proven technology and low cost

9 14-Jul-16
Current FLNG Driver Selection
Project LNG
Capacity, MTPA
Driver Selection Total Installed
Power, MW
PFLNG1 1.2 Gas Turbine
Electric motors 70
PFLNG2 1.5 Gas Turbine 78
Exmar NV 0.5 Gas Turbine 25
Shell Prelude 3.6 Steam Turbines Not Known
Floating Liquefaction Systems
At-Shore LNG has access to a wide range of proven technologies for mid scale production

Nearshore FLNG
10 14-Jul-16
The nearshore concept
can take the form of a
jetty head as shown
here or could be a
spread mooring with
no jetty.
The next slides show various configurations for various
water depths depending on location.

Mooring Systems
11 14-Jul-16
Disconnectable Buoy Mooring
Soft Yoke Mooring
• FLNG is able to disconnect and sail away
from site
• Suitable for water depth over 55m
• FLNG moored to site; can weathervane to
prevailing weather conditions
• Suitable for water depth 20m – 40m

What is At-Shore LNG ?
At-Shore LNG is a further refinement of Nearshore FLNG and uses much of the
same topside building blocks and configuration.
The key cost improvements reside in the simplification of the barge concept to
reflect the immediate proximity to land and the benign met-ocean environment.
It also facilitates the potential to either bargeside or landside, elements of the
facility.
An At-Shore LNG unit is depicted in the next slide but is essentially an
integrated LNG facility on one unit.
It comprises an 8 module facility to include all pre-treatment, utilities/power and
3 liquefaction units.
It utilises the lowest cost fabrication concept for LNG storage in a barge concept
which considerably reduces material requirements.
12 14-Jul-16

June 2016
BAMBERTON
SHORE LINE
LNG
CARRIER
LIQUEFA
CTION
TRAIN 1
LIQUEFACTI
ON TRAIN 2
LIQUEFACTI
ON TRAIN 3
FLARE
DRUMS
BOG GAS
& END
GAS
ACID GAS
REMOVAL
DEHYDRAT
ION LNG
OFFLOADING
ARMS
UTILITIES
POWER
GENERATOR
S
FLAR
E
LNG
TANK
VENTS
CONTROL
ROOM / DAY
ROOMS
LAYD
OWN
AREA
LAYDO
WN
AREA
POWE
R
CABL
ES
Schematic: At-Shore LNG Facility
AT-SHORE LNG FACILITY – MALAHAT CANADA

What are the Key Differences for At-Shore LNG ?
14 14-Jul-16

15 14-Jul-16
What are the Key Differences for At-Shore LNG ?

LNG plants whether At-Shore or Onshore have certain common
characteristics:
Feedgas Supply
Gas Pre-Treatment
LNG Liquefaction
Infrastructure
16 14-Jul-16
LNG Plant Building Blocks

FLNG – Typical Cost Components
17 14-Jul-16
Topsides & Hull Make Up over 75% of Total Cost

The original onshore LNG conversions in the USA were based around
existing LNG import plants with all of the pipeline infrastructure in place.
This was a considerable benefit to those projects as it gave a schedule
and cost advantage over greenfield projects where the new pipelines
have to be permitted and installed.
New Onshore and Nearshore projects in the US Gulf Coast will need
new pipeline connections for gas. This can be quite extensive involving
multiple pipeline connections for guaranteed gas availability
At-Shore LNG facilities will need new pipeline connections for gas (from
existing and new infrastructure) and as such are somewhat comparable
to new USGC onshore projects.
18 14-Jul-16
Feedgas Supply Comparison

19 14-Jul-16
LNG Vessels have grown in size over the decades driven by a number of factors including the demand for a clean energy source and the infrastructure and technologies to support this growth.
At-Shore LNG is expected to be able to accommodate all ship sizes (with the exception of Q-Max)
LNG Shipping – Wide Service Range

LNG/FLNG EPC Liquefaction costs At-Shore LNG – Artists Rendering

FID Readiness Cost Estimate
Trending reductions in cost over the last two years are highly dependent on the state
of the shipbuilding/fabrication market in Asia for the At-Shore projects.
Supply chain softness in cryogenic equipment and materials supports the reducing
cost trend.
The cost profile for Onshore LNG plants in the USGC is more likely to see upward
pressure in costs, particularly for labour, subcontractor services and locally supplied
materials like concrete, over the next 2-3 years due to the overheated construction
market and labour shortages.
The issue of FID readiness is a major consideration at present and a story of
continuing vigilance by all LNG project developers, in order to capture the current
weakness in the shipbuilding/fabrication and cryogenic supply chain.
21 14-Jul-16

US Gulf Coast Onshore LNG
US Gulf Coast LNG World Class Onshore project costs have been heavily influenced by
the availability of Brownfield locations with most required permits and existing
infrastructure.
Their costs when taking into account the value of sunk cost infrastructure like storage
and marine facilities, are in the $600 to $800 per tpa range.
USGC mid-scale Onshore Greenfield Projects are claimed to be in the $500 to $700 per
tpa range.
The main risk and uncertainty surrounding mid-scale USGC Onshore project costs are as
follows:
Storage capacity of terminals and their adequacy for delayed shipping.
Hurricane and storm disruption.
Shortage of craft labour on the USGC.
Rapid increase in labour costs on the USGC.
22 14-Jul-16
23 14-Jul-16
North American At-Shore LNG
North American mid-scale At-Shore LNG Projects are claimed to be in the $500 to
$700 per tpa cost although none have been advanced as far as the mid-scale
onshore plants in terms of FEED development, so these figures carry a greater
degree of uncertainty.
On that basis North American At-Shore and USCG Onshore would appear to
have a comparable costs.
The At-Shore LNG Projects will have an infrastructure and marine component
amounting to circa 10% of the project cost. The labour content in this will be in the
20% to 30% range. Labour is really the only major variable in the project cost

Competition: Onshore and At-Shore
24 14-Jul-16
Current progress shows a capex cost for facility in the range of $500 - $700 per tonne of LNG
production
$500 - $700/Tonne

Market constraints on new developments
The primary constraint on new LNG developments, whether
Onshore or At-Shore is the market. Currently there is an
overhang of supply globally which is unlikely to diminish
before 2022 or thereabouts.
This does not mean that new projects will not take FID, but
that this is only likely for vertically integrated projects.
The byword in the industry is FID Ready, as the weakness
in the contracting and fabrication market will be mopped up
fairly quickly once the supply overhang gets down to a
manageable level.
25 14-Jul-16

Key Point Conclusion
At-Shore LNG approach enables mid-scale modularisation to manage
cost and schedule and compete with Onshore.
Pipeline specification Feedgas reduces processing requirements
compared to conventional FLNG
Lower Capex projects will be available for the next few years due to the
softness in the industry, but will quickly readjust when the trend goes
positive.
Current progress shows a capex cost for mid-scale liquefaction
facilities in the range of $500 - $700 per tonne of LNG production
26 14-Jul-16

Questions / Feedback