flexibility from residential power consumption: a new ... · flexibility from residential power...
TRANSCRIPT

Flexibility from residential power consumption: a new market Filled with opportunities
FINAL rEPOrt


EnergieKoplopers
Flexibility from residential power consumption: a new market filled with opportunities
Final report

Acknowledgements
this project would not have been possible without the participation of 203 enthusiastic households in the “Stad van de Zon” district of the Dutch Municipality of Heerhugowaard. the project team would like to express its gratitude to all participants for helping to shape the energy system of the future, and to the Municipality of Heerhugowaard for facilitating the project.
the project was realised by Alliander, Essent, IBM, ICt Group, NrG031, and the Municipality of Heerhugowaard in addition to the 203 households. the project was subsidised by the Dutch Ministry of Economic Affairs’ Innovation Programme Intelligent Grids (IPIN).
Arnhem, November 2016
Contact details Alliander NV Postbus 50 6920 AB Duiven the Netherlands
www.energiekoplopers.nl
For more information please contact [email protected]
Copyright All rights reserved. Nothing from this publication may be duplicated, stored in an automated data file or made public in any form or in any way, whether electronic, mechanical, through photocopying, recording or through any other means, without the authors’ prior written permission.

Foreword
It is already over three years since the Energy Agreement for sustainable growth in the Netherlands was signed. I am delighted to see that the Netherlands is working hard to realise the Energy Agreement objectives. the energy transition is really taking off in the Netherlands. However, this energy transition also introduces new challenges, namely the reliability of our energy system. EnergieKoplopers (“Energy Frontrunners”) aims to offer a solution for this challenge.
EnergieKoplopers in Heerhugowaard is a project demonstrating how decentral flexibility can fulfil an important role in the future energy system. But the project is much more. It is also a fantastic example of an initiative in which companies, consumers and government work together to prepare for a sustainable and decentralised energy system. this is important for me: change is not something you do alone.
the EnergieKoplopers participants, the consortium, and all other parties involved, should be proud of the results of their project. together, they have contributed to creating a climate for sustainable growth in the Netherlands. It is hoped that this example will inspire more companies, consumers and governmental organisations to make their contribution too. As I stated before, change is not something you do alone.
I would like to make one final comment. I urge everyone who feels inspired, to continue the work of EnergieKoplopers. We can only make our country the Koploper (“Frontrunner”) of the energy world if we continue working on this.
the Hague, 23 October 2016
Ed Nijpels Chair of the Energieakkoord (Dutch Energy Agreement) Safeguarding Committee
“energiekoplopers is a fantastic example of an initiative in which companies, consumers and government work together to prepare for a sustainable and decentralised energy system. this is important for me: change is not something you do alone.”

the project had 203 participants, of which:
183 households with solar panels (with an average generation of 6,7 kWh per day),
95 households with a PV-switch,
49 households with a heat pump,
45 households with an electric boiler,
and 14 households with a fuel cell.
Facts and figures
Because of the application of flexibility:
15 power outages were prevented,
and supply and demand of flexibility was balanced 20% of the time.
in order to achieve this:
around 0,92 kWh of flexibility per day per household was traded,
7% of the time the boilers were automatically switched on,
8% of the time the heat pumps were automatically switched off,
4% of the time the solar panels were automatically switched off,
35% of the time the fuel cells were automatically controlled.
also, the project:
has had 28 times press attention at the moment of going live,
received 13 working visits
and reached 203.414 consumers through a Facebook campaign.
the average response rate of the three surveys was 95%
and the project team has taken 85 interviews.

EnergieKoplopers
Summary
this summary is also available as an animated video.
introduction the Netherlands is working towards a sustainable energy supply. More and more electricity is being generated from solar and wind, and this is increasingly taking place decentrally instead of centrally. What is more, sustainable and environmentally-friendly electrical equipment, such as electric heat pumps and electric vehicles, are becoming more common.
However, these developments can result in high costs for the energy system. Firstly, peaks in the grid can occur that the local grid is unable to cope with. For example, the electrification of our heating can cause significant peak demand in the evening. And vice versa, local generation through solar panels can result in considerable feed-in peaks at noon. the traditional method to solve this is grid reinforcement, but this is expensive. Secondly, supply for and demand of electricity is becoming more difficult to predict because of the fluctuating character of solar and wind power. this can sometimes result in moments of energy shortage, and sometimes in moments of energy surplus. to cope with these two problems, the electricity system needs to become more flexible.
One solution for this is for end users of energy (Prosumers) to be flexible in their electricity consumption, for example by switching on an electric boiler when it is sunny. the flexibility created by this can be collected by an Aggregator and is offered via a separate market for flexibility to a Distribution System Operator (DSO) or Balance responsible Party (BrP). these parties can use this flexibility to resolve problems in the energy system. the flexibility market is described by the Universal Smart Energy Framework (USEF).
energiekoplopers has demonstrated the successful operation of the flexibility market the EnergieKoplopers project in Heerhugowaard tested a USEF flexibility market for the first time. to this end, smart appliances were installed at 203 households, which enabled flexible electricity consumption. the smart appliances were automatically controlled by a smart It system. the project has shown that the USEF flexibility market works: the system helps resolve the future problems in the energy system, and value is created for all parties that play a role in a USEF flexibility market.
Prosumer Aggregator€
€
€
FLEXIBILITY
UFLEX
UFLEX
DSO
BRP
Figure 1: the USEF flexibility market unlocks decentralised flexibility
Prosumer
DSO
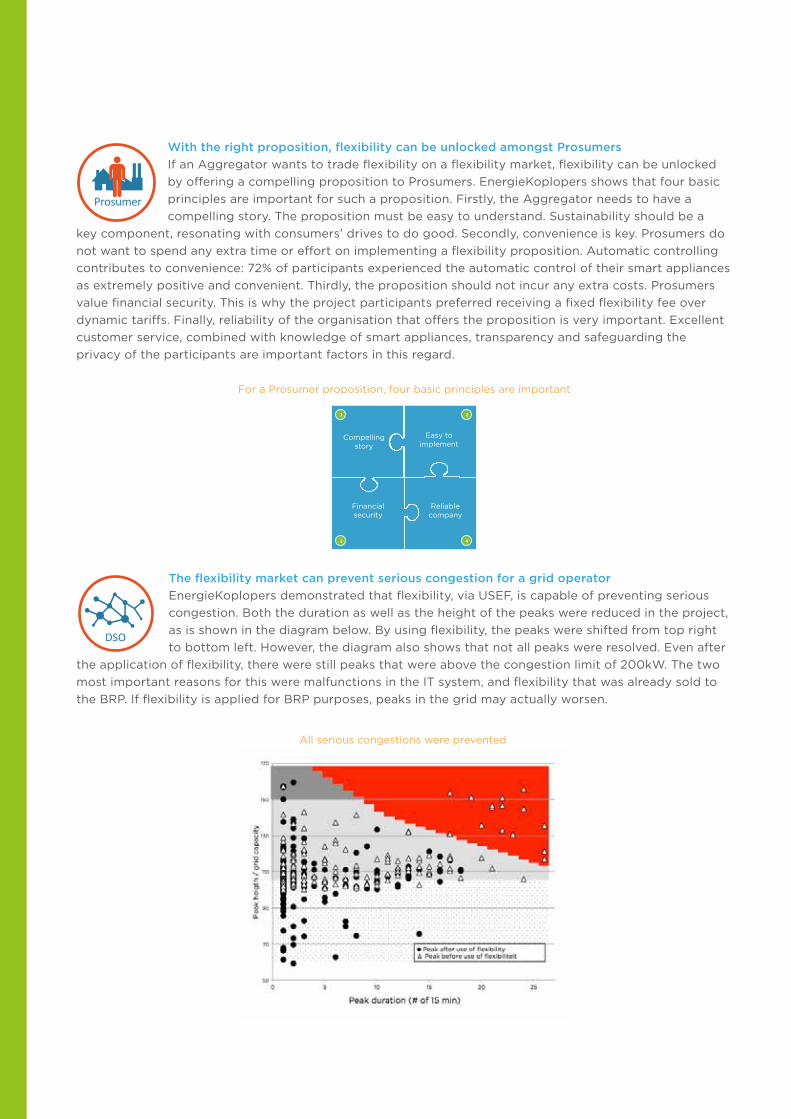
with the right proposition, flexibility can be unlocked amongst prosumers If an Aggregator wants to trade flexibility on a flexibility market, flexibility can be unlocked by offering a compelling proposition to Prosumers. EnergieKoplopers shows that four basic principles are important for such a proposition. Firstly, the Aggregator needs to have a compelling story. the proposition must be easy to understand. Sustainability should be a
key component, resonating with consumers’ drives to do good. Secondly, convenience is key. Prosumers do not want to spend any extra time or effort on implementing a flexibility proposition. Automatic controlling contributes to convenience: 72% of participants experienced the automatic control of their smart appliances as extremely positive and convenient. thirdly, the proposition should not incur any extra costs. Prosumers value financial security. this is why the project participants preferred receiving a fixed flexibility fee over dynamic tariffs. Finally, reliability of the organisation that offers the proposition is very important. Excellent customer service, combined with knowledge of smart appliances, transparency and safeguarding the privacy of the participants are important factors in this regard.
For a Prosumer proposition, four basic principles are important
1 2
43
Reliable company
Easy to implement
Compelling story
Financial security
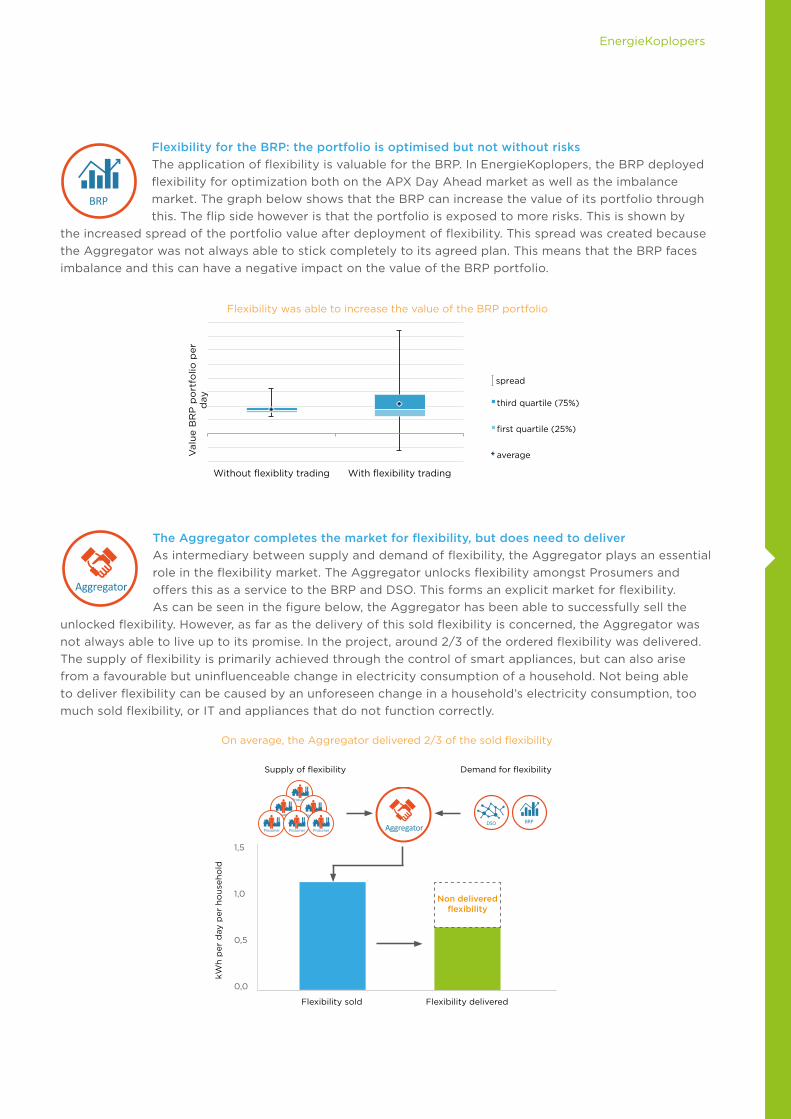
the flexibility market can prevent serious congestion for a grid operator EnergieKoplopers demonstrated that flexibility, via USEF, is capable of preventing serious congestion. Both the duration as well as the height of the peaks were reduced in the project, as is shown in the diagram below. By using flexibility, the peaks were shifted from top right to bottom left. However, the diagram also shows that not all peaks were resolved. Even after
the application of flexibility, there were still peaks that were above the congestion limit of 200kW. the two most important reasons for this were malfunctions in the It system, and flexibility that was already sold to the BrP. If flexibility is applied for BrP purposes, peaks in the grid may actually worsen.
All serious congestions were prevented
BRP
Aggregator
EnergieKoplopers
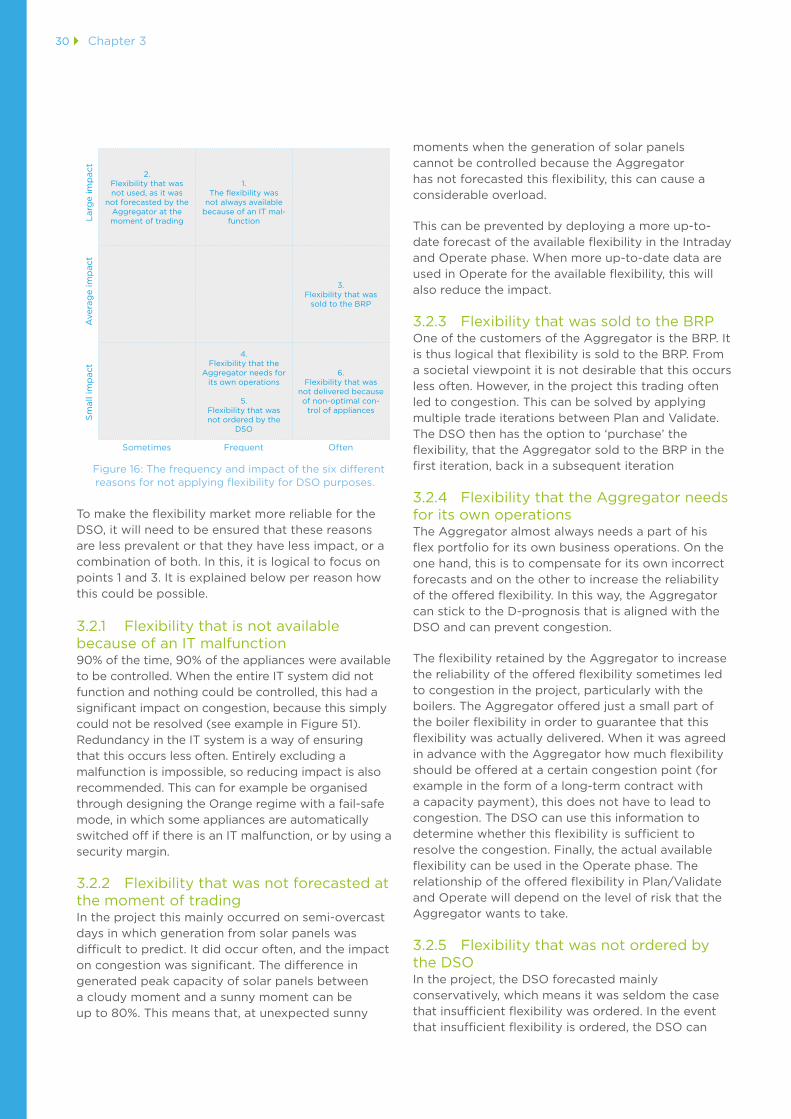
Flexibility for the Brp: the portfolio is optimised but not without risks the application of flexibility is valuable for the BrP. In EnergieKoplopers, the BrP deployed flexibility for optimization both on the APX Day Ahead market as well as the imbalance market. the graph below shows that the BrP can increase the value of its portfolio through this. the flip side however is that the portfolio is exposed to more risks. this is shown by
the increased spread of the portfolio value after deployment of flexibility. this spread was created because the Aggregator was not always able to stick completely to its agreed plan. this means that the BrP faces imbalance and this can have a negative impact on the value of the BrP portfolio.
Flexibility was able to increase the value of the BrP portfolio
Without flexiblity trading With flexibility trading
Val
ue
BR
P p
ort
folio
per
d
ay
third quartile (75%)
first quartile (25%)
average
spread
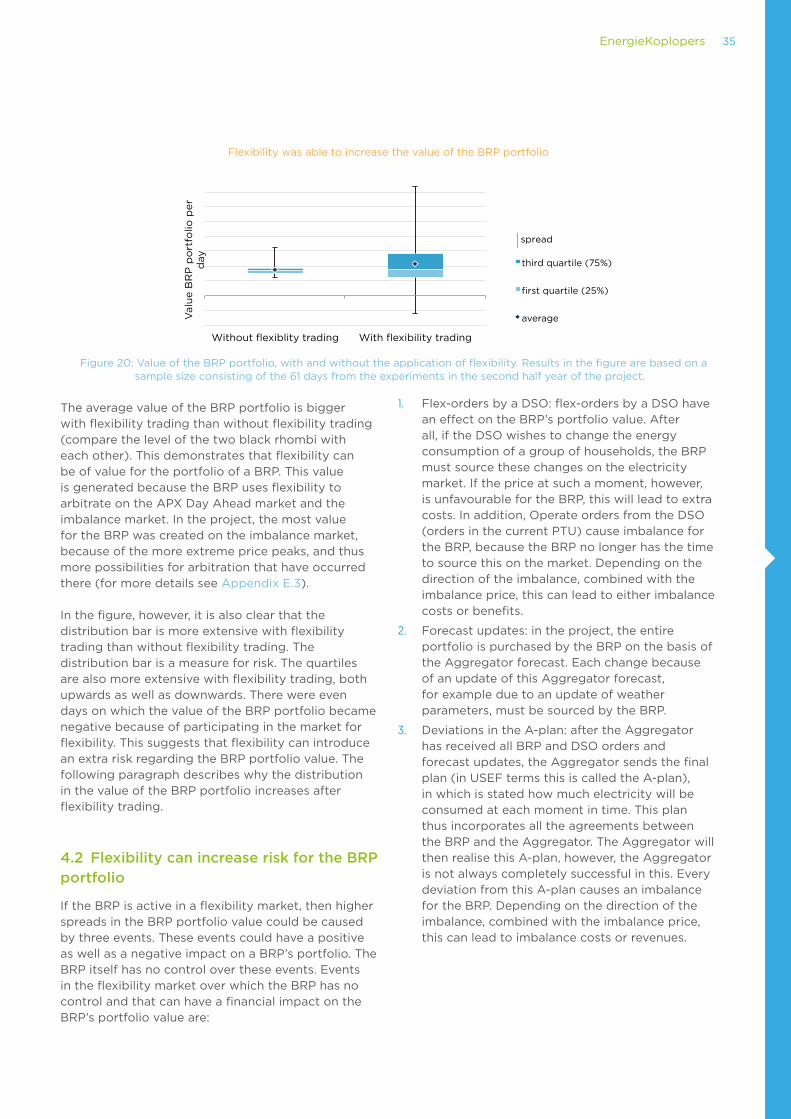
the aggregator completes the market for flexibility, but does need to deliver As intermediary between supply and demand of flexibility, the Aggregator plays an essential role in the flexibility market. the Aggregator unlocks flexibility amongst Prosumers and offers this as a service to the BrP and DSO. this forms an explicit market for flexibility. As can be seen in the figure below, the Aggregator has been able to successfully sell the
unlocked flexibility. However, as far as the delivery of this sold flexibility is concerned, the Aggregator was not always able to live up to its promise. In the project, around 2/3 of the ordered flexibility was delivered. the supply of flexibility is primarily achieved through the control of smart appliances, but can also arise from a favourable but uninfluenceable change in electricity consumption of a household. Not being able to deliver flexibility can be caused by an unforeseen change in a household’s electricity consumption, too much sold flexibility, or It and appliances that do not function correctly.
On average, the Aggregator delivered 2/3 of the sold flexibility
0,0
0,5
1,0
1,5
kWh
per
day
per
ho
useh
old
Flexibility sold Flexibility delivered
Supply of flexibility Demand for flexibility
Non delivered flexibility
DSO BRPAggregator
Prosumer
Prosumer Prosumer
Prosumer Prosumer Prosumer

the flexibility market needs a market model such as useF the flexibility market in EnergieKoplopers was designed according to the USEF market principles. One of the most important USEF principles concerns an integrated market approach in which the interests of both the DSO as well as the
BrP are taken into consideration. the USEF flexibility market enables the BrP and DSO to help each other at times. However, they can also conflict with one another. EnergieKoplopers has shown that both situations can occur in practice. the figure below shows that most of the time the BrP and DSO did not impact each other. Both parties even helped each other 18% of the time. However there were conflicting interests some 16% of the time in the project. EnergieKoplopers demonstrates that conflicting interests can occur, which underlines the fact that the integrated approach that USEF has chosen in its design is the correct approach.
the BrP and DSO had conflicting interests 16% of the time
16%
18% 66%
Flex-orders DSO and BRP in opposite direction Flex-orders DSO and BRP in same direction No interaction

EnergieKoplopers
table of contents
Acknowledgements 4 Foreword 5 Facts and figures 6 Summary 7
1 energiekoplopers in a nutshell 13
2 with the right proposition, flexibility can be unlocked amongst prosumers 16 2.1 the Aggregator needs to have a compelling story 18 2.2 Convenience is an important basic principle 19 2.3 A flex proposition should not result in any extra costs or financial risk 20 2.4 the organisation that offers a flex proposition should be very reliable 21
3 a flexibility market can prevent serious congestion for a grid operator 23 3.1 through the USEF flexibility market, flexibility was able to prevent serious congestion 24 3.2 Not all congestion could be resolved. there are six reasons why the required flexibility was not delivered to the DSO. 29 3.3 Flexibility trading by the BrP increases peak loads 31
4 Flexibility for the Brp: value but also risk 33 4.1 Flexibility increases the value of the BrP portfolio 34 4.2 Flexibility can increase risk for the BrP portfolio 35
5 the aggregator completes the market for flexibility, but does need to deliver 38 5.1 the Aggregator brings supply and demand of flexibility together 39 5.2 the Aggregator delivered 2/3 of the sold flexibility 40
6 the flexibility market needs a market model such as useF 44 6.1 An integrated market model such as USEF is required to represent all interests 45 6.2 A market model must assign responsibilities in the flexibility market in such a way that risks are shared fairly 46 6.3 A market model with multiple trading moments is desirable 47
7 outlook: how to continue? 48

appendix a to F 51
appendix a definition list 52
appendix B the useF flexibility market 54 B.1 the USEF market model 54 B.2 Flexibility trading according to USEF 55 B.3 USEF operating regimes 56
appendix C design of prosumer research 57 C.1 Design of qualitative research within the trial 59 C.2 Design of quantitative research within the trial 61 C.3 Design of qualitative research outside the trial 61 C.4 Design of quantitative research outside the trial 63
appendix d design of data research 64 D.1 Various experiments during a year of research 64 D.2 Chosen method of flexibility trading according to USEF 64 D.3 Parameters during the experiments 67 D.4 Flexibility trading by the BrP 70 D.5 Business case calculation by the DSO 71
appendix e detailed results 73 E.1 DSO business case 73 E.2 Six reasons why flexibility is not always delivered to the DSO 78 E.3 BrP flexibility trading results 82
appendix F project preparation 85 F.1 recruitment of participants 85 F.2 Hardware and It 86

1 energiekoplopers in a nutshell

14 Chapter 1
the EnergieKoplopers project is a smart grid project, investigating how decentralised flexibility from households can be used through a flexibility market to ease the energy system. decentralised flexibility as a solution for future problems Decentralised flexibility is seen as a means to cope with the problems associated with the transition1 to a sustainable energy system. Firstly, the predicted growth of solar panels, electric vehicles and heat pumps leads to higher peaks in the grid. Decentralised flexibility can reduce these peaks. Secondly, it is becoming increasingly difficult to balance the supply and demand of energy, particularly as wind and solar supply becomes more difficult to predict. Flexibility on the demand side makes it possible to respond quickly to fluctuations in supply and demand.
smart appliances are controlled automatically by a smart energy system In the project, the flexibility came from 203 smart appliances that were controlled automatically by a smart energy system. the smart energy system predicted supply and demand of electricity and regulated this using smart appliances. 45 electric boilers, 49 heat pumps, 95 PV-switches and 14 fuel cells (of which 9 were virtual) were installed at participants’ premises. these appliances were controlled automatically: participants did not need to do anything themselves and retained the same level of comfort. Each participant could also gain insight into the system via a user portal, a smart meter and a smart thermostat in the home.
Flexibility becomes valuable if this is deployed in a flexibility market During the project, the flexibility was traded on a flexibility market. the Universal Smart Energy Framework (USEF) market regulations were applied for this. the Aggregator plays a crucial role in such a flexibility market. this new role collects flexibility amongst Prosumers and offers this as a service to the Balance responsible Party (BrP) and Distribution
1 In recent years, the Netherlands has moved towards a sustainable and low-carbon energy supply. In the Energy Agreement (2013) over 40 organisations, including businesses, government, environmental organisations and financial institutions, made long-term agreements to reduce Dutch CO2 emissions by 20% in 2020 compared to 1990.
System Operator (DSO). the BrP uses the flexibility to manage the balance between electricity supply and demand. For the DSO (grid operator), flexibility is valuable in reducing peaks in the grid. In the flexibility market, the amount of flexibility is traded in advance (USEF Plan-Validate phases) based on predictions, and delivered through real-time control of the smart appliances (USEF Operate phase). the calculation of how much flexibility is actually delivered (USEF Settle phase), is done afterwards, using smart meter data.
Prosumer Aggregator€
€
€
FLEXIBILITY
UFLEX
UFLEX
DSO
BRP
Figure 2: the USEF flexibility market unlocks decentralised flexibility
Five research areas the research in the project focused on five research areas:
1. Prosumer: how does a smart energy system meet the needs and experiences of households?
2. DSO: to what extent is flexibility through a flexibility market an alternative for grid reinforcement?
3. BrP: how can flexibility through a flexibility market increase the value of a BrP portfolio?
4. Aggregator: what value does an Aggregator add by matching supply and demand of flexibility?
5. USEF: how does the USEF flexibility market work in practice?
prosumer research was conducted in various ways A mix of research methods was used for the Prosumer research: qualitative and quantitative research, both within and outside the trial, and a mix of traditional and modern test methods. Qualitative research (interviews, participant sessions) was required to obtain understanding of Prosumer experiences, whereas quantitative research (surveys,
1 EnergieKoplopers in a nutshell

readers who are not familiar with the useF terminology are recommended to first read appendix B this appendix briefly outlines the useF flexibility market and terms such as plan/Validate and orange regime are described.
15EnergieKoplopers
proposition testing using Facebook campaign) was used to then verify these insights. research outside the trial, amongst a random group of potential Prosumers, was needed because the trial formed a bias amongst participants, for example because of the free use of smart appliances. Finally, as well as traditional research methods, which were used to demonstrate fact-based insights and to make these insights quantifiable, modern test methods (Lean Startup) were also applied. these were used to test a proposition for Prosumers in a short time period, in which a good impression was formed of which propositions were attractive to Prosumers and why.
aggregator, Brp, dso and useF research, based on data analysis A huge amount of data has been generated in the project, mainly from the smart appliances, the smart meters and during the flexibility trading. the smart appliances and smart meters were read every 5 minutes. Flexibility trading took place twice a day, namely 1x Day Ahead and 1x Intraday, and involved a time unit of 15 minutes2. the smart energy system was put into operation on the basis of these data: first a prediction was made by the It system of how much flexibility was available per day, then these amounts were traded in the flexibility market and ultimately the smart appliances were controlled in order to deliver the ordered flexibility.
Various experiments were implemented during the course of the 1-year project. For example, in one experiment, all flexibility was used only for the DSO and in another experiment, only for the BrP. Also several parameters were varied in the experiments based on which flexible trading could take place, such as congestion limit and flex prices. the conclusions from the Aggregator, BrP, DSO and USEF research were drawn from the analyses of the generated data.
structure of this report the most important results of the five research areas are explained in Chapters 2 to 6, starting with the Prosumer research, Chapter 7 “Outlook” then reflects on the recommendations for future scale-up of a flexibility market. More details about the design of the USEF flexibility market, the research design, the experiments, the recruitment of participants, the It system and the smart appliances can be found in this report’s appendices.
2 one PtU = 15 minutes in the trial

2 with the right proposition, flexibility can be unlocked amongst prosumers

17EnergieKoplopers
In the project, flexibility comes from households. these households are called ‘Prosumers’ in the flexibility market. ‘Prosumer’ is a combination of the words ‘producer’ and ‘consumer’, and refers to people who both produce and consume something. In the energy domain, Prosumer refers to a household that, as well as consuming energy, also generates electricity or flexibility . All participating households in the project are Prosumers, in the sense that they supply flexibility. In addition, a large proportion of the participating households also generate their own solar electricity.
the Prosumer lies at the foundation of the USEF flexibility market, as shown in the figure below. the Prosumer delivers flexibility to the Aggregator, which clusters this flexibility and sells it to the BrP or DSO. the more Prosumers are connected to the Aggregator and the more flexibility these Prosumers make available, the greater the Aggregator’s flex portfolio, and the more effectively the flexibility can be used to reduce peaks in the grid. In practice, this means that flexibility is unlocked by controlling one or more appliances in people’s homes. these appliances are switched on or off at times of peak load (peak supply from solar panels at noon or peak demand in the evening).
Prosumer Aggregator€
€
€
FLEXIBILITY
UFLEX
UFLEX
DSO
BRP
Figure 3: the Prosumer supplies flexibility to the Aggregator
And here lies a challenge: for many prospective Prosumers, having a controllable device installed, or making appliances at home controllable, is a huge step. Firstly, the problem is not top-of mind: Prosumers no do not yet experience any problems with the energy supply and the majority of consumers is unaware of, and not interested in
the issues that peak load will bring in the future3. In addition, an automatically controlled appliance often requires an investment of money and time: not only the time and costs involved in the purchase and installation, but also becoming familiar with often complicated appliances and signing agreements with the Aggregator.
that is why the Prosumer research was set up to answer the following research question: “What elements must a flex proposition (with automatic control of an appliance in the household) entail, in order to unlock flexibility amongst Prosumers by an Aggregator?”
the Prosumer research comprised of a mix of qualitative and quantitative research methods, both amongst actual Prosumers (participants in the trial) as well as prospective Prosumers (wide group of randomly-selected consumers). Appendix C offers a more extensive explanation of the Prosumer research design.
the most important finding in the Prosumer research is that flexibility can be unlocked on a large scale by an Aggregator, if at least four preconditions are met:
• the proposition needs to have a compelling story
• Convenience is an important basic principle
• there should be no financial implications
• the reliability of the organisation offering the proposition is very important.
Each of the above points are addressed in detail in the paragraphs below. the findings amongst the participants (‘within the trial’) and the wider group of consumers (‘outside the trial’) are discussed separately in each paragraph.
2.1 the aggregator needs to have a compelling story
the issue of peak load is a complicated, technical subject for many prospective Prosumers. the project shows that information provision is vital in convincing Prosumers to enter the flexibility market. the Aggregator’s story needs to be compelling, and
3 Energy supply 2015-2050: public research by Motivaction
2 With the right proposition, flexibility can be unlocked amongst Prosumers

18 Chapter 2
should contain three elements:
1. Sustainability has to be the central argument, appealing to people’s need to do something good for the world;
2. Both the problem of peak load as well as the proposition must be explained in a simple and easy to understand way;
3. People who require more information, must be easily able to find additional (technical) information about the appliance operations, the control and the business model.
Within the trial these three elements proved to be very important. During the recruitment of participants, the interviews and co-creation sessions, participants indicated that after ‘cost savings’, ‘the environment’ was their strongest motivator for participating in the trial. Most participants were interested in participation because of the possibility
to contribute to a sustainable energy system.
During the recruitment process (for more details see Appendix F.1) the provision of additional information proved to be important. Awareness for the project was raised by mailing letters and e-mails explaining the setup of the project. Being able to find additional information on the website and the information evenings, however, proved to be a decisive factor for participants to become involved in the project.
Outside the trial, the results were comparable. Surprisingly, contributing to a sustainable energy system proved to be more important than cost saving. these insights are a result of 40 interviews with consumers, in which the drivers for accepting a controllable appliance were investigated. these interviews were conducted using a ‘mock-up’ website, with a test proposition describing a (fictitious) automatically controlled device: the Easy Freeze.
to explain the complicated concept of flexibility to households effectively, the test proposition was made as simple as possible. the Easy Freeze was introduced: a device that can be connected easily to the plug of the freezer. the Easy Freeze switches the freezer on when a lot of sustainable energy is available in the grid. the appetite for participation was tested at the end of the interview. Interviewees
“the information evenings convinced me to participate as there was
ample opportunity to ask questions.”
were told that they were recruited to be a participant in a 3-month demo, and were asked to leave their e-mail address if they were interested in participating.
Figure 4: the Easy Freeze website
the majority of respondents were prepared to participate in the demo, and left their e-mail addresses. they indicated that being able to contribute to a sustainable energy system played a crucial role: in the three rounds in which sustainability was mentioned as an argument, 97% of respondents wanted to participate in the demo. In the round in which sustainability was not mentioned, this percentage fell to 44%. 25% of interviewees also indicated that they wanted to have more information about the technical operation of the device and the business model behind the Easy Freeze.
Also, a Facebook ad campaign (smoke test) was conducted with the two most appealing Easy Freeze
“Oh, the costs stay the same.
We’d like to do something for
the environment so this is just
a small effort to make isn’t
it? I’d certainly do that and
I’d tell people I know about
it too.”
“Where’s the catch? You save money, and you can just forget about it. How does it work? And what is the Easy
Freeze earning model?”
“It should actually
be built into all
freezers.”
“Interesting idea; it’s something very innovative. I really like it. It’s great to see that
there are companies that are concerned about the environment and green electricity.”

19EnergieKoplopers
propositions. this smoke test demonstrated that both propositions scored at or above the benchmark for similar campaigns. this indicates that there is relatively high interest in a flex proposition amongst prospective Prosumers.
2.2 Convenience is an important basic principle
For most consumers, the energy transition is not an urgent issue. there are higher priority issues, both at individual and society level. the majority of Dutch citizens consider that other themes, such as healthcare, should be prioritized higher on the political agenda4. Dutch citizens consider sustainable energy to be important but the threshold for taking action about this is often too high. that is why it is important that the Aggregator makes it as easy as possible for Prosumers to unlock their flexibility:
• Consumers do not want to make extra time available or have to make any effort to unlock flexibility. the easier the proposition is to implement, the greater the flexibility that can be unlocked amongst consumers;
• Automatic control of smart appliances was seen as logical and easy. People wondered whether this would be possible with other devices too;
• Dynamic tariffs for flexibility are not desirable for most consumers: responding to dynamic tariffs implies too big a behavioural change5 even for a group of active and motivated Prosumers.
Within the trial the statement that consumers do not want to free up any time needed some be nuanced. the trial participants did take the time and effort to participate in the trial, have their smart appliance installed and have their flexibility unlocked. the group of trial participants is therefore by definition an extremely motivated group of Prosumers. Insights from this group cannot be extrapolated to the average consumer.
the trial participants are generally very positive about the automatic control of their appliance. the most important reasons for this are the convenience offered by this form of control, and the feeling that they contribute to a sustainable energy supply (see Figure 5).
4 Energy supply 2015-2050: public research by Motivaction.
5 Dynamic tariffs could form the basis of an attractive proposition if an Aggregator combines this with the removal of concerns via automatic control. However, research shows that, if dynamic tariffs aim to bring about a behavioural change, this would only be successful for a limited group.
35% 46%
39% 26%
14% 14%
4% 6% 3% 7% 5% 1%
0%
10%
20%
30%
40%
50%
60%
70%
80%
90%
100%
It makes me feel good to contribute to a sustainable energy system though the
controlling of my device
I find it convenient that my device is controlled automatically, because in this
way I don't have to bother with it
Totally agree Agree Neutral Disagree Totally disagree Don't know/ no answer
Figure 5: Automatic control easy and green
A clear distinction could be made in the research outside the trial. A small group of extremely motivated potential Prosumers was prepared to invest time and effort in a proposition to unlock flexibility, while the majority of consumers wanted to contribute to the energy transition, but only if it did not involve any extra time or effort. the average potential Prosumer prefers to be involved in things other than energy.
Automatic control of an appliance in the home was no problem, for most interviewees. It was actually seen as logical and desirable, and several people immediately asked which other appliances could be controlled automatically. A small number of respondents asked what automatic control would mean for their privacy & data security.
“As long as it doesn’t
affect how my freezer
operates, I don’t mind
automatic control.”
“Oh, I’d also like to have that with
my washing machine, that’s such
an energy-consuming appliance.
And the dryer... or my son’s
computer. Actually all appliances
that are switched on a lot in
households.”
“remote controlling? No problem. there are a lot
of things in the meter box that you can’t control, I just assume that things are done
honestly.”
Automatic controlling of smart devices: easy and green

“Would I buy it? Hmm, I’m
not sure. It’s not that it’s
expensive, but I’d need
to know more about the
advantages. to make an
investment I’d need to be
really interested.”
“that’s a good idea !It’s free and you can just forget about it. And your food stays frozen! I’m certainly interested. the warranty is very important.”
“If I would have to buy it myself, then this would
be a barrier. Even though I think this should not be
the case.”
20 Chapter 2
2.3 a flex proposition should not result in any extra costs or financial risk
In addition to minimising the time and effort for Prosumers, the financial implications should also be kept to a minimum. A small group of Prosumers was prepared to invest in a smart appliance, but the majority lost interest in participation if this meant they had to make an investment, even if the investment was minor.
• Having to make an investment forms a barrier for most Prosumers;
• Cost neutrality (not incurring any costs) turns out to be more important to consumers than the possibility of earning money;
• the financial insecurity associated with dynamic tariffs is an important reason for not wanting these.
Within the trial the interviews and co-creation sessions showed that participants consider compensation for any costs essential (for example if the feed-in tariff for own generation is not received because the solar panels were disconnected). People wanted to contribute to a sustainable energy system, but indicated that this should not cost any extra money.
not interesting
interesting
Plan 2: Dynamic Comparison: stock trade
It can lead to profit
maximization
My wife is at home during the day so we
are flexible I don’t want to tell my kids what (not)
to use at which times
Big risk- no guarantees on the
hight of the fee
Not everybody in the pilot is able to
participate at the same level
I don’t have enough time/ discipline/ energy for this I prefer reading a book
over spending time on energy.
Possibility for net loss
I don’t expect to be flexible enough to profit from this
I prefer security over the earning
potential
Requires a high level of flexibility
of households
I do not like dynamic tarriffs
I like to know where I stand
I work during daytime, so I cannot pick the most
favourable moments to run the laundry
I’m not such a gambler
I spend a lot of time at home, so I can switch on
appliances like the dishwasher or washing
machine
This results in more conscious use of energy
2x 1st choice 8x 3rd choice
Figure 6: residents’ considerations regarding dynamic tariffs
Also outside the trial it was clear that people did not want to pay anything extra. the majority of respondents were prepared to install the Easy Freeze, under the condition that they did not have to pay for it. As soon as they would have to pay (even a small amount), only a small group remained interested. Interestingly, when people were required to pay For most people this cost neutrality played a more important role than the possibility of earning some money with unlocking their flexibility. Although the flex payment was seen as a ‘nice benefit’, this flex payment was not an important driver in participation in the smart energy system.

21EnergieKoplopers
something, they set higher requirements for the proposition: respondents indicated that they wanted to have more insight into the working and results of the appliance. to be able to unlock flexibility amongst a large group of Prosumers, it is thus important that financial barriers are removed.
the smoke test of the two most appealing propositions from the Easy Freeze on Facebook showed that there was no demonstrable preference for the proposition with, or without flex payment.
In addition to cost-neutrality, the pricing for electricity and flexibility plays a role in people’s preparedness to have a controllable appliance in the home. At the start of the project, a choice needed to be made about remuneration for the unlocked flexibility. A co-creation session was organised with the participants, to gain more insight into this topic. In this session, the participants were presented with two payment options: a fixed or a dynamic payment. the outcome was clear, the preference was for a fixed payment. the residents liked the low risk of the fixed rates.
At the same time, participants were negative about the dynamic payment, especially when dynamic tariffs were combined with manual control of the smart appliance (see Figure 6). the most important reasons for this were uncertainties about how much money would be generated, and the effort that people would have to make to benefit from the dynamic electricity tariffs. Many participants also stated that they did not have sufficient flexibility to switch appliances on and off manually. When the electricity is cheap during the day because of the solar power, they are at work.
2.4 the organisation that offers a flex proposition should be very reliable
At the start of the project, it was expected that there would be little acceptance amongst Prosumers for automatic control of appliances in the home. Surprisingly, the research shows that if three conditions are met, people’s confidence in the organisation that controls the appliances is high:
• the organisation should have excellent customer service with strong (technical) knowledge.
• It must be clearly explained how the system and the appliance works. the trust in the system and the organisation that controls the appliance flows from this. Insight via a portal has a positive influence on this.
“the organization must be a
reliable contact between the
constantly changing energy
market and the consumer,
in which they put the
customers’ interests first.”
“An organization that controls my
appliance needs to be independent to gain the
trust of customers.”
“Expertise and openness are important for me.”
• Control: the consumer would ultimately like to have the opportunity to overrule the automatic control of the appliance should they consider this necessary.
If these conditions are met, there is enough trust to accept the proposition. Also, automatic control of the device is considered desirable.
Within the trial the researchers conducted extensive research on the underlying motives of trust. In the interviews and co-creation sessions with participants, it was often stated that personal contact with the project team played a significant role in building trust (for more details see Appendix F). Participants could always contact the team by telephone or email if they had questions. In addition, for those interested, a number of information evenings and co-creation sessions were organised.
From the questionnaires, it became clear that for participants it is particularly important that the organisation that controls the appliances is reliable. Knowledge about the smart appliance, transparent settlement, and safeguarding privacy are the most important factors that contribute to trust (see Figure 7).

22 Chapter 2
“So the device is controlled
by Easy Freeze. I wouldn’t
like that because that would
take away some of my
privacy. I have no idea what
else is in the device.”
“I think this is something for an
energy supplier. If you have questions
or if the device malfunctions, at least you know you can
always call.”
“I think it’s important to know who is behind it. If my energy supplier
would offer a discount on my energy account, for example, that would
be easy money. then it would really offer me something. And
you don’t need to do anything else than put
the plug in.”0% 20% 40% 60% 80%
Contributing to a sustainable energy system
Measurable result
Control over my device
Sustainable business operations
Knowledge of the energy market
Great customer service in the case of questions or problems
Privacy & data security
Transparent billing
Knowledge of my smart appiance
Reliable organizaition
Figure 7: Most important elements for the organisation that controls the smart appliances (from the final
survey)
Also in the interviews outside the trial it was clear that potential Prosumers considered it important that the organisation offering the Easy Freeze was reliable. Most questions concerned the organisation controlling the Easy Freeze and the motivation and/or the business model of this company, rather than the functioning of the device. this underlines the importance of information provision. Where automatic control was no problem for the majority of the respondents, some were concerned about the impact of the Easy Freeze on their privacy.
the organisation that controls the smart appliances must be reliable

3 a flexibility market can prevent serious congestion for a grid operator

24 Chapter 3
the DSO manages the grid to which the customers are connected. It is the task of the DSO to provide customers with a reliable electricity connection for the lowest possible connection rate. to maintain the reliability, the DSO is responsible for expanding the network and for resolving any congestion within the existing network. In resolving congestion, solutions are traditionally sought within the DSO’s network itself. there are, however, also opportunities to involve end users in resolving congestion. For example, by influencing the electricity consumption of end users: this can remove the cause of the congestion. this solution was tested in the project, with an Aggregator that serves as an intermediary in the trading of flexibility.
Prosumer Aggregator€
€
€
FLEXIBILITY
UFLEX
UFLEX
DSO
BRP
Figure 8: The DSO purchases flexibility from the Aggregator
In interpreting the results, the DSO places the emphasis on the quality of the supply of electricity to households. this quality is expressed both in terms of security of supply as well as voltage quality. this is in contrast to the BrP who trades mainly from a price perspective. the results of the project are therefore mainly discussed in this chapter from a perspective of quality, but the solution must also be affordable to safeguard the affordability of the DSO connection rate.
the findings regarding the DSO are the following:
1. through the USEF flexibility market, flexibility was able to prevent serious congestion;
2. Not all congestion could be resolved. there are six reasons why the required flexibility was not delivered to the DSO;
3. Flexibility trading by the BrP increases peak loads.
3 A flexibility market can prevent serious congestion for a grid operator
these three points are explained and elaborated one by one in the following paragraphs.
3.1 through the useF flexibility market, flexibility was able to prevent serious congestion
For the DSO, flexibility is an alternative to grid reinforcement if it meets each of the following four requirements:
1. able to significantly reduce peaks
2. reduce the risk of power outage
3. reliable in the long term
4. affordable
In spite of the fact that part of the flexibility could not be used, the results of the project show that the above requirements are achievable. Long-term reliability was, however, insufficiently demonstrated because of the choices in the design of the project.
In this report, ‘congestion’ is defined as a limitation in the energy flow (the network can supply limited power). Similar conclusions also largely apply to limitations in network quality (the network cannot supply the required power with the agreed voltage quality). the results of the project show that improving voltage quality is more difficult. this is because the congestion limit is determined in legislation and regulations and may therefore not be exceeded. this is in contrast to capacity congestion, in which temporary overload is not immediately critical. Often in the event of voltage congestion, a smaller group of households are involved; this increases the forecast error and reduces the reliability of flexibility.
3.1.1 Flexibility must be capable of reducing peaks
From the load duration curves in Figure 9, it is clear that the solar peak could be successfully reduced, but the reduction in the evening peak was limited. the load duration curve shows the

25EnergieKoplopers
number of hours that the grid load had a certain value. this is elaborated for 5 situations:
• for the original prognosis without flexibility trading (red line in right hand diagram);
• or the final agreed prognosis with the Aggregator (green line right hand diagram);
• for the measured load without the application of flexibility (red line left hand diagram);
• for the measured load with the application of flexibility (green line left hand diagram);
• for the best achievable grid load with maximum application of flexibility (grey line left hand diagram).
1. the evening peak reduction is extremely limited: the peak was reduced from 307 kW to 289 kW while the target was 200 kW. this target was within the achievable reach of the actual available flexibility and could theoretically be achieved entirely within the grid capacity. the reasons for this target not being achieved are elaborated in paragraph 3.2.
2. the solar peak reduction was more successful than the evening peak with a reduction from -409 kW to -306 kW (target: reduction to -200 kW). the best achievable reduction concerned a reduction to - 68kW, thus there was sufficient flexibility available to achieve the target of -200 kW.
3. In general the BrP increases the load. this is because a lot of load-increasing flexibility (flex-up) was used in the project (this is a project-specific conclusion). In the load duration curve, the increase is visible because the largest part of the load duration curve is increased after trading with the BrP (the red line lies below the green line).
4. Around the congestion limit, a successful levelling-off of the prognosis is visible as a result of flexibility trading. Various causes (see Figure 58, mainly project-specific It malfunctions during flexibility trading), however resulted in the fact that the entire load duration curve did not level off between the congestion limit of +/- 200 kW. theoretically there was sufficient flexibility available (grey line) to stay entirely within the congestion limit.
the solar peak could be reduced successfully, peak reduction in the evening was limited though
Before flexibility trading (first prognosis)After flexibility trading (agreement with Aggregator)
Load with dispatching of flexibilityLoad without dispatching of flexibilityLoad when all available flexibility would be dispatched
2
3
4
Figure 9: Load duration curve of a BrP/DSO experiment, both in the Plan/Validate phase (right) as well as in de Operate phase (left). Four learning points are explained here.

26 Chapter 3
3.1.2 Flexibility reduces the risk of power outage
Serious overload could almost always be prevented in this project by the application of flexibility. Flexibility also ensures that the height and duration of peaks are reduced.
Brief congestion is not serious for the DSO as long as this does not cause unacceptable service life reduction or unacceptable risk of failure. Power outage or damage should not occur, for example because of fuses interrupting the electricity supply. to evaluate the effect of congestion, in this project the duration and height was determined for each overload, see Figure 10 for an example of one overload. this was done prior to and after load control. the red area in the figure represents the power outage or damage, the dark grey area the service life reduction or increased of risk of failure.
180
200
220
240
260
280
300
320
340
0 5 10 15 20 25
Hei
ght
of
cong
esti
on
(kV
A)
Duration of congestion (number of PTU)
● Overload after flexibility
Δ Overload prior to flexibility
Figure 10: the duration and height of an overload was determined prior to and after application of flexibility, as in this example from 13 March. the height and duration are reduced through the application of flexibility.
All serious congestions in the project are displayed in Figure 11. the figure shows that serious congestion can be prevented effectively, by reducing the height and duration of the overload. the remaining overload occurred because the ordered flexibility was only partially delivered, too little flexibility was ordered, there was insufficient availability of flexibility for the
DSO and action was taken too late in the Operate phase (see also paragraph 3.2).
All serious congestions were prevented
Figure 11: Application of flexibility is effective in reducing serious congestion. All serious congestions during the project is represented as well as the effect of the load control on this serious congestion (excl. It malfunctions). this shows that a serious overload was sometimes reduced to multiple minor overloads.
3.1.3 Flexibility is reliable in the long term
results of the project show that reliable flexibility delivery is possible in the long term, if some optimization options are used in the future. Because of choices in the design, the long-term reliability in the project is still insufficiently demonstrated.
reliability is essential for the DSO, because non-supply of flexibility on this scale can represent a value of tens of thousands of euros (malfunction costs) for the DSO. In addition, repeated non-delivery is difficult for the DSO to absorb in the short-term because the lead time for grid reinforcement is relatively long.
reliability is expressed particularly in reliable supply of flexibility when the DSO needs this. Figure 12 shows that there are many days in which reliable flexibility could be supplied (high delivery percentage), but that there were also days on which the delivery percentage was low. the average reliability of the flexibility delivery (67%)6 suggests that reliable flexibility delivery is achievable in the future.
6 Comment: in the results of the trial, no significant correlation could be found between the delivery percentage and the amount of requested flexibility. Seasonal influences are also hardly recognizable in Figure 11.

27EnergieKoplopers
0,0
20,0
40,0
60,0
80,0
100,0
1 11 21 31 41 51 61 71 81 91 101 111
Del
iver
y p
erce
ntag
e (%
)
Days on which flex was ordered
Flex delivery percentage
Figure 12: the delivery percentage of the ordered flexibility during the project. All days on which flexibility was ordered are presented (excl. It malfunctions).
Yet a partial flexibility delivery does not directly lead to problems for the DSO. this results in the load not being reduced to the desired level but to (minor) congestions, see Figure 13. As previously explained, many grid components can cope with a minor overload without suffering negative consequences for security of supply.
Mild congestions were not always prevented
Figure 13: Application of flexibility is not always effective in reducing minor congestion. All minor congestions during the project are displayed showing that after application of flexibility, there was still a level of minor congestion (excl. It malfunctions).
From the project it appeared that the following points are essential for obtaining long-term reliability.
• Long-term agreements (>5 years) with the Aggregator about making flexibility available, regarding volume and price.
• Good estimation of the available flexibility, both by the Aggregator as well as by the DSO.
winter spring summer autumn
• Good qualitative forecast of the load, both by the Aggregator as well as by the DSO (each with its own forecasting strategy).
• An It system with a high service level and few malfunctions so that the uptime is almost 100%.
• A sufficiently large group of households to reduce the relative forecast error. this is a challenge for a congestion point in a low voltage network, in which a relatively small number of customers are represented by an Aggregator.
• A good It system to be able to order flexibility quickly in the Operate phase.
• An Orange regime that is supported technically and regulatory to prevent large-scale voltage loss should the Yellow regime or It systems fail.
• Apply sufficient margin in the DSO forecast or in ordering flexibility.
3.1.4 Affordability of flexibility depends on location and risk appetite
the affordability of flexibility is determined by the costs and the benefits, in this case mainly through the required flex volume (kWh) against the avoided grid reinforcement costs; both are location-dependent because they are determined by the congestion limit (locally applied components) and the local grid load.
From the business case7 and accompanying sensitivity analysis, the following becomes clear:
7 this concerns the business case for the DSO
the percentage delivered flexibility to the DSO varied strongly per day

28 Chapter 3
• the required flex volume is essential for the business case and depends on the congestion limit combined with the local grid load;
• the required flex volume can, in the future, be reduced by accepting (minor) overloads;
• the avoided grid investments can currently make the DSO business case positive;
• the DSO can optimize between the risk of insufficient flexibility and the costs of flexibility.
the design of the DSO business case is described in Appendix D.5.
sensitivity analysis Figure 14 indicates the results of the sensitivity analysis in a tornado diagram. this shows the influence of each parameter on the business case. the 0-line in the diagram shows where the business case becomes positive. It can be seen that the values that are used in the project (represented with the trial line) lead to a negative business case, but that there is, however, space for a positive business case.
the height of the congestion limit has the largest impact on the DSO business case
Figure 14: tornado diagram showing the influence of nine parameters on the business case. the trial line (on the border between the blue and red bars) indicates the situations for the values that were used in the project. the 0-line shows
where the business case becomes positive.
the required flex volume is essential for the business case and depends on the congestion limit combined with the local grid load Figure 14 shows that the congestion limit has great impact on the business case. this is because the limit has direct influence on the amount of flexibility that needs to be ordered. Analysis shows that the business case in the project situation becomes positive from a congestion limit of 215 kW. Appendix E.1 presents this analysis. From this it can be concluded that the structural application of flexibility creates a negative business case and the purchase of incidental peaks gives a positive business case.
the required amount of flexibility also depends on the local grid load. A higher grid load for an equal congestion limit, results in an increased need for flexibility. In the sensitivity analysis of the business case, the grid load was based on the measured load of the project and was not varied.
in the future, the required flex volume can be influenced by accepting (minor) overloads. By permitting (minor) overloads, the required flex volume can be significantly reduced, without this directly increasing the risk of malfunctions.
trial
0-line

29EnergieKoplopers
the amount of flexibility that is needed to prevent congestion depends partly, as stated previously, on the limit above which flexibility is ordered.
the physical congestion limit in an area cannot be adjusted without making grid investments. However, it is possible to start ordering flexibility only from a higher limit and permitting (minor) overload below this limit. For a limit of 110%, the required flexibility drops from 9000 kWh to 3000 kWh, and for a limit of 120% even to 700 kWh. this saves considerably in costs and improves the business case. Figure 45 presents the relationship between the congestion limit and business case. Appendix E.1 presents more details of this analysis.
the higher the congestion limit, the more positive the DSO business case
Figure 15: Impact of the congestion limit on the business case and required flex volume
the risk of malfunctions does not directly need to increase if the height and duration of the overload is controlled and, if necessary, adjusted. However, because the risk margins are reduced when minimum overload is permitted, it is of greater importance that flexibility can always be delivered; a condition is thus that the flexibility delivery is reliable, or USEF is provided with a good alternative for the flexibility market (Orange regime). the role of an accurate forecast also becomes more important.
the dso can optimise between risk of too little flexibility and costs for flex In the area of tension between risk and costs, the DSO can improve its business case by reducing the costs for purchasing flexibility. In the project, however, it is often the case that excess flexibility was ordered and there was an option to order less flexibility. However, by ordering less flexibility, the risk also increases that insufficient flexibility is ordered. the DSO can optimise between the risk of insufficient flexibility and the costs of flexibility.
In the project, a conservative and a realistic DSO prognosis were used to investigate the effect on risk and costs. the results from the project show that the excess ordered flexibility was reduced by 75%
by using a less conservative prognosis, but that the amount of flexibility that needed to be ordered in the Operate phase increased by 40%.
to be able to make a good consideration between low costs and risk of overload or uncertainty of high costs, the DSO will need to have insight into various matters:
• the price and security of flexibility delivery in Operate
• the permissible overload of grid components
• the level of fines for the Orange regime.
Appendix E.1 gives a detailed description of the business case analysis
3.2 not all congestion could be resolved. there are six reasons why the required flexibility was not delivered to the dso.
During the experiments in the project, there was actually more than sufficient flexibility available to resolve all congestion. Only a part of this available flexibility was used to prevent congestion. In general, there are six reasons why not all available flexibility was used to prevent congestion. these are:
1. the flexibility was not always available because of an It malfunction
2. Flexibility that was not used, as it was not forecasted by the Aggregator at the moment of trading
3. Flexibility that was sold to the BrP
4. Flexibility that the Aggregator needs for its own operations
5. Flexibility that was not ordered by the DSO
6. Flexibility that was not delivered because of non-optimal control of appliances
An overview of the reasons for not using flexibility for the DSO is given in Figure 16. In this diagram, the reasons are sorted into how often these were the main reasons for not using flexibility, and how much impact this had on congestion.
Point 1 and point 6 concern It design limitations that were chosen within the project because of research objectives versus budget limitations. Points 2 to 5 are market/business-related choices from the Aggregator and DSO.
Appendix E.2 gives more information about these six reasons.
30 Chapter 3
2. Flexibility that was not used, as it was
not forecasted by the Aggregator at the moment of trading
1. The flexibility was
not always available because of an IT mal-
function
3. Flexibility that was
sold to the BRP
4. Flexibility that the
Aggregator needs for its own operations
5. Flexibility that was not ordered by the
DSO
6. Flexibility that was
not delivered because of non-optimal con-
trol of appliances
Sometimes Frequent Often
Sm
all i
mp
act
Ave
rag
e im
pac
tLa
rge
imp
act
Figure 16: the frequency and impact of the six different reasons for not applying flexibility for DSO purposes.
to make the flexibility market more reliable for the DSO, it will need to be ensured that these reasons are less prevalent or that they have less impact, or a combination of both. In this, it is logical to focus on points 1 and 3. It is explained below per reason how this could be possible.
3.2.1 Flexibility that is not available because of an It malfunction 90% of the time, 90% of the appliances were available to be controlled. When the entire It system did not function and nothing could be controlled, this had a significant impact on congestion, because this simply could not be resolved (see example in Figure 51). redundancy in the It system is a way of ensuring that this occurs less often. Entirely excluding a malfunction is impossible, so reducing impact is also recommended. this can for example be organised through designing the Orange regime with a fail-safe mode, in which some appliances are automatically switched off if there is an It malfunction, or by using a security margin.
3.2.2 Flexibility that was not forecasted at the moment of trading In the project this mainly occurred on semi-overcast days in which generation from solar panels was difficult to predict. It did occur often, and the impact on congestion was significant. the difference in generated peak capacity of solar panels between a cloudy moment and a sunny moment can be up to 80%. this means that, at unexpected sunny
moments when the generation of solar panels cannot be controlled because the Aggregator has not forecasted this flexibility, this can cause a considerable overload.
this can be prevented by deploying a more up-to-date forecast of the available flexibility in the Intraday and Operate phase. When more up-to-date data are used in Operate for the available flexibility, this will also reduce the impact.
3.2.3 Flexibility that was sold to the BrP One of the customers of the Aggregator is the BrP. It is thus logical that flexibility is sold to the BrP. From a societal viewpoint it is not desirable that this occurs less often. However, in the project this trading often led to congestion. this can be solved by applying multiple trade iterations between Plan and Validate. the DSO then has the option to ‘purchase’ the flexibility, that the Aggregator sold to the BrP in the first iteration, back in a subsequent iteration
3.2.4 Flexibility that the Aggregator needs for its own operations the Aggregator almost always needs a part of his flex portfolio for its own business operations. On the one hand, this is to compensate for its own incorrect forecasts and on the other to increase the reliability of the offered flexibility. In this way, the Aggregator can stick to the D-prognosis that is aligned with the DSO and can prevent congestion.
the flexibility retained by the Aggregator to increase the reliability of the offered flexibility sometimes led to congestion in the project, particularly with the boilers. the Aggregator offered just a small part of the boiler flexibility in order to guarantee that this flexibility was actually delivered. When it was agreed in advance with the Aggregator how much flexibility should be offered at a certain congestion point (for example in the form of a long-term contract with a capacity payment), this does not have to lead to congestion. the DSO can use this information to determine whether this flexibility is sufficient to resolve the congestion. Finally, the actual available flexibility can be used in the Operate phase. the relationship of the offered flexibility in Plan/Validate and Operate will depend on the level of risk that the Aggregator wants to take.
3.2.5 Flexibility that was not ordered by the DSO In the project, the DSO forecasted mainly conservatively, which means it was seldom the case that insufficient flexibility was ordered. In the event that insufficient flexibility is ordered, the DSO can

31EnergieKoplopers
purchase flexibility in Operate and this will not lead to congestion. A condition to make this reliable is that the flexibility that is already sold to the BrP, can also be ‘purchased back’ by the DSO in Operate. the Aggregator will probably ask a higher price for this flexibility.
3.2.6 Flexibility that was not delivered because of non-optimal control of appliances In practice there will always be some appliances that cannot be controlled optimally. When this is taken into account, this does not need to impact congestion. this will occur less often once trading is more frequent, because such not optimal control mainly occurs if the load varies strongly and the It system “lags behind”.
3.3 Flexibility trading by the Brp increases peak loads
Due to flexibility trading by the BrP, it can be seen that at random moments during the day the Aggregator switches on or off a large amount of controllable appliances simultaneously, also during moments in which the peak load of the network increases. this mainly concerns brief load changes, so that brief significant changes are visible in the grid load (see Figure 17). these load changes can be both advantageous for the DSO, for example in the case of ordering flex-up by the BrP during the solar peak, as well as disadvantageous, for example in the case of ordering flex-up by the BrP during the evening peak.
Figure 17: two example days in which the BrP orders flexibility (orange), such as during the evening peak
Figure 18 shows that more higher peaks occur when the BrP purchases flexibility. In the experiment in which the Aggregator set low flexibility prices (which meant that the BrP ordered a lot of flexibility), these simultaneous loads were longer and significant variation occurred in the grid load. For the DSO, this can result in increased wear of components. In addition, it can be necessary to reinforce grids to prevent congestion. the results of the experiments show that almost all the theoretically available flexibility is controlled simultaneously if the BrP purchases all flexibility when there is a price advantage on the energy market.
the project-specific implementation of USEF, in which there were no multiple iterations between the Plan and Validate phases, meant that the DSO could not always prevent congestion as a consequence of BrP trading (see also previous paragraph). For a follow-up project, it is recommended that this iteration is applied. Another solution is that the DSO purchases the required flexibility from a different Aggregator.
to ensure that flexibility trading is not at the expense of the security of supply, it is also recommended that a reliable and supported Orange regime is tested in practice. this gives the DSO the option to guarantee security of supply while flexibility trading is facilitated as much as possible.

32 Chapter 3
-250000
-200000
-150000
-100000
-50000
0
50000
100000
150000
200000
250000
1 41
81
121
161
201
241
281
321
361
401
441
481
521
561
601
641
681
721
761
801
841
881
921
961
1001
10
41
1081
11
21
1161
12
01
1241
12
81
1321
13
61
1401
14
41
1481
15
21
1561
16
01
1641
16
81
1721
17
61
1801
18
41
1881
19
21
1961
20
01
Without flexibility With flexibility
Figure 18: the sorted load with and without trading by the Aggregator for the BrP.
100000 120000 140000 160000 180000 200000 220000 240000
1 21
41
61
81
101
121
141
161
181
201
221
241
261
More and heavier evening peaks emerged when the BrP procured flexibility

4 Flexibility for the Brp: value but also risk

34 Chapter 4
4 Flexibility for the BrP: value but also risk
the BrP must, as a Balance responsible Party, ensure that the supply and demand of electricity in its portfolio are balanced at all moments in time. the costs of more or less electricity consumption than predicted are calculated afterwards using an imbalance price. Each BrP has a strategy that ensures for optimisation of its portfolio. the value for a BrP in trading flexibility lies in (USEF, 2015):
• Optimisation on the imbalance market;
• Optimisation on the Day Ahead market;
• Optimisation on the Intraday market;
• Optimisation of generation assets
Prosumer Aggregator€
€
€
FLEXIBILITY
UFLEX
UFLEX
DSO
BRP
Figure 19: the BrP purchases flexibility from the Aggregator.
the above forms of BrP portfolio optimisation can
add value to the energy system. In the project, only optimisation on the imbalance market and Day Ahead market were applied. Appendix D.4 describes in detail how the BrP uses flexibility in the project to optimise the value of its portfolio.
the findings regarding the value of flexibility for the BrP are as follows:
1. the application of flexibility can increase the value of the BrP portfolio.
2. Participating in a flexibility market by a BrP can introduce risks concerning the value of its portfolio.
the above findings are explained separately below. However, before this, four limitations of the research should be stated that are relevant for the correct interpretation of the results:
1. In the project, the flexibility trading had no impact on the volumes and prices on the APX Day Ahead and/or imbalance market.
2. the BrP had perfect information about the imbalance price in advance. In this sense, the calculated value creation can be interpreted as a theoretical maximum as far as optimisation on the imbalance market is concerned.
3. the BrP portfolio in this project comprised of only the 203 participating households.
4. In the project, the role of the energy supplier is not implemented specifically. the optimisation that the supplier could apply, is represented in the project by the BrP. the splitting of the role of supplier and BrP in practice depends on the commercial agreements that the BrP and supplier have together. there is no standard in the market for these commercial agreements. In the project, it was chosen that the BrP would implement all market optimisations. In practice this could also be a combination of BrP and supplier.
4.1 Flexibility increases the value of the Brp portfolio
Flexibility can be used for the purpose of BrP portfolio optimisation. Appendix D.4 describes in detail how the BrP purchased flexibility in the project. the result of the application of flexibility for the BrP is summarised in figure 20. this figure shows the value of the BrP portfolio, with and without the application of flexibility. the first (left) box plot shows the value of the BrP portfolio per day without flexibility trading. the second (right) box plot shows the value of the BrP portfolio per day with flexibility trading. the quartiles give visual insight into the distribution of the value of the portfolio around the average. the distribution bar comprises the minimum and maximum (and with this thus the outer values of the BrP portfolio value per day).
35EnergieKoplopers
Without flexiblity trading With flexibility trading
Val
ue B
RP
po
rtfo
lio p
er
day
third quartile (75%)
first quartile (25%)
average
spread
Figure 20: Value of the BrP portfolio, with and without the application of flexibility. results in the figure are based on a sample size consisting of the 61 days from the experiments in the second half year of the project.
the average value of the BrP portfolio is bigger with flexibility trading than without flexibility trading (compare the level of the two black rhombi with each other). this demonstrates that flexibility can be of value for the portfolio of a BrP. this value is generated because the BrP uses flexibility to arbitrate on the APX Day Ahead market and the imbalance market. In the project, the most value for the BrP was created on the imbalance market, because of the more extreme price peaks, and thus more possibilities for arbitration that have occurred there (for more details see Appendix E.3).
In the figure, however, it is also clear that the distribution bar is more extensive with flexibility trading than without flexibility trading. the distribution bar is a measure for risk. the quartiles are also more extensive with flexibility trading, both upwards as well as downwards. there were even days on which the value of the BrP portfolio became negative because of participating in the market for flexibility. this suggests that flexibility can introduce an extra risk regarding the BrP portfolio value. the following paragraph describes why the distribution in the value of the BrP portfolio increases after flexibility trading.
4.2 Flexibility can increase risk for the Brp portfolio
If the BrP is active in a flexibility market, then higher spreads in the BrP portfolio value could be caused by three events. these events could have a positive as well as a negative impact on a BrP’s portfolio. the BrP itself has no control over these events. Events in the flexibility market over which the BrP has no control and that can have a financial impact on the BrP’s portfolio value are:
1. Flex-orders by a DSO: flex-orders by a DSO have an effect on the BrP’s portfolio value. After all, if the DSO wishes to change the energy consumption of a group of households, the BrP must source these changes on the electricity market. If the price at such a moment, however, is unfavourable for the BrP, this will lead to extra costs. In addition, Operate orders from the DSO (orders in the current PtU) cause imbalance for the BrP, because the BrP no longer has the time to source this on the market. Depending on the direction of the imbalance, combined with the imbalance price, this can lead to either imbalance costs or benefits.
2. Forecast updates: in the project, the entire portfolio is purchased by the BrP on the basis of the Aggregator forecast. Each change because of an update of this Aggregator forecast, for example due to an update of weather parameters, must be sourced by the BrP.
3. Deviations in the A-plan: after the Aggregator has received all BrP and DSO orders and forecast updates, the Aggregator sends the final plan (in USEF terms this is called the A-plan), in which is stated how much electricity will be consumed at each moment in time. this plan thus incorporates all the agreements between the BrP and the Aggregator. the Aggregator will then realise this A-plan, however, the Aggregator is not always completely successful in this. Every deviation from this A-plan causes an imbalance for the BrP. Depending on the direction of the imbalance, combined with the imbalance price, this can lead to imbalance costs or revenues.
Flexibility was able to increase the value of the BrP portfolio

36 Chapter 4
For the final two BrP/DSO experiments in the project, the figure below presents what the impact could be of the USEF flexibility market on the BrP portfolio value. the first column “(1) Value without flexibility trading” indicates what the value of the portfolio could be without participation in a flexibility market. the second column “(2) Value from flexibility trading” indicates what the BrP has been able to create in value by arbitrage applying flexibility on the APX Day Ahead and imbalance markets. Columns 3, 4 and 5 show what the impact can be of events in a flexibility market on the BrP portfolio value. In principle, these are the events over which the BrP has no direct control. However, the impact per event differs strongly per experiment and figure 20 is therefore project-specific. the message from the above figure is thus not to indicate the precise impact per event, but rather to indicate that various events can have an impact on the BrP portfolio value. What does always recur structurally in various experiments is that deviations to the A-plan have a negative rather than positive financial impact on the value of the BrP portfolio (see column “(5) Impact deviations A-plan”). there are various reasons why the Aggregator deviates from that what was agreed in the A-plan. Please refer to paragraph 5.2 for more details regarding this matter. Deviations in the A-plan could be positive one time for the BrP and negative another. this depends on the combination of the imbalance price and the direction of the deviation on the A-plan. the images below show how this works.
In addition to value creating by arbitrage, the value of the BrP portfolio was influenced by three factors
(1) Value without flexibility market
(2) Value from flexbility trading
(3) Impact DSO orders
(4) Impact forecast updates
(5) Impact A-plan deviations
(6) Value with flexibility market
Valu
e B
RP
port
folio
TenneT imbalance market
APX Day Ahead
Figure 21: Possible impact of DSO orders, forecast updates and deviations of A-plan on the BrP portfolio value
Figure 22: A deviation from the A-plan can result in under-delivery or over-delivery of sold flexibility
In Figure 22 it is explained that deviating from the A-plan can result in an under-delivery of flexibility, or an over-delivery. If a flex-order from the BrP is directed upwards, and the Aggregator’s realisation is higher than planned (i.e. the deviation from the A-plan is positive), then this is referred to as over-delivery: the Aggregator delivers more flexibility than promised. If the realisation is, however, lower than planned, then this is referred to as under-delivery: the Aggregator delivers less flexibility than promised. Under-delivery and over-delivery are thus dependent on the direction of the BrP’s flex-order, combined with the direction of the deviation from the A-plan.

37EnergieKoplopers
-‐150
-‐100
-‐50
0
50
100
150
< U
nder
del
iver
y
Ove
rdel
iver
y >
< Negative financial impact Positive financial impact >
Figure 23: More under-delivery than over-delivery of flexibility means a net negative financial impact
In Figure 23 all under-deliveries and over-deliveries are plotted for those moments at which the BrP has made a flex-order to optimise on the imbalance market. this figure shows two important findings. Firstly, it is clear that, if a BrP has ordered flexibility for the imbalance market arbitration, under-delivery leads to a negative financial impact on the BrP portfolio value. Over-delivery leads to a positive financial impact for the BrP. this is because at the moment at which the BrP ordered flexibility, the imbalance price was apparently favourable to adjust the energy consumption downwards or upwards. If this occurs in a higher or lower level than was agreed, then this leads automatically to respectively a positive or negative impact on the BrP portfolio value. the under or over-delivery is actually re-settled against the same imbalance price that was used in the consideration of whether or not to order flexibility.
Secondly, the figure shows that under-delivery takes place more often than over-delivery. this is because in the project, the Aggregator tended to deliver flexibility too little rather than too much. From an Aggregator’s viewpoint it is not logical to deliver more flexibility than is required, after all, the Aggregator would then deliver flexibility for free. Paragraph 5.2 explains why the Aggregator sometimes delivers less flexibility than agreed.
the combination of these two findings leads to the conclusion that the negative financial impact of deviations from the A-plan is greater than the positive financial impact. Deviations in the A-plan thus have a net negative impact on the value of the BrP portfolio, if the BrP uses the flexibility on the imbalance market. As a consequence of this, the distribution (and thus the risk) in the value of the
BrP portfolio is caused, to a large extent, by the under-delivery of flexibility by the Aggregator.
In the project, the Aggregator received no fines for any imbalance costs arising for the BrP. However, in reality, any imbalance costs that arise would have to be borne by a party (possibly the Aggregator). USEF has recently described various solutions for this8.
8 towards an expanded view for implementing demand response aggregation in Europe, An engineering perspective for Europe's energy flexibility markets, Interim results, USEF, 2016.

5 the aggregator completes the market for flexibility, but does need to deliver

39EnergieKoplopers
5 the Aggregator completes the market for flexibility, but does need to deliver
Within the USEF flexibility market, the Aggregator fulfils a central role. this role is defined as: “Aggregators accumulate the flexibility they obtain from the demand-response resources owned by a set of industrial, commercial, and residential end users. this pool of flexibility is then turned into products to serve the needs of the various stakeholders.” (USEF, 2015).
Within EnergieKoplopers, the Aggregator has two flexibility customers, namely the DSO and the BrP. to meet the demands of these customers the Aggregator has collected flexibility from the 203 Prosumers in the project. these Prosumers provided flexibility because their smart appliances could be switched on or off (the boiler, PV-switch and heat pump) or could be regulated upwards or downwards (the fuel cell). the supply of flexibility in the project therefore concerned the instantaneous increase or decrease of electricity consumption by these households; flexibility resulting from time-shifting was not investigated.
Prosumer Aggregator€
€
€
FLEXIBILITY
UFLEX
UFLEX
DSO
BRP
Figure 24: the Aggregator plays a central role in the USEF flexibility market.
the Aggregator in EnergieKoplopers was a “delegated Aggregator”. this means that the Aggregator role was fulfilled by a third party (admittedly Essent in the project, but formulated as an independent party) and thus traded in flexibility independently from other parties.
the main findings of the project regarding the Aggregator are:
1. the Aggregator fulfils an essential role in the flexibility market by matching supply and demand of flexibility.
2. In the project, approximately 2/3 of the sold flexibility was delivered. there are two ways in which flexibility can be delivered (control of appliances and load forecast error), and three ways in which delivery can fail (load forecast error, flex forecast error and hardware & It limitations).
3. Core competencies of an Aggregator are load forecasting and flex forecasting.
5.1 the aggregator brings supply and demand of flexibility together
the extent to which the Aggregator matches the supply and demand of flexibility was investigated by comparing the delivered amount of flexibility with the sold amount of flexibility. Figure 25 shows, for the two BrP/DSO experiments in the second six months of the project, how much flexibility the Aggregator sold on average, and what part of this the Aggregator was able to deliver on average. the sale and supply of flexibility form the basis for the financial relationship between the Aggregator and the BrP and DSO.
0,0
0,5
1,0
1,5
kWh
per
day
per
ho
useh
old
Flexibility sold Flexibility delivered
Supply of flexibility Demand for flexibility
Non delivered flexibility
DSO BRPAggregator
Prosumer
Prosumer Prosumer
Prosumer Prosumer Prosumer
Figure 25: the Aggregator brings supply and demand of flexibility together
the figure clearly shows that the involvement of the Aggregator enables flexibility to be traded and ultimately delivered. By bringing the supply and
On average, the Aggregator delivered 2/3 of the sold flexibility

40 Chapter 5
demand of flexibility together, the Aggregator in the project was able to trade a little more than 1 kWh per day per household. Of this sold flexibility, the Aggregator was able to deliver 2/3. the DSO and BrP were able to create value with this “received” flexibility. Without involvement of the Aggregator, it would have been more difficult to trade, aggregate and deliver this flexibility. An Aggregator thus has a legitimacy in a flexibility market. the paragraph below explains further why the Aggregator in the project was sometimes able and sometimes not able to deliver the sold flexibility.
5.2 the aggregator delivered 2/3 of the sold flexibility
In Figure 25 it can be seen that the Aggregator delivered approximately 2/3 of the sold flexibility. In order to deliver flexibility to the DSO and BrP, the smart appliances must (in principle) be controlled by the Aggregator. If the actual electricity consumptionis equal to the electricity consumption9 agreed upon with the BrP and DSO, then all sold flexibility is delivered. An important question arises from this: why can an Aggregator sometimes deliver flexibility and sometimes not? this question is further elaborated in this paragraph.
Not being able to deliver flexibility forms a business risk for the Aggregator (and also for the BrP and DSO, who purchase flexibility) as this can lead to dissatisfied customers and potentially fines. the figure below indicates how the sold flexibility was or was not delivered for the final two BrP/DSO experiments. Please first note that Figure 26 presents average numbers.
there are five reasons why the sold flexibility could or could not be delivered
9 In USEF this agreed upon electricity use is known as the A-plan for the BrP and D-prognosis for the DSO
Figure 26 can be explained as follows. If flexibility is sold for a certain moment, there are two ways in which this flexibility can be delivered:
this means that there are moments in which the Aggregator has been able to deliver 100% of the sold flexibility, but that there were, for example, also moments at which the Aggregator was only able to deliver 50% of the sold flexibility.
1. Delivered through appliance control (block 2): electricity consumption can be increased or decreased by controlling the electricity usage of the smart appliances. In this way, the agreed electricity consumption can be realised and flexibility is delivered. In theory (with a perfect load forecast) all delivered flexibility comes from controlling the smart appliances.
2. Delivered through load forecast error (block 3): the Aggregator makes a forecast of the total electricity consumption (load) of the households. this forecast comprises the total expected electricity consumption of households as this would have been the case without any controlling of the smart appliances, thus: without the application of flexibility. this so-called load forecast together with the ordered flexibility forms the Aggregator plan (the agreed electricity consumption / A-plan). However, in reality, the electricity consumption can deviate from the load forecast, either upwards or downwards. this deviation is known as the load forecast error. the load forecast error can sometimes be favourable so that flexibility is “delivered” without smart
Figure 26: the (non-)delivery of flexibility in the latter two BrP/DSO experiments (18 May - 28 June 2016 and 20 July - 16 August 2016).

41EnergieKoplopers
appliances needing to be controlled. In this case, the flexibility is delivered because of the load forecast error.
there are, however, also three ways through which it can occur that not all sold flexibility can be delivered:
1. Not delivered due to load forecast error (block 5): see point 2 above, but then vice versa. the load forecast error can sometimes be so unfavourable that this is in conflict with the supply of flexibility.
2. Not delivered due to flex forecast error (block 6): a flex forecast error occurs when the amount of sold flexibility exceeds the amount that can actually be supplied by the smart appliances. the Aggregator estimates in advance how much flexibility the appliances can supply. If this is estimated too incorrectly, it can occur that more flexibility is sold than can be delivered. this can occur, for example, if the Aggregator makes a too low estimation of boiler capacity and in doing so sells more flexibility than the boiler can actually supply.
3. Not delivered due to hardware and It limitations10 (block 7): this concerns, for example, the incorrect processing of the USEF message traffic (such as sending an Aggregator plan to the It system that controls the smart appliances), or not timely/incorrect implementation of a control signal by a smart appliance.
What is remarkable in Figure 26, is the impact of the load forecast error (block 3 and block 5). the load forecast error can deliver flexibility (block 3), but it can also result in non-supply of flexibility (block 5). Correct forecasting of the load is therefore a competence that the Aggregator should have and should continue to improve. As well as load forecasting, flex forecasting is another important competence for the Aggregator. As can be seen in block 6, a flex forecast error can lead to the non-supply of flexibility11.
Both the forecasting of the load as well as the amount of flexibility available are core Aggregator competencies, both of which, if not correctly implemented, can have serious consequences for the Aggregator’s business. Continuous improvements
10 the limitations mainly concerned making trial-specific choices regarding design and layout of the trial.
11 In Figure 26, although the extent of the flex forecast error was better than expected, this is the result of continuous flex forecast improvements during the trial. In previous trial experiments, the flex forecast error played a much greater role in the non-supply of flexibility.
are essential in this. For this reason, these two competencies are discussed further below.
5.3 Core competencies of the aggregator are load forecasting and flex forecasting
5.3.1 Load forecasting
As mentioned in the previous paragraph, the load forecast error sometimes contributes to the supply of flexibility (block 3) but sometimes also is in conflict with the supply of flexibility (block 5). the load forecast error can thus sometimes be favourable and sometimes be unfavourable. A favourable load forecast error results in the supply of flexibility originating not from the control of smart appliances but from the load forecast error. An unfavourable load forecast error on the other hand, results in the control of the smart appliances not leading to the delivery of flexibility but being used to compensate for the unfavourable load forecast error. the only way to compensate for an unfavourable load forecast error is actually through additional control of appliances. this extra control can lead to extra costs for the Aggregator. But above all, a significant unfavourable load forecast error can lead to non-delivery of flexibility. this is the case if the additional control is insufficient to compensate for the unfavourable load forecast error. this forms a serious business risk for the Aggregator. the non-delivery of flexibility can create imbalance for the BrP and/or grid problems for the DSO. It is therefore important for an Aggregator to minimise the load forecast error as much as possible. the Aggregator can realise this by:
• Being only responsible for the controllable load. In EnergieKoplopers, the Aggregator was responsible for the total electricity consumption of households, while only a small part of the total electricity consumption could be controlled by switching a smart appliance on or off. the load forecast error can be limited if a forecast no longer needs to be made for the total electricity consumption, but only for the electricity consumption of the smart appliance. In paragraph 6.2, there are further arguments why an Aggregator should be only responsible for the controllable load.
• Having a large portfolio of households. After all, the greater the portfolio, the smaller the load forecast.

42 Chapter 5
• Using as much information as possible to make a good forecast. this can, for example, be historic consumption data or the most up-to-date weather data.
5.2.3 Flex forecasting
A second important competence for the Aggregator is predicting the available flexibility, with the use of a flex forecast. the forecasted flexibility determines the maximum amount of flexibility that can be sold. Figure 26 shows that a flex forecast error can lead to non-delivery of flexibility. the non- delivery is created through incorrect forecasting of the available flexibility, with the result that too much flexibility is sold. the Aggregator then fails to deliver some part of the sold flexibility (the flexibility is, after all, not available). An important competence for an Aggregator is thus to be able to estimate the available flexibility correctly so that non- delivery is prevented.
In the project, it was particularly complex to forecast the actual available flexibility of the electric boiler, because of variations in boiler fill level12. Figure 27 shows the daily average of the delivered and non-delivered flexibility (vertical axis) and the boiler levels (also vertical axis) over the period 13 - 27 January 2016. the figure shows that “non-delivery due to flex forecast error” (dark red area) goes hand in hand with a high boiler fill level (blue line in the graph). At the end of the afternoon, the levels were not correctly estimated, which means that more boiler flexibility was sold than was actually available. this led to the non-delivery of flexibility.
12 A boiler level of 100% means that the water in the boiler is fully heated and the boiler cannot be switched on anymore. thus at 100% no more flexibility can be delivered. Most flexibility can be delivered when the fill level is at 0%, after all, the boiler can then be switched on relatively often.
-‐30
0
30
60
90
120
150
00:00 03:00 06:00 09:00 12:00 15:00 18:00 21:00
kiloWa2
Electric boiler PV-‐switch Fuel cell Heat pump
Figure 28: the average available flexibility of four smart appliances in the summer period (20 July 2016 to 18
August 2016).
-‐30
0
30
60
90
120
150
00:00 02:30 05:00 07:30 10:00 12:30 15:00 17:30 20:00 22:30
kiloWa2
Fuel cell Heat pump Electric boiler PV-‐switch
Figure 29: the average available flexibility of four smart appliances in the winter period (10 February 2016 to 15
March 2016).
the actual available flexibility differs not only significantly per appliance or time of day, but also per season. Figures 28 and 29 show the average measured actual available flexibility during the day per appliance in the summer and winter periods respectively. the available flexibility is appliance-specific. Only the available flexibility of the fuel cell is constant over time, as this is independent of weather or user behaviour.
By comparing the two figures, it becomes clear that the PV-switch offers more flexibility in the summer than in the winter. the heat pump has more flexibility available in the winter than in the summer (after all in the winter there is higher heat demand so the heat pump can be switched on more often).
Due to an incorrect flex forecast of the boiler, flexibility could not be delivered
0%
10%
20%
30%
40%
50%
60%
70%
80%
90%
100%
11:00 11:30 12:00 12:30 13:00 13:30 14:00 14:30 15:00 15:30
Percen
tage of sold fle
x/ fill level
Non-‐delivery due to flex forecast error
Non-‐delivery due to hardware & IT limitaGons
Non-‐delivery due to load forecast error
Delivered by load forecast error
Delivered by controlling smart devices
Boiler fill level
Figure 27: Delivery of sold flexibility for the boiler from 13 - 27 January 2016 (average per day)

43EnergieKoplopers
Amongst other things, the season thus determines the amount of flexibility that the smart appliances can supply. this makes flex forecasting complex. the available flexibility of a smart appliance can depend on many variables. For an electric boiler, these variables could be: time of day, season, outside temperature, number of residents etc. the Aggregator should also take into account previously sold flexibility because this can influence the amount of available flexibility. What is more, the further in advance the flexibility is sold, the more difficult it is to estimate the actual available flexibility. In the project, the latter applies mainly to the boiler and the PV-switch. the Aggregator must thus be able to understand the (behaviour of) the appliances in its flex-portfolio in order to create an accurate flex forecast. Flex forecasting is thus an essential competence if an Aggregator wants to be a reliable party in the flexibility market.

6 the flexibility market needs a market model such as useF

45EnergieKoplopers
6 the flexibility market needs a market model such as USEF
the trading of flexibility in EnergieKoplopers took place according to the USEF market model. Appendix D describes in detail how USEF market processes were implemented in the project. this paragraph presents the results of the project’s experiences with the USEF flexibility market in practice.
Prosumer Aggregator€
€
€
FLEXIBILITY
UFLEX
UFLEX
DSO
BRP
Figure 30: the flexibility market was implemented according to the USEF market principles
the findings regarding the practical application of USEF are:
1. Interaction between BrP and DSO underline the integrated market approach that USEF has chosen in its design.
2. USEF must explain the various options regarding which party in the flexibility chain can best carry the risk associated with predicting the uncontrollable load.
3. It is desirable that both the DSO and BrP can trade flexibility at various times.
these three points are explained and elaborated one by one in the following paragraphs.
6.1 an integrated market model such as useF is required to represent all interests
One of the most important design principles of USEF is an integrated approach to the flexibility market. this means that there are various parties that require flexibility for various reasons. In the BrP chapter, it was already concluded that when the DSO orders flexibility, this impacts the BrP’s portfolio. Also, in the DSO chapter it was concluded that when the BrP orders flexibility, this impacts the DSO’s grid
management: sometimes BrP orders help resolve congestion, sometimes BrP orders actually cause congestion.
this interaction between BrP and DSO was investigated in detail during the BrP/DSO experiments, in which flexibility was sold both to the DSO as well as to the BrP. Based on these experiments, statements can be made about how often the BrP and the DSO want to buy flexibility at the same time and thus, the extent to which an integrated approach is necessary according to USEF.
the figure below (Figure 31) gives a diagrammatic representation of the interaction between BrP and DSO. the figure can be explained as follows: no interaction means that the BrP or the DSO has placed a flex-order in a PtU, in which the other party has not placed any flex-orders. Such a flex-order does not lead to a conflicting interest (the grey area). If both the BrP and the DSO place a flex-order in a PtU in the same direction (for example both flex-up), there is also no issue of conflicting interests. the parties thus help each other with a similar flex-order (the green area). However, there are also situations in which conflicting interests occur. this is the case if one party orders flexibility in one direction at the same time as the other party orders flexibility in the other direction (the orange area).
16%
18% 66%
Flex-orders DSO and BRP in opposite direction Flex-orders DSO and BRP in same direction No interaction
Figure 31: Percentage of total number of flex-orders in which interaction between BrP and DSO takes place
the BrP and DSO had conflicting interests 16% of the time

46 Chapter 6
the above figure shows that in the project, approximately 16% of the flex-orders resulted in conflicting interests between the BrP and the DSO. In spite of the fact that this is a project-specific result, this does demonstrate that potential conflicting interests can occur in a flexibility market. For each conflicting interest, the Aggregator must consider which party can purchase the flexibility for which price.
the above finding underlines the integrated market approach that USEF has chosen in its design. Using the introduction of the role of the Aggregator, USEF enables the BrP and DSO to help each other sometimes, but they can also be in conflict with each other. theoretically, the market operation in USEF should result in these conflicting interests being resolved and that, ultimately, the optimum societal value will be realised. this was however not investigated in the project because of the limited level of market dynamics.
6.2 a market model must assign responsibilities in the flexibility market in such a way that risks are shared fairly
When trading flexibility, the households’ total energy consumption must be taken into account. After all, congestion for a DSO occurs because of the total electricity that runs through a transformer, not only because of the electricity needed for the smart appliances. the project made a distinction between controllable load and uncontrollable load. the total load is the sum of the controllable and uncontrollable loads, as depicted in Figure 32.
1. Controllable load: the energy consumption of the smart appliances that can be influenced by the Aggregator.
2. Uncontrollable load: the energy consumption of the households that cannot be controlled directly, for example, the consumption of a kettle, white goods or standby power.
Uncontrollable load
Controllable load
Flex-up
Flex-down
Load forecast
Figure 32: In the project, the Aggregator made a forecast for both the controllable and the uncontrollable
load.
In the project, the Aggregator was responsible for the total household energy consumption, thus both for the controllable as well as the uncontrollable load. It was clear from the project that this responsibility brings a huge business risk for the Aggregator. Every error in forecasting the load can lead to non-delivery of flexibility (see paragraph 5.2 for more details).
During the project approximately 2/3 of the ordered flexibility was delivered by the Aggregator. Non-delivery can be explained partly by an unfavourable load forecast error13. the load forecast error lies mainly in the uncontrollable load. In general it can be stated that the fewer households in the Aggregator’s portfolio, the greater the load forecast error. regarding the flexibility trading with the DSO, however, the physical restriction always applies that there are a limited number of households connected to a transformer. For this limited number of households, in a flexibility market, a separate forecast will always need to be made. In a neighbourhood, a maximum of around 100-200 households are connected to a transformer, which means that it is plausible that the load forecast error will be significant.
For flexibility trading with the BrP it also applies that: the fewer households in the Aggregator’s
13 In the trial with 203 participating households, the load forecast error had significant impact on the supply of flexibility. From the trial data it cannot be stated which number of households would sufficiently reduce the load forecast error.

47EnergieKoplopers
portfolio, the greater the load forecast error. In spite of the fact that in the future, the Aggregator will possibly have a large number of households in its A-plan and can achieve a lower forecast error, the BrP will possibly have an even greater portfolio and can thus better carry the risk. In addition, the BrP has already incorporated this forecast risk in its current operations.
Considering the above conclusions, it is recommended that within USEF a solution should be found to spread the risk of forecasting the uncontrollable load more fairly and logically amongst the flexibility market players. One of the solutions for this is that the Aggregator must be able to choose to be only responsible for one small part of the load, namely the load from the smart appliances. An addition to the fact that this significantly reduces the Aggregator’s business risk, it also brings the added advantage that the possibility for gaming towards the DSO is reduced. If an Aggregator only makes a load forecast for the controllable load, a smaller part of the total energy consumption that can cause congestion is included in the D-prognosis. this means that an Aggregator can less easily create a load forecast that “causes congestion” and that would stimulate the DSO to purchase flexibility unnecessarily.
6.3 a market model with multiple trading moments is desirable
In the project, two forecasts were made by the Aggregator for each moment of the day: once the day before (Day Ahead) and once during the day itself (Intraday). this means that the DSO and the BrP could purchase flexibility at these two times in Plan/Validate. In addition, in the project the DSO could also purchase flexibility at a third moment, namely in the Operate phase. More details regarding this implementation are described in Appendix D.
Figure 33 shows the extent to which flexibility is purchased by the DSO and BrP and at which moment in time. the figure shows that flexibility trading took place at various times. Both the BrP and the DSO purchased approximately half of their flexibility in the project during the Day Ahead flexibility trading moment. For the DSO, approximately a quarter of the flex-orders were placed during Intraday, and a quarter during Operate.
47% 49%
25%
51%
28%
0% 10% 20% 30% 40% 50% 60% 70% 80% 90%
100%
DSO orders BRP orders
Day Ahead Intraday Operate
Figure 33: Percentage DSO and BrP orders for Day Ahead, Intraday and Operate. these percentages are
based on number of orders (#); the volume of the orders is not taken into account. the BrP could not
place Operate orders in the project.
Although the percentages from Figure 33 are project-specific, they do show that purchasers of flexibility need multiple trading moments. the rationale behind this is that at different points in time, information becomes available with which the needed flexibility can be determined. As this information arrives at various moments, there can thus also be a new need to purchase flexibility at various moments. A BrP can, for example, only determine the flexibility on the imbalance market if information is available about the imbalances; this is only available at the moment itself or just before. However, the application of flexibility by the BrP on the APX Day Ahead market can already be determined the day before, once information is available about the Day Ahead market. Based on a forecast, a DSO could try to purchase flexibility as early as possible (the day in advance or even earlier) in order to, for example, reduce an evening peak. However, during the evening peak itself, new information can become available, for example about the actual electricity consumption, which makes the DSO decide to purchase yet additional flexibility. For a flexibility market, it is thus necessary that purchasers have the opportunity to trade flexibility at various moments, and always using the most recent information.
the DSO and the BrP procured flexibility at multiple moments in time

7 outlook: how to continue?

49EnergieKoplopers
7 Outlook: How to continue?
EnergieKoplopers has demonstrated the successful application of flexibility through a flexibility market. the applied flexibility creates value for all participating parties and therefore contributes to a reliable, affordable and sustainable energy system. But what is needed to apply a flexibility market on a large scale in the Netherlands? Which barriers must be resolved now in order to be prepared for the future? And which opportunities are there for the further development of the flexibility market? this chapter gives answers to these questions.
the energy supply in the netherlands is becoming more sustainable Currently, the reliability of the energy supply in the Netherlands is not in danger. We have an electricity system that functions very well and because of the relatively low share of solar and wind, the balance between supply and demand of energy is easy to maintain. But this will change: by signing the Energy Agreement in 2013, the foundation was laid for a long-term policy regarding a sustainable energy supply. As a consequence of this, in recent years the growth in solar, wind, electric cars and heat pumps has started to take off, but the initial consequences of this sustainable growth have also become visible in the energy system. the Netherlands must stick to the ambitions in the Energy Agreement and at the same time be ready if large-scale problems start to manifest.
trust, standardisation and convenience are important for prosumers Prosumers will play a role in the energy system of the future, by offering flexibility. Confidence in the smart appliance and the organisation that controls the appliance is a determining factor in this. this means that the reliability and ease of use of automatically controlled smart appliances will determine whether flexibility can be unlocked in households. It is therefore important that appliances are made controllable in a uniform way. this is necessary both in the area of hardware standardisation as well as It standardisation, in order to keep the development costs as low as possible. In addition, the project demonstrated that investment barriers need to be removed as far as possible. For consumers, having no costs is more important than earning money.
Grid operators must have the opportunity to use flexibility as an alternative to grid reinforcement Currently, the DSO in the Netherlands is obliged to switch to grid reinforcement if there is a peak load that is too high for the current network. In doing so, the DSO may not use the alternative options that are now being created to offer the best societal result. Legislative change is needed to enable this and also to put a flexibility market in perspective with other alternatives for grid reinforcement14. If it is chosen to use a flexibility market, the DSO will have to develop an assessment framework15 in order to purchase flexibility or not. the above is important in order to keep the system’s reliability and affordability to a level comparable with that of the current, traditional system.
no flexibility without a price Flexibility can only play a role in the energy system when both the users and the providers of flexibility are satisfied with the price. In EnergieKoplopers no explicit research was conducted into the dynamics of price forming of flexibility. And yet, these price dynamics are very important and need to be understood very well. After all, a price is essential in order to achieve an economic transaction. For example, what would be the price of flexibility if a DSO would only need flexibility once per year (for example one evening peak demand)? For what price in this case would both the DSO and Aggregator be prepared to trade flexibility with each other? At first sight, this situation seems positive for a DSO: flexibility only needs to be used once to prevent grid reinforcement and hence the costs would be low. However, this situation would not be very interesting for an Aggregator , because flexibility can only be sold once, while all the fixed costs are still made. It is important to research how this paradox can be resolved. In summary, the dynamics of price forming should be understood by all parties so that a fair and optimum societal price is achieved for flexibility.
14 this could include a central storage, dynamic tariffs, flexibility among large-scale users and industry, flexibility without market operation, and real-time flexibility without prognoses.
15 Identified components of such an assessment framework are: presence of an Orange regime, risk preparedness of the DSO, price of flexibility and a possible fine regime.

50 Chapter 7
a fair distribution of risks is essential in a flexibility market to create value for all parties Because a market for flexibility works on the basis of prognoses, there is an inherent risk in the flexibility market that a forecast is not correct. In the project, this risk was almost totally bared by the Aggregator, from which it was concluded that this responsibility has a significant impact on the delivery of flexibility by the Aggregator. this forms a large risk for the Aggregator’s business and threatens the reliability of the application of flexibility from the viewpoint of the DSO and BrP. One recommendation therefore is to search for alternatives for this, for example in the distribution of risks within the USEF market model or through a further development of the Orange regime. In addition, it was shown that it is important that the Aggregator and the BrP make clear contractual agreements on how the BrP should be compensated if the Aggregator causes changes in the BrP portfolio which lead to costs.
Continuous development of the useF flexibility market is needed Finally, in EnergieKoplopers, the USEF flexibility market was used in a way that matched the research objectives of the project. this offered many insights regarding the operation of USEF and the interaction between all players. However, the flexibility market as described by USEF is more complex and contains more aspects than applied in the project. the presence of just one Aggregator and the relatively low number of iterations of flexibility trading for example, formed a limitation in demonstrating all the market forces and dynamics.
In a follow-up project or USEF implementation, it would be worthwhile applying further market forces and to increase the dynamics of the market, in order to create a real market for flexibility. this could be through such things as adding multiple players (Aggregator, BrP, DSO), multiple market segments (SME), or additional types of flexibility (electric cars or batteries). Further, it is important for a flexibility market that really starts to work, that players have a clear assessment framework in order to determine when the purchase of flexibility would pay off and under which circumstances the business case is positive. Such a fully-functioning flexibility market, in which Aggregators compete with each other in order to supply the best and cheapest flexibility, will in the future offer solutions to future problems in the energy system. And in doing so, a future flexibility market will safeguard that flexibility ultimately is applied in a way that is best for society.

Appendixa to F

52 Appendix A
Appendix A Definition list
term abbreviation definition
Aggregator AGr Party within the USEF flexibility market that collects flexibility from Prosumers and sells this as service to the BrP and/or DSO.
Aggregator-plan A-plan the plan that the Aggregator and the BrP agree to realise. the plan comprises the forecast of the Aggregator, in which the BrP and DSO flex-orders are processed.
Arbitragion Profiting from the price differences between related effects. In the project this concerns, for the BrP, the difference between flex price and electricity price.
Personal Page (Portal)
Website in which participating households could obtain personal information about: energy consumption, compensation, flex payment, control of the smart appliance, thermostat.
Balance responsible Party
BrP Party that is responsible for actively balancing supply and demand of electricity in its portfolio. the BrP can purchase flexibility from the Aggregator to optimise its portfolio.
Common reference Operator
CrO Central database in which the possible ‘congestion points’ can be made known by the DSO role.
Congestion - A peak in electricity consumption or production that falls outside the capacity of the grid. this can concern both an evening peak or solar peak.
Congestion point - A collection of households on the grid, in which the DSO expects that congestion could occur.
Controllable load - the energy consumption of the smart appliances. this energy consumption can be influenced by the Aggregator.
Day Ahead DA Flex trading in the Plan or Validate phase, which takes place a day in advance.
Distribution System Operator
DSO Party that is responsible for cost-effective distribution of energy across the grid. the DSO can purchase flexibility from the Aggregator to reduce peaks in the grid.
Flexibility - the option to change the energy consumption, or the production of this.
Flex-up - Flexibility by controlling smart appliances in such a way that consumption increases (e.g.. switching off solar panels).
Flex-down - Flexibility by controlling smart appliances in such a way that demand reduces (e.g.. switching off heat pumps).
Flex forecast - A (daily) forecast of the amount of flexibility that the Aggregator can sell to the DSO and/or BrP.
Flex forecast error - the difference between the actual and forecasted amount of available flexibility.

53EnergieKoplopers
Flex-order FO An order of a certain amount of flexibility by the DSO and/or BSP from an Aggregator.
Flex-portfolio - the Aggregator’s portfolio, in which the amount of flexibility that is available at which point is maintained.
Flex price - the price of flexibility that the Aggregator calculates for the supply of flexibility to the DSO and/or BrP.
Flex payment - Payment that the Prosumer receives from the Aggregator for allowing their smart appliances to be controlled.
Intraday ID Flex trading in the Plan or Validate phase, which takes place during the day.
Load forecast - A (daily) prediction of the net energy consumption of all households.
Load forecast error - the difference between the actual and forecasted consumption of all households.
Non-controllable households
- Households connected to an electricity cable without a smart appliance, but can possibly cause congestion.
Operate phase OP FPhase of USEF flex trading in which the Aggregator controls the smart appliances.
Plan phase - Phase of USEF flex trading in which the BrP purchases flexibility from the Aggregator.
Prosumer - A consumer that does not only consume energy but also produces it. the Prosumer also supplies flexibility to the Aggregator.
Program time Unit PtU the smallest period in which energy and flexibility can be traded. In the project a PtU of 15 minutes was used.
retailprijs the price for which the BrP settles electricity with the end user in the project. In the experiments this was set at €0.06 / kWh.
Settle Phase of USEF flex trading in which it is determined how much flexibility is delivered by the Aggregator. On the basis of this, the sold flexibility is settled and any fines can be paid.
Universal Smart Energy Framework
USEF Market model for flexibility the USEF describes the market regulations in which the Aggregator can sell flexibility to the DSO and/or BrP.
Uncontrollable load the remaining energy consumption of the households that cannot be directly influenced by the Aggregator. this includes the kettle, standby power or white goods.
Validate phase Phase of USEF flex trading in which the DSO purchases flexibility from the Aggregator.

54 Appendix B
Appendix B the USEF flexibility market
EnergieKoplopers is the first project in which flexibility was traded according to USEF principles. this appendix introduces:
• B.1 the USEF market model
• B.2 Flexibility trading according to USEF
• B.3 the USEF operating regimes
this also describes the way in which USEF was implemented in the project. More details about the implementation of USEF in the project can be found in Appendix D.
B.1 the USEF market model the Universal Smart Energy Framework (USEF) is a market model in which the flexibility trading is described. this flexibility comes from smart appliances that are present at so-called Prosumers. these are presented diagrammatically in the figure below. the project’s most important implementation choices are stated here (in blue).
Prosumer Aggregator€
€
€
FLEXIBILITY
UFLEX
UFLEX
DSO
BRP
200 smart devices at Prosumers’ prem-ises supply flexibility. The Aggregator can apply this flexibility by controlling by the PowerMatcher
In the project, dynamic tariffs are no applied. After substraction of the profit margin for the Aggregator, the profit is divided amongst the 200 participants
The Aggregator sells flexibility to BRP and DSO (Day Ahead and Intraday) with the use of the USEF market principles
The BRP uses flex-ibility for arbitrage on APX Day Ahead market and imbal-ance market
The DSO uses flex-ibility to reduce solar peaks and evening peaks
Every month, it is calculated how much flexibility is sold en delivered for which price. This results in the profit of the Ag-gregator
Figure 34: the USEF market model, with the project’s most important implementation choices (blue).

55EnergieKoplopers
For the USEF concept in EnergieKoplopers, the following roles were introduced:
• Prosumer: a Prosumer is an end user of energy that can offer flexibility. In the project, Prosumers were limited to households, in which 203 smart appliances were installed.
• Aggregator: an Aggregator (AGr) collects flexibility from Prosumers and sells this flexibility as a service to BrP and/or DSO. In this capacity the Aggregator brings supply and demand of flexibility together.
• BrP: a Balance responsible Party (BrP) is responsible for balancing supply and demand of electricity in its portfolio. Flexibility for a BrP is an additional method of portfolio optimisation. In the project, the BrP uses flexibility to arbitrate on the APX Day Ahead market and the imbalance market.
• DSO: a Distribution System Operator (DSO) is responsible for the active management of the distribution network. the DSO can use flexibility to maintain the distribution network in a better and more cost effective way. In the project, the DSO used flexibility to reduce solar peaks and evening peaks.
B.2 Flexibility trading according to USEF USEF describes flexibility trading in five phases. these phases are shown below. this also gives a brief indication of how the five phases were implemented in the project. For more specific details regarding the implementation, please refer to Appendix D.1.
table 1: the five phases of flexibility trading according to USEF
useF phase useF description implementation project
“In the contracting phase, various contractual relationships need to be established for USEF to function properly.”
• Participant contract
• Agreements between Aggregator and DSO
• Agreements between Aggregator and BrP
“In the planning phase, the Aggregator examines its portfolio of clients, each with its individual needs and flexibility preferences. Energy demand and supply are forecasted for the upcoming period, usually a calendar day. Both the BrP and the Aggregator carry out an initial portfolio optimization. During this phase, the BrP may procure flexibility from its Aggregators.”
Flexibility is traded with the BrP for arbitrage on APX Day Ahead market and imbalance market.
“In the validation phase, the DSO determines whether the forecasted energy demand and supply can be safely distributed without limitations. If the prognosis predicts congestion, the DSO may procure flexibility from the Aggregators to resolve it. It is important to note that there can be multiple iterations between the Plan and Validate phases ”
Flexibility is traded with the DSO to reduce the solar peak and the evening peak. In the project, there were no iterations between the Plan and Validate phases.
“In the operation phase, the actual assets and appliances are dispatched and the Aggregator adheres to its D-prognoses and A-plan. When needed, the DSOs and BrPs can procure additional flexibility from Aggregators to resolve unexpected congestion or to solve imbalance issues.”
the PowerMatcher controls the smart appliances. In doing so, the sold flexibility is delivered. During Operate, the DSO can buy additional flexibility if needed.
“In the settlement phase, any flexibility the Aggregator has sold to the BrPs and DSOs is settled. this settlement comprises contracted and delivered flex as well as contracted flex that was not delivered”
Once a month, it is calculated how much flexibility was sold and delivered for what price. the profit of the Aggregator is equally shared amongst the participants.
Contract
plan
Validate
operate
settle
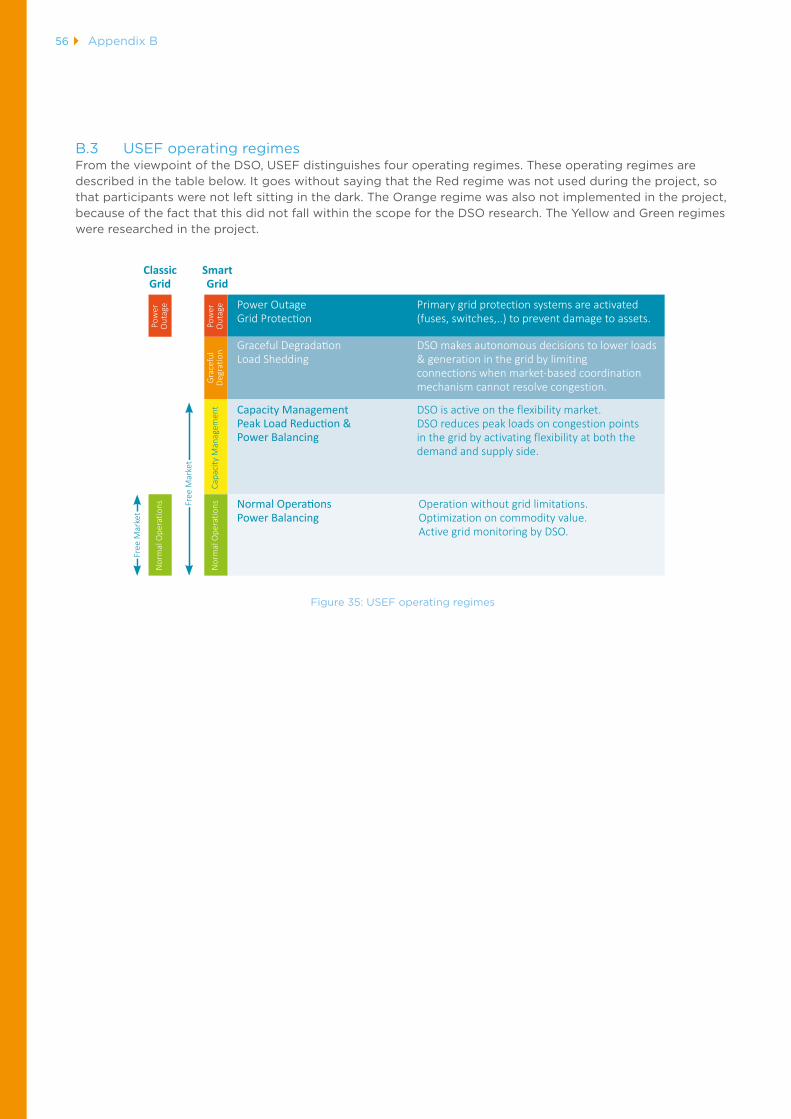
56 Appendix B
B.3 USEF operating regimes From the viewpoint of the DSO, USEF distinguishes four operating regimes. these operating regimes are described in the table below. It goes without saying that the red regime was not used during the project, so that participants were not left sitting in the dark. the Orange regime was also not implemented in the project, because of the fact that this did not fall within the scope for the DSO research. the Yellow and Green regimes were researched in the project.
Power OutageGrid Protection
Primary grid protection systems are activated (fuses, switches,..) to prevent damage to assets.
DSO makes autonomous decisions to lower loads & generation in the grid by limiting connections when market-based coordinationmechanism cannot resolve congestion.
DSO is active on the flexibility market. DSO reduces peak loads on congestion points in the grid by activating flexibility at both the demand and supply side.
Operation without grid limitations. Optimization on commodity value.Active grid monitoring by DSO.
Graceful DegradationLoad Shedding
Normal OperationsPower Balancing
Capacity ManagementPeak Load Reduction &Power Balancing
Nor
mal
Ope
ratio
ns
Nor
mal
Ope
ratio
ns
Gra
cefu
l D
egra
tion
Pow
er
Out
age
Pow
er
Out
age
Capa
city
Man
agem
ent
Free
Mar
ket
Free
Mar
ket
ClassicGrid
SmartGrid
Figure 35: USEF operating regimes

57EnergieKoplopers
Appendix C Design of Prosumer research
the project customer research aimed to explore the relationship between the Aggregator and Prosumer in the USEF model and ultimately offer advice about how this relationship can best be given form.
the Aggregator sells flexibility to its customers: the DSO and the BrP. In the USEF flexibility market, the current consumer is the supplier of this flexibility. In this new role, the end user is thus on the one hand customer of its energy supplier and on the other hand a supplier of flexibility; a role known as ‘Prosumer’. this new relationship in the energy system is central to this research, leading to the following research question “Which elements must a flex proposition (with automatic control of an appliance in the household) satisfy in order to unlock flexibility amongst Prosumers through an Aggregator?”
research design to achieve the objective a mix of research methods were used: qualitative and quantitative research, both within and outside the trial. Qualitative research is required to obtain understanding of Prosumer experience, quantitative research to then verify these insights.
the trial as research setting formed a bias amongst the trial participants. there was a high level of (personal) interaction with the project team, a participants’ fee, free provision of hardware, installation and support with It problems, the attraction of participating in innovative research. these are all elements that are not realistic for a large-scale approach and influenced residents (mainly positively). there is often also an intrinsic motivation present for participation that is not representative for the average Dutch citizen. Insights from the trial can therefore not simply be extrapolated to the market outside the trial. It was later also chosen to conduct research outside the trial amongst a random group of potential Prosumers in order to obtain a better estimate of the potential of a flex proposition to attract Prosumers.
A mix of traditional and modern test methods were used. the traditional research methods were necessary to demonstrate issues as fact-based and to make them quantifiable. the modern test methods used the creativity that is needed to design the propositions. traditional research gives a lot of insight into the experience and intention of participants. Intention is, however, a limited predictor for actual behaviour.
the Lean Startup method16 was used to obtain a good impression of the motivations as to why consumers want or do not want to have an appliance in the home that is controlled automatically. this method is extremely suitable for testing a value proposition in a short time, in which a good impression is formed in short-term iterations of which propositions are attractive to consumers or not, and why. In this, researching the intention was supplemented by ‘smoke testing’. By giving the consumer a realistic choice and by researching actions, insight was obtained into actual behaviour, which offers a rich addition to the insights regarding intention. the table below gives an overview of the research methods used.
16 Based on the method described in the book ‘the Lean Startup’ by Eric ries (2013)

58 Appendix C
table 2: Overview of research methods used
within the trial (trial participants): interviews, co-creation sessions and questionnaires
outside the trial (consumers): lean startup method
description of test group
n=203 this group has an average University of Applied Science educational level and a high level of knowledge of energy and sustainable energy systems, obtained during and outside the trial. the group comprised both men and women.
the group of consumers involved in the testing was representative for consumers in Dutch society that fall within the target group. the group comprised both men and women, aged 30+ with a mix of educational levels.
Qualitative Before the start of the trial: 3 co-creation sessions with residents about the topics: 1. Motivations to participate in the
trial
2. Dynamic tariffs
3. Development of the Portal
During the trial: three interview rounds with 5-10 residents on the topics:
4. Experiences with Personal Page
5. Interviews on value proposition flexibility
6. Brand values Aggregator party
7. Value proposition research flexible connection
At the end of the trial
8. Ideal future customer journey
Lean Startup method; proposition testing of 5 basic propositions in the area of flexibility.
Each of these propositions uses the same product: an appliance that controls the freezer automatically. In each of the different propositions, the marketing story of the product was different. Each story placed the accent on one motivation or a combination of motivations.
this research comprised 5 rounds with various accents (n= 10-12 per round). total: 50 (face-to-face or telephone) interviews with various respondents, recruited by a response agency. An additional selection criterion was that the respondents should have a freezer or fridge-freezer combination.
Quantitative 3 questionnaires (for the 203 participants)
• baseline measurement prior to start
• Interim measurement half way
• Final measurement at the end of the trial
Lean Startup method ‘smoke test’ 3-4 rounds: testing the attractiveness of a consumer proposition for flexibility compared to a benchmark, using a Facebook campaign.
reach of the campaign: 203, 414 consumers with a Facebook profile
Initially, in the resident research, use was to be made of a control group in order to investigate any changes in knowledge, attitude and behaviour through participation in the trial. this was rejected because, when appliances are controlled automatically, factors such as behaviour appeared to be less relevant for investigation. In the design of the research, leaving out the control group was replaced by measuring the motives, attitude and experiences of the trial participants at various points, so that an image was created of

59EnergieKoplopers
how participation in the trial influenced the participants. Also, particularly in proposition development, a lot of research was conducted outside the trial.
C.1 Design of qualitative research within the trial
Before the start of the trial: Co-creation sessions about the design of the trial
In the trial, the resident is central and co-creation sessions were used to design the trial according to the needs of residents. A large number of issues were already fixed, such as the choices of which appliances would be used.
Where there was space for residents’ input, this influenced the research. For example, following on from session 2, dynamic tariffs (which was in the original design) were not selected, but a profit share was chosen. the Personal Page was also designed using the input from residents.
• Session 1: Motivations to participate
• Co-creation session with 14 residents from the Stad van de Zon: groups considered the possible propositions around the 4 different appliances used in the trial.
• Session 2: Dynamic tariffs and appliances
• Co-creation session with 11 trial participants. this session comprised two components, that addressed both research questions:
» reward: the three reward scenarios were presented to the participants: security, profit sharing, dynamic. An inventory was made of the pros and cons for each of these scenarios, which scenario was preferred and why.
» Offer and limitations: Based on the draft registration form for the trial, it was researched how residents consider participation in the trial, which appliances receive the most enthusiasm and any possible objections that could be placed on participation.
• Session 3: Energy Monitor/Personal Page
• Feedback session with 11 trial participants. Objective: make an inventory of feedback and priorities of functionalities on the basis of the first version of the personal page.
Figure 36: Impression of co-creation sessions

60 Appendix C
Figure 37: Overview of functionalities on the Personal Page
during the trial: Because of the high knowledge level of participants in the trial, the trial lends itself well to testing various experience-related questions. During the trial interviews were organised about various topics:
• Interviews 1: interviews about initial experiences
• the research comprised six interviews with trial participants who had already used the Personal Page (n=6). the interviews lasted approximately 60 minutes and took place in July and August 2015.
• Interviews 2: insights from interviews about the value proposition
• 10 interviews of 60 minutes.
• Interviews took place in participants’ homes.
• Interviews 3: Brand values Aggregator party
• Individual interviews with 9 trial participants, the interviews took 30-45 minutes
• the interviews comprised roughly two components:
» Experiences and associations with the current situation with EnergieKoplopers.
» Selection and ranking of elements that participants find important in a controlling party. In this the participants were asked to make a choice from a set of 25 elements for the 6 most important, and to rank these according to importance.
• Interviews 4: Value proposition research flexible connection
• Individual interviews with 10 trial participants, the interviews took 45 minutes the interview comprised three parts:
» Explanation of the energy network capacity problem, based on the overview below. testing the knowledge level of participants and who they consider is responsible for solving the problem
» testing the attractiveness, and the for and against arguments of 3 propositions that could be a solution to the problem.
» Peak and off-peak rate
» Highest peak determines rate
» Freedom combined with battery
» test acceptance separate ‘PV-switch’ proposition

61EnergieKoplopers
after the trial:
• Co-creation session: ideal customer journey
Session organised with the research question being: How does the ideal customer journey of the future look? Where can concessions be made to make this journey realistic?
the session comprised two parts:
• Part 1: Per phase in the customer journey, obtain insight into the experiences and emotions of participants, and insight into which elements are important.
• Part 2: Priorities of these elements
C.2 Design of quantitative research within the trial During the trial, participants were asked to complete a questionnaire at 3 separate times: prior to the start of the trial (baseline measurement), half-way through the trial (interim measurement), and after the end of the trial (final measurement). At the time of writing, only the baseline and the interim measurements have been carried out. the results of these measurements are described below.
Some questions at the three measurement points were the same, in order to map out attitude and appreciation development during the trial period. the results of the various measurement moments were compared. In addition, the relevant insights from the qualitative research were also tested quantitatively using the questionnaire.
Baseline measurement: A total of 199 participants were approached to take part in the baseline measurement. Of these, 7 participants were exempted from completing the questionnaire. 190 respondents completed the questionnaire in full (n=190). this means that a response of 99% was achieved.
Interim measurement: A total of 200 participants were approached to take part in the interim measurement, of which 10 were exempted from completing the questionnaire. 177 respondents completed the questionnaire in full (n=177). this means that a response of 93% was achieved.
Final measurement: A total of 198 participants were approached to take part in this final measurement. 177 respondents completed the questionnaire in full (n=177). this means that a response of 92% was achieved.
C.3 Design of qualitative research outside the trial the project researched the feasibility and the business model for an Aggregator, which offers flexibility to the BrP and DSO. the flexibility that the Aggregator offers, comes from Prosumers. the more flexibility the Aggregator can unlock and sell, the better the business model.
Based on insights from the research into motives for participation within the trial, a concept for a consumer proposition was developed in which flexibility was unlocked at people’s homes. A draft proposition was developed for this. this proposition did not actually exist as such, but in order to generate the most realistic reaction in the interviews and to the mock-up website, the impression was made that the appliance did actually exist.
the proposition was follows: Unlocking flexibility takes place through connecting a device to the freezer. this device was to be automatically controlled if there was a lot of (sustainable) energy available on the grid: the Easy Freeze. In various rounds, the most important motives for accepting the Easy Freeze were tested.
lean startup As Prosumers look like consumers, the Lean Startup method seemed a very suitable way to gain a quick feeling for the best proposition. the basic principles:

62 Appendix C
• Build: Produce a ‘minimum viable product’ based on your hypotheses.
• Measure: test this product amongst customers.
• Learn: Learn from the outcomes and integrate what has been learned.
the Easy Freeze Lean Startup process:
• Build: Design a value proposition and mock-up website for the flex proposition (the Easy Freeze a).
• measure: Site tested in 12 telephone interviews.
• learn and build: Development of Easy Freeze b according to insights from the Easy Freeze test.
• measure: Appetite tested in 10 face-to-face interviews.
• learn: Development of Easy Freeze c and d according to insights from the Easy Freeze a and b tests.
• measure: appetite tested in 2x9 telephone interviews.
• measure: researched separately: the influence of Essent as controlling party at Easy Freeze c.
test proposition: the easy Freeze, a device that controls your freezer In order to be able to explain the concept of flexibility to households well, the proposition was made as simple as possible. It was also decided to control an appliance that was already present in the home (namely a freezer). this is something that people can imagine in their current living situation. this is how the Easy Freeze originated, a device that you can connect to your freezer easily and that is controlled automatically when a lot of (sustainable/cheap) energy is generated.Further, three motives contributed positively or negatively to the value of the proposition. these were tested in various combinations (Easy Freeze a-d).
1. Sustainability: the possibility of making optimum use of sustainable energy and in this way to contributing to a sustainable energy system.
2. Flex payment: an annual payment of €30 from the Easy Freeze company.
3. type of company: is the Easy Freeze company a sympathetic startup or part of a big company.
overview of the tested propositions:: In each of the propositions, a different mix of motives was tested to discover the most important motive for participation.
sustainability Flex payment type of company
Easy Freeze a X Startup
Easy Freeze b X X Large company
Easy Freeze c X X Startup
Easy Freeze d X Large company
Easy Freeze c + Essent X X Large company
C.4 Design of quantitative research outside the trial A smoke test was conducted to obtain a feeling of the possible market size and demand for a proposition. the product was described in one website page. People could leave their e-mail address on the website if they were interested. Customers did not know that the product did not yet exist. the attractiveness of the proposition was measured using web analytics data, which was balanced against a benchmark of comparable propositions.

63EnergieKoplopers
Smoke test of four rounds based on Facebook campaigns. Each round tested a different set of settings.
• round 1: test with 4 differently designed advertisements to determine the most successful design, see also Figure 38: Overview of the tested advertisements
• round 2: Easy Freeze test proposition a (without flex payment) and Easy Freeze c (with flex payment) on desktop
• round 3: Easy Freeze test proposition a (without flex payment) and Easy Freeze c (with flex payment) on desktop and mobile (including affiliate websites)
• round 4: Easy Freeze test proposition a (without flex payment) and Easy Freeze c (with flex payment) on desktop and mobile (excluding affiliate websites)
the total number of consumers that saw the proposition was 203,414.
After rounds 1 and 2 it was decided to test further using the number 1 advertisement.
Round 1: And the winner is…
1 2 3
Figure 38: Overview of the tested advertisements
round 1: And the winner is...

64 Appendix D
Appendix D Design of data research
this appendix describes the design of the data research. the following subjects are treated:
• D.1 Various experiments during a year of research
• D.2 Chosen method of flexibility trading according to USEF
• D.3 Parameters during the experiments
• D.4 Flexibility trading by the BrP
• D.5 Business case calculation by the DSO
D.1 Various experiments during a year of research the research of the project ran for a year, from August 2015 to August 2016. In these 53 weeks, the It system controlled the smart appliances continuously, and flexibility trading took place almost continuously. In order to be able to provide an optimum answer to the research questions, the year is divided into different blocks in which various experiments were conducted. there were roughly four blocks. It is important to note here that the Aggregator was active in each experiment, while the DSO and BrP were only active in specific experiments. table 3: the various experiments
experiment description
Aggregator experiment
Experiment in which no flexibility trading takes place. the Aggregator makes a forecast resulting in a plan, sends this to the PowerMatcher, which then controls the appliances to follow the plan.
DSO experiment In this experiment, the Aggregator only sells the flexibility to the DSO, which results in a plan. the appliances are then controlled in order to follow this plan.
BrP experiment In this experiment, the Aggregator only sells the flexibility to the BrP, which results in a plan. the appliances are then controlled in order to follow this plan.
BrP/DSO experiment In this experiment, the Aggregator sells the flexibility to the BrP as well as the DSO, which results in a plan. the appliances are then controlled in order to follow this plan.
Apart from the Aggregator experiment, the blocks were periodically repeated in order to safeguard sufficient distribution of the data over the seasons. the Aggregator experiment only took place once, and can be seen as a test period for the It system, in which the extent to which the It system, combined with the smart appliances, was able to follow a plan.
the different sub-experiments are further described in paragraph F.2. the following paragraph first describes how the USEF flexibility trading was implemented in the project.
D.2 Chosen method of flexibility trading according to USEF the flexibility trading in the project was designed according to USEF market principles. No extensive and dynamic market for flexibility was implemented in the project in order to prevent complexity in the initial implementation of USEF in practice. In the project, just one Aggregator was active, and the Plan/Validate phases were partly iterative. the flexibility trading, as used in the project, is explained in more detail in the following paragraphs. plan/Validate During the Plan/Validate phases, the Aggregator could sell flexibility to the BrP (Plan) and the DSO (Validate). In the project this trade took place twice for every PtU: 1 x Day Ahead and 1 x Intraday. the DSO could also still order flexibility in Operate if necessary (see next paragraph). the Intraday flexibility trading was divided

65EnergieKoplopers
into 6 blocks of 4 hours in the project. In an Intraday block, flexibility could only be traded for the relevant 4 hours. this is displayed diagrammatically below.
Figure 39: Blocks of flexibility trading during Plan/Validate phases
At each moment that the flexibility trading took place, the BrP and/or DSO could only sell 1x flexibility for a certain PtU in the project. In other words: iterations between the Plan and Validate phase did not take place. the following actions were implemented (table 4):
table 4: Steps carried out during flexibility trading between Aggregator and BrP/DSO
plan
1 the DSO indicated his congestion points to the CrO (Day Ahead)2 the Aggregator collected the congestion points from the CrO (Day Ahead)3 the Aggregator made an initial forecast (Day Ahead) or a forecast update for the coming 4
hours (Intraday)4 the Aggregator sent the A-plan to the BrP5 the BrP sent a Flexrequest to the Aggregator (volume)6 the Aggregator looked in his flex portfolio and sent FlexOffers to the BrP (price + volume)7 the BrP examined the APX prices (Day Ahead) or imbalance prices (Intraday) and decided
whether he wanted to purchase flexibility or not8 the BrP placed a FlexOrder for the Aggregator (volume + price)9 the Aggregator processed the FlexOrder in the A-plan10 Dthe Aggregator sent the updated A-plan to the BrP11 the BrP approved the A-plan12 the Aggregator sent the D prognosis
Validate(for each
congestion point)
13 the DSO added its forecast of non- Aggregator connections to the D prognosis14 the DSO made a grid safety analysis to investigate whether congestion was expected15 If so, the DSO sent a Flexrequest to the Aggregator (volume)16 the Aggregator looked in his flex portfolio and sent a FlexOffer to the DSO (price + volume)17 the Aggregator sent his remaining flexibility as FlexOffer to the DSO for possible Operate
FlexOrders (Intraday)18 the DSO placed a FlexOrder for the Aggregator. In this, the DSO did not make a price
consideration because only one Aggregator was active in the project19 the Aggregator processed the DSO’s FlexOrder in the A-plan
plan20 the Aggregator sent the updated A-plan to the BrP21 the BrP approved the A-plan22 the Aggregator processed the DSO’s FlexOrder in the D prognosis
Validate (for each
congestion point)
23 the Aggregator sent the updated D prognosis to the DSO24 the DSO approved the D prognosis

66 Appendix D
Flexibility trading in the Plan/Validate phase thus took place entirely on the basis of forecasts. the most important forecasts that were used were the forecasts from the Aggregator, the forecasts from the DSO of non-Aggregator connections, and the Aggregator’s forecast of the flex-portfolio.
operate During the Operate phase, the Aggregator sent the agreed A-plan/D prognosis to the PowerMatcher. the PowerMatcher then controlled the smart appliances in each PtU to achieve the Aggregator plan.
In the Operate phase the DSO could also place (extra) FlexOrders, if it appeared, based on actual measurement data (not forecasts) that congestion still occurred. In this case, the open FlexOffers (action 17 in table 4) were converted into a FlexOrder. In the project, the DSO could only place a FlexOrder in the Operate phase for the current PtU and the following PtU.
In summary, the BrP could thus make two FlexOrders per PtU (Day Ahead and Intraday), and the DSO could make three (Day Ahead, Intraday and Operate). this was selected as it was expected that BrP price optimisation on APX and imbalance price would currently be the most relevant. the market for Intraday electricity prices was not yet liquid enough to use in a trial environment. As it was decided to allow the BrP to trade during Intraday according to the imbalance prices instead of during Operate, it was assumed that the BrP had perfect forecast of the imbalance prices. As this was not actually the case here, a best-case approach was chosen for the BrP’s business case.
the flexibility trading used in the project between the Aggregator on the one hand and DSO and BrP on the other is presented in a simplified way in the figure below.
Figure 40: USEF flexibility trading between Aggregator and DSO/BrP in the project (simplified representation)
settle the extent to which the ordered flexibility was delivered or not, can be calculated using the final energy consumption per PtU, the agreed A-plan and/or D prognosis and the FlexOrders. Settlement was calculated in a different way for the BrP and DSO.

67EnergieKoplopers
Brp settlement:
For the BrP in the project, two types of settlement were distinguished:
1. Settlement of flex-orders
• Flex orders were always delivered. this is because, when the BrP placed an order this was a direct transaction on the energy markets, which meant that the profit could be booked directly by the BrP, independent of the actual energy consumption realised. All changes following on from this were actually a change of the agreements made and could lead to a fine if this was negative for the BrP.
2. Changes in relation to agreements
• Order DSO: this concerns the impact of the DSO’s Flex Orders on the BrP’s portfolio. this could thus also concern orders from the DSO that can ‘unmake’ the order from the BrP. In this case it applies that the BrP did deliver the order (after all the Aggregator had not made any errors), but the BrP had the opportunity to request compensation from the Aggregator for the impact on the portfolio.
• ForecastUpdate: as the Aggregator sends a ForecastUpdate the BrP must purchase more or less electricity on the markets. this has an effect on the BrP’s portfolio.
• ActualPower: as the Aggregator has not stuck neatly to the agreed A-plan, the BrP becomes imbalanced. the difference is settled using the imbalance price. this can work out positive or negative for the Aggregator.
dso settlement:
For the Settlement, the DSO looks at the extent to which a FlexOrder has been delivered. this can best be clarified using an example:
• AGr forecast for a PtU = 10
• DSO buys -3 in flex
• Agreed D prognosis is 10 -3 = 7
• AGr realises 7 => all flex is delivered => 3 flex is paid
• AGr realises 6 => excess flex is delivered => 3 flex is paid
• AGr realises 8 => deficient flex is delivered => 2 flex is paid
• AGr realises 11 => no flex is delivered => 0 flex is paid
If multiple flex-orders are made by the DSO in a PtU, the Day Ahead flex-order will be delivered first, then the Intraday flex-orders and then the Operate flex-orders.
orange regime the USEF processes for the Orange regime were not used in the project. If the DSO had congestion as a consequence of the fact that the Aggregator has insufficient flexibility, these events have been logged, but actions from the DSO to prevent congestion were not implemented.
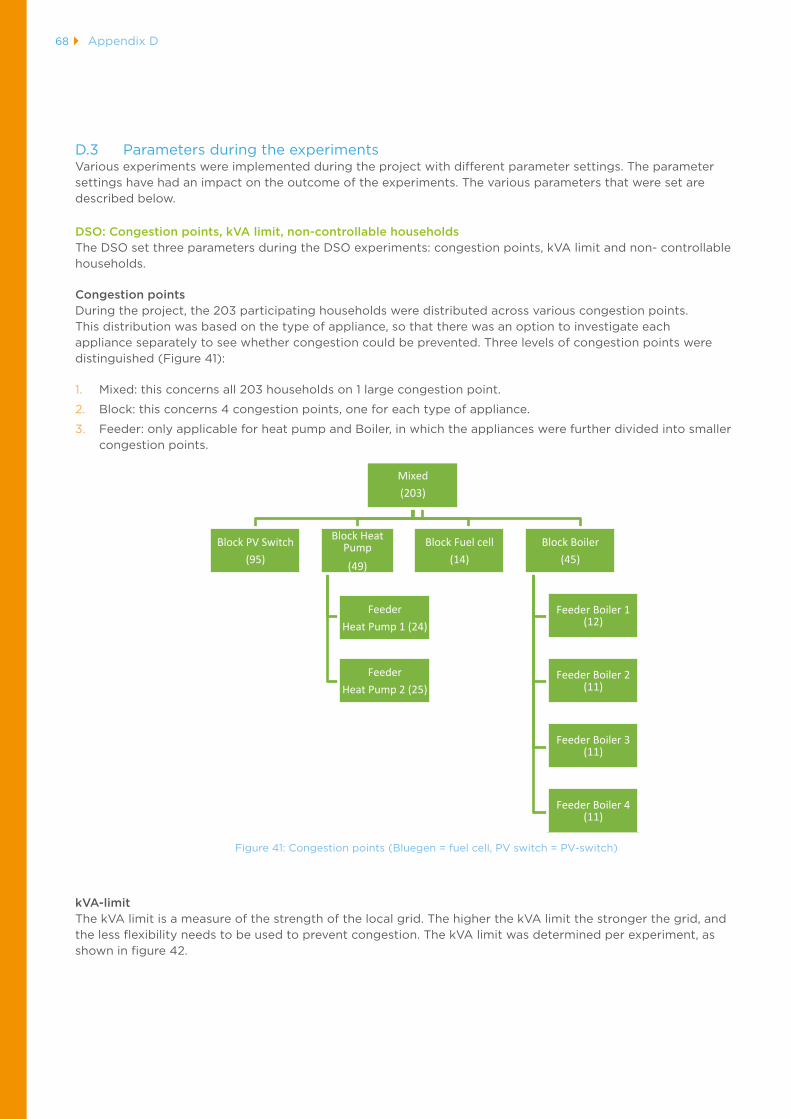
68 Appendix D
D.3 Parameters during the experiments Various experiments were implemented during the project with different parameter settings. the parameter settings have had an impact on the outcome of the experiments. the various parameters that were set are described below.
dso: Congestion points, kVa limit, non-controllable households the DSO set three parameters during the DSO experiments: congestion points, kVA limit and non- controllable households.
Congestion points During the project, the 203 participating households were distributed across various congestion points. this distribution was based on the type of appliance, so that there was an option to investigate each appliance separately to see whether congestion could be prevented. three levels of congestion points were distinguished (Figure 41):
1. Mixed: this concerns all 203 households on 1 large congestion point.
2. Block: this concerns 4 congestion points, one for each type of appliance.
3. Feeder: only applicable for heat pump and Boiler, in which the appliances were further divided into smaller congestion points.
Mixed (203)
Block PV Switch (95)
Block Heat Pump (49)
Feeder Heat Pump 1 (24)
Feeder Heat Pump 2 (25)
Block Fuel cell (14)
Block Boiler (45)
Feeder Boiler 1 (12)
Feeder Boiler 2 (11)
Feeder Boiler 3 (11)
Feeder Boiler 4 (11)
Figure 41: Congestion points (Bluegen = fuel cell, PV switch = PV-switch)
kVa-limit the kVA limit is a measure of the strength of the local grid. the higher the kVA limit the stronger the grid, and the less flexibility needs to be used to prevent congestion. the kVA limit was determined per experiment, as shown in figure 42.

69EnergieKoplopers
Flex for: Experiment # congestion
points Controllable Households kVALimit (kVA)*
NonControllable Households*
DSO 1a: PV in boilers - 1.0kVA 1 45 150 105
DSO 1b: PV in boilers - 1.5kVA 1 45 225 105
DSO 1c: PV in boilers - voltage control 4 11 15 15
DSO 2a: PV switching - 1.0 kVA 1 90 150 60
DSO 2b: PV switching - 1.5 kVA 1 90 225 60
DSO 3: PV + Fuel Cell - 1.0 kVA 1 16 50 34
DSO 4: evening peak + Fuel Cell - 0.5 kVA 1 16 20 19
DSO 5a: evening peak + HP - min 0.2 kVA 1 50 variable 25
DSO 5b: evening peak + HP - cable 2 25 variable 10
DSO 5c: PV + HP - 1.0 kVA 1
Figure 42: the set parameters during the DSO experiments
non-controllable households As well as households with a smart appliance, households without a smart appliance are also connected to an electricity cable, use the grid and thus can cause congestion. these households are called non-controllable households. For these households the DSO produced a daily forecast and added these to the D prognosis in order to make an inventory of whether congestion was expected. In the project both the number of households as well as the kW peak could be set for the non-controllable households.
Brp: price scenarios During the BrP experiments the BrP used scenarios, on the basis of which calculations were made for the APX and the imbalance. the project used rWE-simulated APX and imbalance prices for the year 2025 in two scenarios:
1. Green and Easy: this scenario is characterised by a large amount of sustainable energy that is generated centrally.
2. Independence: this scenario is characterised by a large amount of sustainable energy that is largely generated centrally and stored in batteries.
aggregator: Flex prices During the USEF and BrP experiments, the Aggregator modified the prices of flexibility. this did not make a difference to the amount of flexibility that the DSO bought, as the DSO made no price consideration in the project17, but it did for the BrP. If flex prices are low, it is more interesting for the BrP to trade this flexibility on the energy markets. thus, the BrP will sell a lot of flexibility in that case. the Aggregator on the other hand, in spite of selling lots of flexibility, does not gain many returns from the flexibility. If flex prices were high, the BrP did not purchase much flexibility.
the change in flex prices appeared to be mainly interesting for the BrP/DSO experiments, in which flexibility was sold to both the DSO as well as the BrP. If the BrP had actually purchased a lot of flexibility, this could have impacted on the DSO. By purchasing flexibility, the BrP could, for example, cause or prevent congestion, or ensure that the DSO could no longer purchase flexibility because the flexibility was already sold.
the flex prices were fixed during the DSO experiments. these were constructed from the following components:
17 this was chosen because there was just 1 Aggregator in the trial, which meant that it was not possible for the DSO to make a price consideration between the various Aggregators. the Orange regime was also not implemented in the trial, which meant that the DSO could not make a consideration during the design of the trial nor could an assessment framework for purchasing/not purchasing flexibility be developed by the DSO.

70 Appendix D
1. Marginal appliance cost: the costs for controlling a smart appliance. For example by switching off a solar panel, a household no longer produces energy. Households were compensated for this.
2. Aggregator risk premium: premium for forecasting the risk run by the Aggregator
3. Aggregator margin: the Aggregator obtained its profit from this
4. Prosumer margin: costs for any flex payment to the Prosumer
the flex prices used are displayed in the table below.
table 5: Flex prices used during DSO experiments. During the BrP/DSO and BrP experiments, the flex prices were varied.
Fuel cell electric Boiler pV switch heat pump
type Flex-down Flex-up Flex-up Flex-down
Flexibility € 45,7 ct/kWh € 11,1 ct/kWh € 15,2 ct/kWh € 25,4 ct/kWh
D.4 Flexibility trading by the BrP A BrP can deploy flexibility for portfolio optimisation. If optimisation supplies more than the costs of flexibility, then this is, in principle, interesting for a BrP. A BrP will therefore always have to make an economic consideration of whether or not to purchase flexibility from the Aggregator. In the project, the BrP had two options to realise portfolio optimisation with flexibility:
1. Day Ahead: the BrP could order flexibility from the Aggregator the day before. the BrP used this option to arbitrate18 on the APX Day Ahead electricity market.
2. Imbalance: the BrP could order flexibility Intraday from Aggregator for a certain moment. the BrP used this flexibility to arbitrate on the tennet imbalance market.
In the project the BrP ordered the flex-up when:
APX price + price flexibility < retail price or when
Imbalance price + price flexibility < retail price
In the project the BrP ordered the flex-down when:
APX price - price flexibility > retail price or when
Imbalance price - price flexibility > retail price
the BrP could, however, never order more flexibility than offered by the Aggregator. Given this restriction, in the project there were three variables for a BrP to purchase flexibility or not for portfolio optimisation. these variables are:
1. the APX Day Ahead or imbalance price
2. the price of flexibility
3. the retail price
the combination of these variables determined whether the BrP ordered flexibility or not.
18 Arbitration in an economic sense is profiting from price differences between various related effects. In the trial, this was the price difference between the price on the APX or imbalance market on the one hand and the retail price for which the BrP sold electricity to the customer on the other. Arbitration can generate a risk-free profit.

71EnergieKoplopers
D.5 Business case calculation by the DSO Some nine factors were incorporated in the sensitivity analysis of the business case. to obtain insight into the sensitivity of these factors on the business case, a net cash value (NCV) calculation was carried out. this NCV calculation indicates which alternative, over a term of 40 years, would offer the most positive result. An interest percentage of 4% was used for the NCV calculation.
the same calculation method is used within Liander for investment decisions. to calculate the business case of flexibility, as much possible input from the project was used. the load is based on measurement data from the project. A group of 250 households was assumed (the total number of homes in most experiments, including 50 non-controllable households). Where needed, this data was supplemented to obtain a complete load profile for an entire year. Figure 43 indicates the load profile, from the start of the measurements in Heerhugowaard
(23-9-2015).
Sept 2015 Sept 2016
Figure 43: Load diagram of 250 homes in Heerhugowaard. Load above and below the congestion limit indicates respectively the congestion for the evening peak in the winter and the solar peak in the summer.
the following values were used for the sensitivity analysis of the factors (see table below). the standard value was based on the averages from the project experiments or, where indicated, was determined in another way. the minimum and maximum values indicate the distribution within which a factor is varied.
table 6: input parameters for calculating the DSO’s business case.
Factor unit min. value trial Finding max. value
Excess ordered flex (up) % 0 35 50
Excess ordered flex (down) % 0 10 50
Delivered flex (up) % 70 76 100
Delivered flex (down) % 70 82 100
Congestion limit kW 150 200 250
DSO technology costs €/hh/year 0 4 20
Flex price (up) €/kWh 0,05 0,14 0,35
Flex price (down) €/kWh 0,05 0,26 0,35
Costs of grid reinforcement €/hh 50 150 550
Costs of malfunction €/duration malfunction/hh
1
Costs of malfunction minutes 90

72 Appendix D
the value of the congestion limit (200 kVA) was used in various experiments and resulted in a net capacity of 0.8 kVA per household. the costs of grid reinforcement are based on expert estimates and are determined at €150 per household. For 250 homes, this resulted in a one-off investment of €37,500 for grid reinforcement. As indication; for this amount, the transformers and several cables could be replaced. If serious congestion occurred, the costs of this were included in the calculation. this is calculated as standard within Liander at €1/minute malfunction/households. the duration of the malfunction is estimated at 90 minutes, resulting in a total cost item of €22,500 per malfunction.

73EnergieKoplopers
Appendix E Detailed results
this appendix presents more detailed results of the project. the following subjects are treated.
• E.1 DSO business case
• E.2 Six reasons why flexibility is not always delivered to the DSO
• E.3 BrP flexibility trading results
E.1 DSO business case Figure 44 indicates the results of the sensitivity analysis. the mid point is the result of the project and the direction of the lines indicate the sensitivity of factors with most influence on the business case. the 0-line is the line from which the business case becomes positive.
Figure 44: Sensitivity analysis business case, five most sensitive parameters.
the following can be seen in the figure:
• the business case is mostly determined by the congestion limit, or the limit from which flexibility can be ordered.
• the costs of the alternative (grid reinforcement) also logically have great influence on the business case. the higher the costs of grid reinforcement, the sooner it becomes viable to use flexibility.
• the costs lost by the DSO for the technology to enable the application of flexibility are of considerable influence to the business case. this parameter depends on the amount of ordered flexibility.
the sensitivity analysis demonstrates that the business case is influenced least by the change of the following parameters:
• Excess ordered flexibility (both up and down) and delivered flexibility (both up and down). the effect of the excess ordered flexibility is subdued by the flex delivery. A part of what has been ordered in excess is not delivered and therefore does not influence the costs for flexibility. Purchase of the flex delivery does, however, influence the amount of congestion, but as long as this is not serious congestion, the business case will not be influenced significantly.

74 Appendix D
• the price that must be paid for the flexibility has a limited impact on the business case. this is partly because the delivery percentage of 67% ensures that almost a quarter of the flexibility is not delivered and is thus not paid. this subdues the effect of the price of flexibility on the business case.
Figure 44 shows further that the costs of grid reinforcement greatly influence the business case. When grid reinforcement costs increase, it pays to use flexibility earlier. For the values of the project, it applies that the business case for flexibility is positive when the alternative of grid reinforcement is cheaper than €230/household (€57,500, this break-even point is, for that matter, specific for the project situation).
In the event of grid reinforcement, the basic principle is that after the grid reinforcement, no overload will remain because:
• the overload cannot be controlled actively without the application of flexibility;
• Material costs of a grid reinforcement are relatively low. If reinforcement is still needed, this can take place relatively cheaply with sufficient grid capacity.
the required flex volume is determining for the business case and depends on the congestion limit combined with the local grid load. Figure 45 shows that the congestion limit has great impact on the business case. this is because the limit has direct influence on the amount of flexibility that needs to be ordered. Figure 45 shows that the business case in the project situation becomes positive from a congestion limit of 215 kW.
From this it can be concluded that the structural application of flexibility creates a negative business case and the purchase of incidental peaks gives a positive business case.
Figure 45: Impact of the congestion limit on the business case and required flex volume
the required amount of flexibility also depends on the local grid load. A higher grid load for an equal congestion limit, results in an increased need for flexibility. In the sensitivity analysis of the business case the grid load was based on the measured load of the project and was not varied.
in the future, the required flex volume can be influenced by accepting (minor) overload. By permitting (minor) overload, the required flex volume can be significantly reduced, without this directly increasing the risk of malfunctions.
the amount of flexibility that is needed to prevent congestion depends partly, as stated previously, on the limit above which flexibility is ordered. the physical congestion limit in an area cannot be adjusted without making grid investments. However, it is possible to start ordering flexibility only from a higher limit and permitting (minor) overload below this limit. the various possible limits are indicated in Figure 46 using lines.

75EnergieKoplopers
the black line is the physical congestion limit, above which congestion occurs. For a limit of 110% the required flexibility drops from 9000 kWh to 3000 kWh and for a limit of 120% even to 700 kWh (see also Figure 46). this saves considerably in costs and improves the business case.
the risk of malfunctions does not directly need to increase if the height and duration of the overload is controlled and, if necessary, adjusted. Figure 46 shows when the malfunction risk becomes critical. When 10% overload is permitted (yellow line), this results in heating up of components, but this only causes a malfunction after more than 6 hours at the same load level. When permitting a maximum 20% overload (orange line), depending on the environment and weather conditions, the components can cope with up to approximately 5 hours of load at the same level.
Figure 46: Load diagram with the physical congestion boundary (black line), 10% overload (yellow line) and 20% overload (orange line)
As the risk margins are reduced when minor overload is permitted, it is of greater importance that flexibility can always be delivered; a condition is thus that the flexibility delivery is reliable or USEF is provided with a good alternative for the flexibility market (Orange regime). the role of an accurate forecast also becomes more important.
the dso can optimise between risk of insufficient flexibility and costs for flex In the area of tension between risk and costs, the DSO can improve its business case by reducing the costs for the purchase of flexibility. In the project, however, it is often the case that excess flexibility was ordered and there was an option to order less flexibility. However, by ordering less flexibility, the risk also increases that insufficient flexibility is ordered. the DSO can optimise between the risk of insufficient flexibility and the costs of flexibility.
in the project excess flexibility was often ordered In the project, the DSO often ordered more flexibility than was needed to prevent the congestion. this was because the DSO used a conservative prognosis for the PV generation, so that it was relatively certain that the congestion could be resolved. Figure 47 shows the days in which the congestion was entirely prevented. In almost all cases, more flexibility was delivered than needed (sometimes more than twice as much) in order to prevent the congestion. Almost all flexibility that was ordered for a projected PV overload was ordered Day Ahead.

76 Appendix E
Figure 47: the days in which the congestion was easily resolved. It can be seen that mostly more flexibility was used than was needed to prevent the congestion
there was an option to order flexibility more effectively Savings on the purchase of flexibility can be made by using a less conservative DSO prognosis. two DSO prognosis methods were used in the project to investigate the effect on risk and costs:
• the clear-sky prognosis in which the maximum generation of the PV is estimated, based on the cloud-free maximum radiation profile on the relevant day in the year. this method is conservative.
• iCarus prognosis in which the PV generation is determined based on current measurements of PV systems in the region. this method is as realistic as possible.
Figure 48 shows the prognoses for a day in the Intraday phase. It can be seen that the Clear Sky method almost always over-estimates the PV generation resulting in excess flexibility being ordered. Based on the iCarus prognosis, sometimes insufficient and sometimes excess flexibility is ordered.

77EnergieKoplopers
-120000
-100000
-80000
-60000
-40000
-20000
0
20000
40000
60000
09-‐08-‐16 10-‐08-‐16
Load
(kW
)
ID forecast and actual
DSO actual iCarus prognosis Clear-sky prognosis
Figure 48: Clear Sky prognosis (black line) and the iCarus prognosis (red line) for the Intraday phase for 9 August 2016. the green line is the actual grid load on that day
An overview is given in table 7 of the amounts of ordered flexibility during Day Ahead and Intraday, the excess ordered flexibility and the required flexibility in Operate. the results from the project show that during the 19 days on which both prognoses were compared, the excess ordered flexibility was reduced by 75% (from 1,405 kWh with a Clear Sky prognosis to 353 kWh with the iCarus prognosis). In the project, the iCarus prognosis was not yet well-attuned to the trading moments. In spite of this, the iCarus prognosis already resulted in a considerable reduction in excess ordered flexibility, while improvements were still possible by connecting the prognosis to the trading moment.
By ordering less flexibility, the risk also increases that insufficient flexibility is ordered the flip side of ordering less excess flexibility is that the risk increases that the DSO purchases insufficient flexibility. this results in a higher risk of overload or extra purchase of (expensive) flexibility in the Operate phase. In the Operate phase it is also not certain whether the flexibility will still be available.
the analysis from the 19 days on which both prognoses were compared show that 39% more flexibility needed to be ordered in the Operate phase (from 369 kWh with a Clear Sky prognosis to 515 kWh with the iCarus prognosis, see table 7)
It appears that with the iCarus prognosis, almost all flexibility (98%) is ordered Intraday, while with the Clear Sky method 72% of the total ordered flexibility can already be purchased Day-ahead.
table 7: the ordered flexibility over 19 days with the Clear Sky prognosis and with the iCarus prognosis
strategy 1)Clear sky (kwh)
strategy 2)iCarus (kwh)
total ordered flexibility (Day-ahead and Intraday) 2059 860 (-58%)
Excess ordered flexibility 1405 353 (-75%)
required operate flex 369 515 (+39%)
the dso can optimise between risk and costs the analysis shows that a less conservative DSO prognosis results in a considerable reduction in excess purchased flex, while the flexibility that needs to be ordered in Operate increases to a lesser extent.

78 Appendix E
0
10
20
30
40
50
60
0 20 40 60 80 100 120
Ord
ered
flex
in o
per
ate
(kW
h/d
ay)
Unnecessary ordered flex (kWh/day)
sunny (9 days)
cloudy (5 days)
half-‐cloudy (5 days)
Clear Sky
Figure 49: Excess ordered flexibility versus the flexibility that needs to be ordered per day in Operate for the two prognoses for three day types
Figure 49 demonstrates the distribution of excess ordered flexibility and flexibility ordered in Operate for three weather types: cloudy days, semi-overcast and sunny days. It can be seen that on cloudy days almost no flexibility can be ordered with both methods. that can be explained because the Aggregator’s forecast has a lot of impact on the total expected congestion (the Aggregator forecast 203 of the 250 households19). On cloudy days, the Aggregator forecasted little PV generation, so the DSO also ordered little flexibility. On sunny days, with iCarus, almost 80% less excess flexibility was ordered and over 40% more flexibility in Operate. On semi-overcast days, with iCarus, almost 60% less excess flexibility was ordered, while almost 20% more needed to be ordered in Operate.
this shows that weather-dependent considerations can be made between costs and risks. there are clear opportunities to reduce the volume of purchased flexibility by making less conservative forecasts without running unacceptable risks.
In an extreme strategy the DSO can decide to order all flexibility in the Operate phase. the DSO will then never order excess flexibility, but will not always be certain of the affordability or security of delivery of this flexibility.
E.2 Six reasons why flexibility is not always delivered to the DSO
the flexibility was not always available because of an it malfunction Part of the flexibility was not available because an It system (or the Aggregator, or the DSO) did not function fully. the flexibility that remained was the control space communicated by the PowerMatcher.
For 10% of the time in the project, the appliances were not available for adjustment because of It malfunctions. the other 90% of the time, 90% of the appliances were available for adjustment. When the 90% availability is reliable, effective actions can be taken. the project was managed on an It system availability of at least 90%. Subsequent projects can be managed according to higher availability through the use of such things as redundancy.
19 the effect of the various DSO prognoses is limited because during this experiment just 50 of the 250 households were predicted by the DSO. the electricity consumption of the other 203 households was forecast by the Aggregator. the Aggregator used a prognosis strategy that resulted in many Operate orders from the DSO. this meant that on sunny days even with a Clear-Sky prediction from the DSO flex was still ordered in Operate.
iCarus
iCarus Clear Sky
Clear Sky
iCarus

79EnergieKoplopers
Figure 50: Illustration of a day with an It malfunction. On 11 April 2016, it was not possible to regulate the solar peak because of an It malfunction. Part of the peak was, however, reduced the day before and after. the malfunction was
resolved at 15:30 on 11 April. From that moment the solar peak was reduced again at the DSO’s request.
Flexibility that is not used as it was not forecasted at the moment of trading Part of the flexibility was not used because at the moment of trading, this flexibility was not forecasted by the Aggregator. An example of this is that the Aggregator expected limited generation from solar panels for a certain PtU (and thus limited flex-up through switching off). During the PtU, the sun did actually shine and the generation from solar panels caused congestion for the DSO. In the project, the Aggregator was unable to switch off in this case, because the Aggregator systems used the forecast from 2 to 6 hours previously. the PowerMatcher indicated at that time that there was flexibility. Another example is presented in the figure below.
this can be prevented through Intraday and by deploying a more up-to-date forecast of the available flexibility in the Operate phase. For example, the estimation of flexibility communicated by the PowerMatcher.
Figure 51: Illustration of a day in which the flexibility was not forecasted. In the night of 22 April, two electric cars were charged unexpectedly. this overload could not be resolved in the Operate phase, because the Aggregator had set that it
did not have any flexibility in its portfolio at that point, while that was not the case.

80 Appendix E
Flexibility that was sold to the Brp the Aggregator sold a part of the available and cheapest flexibility to the BrP. As USEF is implemented in this project, the DSO could not repurchase or sell this flexibility (no iterations between Plan and Validate phases). In some cases, the Aggregator had switched on boilers for the BrP. When this led to congestion, another appliance had to be used for flex-down in order to resolve the congestion (for example switching off heat pumps). In the project this often led to insufficient flexibility for the DSO to resolve the congestion (see Figure 17 for an example). Mostly this happened when the flex-up caused congestion for the BrP in the evening peak. Should various trading iterations be applied, the DSO would then be able to repurchase the flexibility sold to the BrP (probably with a margin) and the congestion could then be prevented. the various iterations mean that the availability of flexibility then increases.
On the other hand, the project showed that the DSO sometimes actually had less congestion with low flexibility prices (particularly in the solar peak), because the BrP had already sold flexibility in the solar peak.
Flexibility that the aggregator needed to increase security of delivery the Aggregator did not offer all the available flexibility to increase the reliability of the supply of flexibility that is actually offered. An example of this is shown in Figure 53.
In addition, the Aggregator also needs flexibility from its own portfolio in order to stick to its own A-plan or D prognosis. In some cases, the Aggregator needed all flexibility from its portfolio for this.
Figure 52: Illustration of a day in which the Aggregator did not offer all flexibility from the boilers. the Aggregator offered approximately 5 kW flexibility while there was approximately 80 kW flexibility. the DSO purchased 5 kW of the
flexibility offered by the Aggregator.
Flexibility that was not ordered by the dso the DSO ordered flexibility based on its own prognosis and the prognosis from the Aggregator to resolve the expected congestion. to prevent congestion as much as possible, the DSO has mostly made a conservative prognosis in the project. the result of this is that flexibility was mostly ordered, but that also too much flexibility was often ordered. the DSO could also decide to make a less conservative prognosis and to adjust this in Operate. this will depend on the prices of flexibility in the various phases and the risk that the DSO is prepared to take. the disadvantage of orders in Operate is namely that these could only be placed in the project if actual overload was measured; adjusting led to an overload of around 30-45 minutes because of the delay time in the project’s It systems. this was anticipated in the project by use extra flexibility in the Operate phase, so that the components in the electricity network had the chance to cool down after the overload. the figure below is an illustration of a day in which the DSO ordered flexibility at the wrong time.

81EnergieKoplopers
Figure 53: Illustration of a day in which the DSO ordered flexibility at the wrong time. the congestion occurred somewhat earlier than foreseen. there was also no flexibility ordered for that PtU. In Operate, the Aggregator also did not offer any
flexibility, while there was sufficient flexibility available according to the PowerMatcher.
Flexibility that was not delivered because of non-optimal control of appliances Of the flexibility that was ordered by the DSO, a small part was not delivered because of non-optimal control of appliances. this was the case particularly for congestion through generation from solar panels, because of the strongly changing loads. the PowerMatcher actually made a prediction every 5 minutes for the solar panel generation for the coming five minutes, which meant that the system was always behind reality.
Practical available flexibility
1. Flexibility not available due to IT malfunction
2. Flexibility not dispatched because availabilitywas nog predicted
3. Flexibility sold to BRP
4. Flexibility needed by the AGR to increase security of supply
5. Flexibility which is not ordered by the DSO
Controlled devices for the DSO
6. Flexibility which is not delivered due to suboptimal control of devices
Figure 54: Visualisation of the deployment of the actually available flexibility. this example shows a situation in which sufficient flexibility was delivered to the DSO. In the project, there was actually more than sufficient flexibility available to resolve all congestion. there are six reasons why not all available flexibility was used to prevent congestion. Points (1) –
(4) and (6) concern the Aggregator, point (5) concern the DSO.

82 Appendix E
E.3 BrP flexibility trading results
three variables that determine whether the Brp orders flexibility or not As described in Appendix C.4 there are three variables that determine whether the BrP buys flexibility or not. these variables are:
1. the APX Day Ahead or imbalance price
2. the price of flexibility
3. the retail price
the paragraphs below discusses these three variables in more depth.
apX day ahead and imbalance prices In the project, two price scenarios were used for 2025. In the project, the assumption was made that the BrP had perfect information in advance about the APX and tennet imbalance market prices. the image below (Figure 55) shows that the BrP ordered flex-up at low imbalance prices (the blue bars below the image). For a low imbalance price it is after all interesting for the BrP that electricity consumption increases. Vice versa a BrP ordered flex-down (fuel cell or heat pump) for an Aggregator in the case of high imbalance prices. the principle from the figure below also applies to the APX Day Ahead market. For a BrP, it is either the high or the low price that is interesting (Day Ahead or imbalance).
Figure 55: Impact APX and imbalance price on BrP order behaviour
the above figure also shows clearly that the BrP purchased flexibility in one quarter (flex-up or flex-down), and nothing in the next quarter. this can be explained by the differing imbalance price every quarter.
the price of flexibility the project experimented with various prices of flexibility in order to examine the effect of a flex price change on BrP purchase behaviour. the image below shows the BrP behaviour for various flex prices.
BrP orders flex-down at high imbalance prices
BrP orders flex-up at low imbalance
prices

83EnergieKoplopers
0%
10%
20%
30%
40%
50%
60%
70%
80%
90%
Low flex price Middle-‐low flex price Middle-‐high flex price High flex price
Day Ahead arbitrage (APX) Imbalance market arbitrage (TenneT)
Figure 56: impact of flex price on moments of the day in which flexibility was ordered
First of all it can be seen that t the BrP buys flexibility more often at lower flex prices than at higher flex prices. this can be explained by the price trade-off that the BrP makes, and this applies both for APX Day Ahead optimisation as well as for imbalance optimisation. Another noteworthy point is that where there was a high flexibility price in the project, the BrP mainly purchases flexibility for optimisation on the imbalance market and hardly for optimisation on the Day Ahead market. With low flex prices, however, the chances increase that a BrP will also purchase flexibility for optimisation on the Day Ahead market. this phenomena can be explained, considered chronologically, because in the project the BrP first optimised on the Day Ahead market and only later on the imbalance market. the BrP immediately grasped every opportunity for optimisation. With a low flex price, the optimisation on the Day Ahead market was attractive and came first , the BrP acted on this and therefore less flexibility for optimisation remained on the imbalance market. the question that can be made here is whether it is interesting for a BrP to grasp every option for optimisation with flexibility directly as soon as this option arises. the alternative for a BrP facing low flex prices could be, to keep the flexibility for optimisation on the imbalance market. there may be more to optimise here than on the APX Day Ahead market. However, there is a risk that the flexibility will no longer be available later because it was sold to a DSO or to another BrP. this was, however, not further investigated in the project.
the retail price the retail price is the price for which the BrP/supplier combination sells the electricity to the customer (excluding surcharges and tax). this price was fixed during the project.
Flexibility has more value on the imbalance market, where big spreads occur As described previously, the BrP can use flexibility for various forms of portfolio optimisation. However, in the project the BrP could “only” optimise in two ways, namely through arbitration on the APX Day Ahead market or through arbitration on the imbalance market. this paragraph describes when the most value can be obtained for the BrP in the project within these two forms of optimisation.
Arbitration concerns the spread; the price difference between the two “options” on which arbitration can take place. the bigger the spread between these two options, the greater the profit to be achieved. In the project, the BrP in fact arbitrated between the APX Day Ahead market and the imbalance market on the one hand, and the retail price for the customer on the other. In the figure below, the “profit through arbitration on the imbalance market” for a given flex price and retail price is expressed as function of this spread.

84 Appendix E
-‐0,3 -‐0,2 -‐0,1 0 0,1 0,2 0,3
Arb
itra
ge
pro
fit
on
the
imb
alan
ce
mar
ket
Spread: imbalance price - retailprice
Figure 57: Impact spread on profit from arbitration on the imbalance market
the conclusion that can be drawn from the above image is that the greater the absolute spread, the greater the potential added value through arbitration for the BrP portfolio. the fact that there are more observations in the event of positive spread (all blue points to the right of €0), is because more flex-up capacity was available in the project. Also note that the spread was not always a determining factor for the profit from arbitration. the price and volume of flexibility also partly determine the added value through arbitration. the difference in gradient between the two branches (left negative, and right positive) is thus caused on the one hand by the difference in flex price for the flex-up and flex-down appliances, and on the other by the difference in the flex-up and flex-down capacity.

85EnergieKoplopers
Appendix F Project preparation
this appendix describes the project preparation. the following two subjects are treated:
• F.1 recruitment of participants
• F.2 Hardware and It
F.1 recruitment of participants the objective within EnergieKoplopers was to recruit 250 participating households and, together with residents, develop propositions with market potential. this paragraph explains how the process of selection went and the choices that were made in that period.
As initial orientation in the neighbourhood and target groups, a customer safari was organised in February 2013. Via spontaneous meetings between project team members and residents - in the street, at home, at the supermarket - there was more discussion with residents about energy, sustainability, saving and preparedness to think and work together on a trial in the district. Approximately 10 percent of households was reached in three hours. It was clear that, in spite of the high number of solar panels in the district, energy plays a limited role in the life of residents. the most frequently mentioned reasons for being involved with energy comprise increasing living comfort and saving money. Many residents indicated that they are interested in helping to think about new energy products. People did have difficulty in attending a presentation regarding these new energy products and smart grids. residents also set a number of conditions for participation in the trial, namely: convenience, simple to use and operate, an effortless process, concrete insight into cost savings, a clear personal profit and one contact point with a clear story.
In the recruitment of participants, various recruitment campaigns were started in the October 2014 to May 2015 period. the recruitment campaigns were largely local in character, but were also supplemented with more central marketing instruments. Examples of resources that we used:
• triangular and electronic signs
• Window posters
• Notifications in local newspaper
• Weekly clinic evenings in the community centre
• A demo space was set up in which participants could see and feel appliances
• Member get member campaign
• Mailings
• Small events for children in the district (Sinterklaas, Sint Maarten)
In January 2015 it was also decided to expand the recruitment outside the ‘City of the Sun’, in order to recruit sufficient participants.
In February 2015, the required number of participants was reduced from 250 to 200 participants. In the end, 203 participating households were connected to the project. An overview of registrations per week can be seen in Figure 58. It is clear that the recruitment had a long prelude and there were various extensions to the target group.

86 Appendix E
0
5
10
15
20
25
30
35
40
43 44 45 46 47 48 49 50 51 52 1 2 3 4 5 6 7 8 9 10 11 12 13
Nr o
f app
lica+
ons
Week number
Recruitment in Stad van de Zon Expansion 1 Expansion 2 Expansion 3 (direct mailing to solar panel owners) Total sum per week
Figure 58: Number of registrations per week
the design of the project took into account that an extra 25% of participants needed to be recruited in order to be able to compensate for technical failure or drop-outs. the recruitment figures can be seen in table 8. this shows that 100% more registrations were needed in order to end up with 203 participants. the most important reason for this was that a lot of large appliances were offered, which ultimately did not fit in the homes.
table 8: Number of participants in recruitment process
# interested # registered # drop-outs before technical check
# technical checks
# drop-outs due to technical check
# applications
# participants
>400 320 27 293 67 226 203
the distribution and numbers of appliances was ultimately changed compared to the previous plan. the switch mainly concerned the heat pumps and the PV-switches. the primary reason for this is that the heat pump was often not suitable for the households. the size of the heat pump was a problem in this and also the interaction with the other systems present.
table 9: Distribution of appliances (expectation versus realisation)
appliance number started original objective registration
Heat pump 49 62 121
Electric boiler 45 50 89
Fuel cell 14 (9 virtual) 10 20
PV-switch 95 78 90
F.2 Hardware and It In order to achieve a high level of realism in the project, it was chosen to realise a physical infrastructure. this infrastructure mainly comprises two key components, namely the Information technology (It) and the hardware (HW). the It was set up centrally, while the hardware was realised in the participants’ homes. Both components are highlighted in this paragraph. it system the infrastructure is translated for the overview to a system description and is based on the roles prescribed in USEF. In addition, a number of systems have also been established that appear necessary for pragmatic realisation. these systems are project specific, and are a consequence of the design decision taken and give a good impression of what is needed for a practical application. the roles and systems are described per line from top left to bottom right.
Expansion to other neighborhoods
Direct mailing to solar panel owners

87EnergieKoplopers
Active Demand and Supply
Prosumer 203x Participants
Aggregator Essent
BRP Essent
Bluegen-net Platform (Solidpower)
MP Man. portal
UP User. portal
BL Busi. logica
PM Powermatcher
RI Reference Im.
BE Back-end
DSO Alliander
RI Reference Im.
BE Back-end
BL Busi. logica
TH thermostat
SM Smart meter
Bo Electr. boiler
Wp Heat pump
Bg Fuel cell
PV PV switch
Inhome Gateways 203x Gateway for every household
Pa 202x Device-adapter
SESP Smart Energy Platform (ICT)
Onl
y co
ntro
l sig
nals
BL Busi. logica
CRO Common Reference Operator
Figure 59: Overview of It systems within the Heerhugowaard project
CrO: the Common reference Operator is a central ‘table or database’ in which the possible ‘congestion points’ can be made known by the DSO role. the households or Prosumers that influence this congestion point, could be recorded there. the CrO required no project-specific developments and could, as such be incorporated.
BrP: the Balance responsible Party was a role fulfilled by Essent. Essent also conducted this role, which is known as Programma Verantwoordelijke in the Dutch energy market, from within its current responsibilities. the business logic for the purchase of flexibility for an Aggregator was developed by Essent.
DSO: the Distribution System Operator role was fulfilled by Alliander. the business logic for the purchase of flexibility for an Aggregator was developed by Alliander. In addition, Alliander developed a forecasting module to predict the electricity consumption of households that were not served by the Aggregator.
Aggregator: the operation of the Aggregator was run by Essent. For this, Essent developed the business logic of the Aggregator (flex forecasting, load forecasting, flex portfolio). this system was used for the sale of flexibility to the BrP and DSO. to control the appliances, the PowerMatcher runtime was deployed. Via a link to the Essent systems, the PowerMatcher was particularly used as a means to create a ‘virtual power plant’ from the available appliances. the PowerMatcher made it possible to control all appliances as one or multiple partial clusters and with this adjust to the requirements for conducting this research. this PowerMatcher variant was made by IBM and is characterised by the fact that was offered centrally as a service to the project. the control and measurement signals were unlocked from and to the households via the ICt Group Smart Energy Service Platform.

88 Appendix F
Bluegen-net: this Solidpower platform offers the opportunity to monitor the performance of fuel cells as well as realise appliance control. the control signals from the PowerMatcher were sent to the appliances via Bluegen-net. the operational tolerances were adjusted by Solidpower, particularly to safeguard the guarantees.
Prosumer: the thermostat and the smart meter fell within the domain of the Prosumer. the thermostat determined the comfort level. the Prosumer could set this level.
hardware All operational technologies that were implemented in the households fell under this domain. these are presented in the figure below:
Figure 60: the appliances used in the trial
1. the thermostat (203x)
2. the in-home gateway (203x)
3. the smart meter (203x)
4. the PV-switch (95x)
5. the fuel cells (5 real, 9 virtual)
6. the electric boiler (45x)
7. the ventilation heat pump (49x)
Other appliances, such as applied communications technology, are not presented here but are described in more detail.
thermostat the thermostat was a variant modified for the project based on an existing ICY product, called E-thermostaat. this thermostat offers wireless communication with the project systems via a network-linked hub. the thermostat is operated via a user portal in which matters such as weekly programme and temperature settings can be organised. the thermostat also comprises an energy saving function, that returns to an absent setting when no movement is detected.
in-home gateway the in-home gateway is a small but complete computer, developed by ICt Group. As platform, a raspberry Pi B+ was used. the gateway was responsible for forwarding the measurement and control signals from the various appliances to the SESP platform. this took place every five minutes. No relevant information was stored on the equipment itself. During the course of the project, this solution was considered successful. there was almost no outage of this component, in spite of a number of project-specific modifications.
smart meter the smart meter was needed to measure the actual energy supply and demand. the smart meters that were requested concern the DSMr 4.0 variant. the smart meters were read every 5 minutes.
pV-switch the PV-switch is a remotely activated relay that communicates with the gateway via ZigBee. the PV-switch also has a measurement function. However, this appeared to not register generated power well and for this
1 2 3 4 5 6 7

89EnergieKoplopers
reason the applied solution also comprised an S0 meter, or a standard kWh meter or pulse counter. the PV-switch was the most compact smart appliance in the project and used the participants’ already present solar panel system.
Fuel cells A total of 5 fuel cell appliances were used. A fuel cell converts gas very efficiently into electricity and heat. the appliances were from manufacturer Solidpower and were finished with a prototype fuel cell stack that can deliver nominally 1.5 kW electrical power and also allows a modulation from 500 to 1500 W. It was also possible to utilise the (30%) residual heat usefully by storing this temporarily in a boiler. this useful capacity translates into approximately 200 litres of hot water at a temperature of 85 degrees Celsius. the participants were also offered the fuel cell stack in combination with a buffer tank. Modulation was realised with PowerMatcher control signals via the Bluegen grid platform from SolidPower. this was a SolidPower requirement, so that the stack would not receive the incorrect setting accidentally resulting in early malfunction. the measurements were collected via the in-home gateway and offered to the SESP.
During the preparation the supplier made a re-start. As a consequence of this, a virtual fuel cell was realised. Nine participants selected this solution. these participants also had a thermostat, a gateway and a smart meter in their homes.
electric boiler the electric boiler was made by IthoDaalderop. In collaboration with IBM and ICt, an interfacing was realised so that the boiler could exchange data with the in-home gateway remotely. this was realised via ZigBee, with range extenders being used if necessary. As well as the communications technology, the boiler was also modified with a function for determining the energy content. the boiler was equipped with two heating elements, one of one kilowatt and one of a kilowatt and a half, so that the boiler could also be installed in households with limited electricity groups by switching off one of both elements. In total 80 litres of water was heated to approximately 85 degrees Celsius. the energy capacity was approximately 9 kWh.
Ventilation heat pump the ventilation heat pump is a standard Inventum product that was modified for the project so that it could be read and controlled remotely. the ventilation heat pump ran its standard programme and tried to save as much energy as possible. the flexibility that was available comprised being able to deactivate when the heat pump was on. the heat pump is a so-called hybrid ventilation heat pump and obtained energy from the return of the mechanical ventilation of the home and could deliver 1.5 kW thermal energy to a 50 litre tap water container or the central heating system. the existing combi-boiler provided the energy supply during peak demand.
the ventilation heat pump has a high efficiency because it uses the ventilated air released by the home. the nominal power that the ventilation heat pump requires during operation is approximately 300 to 400 Watt. the amount of flexibility that is available for switching off when this is in operation, is thus limited.
