flash note mytilineos
TRANSCRIPT

04.02.21
Flash Note-
MYTILINEOS
Financial Results 2020

Contents
C.2020 Calendar of events
05-07
B.Key Highlights04
Ε.Basic Financial Figures
10-14
Η.Risks
38-41
I.Appendix
42-43
F.Business Units
15-35
G.Gap Analysis
36-37
D.Notes on the information presented in the document
08-09
A.Chairman’s Note
03
2
2020 was severely disrupted by the unprecedented global and national challenges and impact of
the Covid-19 pandemic. Especially, the Greek economy which was starting to recover from the 10-
year recession, was suddenly called upon to face a further downturn in economic activity, as
reflected in the double-digit decline of the annual GDP.
In this context, the strong financial results of MYTILINEOS certify in the clearest way that we have
successfully managed to absorb the effects of the pandemic. With our strategic assets, the tireless
efforts of our people and the commitment to our values at the vanguard, we remain steadfast on a
solid path of growth and we are confident that we are well on track to meet our targets for the
coming years.
It has been almost a year that we are coping with this new adventure. We have all put a lot of effort
and we are all tired, but this time is critical. The prospect of vaccination gives hope, but still, we
have a few miles ahead before we see the light at the end of the tunnel. To avoid the threat of
economic collapse, in the aftermath of the pandemic, as it happened at times in the past, the
stakeholders of our country, but also of Europe, must join forces. Especially now, that the European
Union is once again being heavily criticized on the issue of vaccine handling, responsibility is one of
our greatest weapons against the pandemic. Greece must embrace wisdom and prudence and
avoid the grip of uncertainty from taking over, both at the health and economic fronts.
Away from the sirens of populism and keeping at bay the inward-looking effect of economic
difficulties, we now have the duty to pull together and rise to the challenge. On our part, in
MYTILINEOS we will participate in this national effort for economic reconstruction, and we look
forward to the Government's proposals for the optimal allocation of EU funds.
Α.
Chairman’smessage
3

Financial Results 2020Key Highlights
Solid overall performance after a drop in the second
Quarter of the year (Covid / 1st
lockdown), leading to an
EBITDA almost equal to
2019, as per CEO’s target for
best effort.
Leverage remained low,
significantly lower than 2X
(@1.71), despite Capex,
Dividend and Buyback program.
[Net Debt stood at 538m € Vs
421 in 2019]
Compared to 2019:
• EBITDA from -17% in first half, improved by 23% in the second half, thus remaining almost stable on a full year basis.
• Net earnings, from -15% in the 1st Half, improved by 380 basis points to -5,9% in the second.
• EBITDA margin improved by 270 basis points to 16.6% from 13.9%
• Net earnings margin improved by 40 basis points to 6.8% from 6.4%
Total Liquidity exceeds €1.3
bn including c.0.5bn € available
Cash and c.0.8bn € of committed
Credit facilities.
Positive Free Cash Flow by
c.100m, strongly improved from
initial estimates in a year of
heavy Capex, due to Capex
prioritization and Cost
optimization initiatives
(Hephaestus & Shield) after the
outbreak of the pandemic.
EPS, decreased by 10%
compared to 2019, but
remains close to the 1 area
(€0.91 / Share)
Dividend proposal remains
the same as last year
(€0.36/share, adjusted for
Treasury shares), increasing
by 16% the payout ratio to
41% from 35.5% in 2019.
Net EVA (Economic Value
Addition) increased to
4.3% from 2.2% in 2019, as ROIC improved by 7% and
WACC decreased by 17%
compared to 2019.
B.
4
>Jan
2020
>Feb
2020
>Jun
2020
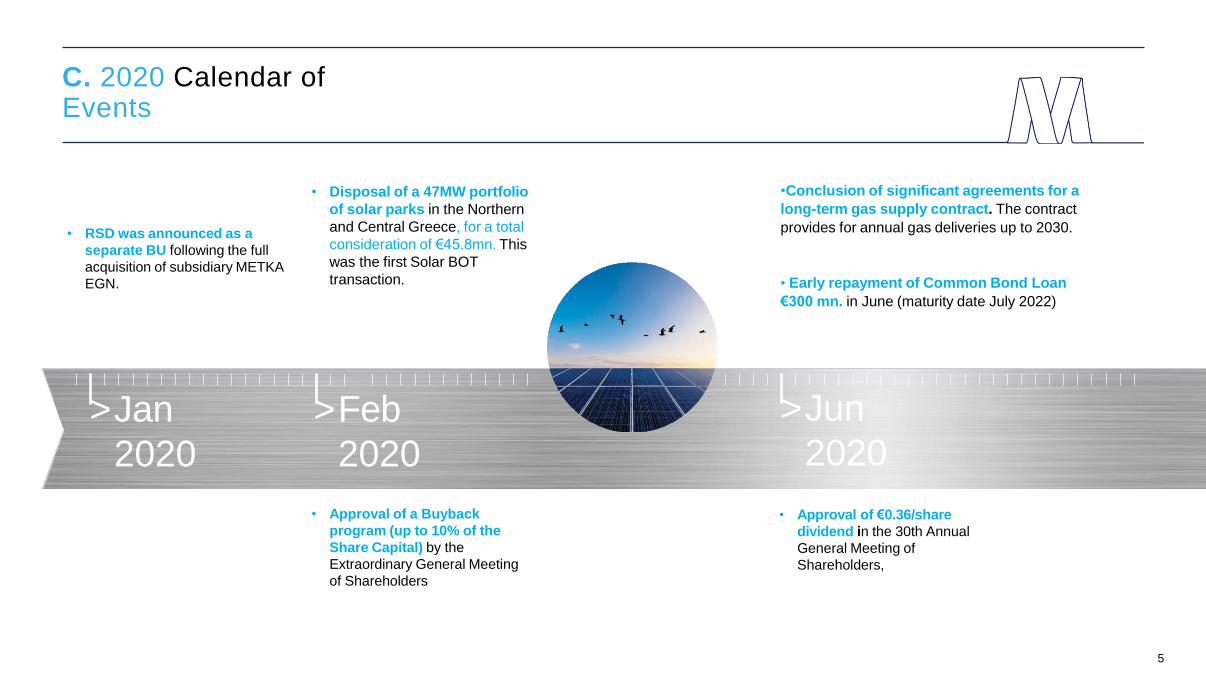
• Approval of a Buyback
program (up to 10% of the
Share Capital) by the
Extraordinary General Meeting
of Shareholders
• Disposal of a 47MW portfolio
of solar parks in the Northern
and Central Greece, for a total
consideration of €45.8mn. This
was the first Solar BOT
transaction.
• Approval of €0.36/share
dividend in the 30th Annual
General Meeting of
Shareholders,
•Conclusion of significant agreements for a
long-term gas supply contract. The contract
provides for annual gas deliveries up to 2030.
• Early repayment of Common Bond Loan
€300 mn. in June (maturity date July 2022)
5
• RSD was announced as a
separate BU following the full
acquisition of subsidiary METKA
EGN.
C. 2020 Calendar of Events

> Jul 2020 > Oct 2020 > Nov 2020
•Transformation of the former EPC-METKA Business unit
into a new, modern and innovative Business Unit called
Sustainable Engineering Solutions (SES- BU)
• The New Double Railway Line of the “Kiato- Rododafni”
section is delivered
• Completion of 470MW Solar Projects:
Talasol (300MW Solar plant in Spain - 17 months)
and Atacama (170MW Solar plant in Chile - 15
months)
• Resumption of construction works for project
TOBRUK in Libya.
6
C. 2020 Calendar of Events

> Dec 2020
•Signing of the Contract for
the completion of Aktio-
Amvrakia Motorway, €73.5
mn
• MYTILINEOS as the leader of a Joint
Venture signed an agreement for the
Engineering, Procurement and
Construction (EPC) of the Protos
Energy Recovery Facility project in
Cheshire, England, which will treat
400,000 tonnes of non-recyclable
waste per year.
•Company’s Solar PV portfolio in Australia raised to 400 MW
after the acquisition of two Solar Parks in Moura & Wyalong of
110MW & 75MW respectively from ESCO Pacific
• Acquisition of a new 50 MW Solar project in Spain (Jaen
Project)
• RSD BU has been awarded with the EPC contract for a 14.99MW
Solar project in Kozani for PPC Renewables SA, for a total
consideration of €10mn approximately.
• RSD BU has been announced as preferred bidder for the EPC
of a 200 MW Solar project in Kozani, for PPC Renewables SA..
Construction is expected to commence in 2021.
7
• RSD has been awarded with the EPC contract for a118.4MW
Solar project (Pampa Tigre) in Chile - This project is the 5th project
for MYTILINEOS in the country
C. Key Events Calendar 2020

Notes on the information
presented in the Flash Note
D.
8
D.
01
This document presents the Financial Results and
other basic financial information of MYTILINEOS
for the year ended December 31, 2020 and has
been prepared, in all material aspects, in
accordance with International Financial Reporting
Standards (IFRS) and the basic accounting
principles (Historical Cost and going concern)
applied by MYTILINEOS.
The Financial Results and the basic
Financial information presented in this
document refer to unaudited financial
figures and include the estimates of the
Management and provisions relating to
financial data or other events of the
fiscal year 2020.
In the following period until the
announcement of the audited annual
financial statements (4/3/2021) and in
case of events, having a material impact,
either quantitative or qualitative with
regards to the data presented herein, the
Company will timely inform the
investment community.
02
The reporting currency is the Euro
(currency of the country of the Group’s
Parent Company) and all the amounts are
shown in millions of Euros unless
otherwise specified.
9
Basic FinancialFigures
E.
10
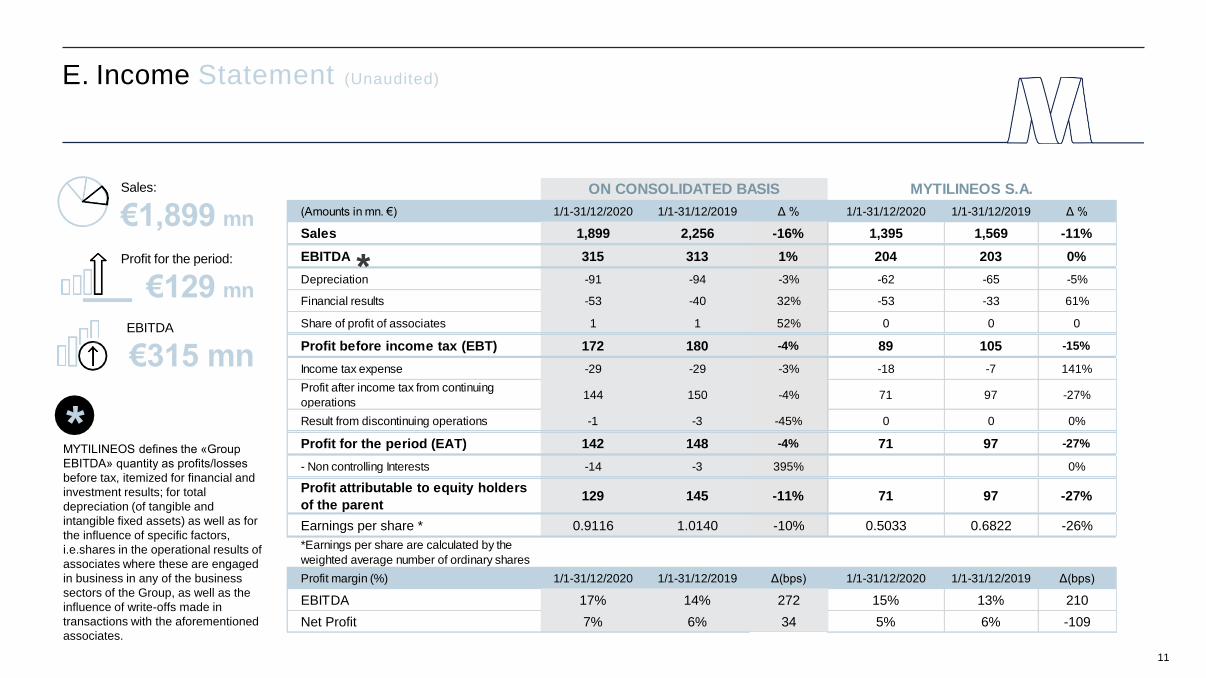
E. Income Statement (Unaudited)
*MYTILINEOS defines the «Group
EBITDA» quantity as profits/losses
before tax, itemized for financial and
investment results; for total
depreciation (of tangible and
intangible fixed assets) as well as for
the influence of specific factors,
i.e.shares in the operational results of
associates where these are engaged
in business in any of the business
sectors of the Group, as well as the
influence of write-offs made in
transactions with the aforementioned
associates.
Sales:
€1,899 mn
Profit for the period:
€129 mn
EBITDA
€315 mn
11
(Amounts in mn. €) 1/1-31/12/2020 1/1-31/12/2019 Δ % 1/1-31/12/2020 1/1-31/12/2019 Δ %
Sales 1,899 2,256 -16% 1,395 1,569 -11%
EBITDA 315 313 1% 204 203 0%
Depreciation -91 -94 -3% -62 -65 -5%
Financial results -53 -40 32% -53 -33 61%
Share of profit of associates 1 1 52% 0 0 0
Profit before income tax (EBT) 172 180 -4% 89 105 -15%
Income tax expense -29 -29 -3% -18 -7 141%
Profit after income tax from continuing
operations144 150 -4% 71 97 -27%
Result from discontinuing operations -1 -3 -45% 0 0 0%
Profit for the period (EAT) 142 148 -4% 71 97 -27%
- Non controlling Interests -14 -3 395% 0%
Profit attributable to equity holders
of the parent129 145 -11% 71 97 -27%
Earnings per share * 0.9116 1.0140 -10% 0.5033 0.6822 -26%
*Earnings per share are calculated by the
weighted average number of ordinary shares
Profit margin (%) 1/1-31/12/2020 1/1-31/12/2019 Δ(bps) 1/1-31/12/2020 1/1-31/12/2019 Δ(bps)
EBITDA 17% 14% 272 15% 13% 210
Net Profit 7% 6% 34 5% 6% -109
ON CONSOLIDATED BASIS MYTILINEOS S.A.
*

10.4%7.9%
2019 2020
1.34 1.71
2019 2020
41%
35.5%
2019 2020
E. Financial KPIs (Key
Performance Indexes)
Leverage Ratio (Net debt/EBITDA)
Leverage Ratio remains significantly below< 2Percentage of distributed profits
Consistent dividend policy (c.35% on Net Profits)
Earnings Per Share (EPS)
Significant increase of EPS (from €0.3/share to €1/share)
Net Economic Value Added % (Net EVA %)
Significant increase of added value
Return On Market Equity (ROME)
Return on Capitalization has doubled
ROIC & WACC
Improved ROIC & decrease of WACC
Pre-merger 2016
Pre-merger 2016
Pre-merger 2016
Pre-merger 2016
Pre-merger 2016
Pre-merger 2016
2019 2020
2019 2020201
9
202
0
Post-merger 2017-2020 Avg
2.78
4.8
%
10.5
%10.3
% 6.9
%
9.4
% 7.3
%
10.3
% 6.0
%8.3
%
1.58
11%
n/d
0.29
-
2.2%
35.7
%
1.00
3.4
%
1.01
2.2
%
0.91
4.3%
12
Post-merger 2017-2020 Avg
Post-merger 2017-2020 Avg
Post-merger 2017-2020 Avg
Post-merger 2017-2020 Avg
Post-merger 2017-2020 Avg

Cash Flow& Other figures 1
Ε.
(unaudited financial results )
m€ 31/12/2020 31/12/2019
Net (Debt)/Cash opening balance -421 -443
Cash (opening) 713 208
Debt (opening) -1,134 -651
Net (Debt)/Cash closing balance -538 -421
Cash (closing) 492 713
Debt (closing) -1,030 -1,134
Net Debt Change -117 22
Net Debt Analysis
13
2019 payments: Late maturity of payments (RSD/SES)
SES financing: Contract temporary financing
Other: M&A & Other Financial / Investement Cash Flows mainly including
Metka EGN acquisition, Share Byuback, Subsidies,Pre-export Financing

Cash Flow& Other figures 2
Ε.
(unaudited financial results )
14
Net Debt evolution & Total available Liquidity per
quarter
(m €)
Q1 Q2 Q3 Q4-700
-200
300
800
1.300
1.800
-530 -477 -562 -538
1,500 1,316 1,294 1,343
Net Debt Total Available Liquidity

BusinessUnits
Com
para
tive
Advanta
ges
Metallurgy
F.
Sustainable Engineering Solutions
• The successor of long-time
global champion Energy Turn-
key thermal projects, entering
new era
• Dynamic development of
Sustainability projects
15
Power & Gas
• Leading independent
power producer and
supplier in Greece
• Largest domestic private
natural gas importer,
consumer and exporter
• Vertically integrated
Aluminum producer from
mine to port
• Top tier Alumina and Aluminum
operations, in the lowest
quartile of the global cost curve
Renewables & Storage Development
• Among the most competitive Solar PV
developers and constructors in the world
• Platform of own investment projects
through the development, construction and
operation / sale of photovoltaic or energy
storage projects.

F.BusinessUnits
In m
n €
208278
11 22
388264
15 29
499594
136 164
928996
157101
2020 2019 2020 2019 2020 2019 2020 2019 2020 2019 2020 2019 2020 2019 2020 2019
Sales ΕΒΙΤDA Sales ΕΒΙΤDA Sales ΕΒΙΤDA Sales ΕΒΙΤDA
16
Other: 2020 -4m, 2019 -3m

17
Ανθεκτικές επιδόσεις πάρα τις πρωτόγνωρες προκλήσεις εξαιτίας της
πανδημίαςBusiness UnitsResilient performance despite unprecedented challenges due to the pandemic
F.
The diversified business mix and the synergies between Business Units enable MYTLINEOS to maintain a strong financial performance despite the adverse business environment.
The performance of the Metallurgy Business Unit remained resilient, while the Power & Gas Business Unit had a record high performance in 2020. Since 4Q 2020, SES & RSD BUs are undertaking new projects and recording an increasing contribution in the results.
Significant improvement of the total operating profitability (EBITDA) in the second half of the year.
Record high performance in 2020 of the Power & Gas Business Unit, despite lower wholesale market prices (SMP).
Vertically integrated production model and strict cost control ensure resilient performance even during periods of low LME prices.
(in mil. €)Excl Other from Total
Power & Gas BU EBITDA vs. SMPMetallurgy BU EBITDA vs. LME (3M)

Sales EBITDA EBITDA margin
(in mn. €) 2020 2019 2020 2019 2020 2019
Electricity Supply 440 387 -3 1 -0.7% 0.2%
Electricity Production 272 320 114 56 42.0% 17.4%
Natural Gas Supply 165 246 6 14 3.7% 5.7%
RES 51 42 39 30 76.7% 72.7%
Total 928 996 157 101 16.9% 10.1%
Power & Gas
2020 2019 2020 2019
Sales
996
928EBITDA
157101
18

Fuel mix: Natural Gas has emerged as the
base load fuel, following the reduced
electricity production from lignite by 44.9%.
Significantly increased contribution of RES
in the energy mix, reaching 28% of the total
production
MYTILINEOS share of total NG imports
reached 36%, while the respective share of
exports is estimated at 72%
Increased profitability and power production
from RES, while during 2020, 11MW was
added to MYTILINEOS installed capacity
totaling 222MW
2015
51.4TWH 51.2TWH 52.0TWH 51.5TWH 52.2TWH 50.3TWH
2016 2017 2018 2019 2020
Net Imports
On the grid production
RES
Hydros
Natural Gas
Lignite
-4.1%
29.7%of total electricity produced by natural gas fired units
19
54.9%of the electricity production by natural gas units operated by Independent Power Producers
14% 17% 12% 12% 19% 18%
9%9%
9% 9%
10% 11%10%
11%11% 11%
12% 17%10%10%
7% 10%
6%6%
19%24% 30% 29% 33% 37%
38%29% 31% 29%
20%11%
Power & GasTransition to a market where Natural Gal plays a dominant role replacing lignite in the fuel mix
Greek Market Power Production Mix

Power & GasRecord high performance in 2020 – Power & Gas contributed 50% of the Company's total operating
profitability
MYTILINEOS Power
Production (TWh)
Power & Gas Business Unit posted a record high performance
in 2020, despite reduced electricity consumption (-4.1%) due to
the pandemic and wholesale market prices (SMP) being 30%
lower than 2019.
MYTILINEOS ability to supply Natural Gas at very
competitive prices, in addition to the high
efficiency rate, as well as the availability and
reliability of the Company’s power plants (two
combined cycle CCGT and one high efficiency
Combined Heat and Power plant) resulted to
increased power production of 5.55 TWh.
2014
2.0TWh
2.5TWh
4.4TWh
5.2TWh 5.1TWh
6.1TWh5.8TWh
522430
311272
188
125
624
602454
32492
1.1631.166
2.2482.1801.9971.731
1.563
2.0922.0661.6712.0111.475
1.2101.1581.1541.1631.146
2015 2016 2018 2019 2020
+205%
RES
Korinthos Power
Ag. Nikolaos
CCGT CHP
Power production from thermal and RES plants in 2020:
6.1TWh, a 12.1% share of the total power consumption in
the interconnected system.
12.1%Of total power demand
6.1TWhElectricity production from MYTILINEOS’ thermal & RES plants for 2020
20
2017
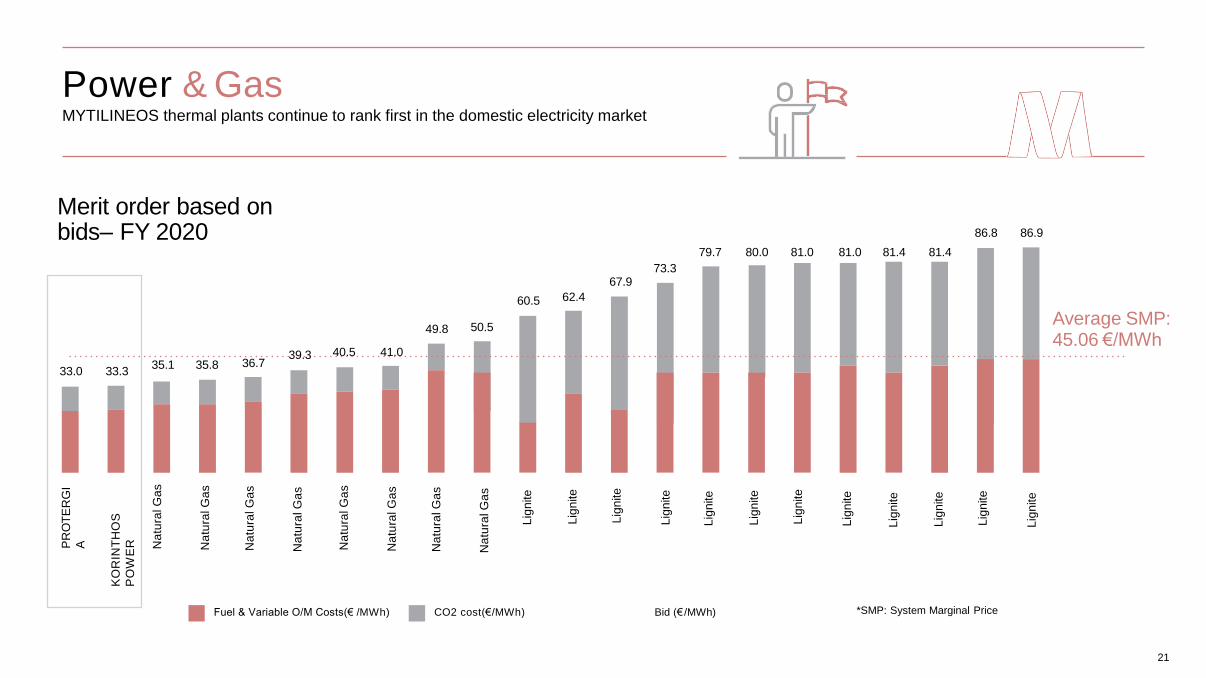
Power & GasMYTILINEOS thermal plants continue to rank first in the domestic electricity market
Merit order based on bids– FY 2020
Average SMP:45.06 €/MWh
PR
OT
ER
GI
A
33.0 33.335.1 35.8 36.7
39.3 40.5 41.0
49.8 50.5
60.5 62.4
73.367.9
79.7 80.0 81.0 81.0 81.4 81.4
86.8 86.9
KO
RIN
TH
OS
PO
WE
R Na
tura
l G
as
Fuel & Variable O/M Costs(€ /MWh) CO2 cost(€/ MWh) Bid (€ /MWh) *SMP: System Marginal Price
Lig
nite
21
Na
tura
l G
as
Na
tura
l G
as
Na
tura
l G
as
Na
tura
l G
as
Na
tura
l G
as
Na
tura
l G
as
Na
tura
l G
as
Lig
nite
Lig
nite
Lig
nite
Lig
nite
Lig
nite
Lig
nite
Lig
nite
Lig
nite
Lig
nite
Lig
nite
Lig
nite

Power & Gas Protergia holds the leading position amongst the private electricity suppliers
Protergia continues to strengthen its presence in the retail market ending
the year with 285,000 electricity and Natural Gas customers, compared to
203,000 customers in 2019. The electricity market share by the end of 2020
increased to 7.7% compared to 5.5% in 2019.
Major Independent
Electricity Suppliers
Market Share
Evolution
2014 2015 2016 2017 2018 2019
Competitor 2
2020
0.3
%
PROTERGI
A
Competitor 1
1.0
%
5.5%
4.1%
3.3%
2.7%
7.7
%
22

Power & Gas
Τhe construction of the new Gas-fired
Combined Cycle (CCGT), 826MW power
plant with General Electric’s H-Class gas
turbine continues according to the initial
timeline.
MYTILINEOS, with approximately 1.4 GW installed
thermal units and operating RES projects, and
holding the leading position amongst the private
energy suppliers, has established its position as
the largest private vertically integrated electricity
and natural gas Company, reaching the critical
size needed in order to benefit the most from the
implementation of the Target Model, which has
been enforced since November 2020, as well as
the general full liberalization of the domestic
electricity and natural gas market.
The launch of the power station’s trial operation
is expected by the end of Q4 2021, strongly
contributing to the country's transition to an
energy mix with a significantly smaller carbon
footprint. The project is executed by the
Company’s Sustainable Engineering Solutions
Busines Unit with important synergies, ensuring
reduced investment costs.
H-Class General Electric
technology
826 MW End of 2021 ~1.4 GWInstalled capacity from
thermal plants and RES
The new power plant is expected to start its
commissioning
Τhe construction of the new Gas-fired
Combined Cycle (CCGT), 826MW power
plant continues according to the initial
timeline
23
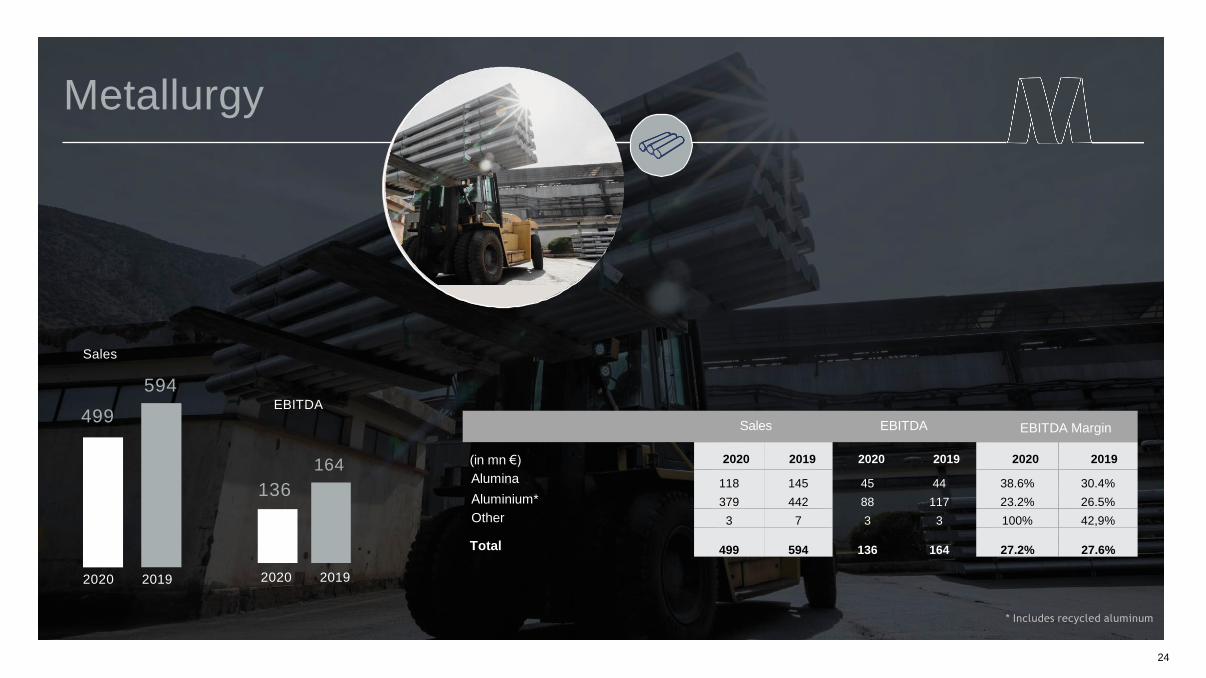
EBITDA
2020 2019
499
136
Sales
594
164
24
Metallurgy
(in mn €) 2020 2019 2020 2019 2020 2019
Alumina 118 145 45 44 38.6% 30.4%
Αluminium* 379 442 88 117 23.2% 26.5%
Other 3 7 3 3 100% 42,9%
Total 499 594 136 164 27.2% 27.6%
2020 2019
Sales EBITDA EBITDA Margin
* Includes recycled aluminum

MetallurgyAluminium prices significantly decreased due to the pandemic, a trend
that was reversed during the 2nd Half of the year
The fragile environment in the Alumina and Aluminium markets, which
was already evident in alumium declining prices during the 2nd Half of 2019,
due to increased supply, was also greatly affected by the spread of Covid-19
in western countries, especially after the 1st Quarter of 2020. The demand for
Aluminium decreased due to the to the impact of the pandemic and overall
uncertainty about the timing of the economic recovery.
The trend of declining Aluminium prices in the 2nd Half of 2019
continued during the 1st Half of 2020, driving LME 3m Aluminium price at
the level of 1.460$/t. Prices recovered sharply during the 2nd Half of 2020
resulting to an average annual price of $1.730/t, limiting 2020 average
price decline to -4% compared to 2019. By the end of 2020, prices had
fully recovered rising higher than the pre pandemic levels.
The API Index of Alumina marked a significant decline, landing at
230$/t, with an average annual price of 270$/t, down 18% compared to
2019. Prices remained at low levels, and only by the end of 2020 began
to increase again, recording the highest price level of the year in
December.
LME prices
& Premia ($/TN)
Alumina Price
($/TN)
25
12
14
16
18
20
22
100
150
200
250
300
350
400
450
Jan
-19
Ap
r-1
9
Jul-
19
Oct
-19
Jan
-20
Ap
r-2
0
Jul-
20
Oct
-20
Jan
-21
Alumina Price % of LME
0
100
200
300
400
500
600
1.400
1.600
1.800
2.000
2.200
2.400
2.600
Jan
-19
Mar
-19
May
-19
Jul-
19
Sep
-19
No
v-1
9
Jan
-20
Mar
-20
May
-20
Jul-
20
Sep
-20
No
v-2
0
Jan
-21
3mLME(Left Axis)
All In Price(Left Axis)
Premium Billet(Right Axis)
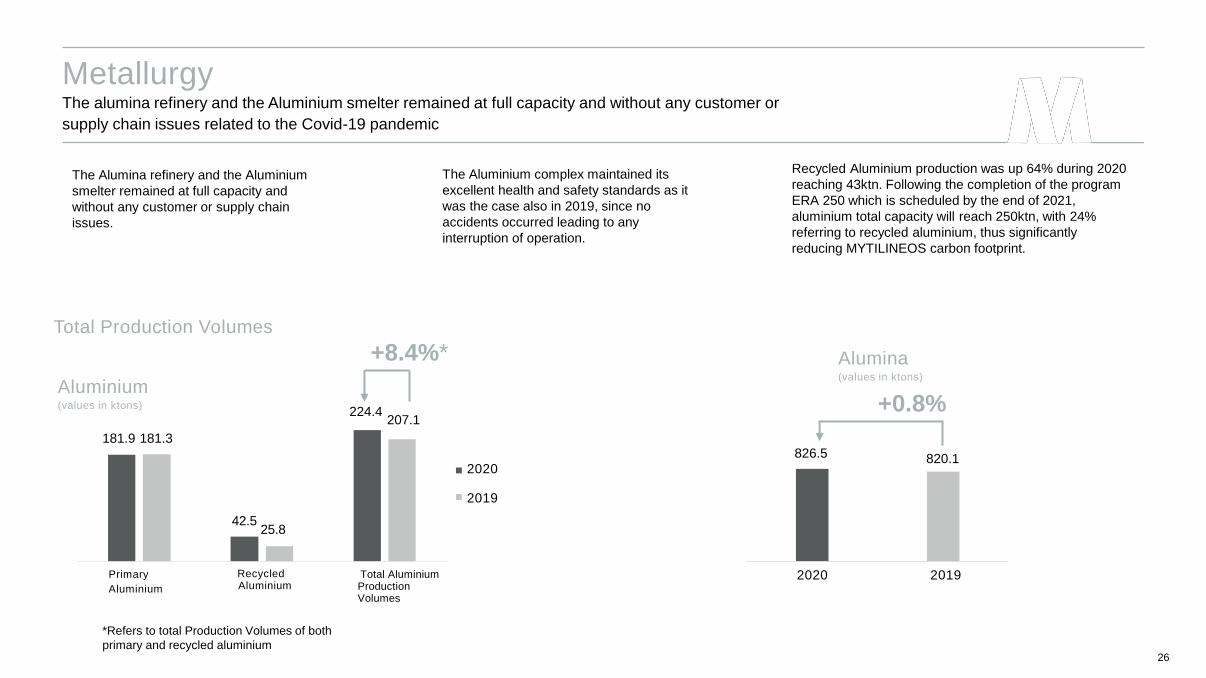
Metallurgy
The Alumina refinery and the Aluminium
smelter remained at full capacity and
without any customer or supply chain
issues.
The Aluminium complex maintained its
excellent health and safety standards as it
was the case also in 2019, since no
accidents occurred leading to any
interruption of operation.
Recycled Aluminium production was up 64% during 2020
reaching 43ktn. Following the completion of the program
ERA 250 which is scheduled by the end of 2021,
aluminium total capacity will reach 250ktn, with 24%
referring to recycled aluminium, thus significantly
reducing MYTILINEOS carbon footprint.
The alumina refinery and the Aluminium smelter remained at full capacity and without any customer or
supply chain issues related to the Covid-19 pandemic
Aluminium (values in ktons)
26
Alumina(values in ktons)
Primary
Aluminium
Recycled Aluminium
Total Aluminium Production Volumes
181.9 181.3
42.525.8
224.4 207.1
826.5
2020
2019
2020 2019
820.1
+8.4%*
*Refers to total Production Volumes of both
primary and recycled aluminium
+0.8%
Total Production Volumes

Metallurgy
Despite the weak pricing environment, the Metallurgy Business Unit had a
resilient performance. The Unit benefited from cost optimization initiatives, which
resulted in improved production costs by approximately 25% in Alumina and
about 20% in Primary Aluminium, compared to 2019.
The USD strengthened against the EURO during the 1st Half of 2020, though
lost its momentum, especially towards the end of the year. On a full year basis
USD settled at 1.14 slightly weakened, compared to 2019 (€/$ 1.12).
The new Metallurgy competitiveness program, “HEPHAESTUS”, is in full
deployment, with €19 million savings to date. The program is expected to
continue until the end of 2021, with a total target of €60 million, out of which
€35 million refer to the improvement of EBITDA on a recurring basis and the
remaining to one-off savings.
Metallurgy Business Unit benefits from low-cost base and the recovery of
Aluminium & Alumina prices
27

2020 2020
EBITDA
2019 2019
264
15
Sales
388
29
28
Renewables & Storage Development (RSD)
Sales EBITDA EBITDA Margins
(amounts in mn €) 2020 2019 2020 2019 2020 2019
Total 264 388 15 29 5.7% 7.5%

Renewables & Storage Development (RSD)
The Renewable & Storage Development Business Unit
continues to focus on the timely execution of the existing
contracts and the undertaking of new projects and
investments on targeted markets with increased green
energy needs. As the installed capacity of solar projects
is expected to increase significantly in the coming years,
MYTILINEOS offers credible solutions across the Solar
projects' lifecycle.
29
• The installed capacity of solar projects is expected to
increase significantly in the coming years since
companies and countries are focusing on a faster
integration of clean energy in their energy mix, in order
to improve their environmental footprint.
• MYTILINEOS activities in the Renewables & Storage
Development Business Unit will be a significant
catalyst for its operational profitability in the next year,
as there is an important increase of projects under
implementation, regarding both third party projects,
as well as own investment projects through the
development, construction and operation/sale of
photovoltaic or energy storage projects.
Solar PV installed capacity, as well as needs for Energy Storage are expected to
increase significantly in the coming years

Renewables & Storage DevelopmentReduced Turnover & EBITDA, mainly during the first nine months of 2020 due to the impact of
COVID 19
At early 2020, the Renewables & Storage
Development Business Unit became the 4th
autonomous Business Unit, marking the
Company's strategic focus on the global market of
solar PV and energy storage projects, both through
the construction of projects for third parties, as well
as through its own development platform.
The pandemic impacted the financial
performance of the Unit, especially during the
first 9 months of 2020, since the construction
timeline of contracted projects was shifted, as
well as the contracting of new projects.
The negative effect of the pandemic resulted to
turnover & EBITDA being ~ 40 % lower than the
budgeted figure for the year.
The last quarter of 2020 started a gradual
recovery with the signing of new projects and the
normalization of construction progress of projects
already signed.
RSD Pipeline by category
30
Pipeline EPC (€ mil.) Pipeline ΒΟΤ (MW)

Renewables & Storage DevelopmentCompletion of projects abroad with total capacity > 740MW during 2020
Regarding the EPC projects for third parties, the construction of two large
projects in Spain and Chile, 300MW and 170MW respectively were
concluded during 2020, as well as 4 energy storage projects of 135MW in
the UK. The “Talasol” project in Spain was considered as one of the
largest ones in Europe during the past year, while the “Atacama Solar
Project” in Chile was the second largest in the country. During the same
period, MYTILINEOS undertook new projects in Greece and United
Kingdom, while new projects in Chile, Spain, Italy, Uzbekistan and
Greece are in advance stage of contracting.
Country
31
Spain
Greece
Chile
UK
Kazakhstan
Chile
Chile
Greece
Greece
Greece
Tunisia
Project
Talasol
PPC Renewables
Atacama
UK-4 Projects
ΜΚΑΤ &Nomad
Chile
Pampa Tigre
National Energy
Voiotia
Kozani
Tataquine
Progress
Completed
Preferred Bidder
Completed
Completed
Completed
Contracted
Under Construction
Under Construction
Under Construction
Under Construction
Completed
MW
300
200
170
140
130
123
118
24
20
15
5.5
Solar PV and energy storage projects for third parties - 2020

Regarding the Build, Operate & Transfer (BOT) projects, the first sale of a portfolio of solar
parks was concluded in the Northern and Central Greece, with total capacity of 47MW, The
development of projects continued in countries like Greece, Spain, United Kingdom, Chile,
Mexico, South Korea, Taiwan and Australia.
The total capacity of the BOT portfolio reaches c. 4 GW, including projects that are in various
stages: from early development stage to “ready to build” projects.
Renewables & Storage DevelopmentOwn portfolio of solar PV projects with total capacity > 4GW
32
Australia
Australia
UK
Australia
Spain
Spain
UK
Greece
Cyprus
UK
Solar PV and energy storage projects own portfolio -2020
Australia
Moura
Elgin-Portfolio
Wyalong
Jaen
Guilena
Defford
North &Centre
Cyprus
Watnall
Partially Completed
Acquired Solar Park
Acquired Solar Park
Acquired Solar Park
Acquired Solar Park
Acquired Solar Park
Acquired Solar Park
Completed Sale
Acquired Solar Park
Acquired Solar Park
117
110
76
75
50
50
50
47
26
10
Country Project Progress MW

2020 2020
Sales EBITDA
2019 2019
11
278
208
22
Sales
33
EBITDA
(amounts in mn€) 2020
Total
2020 2019
208 278 11
2019
22
EBITDA margins
2020 2019
5.3% 7.9%
Sustainable Engineering Solutions (SES)

Sustainable Engineering Solutions (SES)The former EPC & Infrastructure BU is being transformed, focusing on projects of Energy Transition and
Sustainability
Country DescriptionContract
Value(amounts in mn)
Revenue for
the period(amounts in mn)
Ghana
Construction of 250MW
Power Plant $374 43 €
Slovenia
Construction of a CHP
Plant 118 € 42 €
Greece
Maintenance of the
Power Supply Grid
(Kastoria) 101 € 32 €
Country DescriptionContract
Value(amounts in mn)
Progress
Libya
EPC of a Power Plant in
Tobruk €315
Restart of
construction
England
EPC of Protos Energy
Recovery Facility €182 signed in 2020
Greece
Aktio-Amvakia Motorway
construction €73 signed in 2020
2020 has been a turning point, as the
former EPC & Infrastructure BU is
being transformed, with new
organizational structure, focusing on
projects that promote the goals of
Energy Transition and Sustainable
Development.
In this context, the European Recovery
Fund is expected to offer significant
opportunities for the Greek economy
and especially for companies with
strong credentials and know-how in
projects that promote a model of
sustainable development (for instance
solid & liquid waste management
projects, hybrid and off-grid energy
projects, energy upgrade projects and
execution of innovative first-of-kind
energy projects).
Majo
r P
roje
cts
2020
Key
Deve
lopm
ents
In 2020, the Sustainable Engineering
Solutions Business Unit’s financial
performance has been affected by the
Covid-19 pandemic, since there was a
timeline shift regarding the execution and
contracting of new projects. Despite the
above, SES had a resilient financial
performance, recording positive results.
34

Subsegment Value (mn of €)
Conventional Business 437
Environmental Solutions 189
Infrastructure 292
Manufacturing 94
New Energy Solutions 11
Total 1,023
Signed Backlog per country
Country Value (mn of €)
Greece 351
Libya 315
UK 181
Slovenia 70
Germany 68
Algeria 27
Other 11
TOTAL 1,023
Sustainable Engineering SolutionsAt the end of 2020, 19% of the backlog refers to projects that promote
Sustainable Development
SES Pipelineby category (€m)
Signed Backlog per type
Conventional Units
Sustainable Development
Projects
Other Construction Projects
38% 43%
19%
35
Since the fourth quarter of 2020, the Sustainable Engineering Solutions
Business Unit has started to record positive results, starting with the increase
of backlog within 2020, the execution of existing contracts, as well as undertaking
new projects. Signed backlog amounted €1,023 mn. at the end of the year, while
accounting also for projects that are in a mature stage of contracting, the total
pipeline exceeds €1.5 bn.

G. GAP ANALYSIS
36
Amounts in mn € Total Metallurgy Sustainable Engineering Solutions
International Renewables and Storage Development
Power & Gas Other Total
Sales 2019 2.256 594 278 388 996 0.0 2.256
Intrinsic Effect (34) Volumes 23 142 165
Shut-Down income (4) (4)
SES Contrancts (68) (124) (192)
Other (3) (3)
Market Effect (289) Organic $/€ eff. (1) (1) (1) (3)
Premia & Prices (73) (208) (281)
CACs 0 2 3
Other (8) (8)
Hedging (34) (34) (34)
Sales 2020 1.899 499 208 264 928 0.0 1.899
Α. Sales

G. GAP ANALYSIS
37
Amounts in mn € Total Metallurgy Sustainable Engineering Solutions
International Renewables and Storage Development
Power & Gas Other Total
EBITDA 2019 313 164 22 29 101 (3) 313
Intrinsic Effect 132 Natural Gas portfolio 48 94 142
Projects (8) (17) (25)
Other 5 (2) (0) 3
Compensations 8 3 11
Market Effect
(82) Aluminium (36) (36)
Alumina (34) (34)
€/$ rate effect 1 (3) (0) 3 0
CO2 27 0 27
Energy Sales Prices (35) (35)
Other 2 (7) (5)
Hedging
(47) (44) (3) (47)
EBITDA 2020 315 136 11 15 157 (4) 315
Β. EBITDA

Risks
! H.
38

Covid-19 Update(1/2)
Employees’
health & safety
set top priority
Structured plan secures employee’s health & ensures
the continuity of our operations
All Business
Units Remain
fully operational
Metallurgy Power & Gas RSD & SES
• Strict policies in company premises for contacting safely every-day business
• Covid-19 tests and self quarantine to all employees after summer vacations
• Prohibition of business travel. If necessary, strict and safety policies are applied
• Extensive use of remote-working and videoconferencing for all meetings
• Provided staff with all the necessary health and safety equipment
• Issued proper resource plan for staff who perform business-critical functions
• Special arrangements for vulnerable employees
• Both Alumina refinery and Aluminum
smelter operating at full capacity
• No disruptions in the supply chain
or customer related issues
• No major issues regarding the
supply of raw materials
• All generation units are fully
operational proving critical
capacity to the national grid
• Delays in the progress of existing
construction related projects
• Delays in new projects being
contacted
39

Covid-19 Update(1/2)
P&L and
Cash Flow
P&L & Cash Flow enhancing
initiatives while retaining
strong liquidity and Credit position
Liquidity & Credit
position
· While MYTIILINEOS took maximum benefit out of the decline in raw materials and natural gas prices, additional several other actions
were taken to offset the headwinds of 2020
· In addition to the €35mn recurring benefit of program “Hephaestus”, another €35mn are being assessed as part of cost optimization
initiatives across all functions of MYTILINEOS. A fair portion of of this €70 mn has been realized in 2020 while the rest in expected in
2021
· 70% of our investment program has been implemented as planted, while the rest 30% is being in a revaluation process
anticipating visibility to increase regarding the evolution of the pandemic
• All the above-mentioned P&L and Cash Flow enhancing initiatives, top up our comfortable credit maturity profile
• No major maturities until 2024
• Strong current liquidity of c. €1.3bn
40

The Company’s activities entail multiple financial risks including
exchange rate and interest rate risks, market price fluctuations, credit
risks and liquidity risks.
A detailed description as well as the risk management policies
are mentioned in the 6-month Financial Report of the Group
and the Company.
OtherRisks
41

Appendix
I.
42

SubsequentEvents
43
There are no subsequent events from Year End until the Flash Note announcement.

mytilineos.gr