fiscal year 2013 annual service plan - septasepta.org/strategic-plan/reports/asp13.pdfannual service...
TRANSCRIPT

Service Planning DepartmentMay 2012
FISCAL YEAR 2013ANNUAL SERVICE PLAN
www.septa.org®

TABLE OF CONTENTS
INTRODUCTION...........................................................................................................................................1
I. SUMMARY AND LIST OF RECOMMENDED CHANGES..................................................................3
II. ANNUAL SERVICE PLAN PROCESS................................................................................................4
III. EVALUATION PROCESS ...................................................................................................................6
IV. RECOMMENDED PROJECTS............................................................................................................7
V. NON-RECOMMENDED PROJECTS.................................................................................................10
VI. POST-IMPLEMENTATION REVIEW OF PRIOR YEAR’S CHANGES ............................................14
VII. ANNUAL ROUTE AND STATION PERFORMANCE REVIEW ........................................................21
APPENDICES............................................................................................................................................23
PROJECT MAPS ...............................................................................................................................24 PROJECT COST/REVENUE SUMMARY CHARTS..........................................................................35 COMMUNITY BENEFIT ANALYSIS COMPUTATIONS ....................................................................41 ANNUAL ROUTE AND STATION PERFORMANCE REVIEW..........................................................48
City Transit ..................................................................................................................................51 Suburban Transit .........................................................................................................................53 Contract Operations .....................................................................................................................54 Regional Rail Division ..................................................................................................................55 Regional Rail Stations ..................................................................................................................56

INTRODUCTION
The Southeastern Pennsylvania Transportation Authority (SEPTA) is pleased to present its Annual Service Plan (ASP) for Fiscal Year 2013. This document describes the service proposals suggested by the general public, government agencies, elected officials and Authority staff, and presents the technical and financial analyses that determine whether the proposals merit implementation. The Plan includes projects for City Transit and Suburban Transit. There are no proposals for Regional Rail.
This year marks the 15th Annual Service Plan and its associated planning process. This and the previous efforts reflect SEPTA’s ongoing commitment to improve the performance and productivity of transit routes and regional rail lines through careful measurement of both ridership changes and operating cost based upon a numeric scoring methodology. This method, fully described for each proposal, includes measures for revenues, operating costs, and impacts to existing riders. Additionally, each proposal must meet minimum transit performance standards, adopted by the SEPTA Board, prior to review within the service plan process. In this fashion, the Authority attempts to utilize its limited resources as efficiently and effectively as possible.
This report is organized into seven sections and an appendix. Sections I and II, respectively, provide a summary of the proposals under consideration in this year’s Plan and a brief description of the Annual Service Plan Process. Section III presents a description of the evaluation process. Section IV provides a detailed description of recommended projects. Section V details projects, which were submitted for consideration but were not recommended for implementation as a result of the Comparative Evaluation Process. Section VI provides a post implementation review of projects implemented under the previous Annual Service Plan, which have been operating at least one year. Section VII, the Annual Route Performance Review, ranks the performance of routes by operating division. Finally, the appendix contains detailed analyses of scores and methodology for evaluation of proposals in this year’s Plan.
The timeline for the Plan, shown on the following page, describes the various steps and approvals required to implement the Plan’s recommendations. Implementation of approved projects is contingent upon SEPTA Board approval and available funding.
1

FY 2013 ANNUAL SERVICE PLAN TIMELINE (Dates are Subject to Change)
Planning process/evaluation process August – December 2011
Prioritized list of projects completed
December 2011
Project list presented/discussed with citizens, community reps. and agencies
December 2011
Project list finalized Costs, schedules and community benefit
analysis completed incorporating input from public meeting
February 2012
Final staff review of Plan February 2012
Tariffs filed and circulated
March 2012
Public hearing notices published March 2012
Public hearings conducted
April 2012
Action recommended by Hearing Examiner April 2012
SEPTA Board consideration
May 2012
Implementation Fall 2012 or Later
2

I. SUMMARY AND LIST OF RECOMMENDED CHANGES
The Fiscal Year 2013 Annual Service Plan evaluated 29 route projects as listed below -- six are recommended for approval.
Recommended Projects City Transit
Routes 56 and R – Service to Baker’s Centre Shopping Complex Route 88 – Discontinue Late Night Trips
Suburban Transit
Route 90 – Experimental Spur Routing to Einstein Medical Center Route 92 – Discontinue Service to Goshen Corporate Park Route 114 – Reduction of Trips to I-95 Industrial Park
Regional Rail
None Non-Recommended Projects
City Transit
Route 14 Express Service All-Day and Route 58 AM Express Service Route 15 – Extension to 63rd and Malvern Loop Route 31 – Extension to Lankenau Hospital Route 57 – Limited Spur to Center City Route G – Extended Late Night Trips to 63rd and Malvern Route K – Alternate Route to replace Route 72 (not yet implemented)
Suburban Transit
Routes 94, 96 & 132 Route 96 Route 98 & New Service in Norristown Routes 103, 105 & 106 Routes 104 & 111 Route 117 Route 123 & Norristown High-Speed Line Route 134 New Service from 69th Street Transportation Center to Chester
3
Route and Station Performance Review
In addition, a total of 16 routes fall below the operating performance standards set forth in the Service Standards and Process documents for each operating division. For City Transit, nine routes fall under the Route Economic Performance Guideline Standard. For Suburban Transit, seven routes fall below this Standard. For Regional Rail Division, no routes fall below the Route Economic Performance Guideline Standard.
II. ANNUAL SERVICE PLAN PROCESS
The following paragraphs describe the Annual Service Plan process. The dates referred
to in the text are those to be used in the FY 2013 Plan. Proposals
All route and service adjustments which impact SEPTA's Operating Budget will be planned and implemented according to the Annual Service Plan. These include suggestions that originate from elected officials, City Office of Strategic Planning, county planning commissions, SEPTA’s Citizen Advisory Committee, community groups, transit advocates, passengers and SEPTA employees. All route and service adjustments will be investigated, planned and implemented through SEPTA's Service Planning Department. Suggestions from outside sources and from other SEPTA Departments are to be submitted to Service Planning by July 31 of each year for consideration. Planning Process/Evaluation Process
Projects considered as part of the FY 2013 Annual Service Plan were presented to affected groups and agencies. This work included the following steps of the route planning process: identification of areas to be studied (for projects initiated by SEPTA staff), evaluation of input from elected officials, planning professionals and citizens, performance of field work, completion and analysis of passenger traffic checks, and preparation of schedule specifications. Projects were then evaluated as explained in Section III. Project List Presented/Discussed with Affected Groups and Agencies
On December 14, 2011, an Open House meeting was held with outside groups, agencies and interested citizens affected by, or concerned with, proposed Annual Service Plan Projects. The purpose of this meeting was to receive input from interested parties prior to initiation of the tariff and public hearing process. This permitted serious concerns to be addressed before the Plan was finalized.
4

Budget Impact
Any item having a cost impact that is not included in SEPTA’s Fiscal Year 2013 Operating Budget will be required to receive external subsidy in order for implementation to be considered. Tariff Preparation and Circulation
Tariffs for route projects will be prepared, filed and circulated for in-house SEPTA approval. During this time, public hearing dates will be tentatively arranged. When concurrences are received, hearing dates will be finalized and public notices will be published. Public Hearings
Public hearings will be held at accessible locations. Hearings will be arranged, advertised and conducted according to SEPTA's tariff regulations and enabling legislation. Post-Hearing Revisions
Any revisions necessitated by the public hearing process will then be finalized. Where revisions to projects affect cost and/or revenue, the benefit point analysis will be re-calculated to assure that the overall benefit of a project has not been compromised. The Hearing Examiner's Report and Recommendations will be considered by the SEPTA Board at their regularly scheduled meeting, usually held on the fourth Thursday of the month. SEPTA Board Approval
The SEPTA Board will consider all elements of the Annual Service Plan. The Plan may be adopted in whole or in part. Implementation
Final implementation dates will be set, pending SEPTA Board approval and available funding. Post-Implementation Review
After a period of one year, all major service changes (including area restructuring), new routes, and service extensions are subject to review. Passenger traffic checks and/or Automatic Passenger Counter (APC) data will be conducted at least four times during this period. Routes that are implemented later than September, due to budgetary reasons, will be evaluated and reported in the following fiscal year Annual Service Plan process.
As a result of this review, a decision will be made to retain the service change as is, modify it in some way, or possibly discontinue it. A determination may be made at this time to extend the review period for further evaluation prior to making a final decision.
5

III. EVALUATION PROCESS
As described in the Service Standards and Process documents for each operating division, service proposals, both from within and outside of SEPTA, are to be submitted in writing to SEPTA's Service Planning Department. Once received, all proposals meeting basic service standards and impacting the Operating Budget will be evaluated. City and Suburban Transit and Contract Operation projects are evaluated using the Comparative Evaluation Process, whereas projects for Regional Rail Division use the Evaluation Process for Budget related items. Both are explained below.
CITY AND SUBURBAN TRANSIT AND CONTRACT OPERATIONS
Comparative Evaluation Process
City and Suburban Transit and Contract Operation projects employ the Comparative Evaluation Process. This process provides an objective and systematic procedure to compare these service proposals with respect to their passenger and community benefits, relative to the cost of providing the services. This comparison will indicate which proposals return the greatest overall benefit for each subsidy dollar spent. This evaluation will consist of three parts: 1) ridership forecast, 2) cost analysis and 3) community benefit analysis.
The community benefit analysis requires further explanation. It is an evaluation according to a set of non-economic criteria which are not captured in a financial analysis, but which are important to the community. Each of these qualitative considerations is assigned a weight in "benefit points." The factors considered and their relative weightings are listed on the following page. Upon completion of the community benefit analysis, the final scores for each division are calculated; however, the process differs for each operating division as further described below.
For City and Suburban Transit and Contract Operations, a Final Benefit Score (FBS) is calculated by dividing the proposal’s cost into its benefit points. The higher resulting score indicates the route proposal is beneficial to the Authority and our customers, thus advancing to the public hearing process. The resulting scores provide a comparison of services indicating the community benefit received for the expenditure of SEPTA resources.
6

Criteria for Comparative Evaluation
Category Benefit Points
Each "Owl" passenger 1.25
Each other passenger 1.0
Each other passenger lost -1.0
Eliminated transfer 0.6
Additional transfer required -0.6
Improved travel time 0.4
Added travel time -0.4
Decreased walking distance 0.4
Increased walking distance -0.4
All of the projects for City and Suburban Transit and Contract Operations included in the Fiscal Year 2013 Annual Service Plan were subject to the Comparative Evaluation Process. The analysis is included within each project description section.
Regional Rail Evaluation Process
Regional Rail Division employs the evaluation process set forth in the Service Standards and Process document. This evaluation will consist of three parts: cost analysis, passenger revenue forecast, and operating ratio analysis.
IV. RECOMMENDED PROJECTS
Listed below are the projects and descriptions included in SEPTA’s FY 2013 Annual Service Plan. A Community Benefit Analysis has been performed for all of these projects. Implementation of the recommended projects will proceed pending the outcome of the public hearing process, SEPTA Board approval and available funding.
CITY TRANSIT
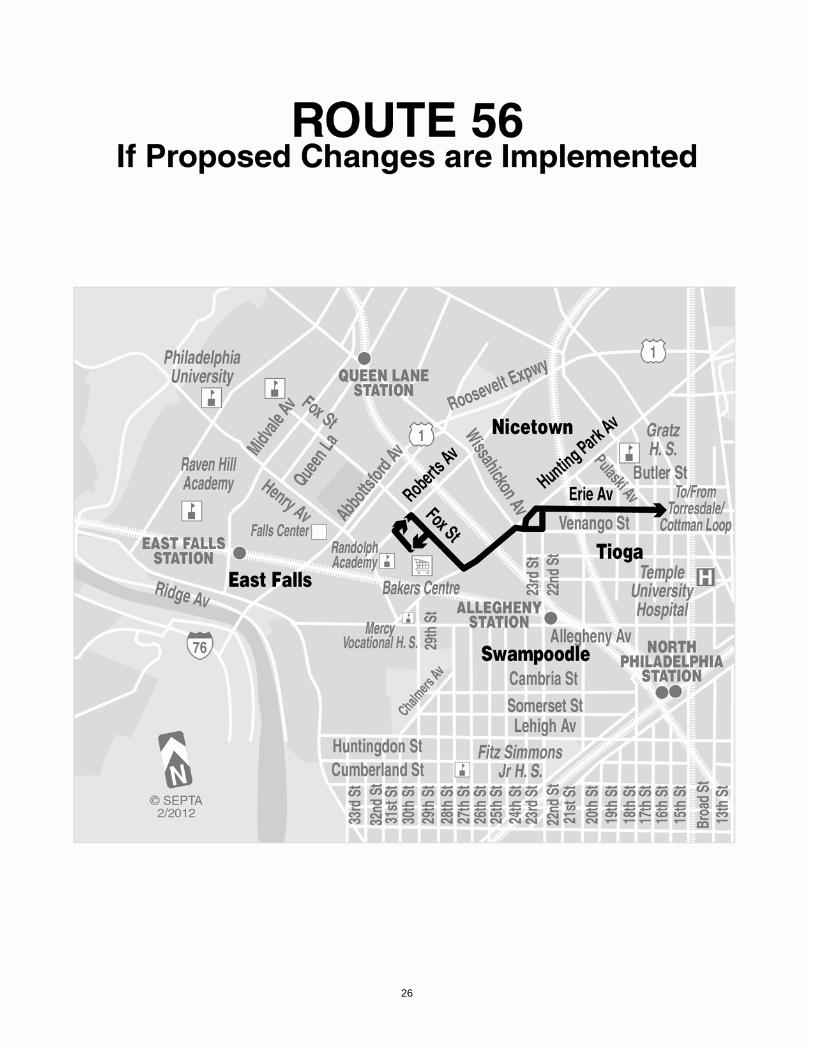
Routes 56 and R – Service to Baker’s Centre Shopping Complex
The owner of the newly proposed Baker’s Centre Shopping Complex, at Fox Street and Roberts Avenue, expressed interest in having SEPTA bus services integrated into the
7

development. Route 56 was identified as a suitable option to serve Baker’s Centre because it serves the densely populated communities along the Erie Avenue corridor. Extending Route 56 from its current terminus at Venango Loop to Baker’s Centre would create an option that is not currently available; namely, providing customers with close proximity one-seat trips to a full service grocery store, in addition to other retailers.
Initially, Route 56 would operate alternating trips to Baker’s Centre on weekdays, and every trip serving Baker’s Centre weekends. Route 56 would also provide service to Temple University Health Services Administrative Offices, located on Hunting Park Avenue, near Fox Street. Currently, Temple University operates a limited service shuttle that transports employees to the Erie Avenue Station. Route 56 would meet transit needs outside of the shuttle’s hours of operation. Due to these significant community benefits, the extension of Route 56 is being recommended.
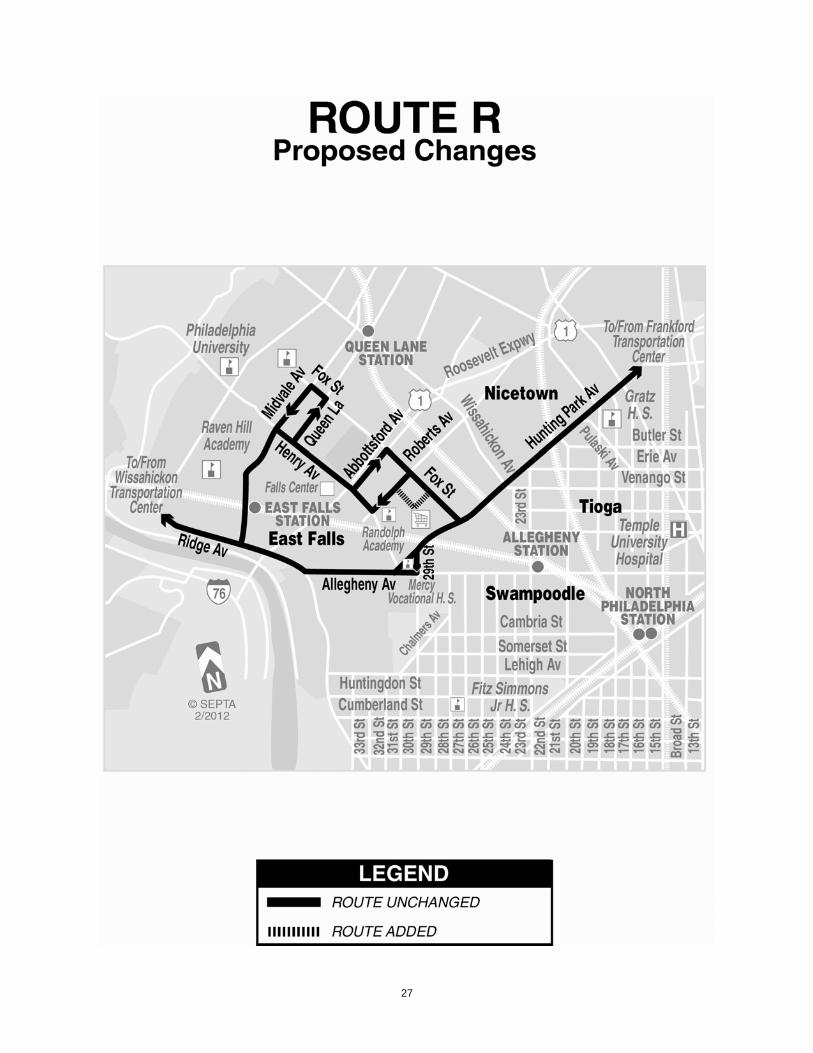
Route R currently operates around the perimeter of the Baker’s Centre site on Fox Street and Roberts Avenue. In order to improve customer convenience, during business hours, the westbound Route R would operate north on Fox Street, enter left into Baker’s Centre, and exit left onto Roberts Avenue, before continuing the regular routing. Route R would serve Baker’s Centre via Fox Street on the eastbound routing. This realignment would eliminate the potential safety hazard of customers crossing Fox Street to access the shopping center. Based upon improvements in customer safety and convenience, this alternate route to Route R is being recommended.
Route 88 – Discontinue Late Night Trips
Route 88 operates between Frankford Transportation Center and Bethayres Regional Rail Station on the West Trenton Line, and serves Holy Redeemer Hospital in neighboring Meadowbrook. Several efforts have been made to improve productivity on Route 88, such as truncating the cross-town segment to Bethayres. Continuing efforts to efficiently utilize resources, the last two daily round trips are being proposed for discontinuation. The average daily passenger count for these trips is four, and the approximate cost per passenger is $18. Due to the low ridership, the associated operation costs, and more importantly, the availability of alternate bus service within a three to four block radius of the proposed discontinued street segments served by Route 88 during the late evening hours, the reduction of these trips is being recommended.
SUBURBAN TRANSIT AND CONTRACT OPERATIONS
Route 90 – Experimental Spur Routing to Einstein Medical Center
SEPTA received requests from Einstein Medical Center management and through an
external submission to provide direct service to a new hospital and medical office campus in East Norriton Township that will replace Montgomery Hospital facilities in Norristown. SEPTA
8

has been in discussion with various parties, including East Norriton and Montgomery County. Two options were evaluated. One option involved creating a spur routing to Route 90 on Germantown Pike between Swede Road and the new hospital site east of Whitehall Road. The second option, submitted externally, evaluated the feasibility of altering the route to operate via Sterigere Street, Whitehall Road and Germantown Pike in both directions, and the routing would discontinue existing service along Markley Street and Swede Road. This option was rejected as the proposed routing would not generate sufficient riders lost along Markley Street as there are too few opportunities to attract consistent ridership other than potential employees and patients destined to the Einstein Medical Facility.
At the Open House on December 14, 2011, a suggestion was made to operate the spur routing under experimental order authority. This tactic would allow time for sufficient evaluation to determine if the service is warranted on a permanent basis. For a one-year trial period the annual cost would be $61,000. Route 90 is recommended for implementation on an experimental basis, based upon funding availability.
Route 92 – Discontinue Service to Goshen Corporate Park
This route was the subject of the FY 2012 Annual Service Plan as the route was consolidated with Route 314. At the request of Operations staff and the Chester County Planning Commission a thorough review was undertaken. Most riders were not impacted by the route and service changes, although some riders were inconvenienced due to longer travel times. Prior to the routing change 385 passenger trips were carried per weekday. Presently, 450 weekday passenger trips are generated, far below the projection of 532.
In order to reduce operating expenses and speed the ride to Exton Square Mall for
passengers, it is proposed to discontinue service to Goshen Corporate Park and portions of Boot Road. This change affects 25 weekday passenger trips. Service would be rerouted to use US 202 and PA 100 to reach Exton Square Mall offering a faster ride for customers. Annual mileage and hours would be reduced along with two peak vehicles, resulting in a $248,500 savings.
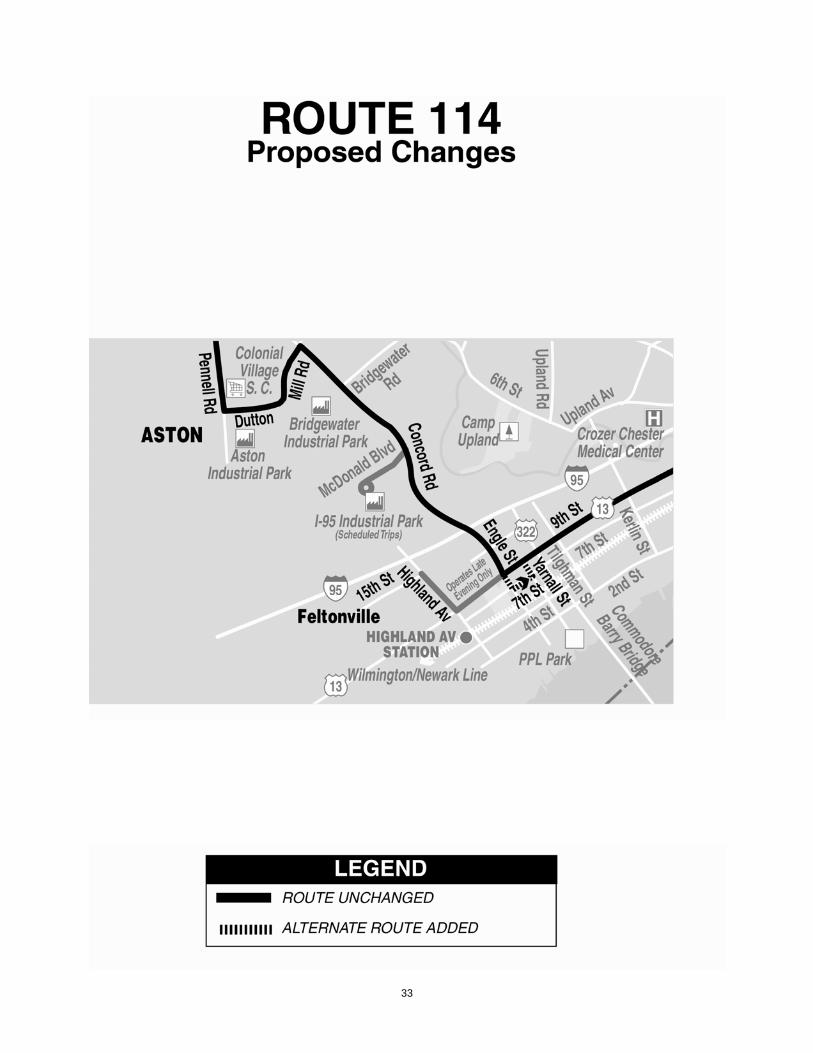
Route 114 - Reduction of Trips to I-95 Industrial Park
SEPTA evaluated operational changes to Route 114 to reflect changing service needs in Chester City and Chester Township. The Route 114 segment between the Chester Transportation Center and 9th and Engle Streets, and the I-95 Industrial Park is duplicative with Route 117. Ridership to the I-95 Industrial Park averages two passengers per scheduled trip. It is proposed to discontinue most trips to the I-95 Industrial Park on Route 114 and terminate these trips at 7th and Yarnall Streets. Route 114 would continue to operate two round-trips to I-95 Industrial Park during weekday peak hours. Route 117 operating every 30 minutes provides an adequate alternative for the I-95 Industrial Park passengers. Annual mileage and hours would be reduced resulting in a $76,300 savings.
9

V. NON-RECOMMENDED PROJECTS
CITY TRANSIT
Route 14 Express Service All-Day and Route 58 AM Express Service
These two requests will be evaluated in the upcoming year.
Route 15 – Extension to 63rd and Malvern Loop There is no layover space or track space available at the 63rd and Malvern loop for the addition of the Route 15 trolley. The Route 10 trolley and bus Route 46 already occupy this loop with some Route G buses during peak hours. Bus Routes 65 and 105 also serve the loop, but stop on the perimeter streets. There is no remaining space either in the loop or along the perimeter that would permit Route 15 to be extended.
Route 31 – Extension to Lankenau Hospital
This external proposal was not fully analyzed since there is no additional space at Lankenau Hospital for buses to layover or recover between trips. SEPTA’s agreement with Lankenau Hospital permits only one Route G bus at a time to recover at that location, and also provides for Route 105 to be through routed with one stop on hospital grounds.
Route 57 – Limited Spur to Center City
The City of Philadelphia Mayor’s Office of Transportation and Utilities (MOTU), and the Center City District (CCD) submitted a joint request that SEPTA explore the feasibility of creating direct bus service from South Philadelphia, east of Broad Street to Center City, west of Broad Street. The aim of this service was to increase the use of public transit in these neighborhoods by offering service to the large CBD employment center west of Broad Street, without the current need for a transfer. SEPTA, MOTU and CCD partnered through conducting surveys of existing and potential new riders in order to refine possible routing options and service frequencies.
The most promising operating scenario of the options evaluated was a limited weekday peak spur off the southern alignment of Route 57. Under this potential routing, select northbound buses would have turned west (left) from 3rd Street onto Market Street to City Hall, and then onto JFK Boulevard to terminate on 20th Street. Similarly, southbound buses would have returned east from 20th Street to 4th Street, via Market Street, before turning south (right) to continue their regular routing.
10

After the comprehensive analysis was undertaken, it was determined that projected ridership levels, particularly new ridership, for the service were not sufficient to off-set the additional operating expenses incurred to an acceptable level. As a consequence, this proposal is not recommended at this time.
However, all parties agreed to re-evaluate this service concept in the future, based on the changing demographics of the neighborhoods in South Philadelphia, east of Broad Street, and growing employment levels in Center City, west of Board Street.
Route G – Extended Late Night Trips to 63rd and Malvern
SEPTA recognizes this external proposal as a valid request. However, it would add significant expense to the operation by requiring an additional bus to be in service during the late night hours.
Route K – Alternate Route to replace Route 72 (not yet implemented) This external proposal suggested a significant diversion of Route K service, diverging at 2nd Street and Godfrey Avenue, via 2nd Street to Cheltenham Avenue, to Cheltenham Square Shopping Center. This would operate as an alternate destination, reducing service to Arrott Terminal. This proposal is not recommended, because it would cause considerable confusion among customers since the two proposed destinations are so disparate, and would cause a significant drop in service levels between Godfrey Loop and Arrott Terminal. It is recommended to wait for adequate funding to operate Route 72, rather than modify existing Route K service.
SUBURBAN TRANSIT
Routes 94, 96 & 132 As a result of operational changes required by municipal improvements underway and
scheduled in Lansdale Borough, SEPTA is analyzing service connections between the Lansdale area and the Montgomery Mall. The emphasis will be on providing adequate service to key locations while improving operational efficiencies. Options include modifying route segments, taking into account new development that has or is scheduled to occur in the Lansdale and Montgomeryville areas.
This project would be deferred to the FY 2014 Annual Service Plan; that will allow staff more time to coordinate with municipal, county and other stakeholders to resolve potential operating issues.
11

Route 96 An external suggestion was submitted (linked with the Route 90 suggestion) to reroute
Route 96 off Pine Street and relocate to Markley Street to reach Johnson Highway. This proposal was rejected due to the fact that as many as 135 passengers would walk further to reach their bus stop. In addition, the displaced Route 90 riders would have limited options if they are destined to locations along Germantown Pike or Plymouth Meeting Mall.
Route 98 & New Service in Norristown An external suggestion was made, in conjunction with a proposal to change Route 90 to Sterigere Street and Whitehall Road to serve the relocated Einstein Montgomery Hospital on Germantown Pike. This proposed would create a Norristown loop route that would replace portions of existing Route 90. A related proposal would adjust Route 98 by absorbing service on New Hope Street by including it on the loop route. Since the Route 90 change was rejected, there would not be an adequate need for this service or the Route 98 change.
Routes 103, 105 & 106 An external suggestion was made to change Route 103 from its current routing in Overbrook Park to instead absorb the segment of Route 106 along Haverford Avenue. This would be in conjunction with a discontinuance of Route 106. This proposal was rejected because it would cause major disruption to many passengers in Overbrook Park and create longer trips for passengers from Brookline and Ardmore.
The passenger also suggested that Route 105 should be cut back from 69th Street Transportation Center to 63rd Street and Malvern Avenue. This was rejected because it would recreate a two-seat ride for passengers traveling from 69th Street to points west of Overbrook, and there is not enough space within the bus loop to accommodate another route.
Routes 104 & 111
An external suggestion was submitted to revise the Express service along West Chester Pike because of lengthy travel times to West Chester. The Service Planning Department will continue to monitor running times and service patterns to see if any improvements can be made. SEPTA has participated in efforts by the Delaware Valley Regional Planning Commission and other stakeholders to examine how to improve transit travel times on this corridor through traffic signal optimization and other unique operational tactics. SEPTA will continue to explore those options in the future.
As an alternate option, the suggestion was made to extend Route 111 trips from Chadds
Ford to West Chester University. This would provide service that was previously operated as part of former Routes 202, 306, and 314, all of which were discontinued due to low ridership. Based on this history and the additional operating expense, this proposal was rejected.
12

Route 117
SEPTA evaluated operational changes to Route 117 to reflect changing service needs
in Chester City and Chester Township. The focus would have been optimizing trips with light ridership to terminate in the west end of Chester versus continuing to the I-95 Industrial Park. No route or schedule adjustments would be made to Route 117 at this time.
Route 123 & Norristown High-Speed Line SEPTA assessed Route 123 and NHSL ridership on weeknights and weekends to determine if bus riders from 69th Street could be accommodated on the railroad as far as Gulph Mills. At Gulph Mills riders would be issued a free transfer and connect with a shortened Route 123 bus to finish the journey to King of Prussia. Also examined was the impact of riders destined to points along West Chester Pike from 69th Street Transportation Center and riders who board along West Chester Pike destined to King of Prussia.
The objective is to utilize the capacity and frequent service of the High Speed Line between the 69th Street Transportation Center and Gulph Mills, providing a timed transfer to Route 123 service to the King of Prussia Transit Center. Route 123 buses from Gulph Mills would wait for a connecting northbound train from 69th Street Transportation Center. Buses would wait for late trains. Trips returning from King of Prussia would discharge passengers who would have ample time to reach the inbound platform for the NHSL return trip to 69th Street Transportation Center.
On weeknights Route 123 would operate every 20 minutes between 6:30 and 11:00 PM, matching the NHSL headway. On Saturdays, it is proposed to change the NHSL service to operate every 15 minutes between 6:20 AM and 10:20 PM between 69th Street and Hughes Park. Service to Norristown would operate every 30 minutes. Route 123 would operate every 15 minutes from 7:00 AM until 11:00 PM. NHSL service on Sundays would be increased to operate every 20 minutes and Route 123 service would be scheduled every 20 minutes from 8:00 AM until 9:00 PM.
This project would be deferred to the FY 2014 Annual Service Plan as several capital
improvement projects slated to occur on the NHSL in calendar year 2012 and 2013 would impact scheduling and on-time performance for the bus and rail modes.
Route 134 An external suggestion was made to change the southern terminus of this route from
the Chestnut Hill Loop to the Cheltenham–Ogontz Loop, in order to open up access to a new ridership market. One operational drawback to this proposal is that there is not extra space at the loop to accommodate another route. Notwithstanding, this route is externally funded and SEPTA has been notified that these funds will cease in June, 2012. There is a proposal to
13

discontinue service in its entirety. Route 94 would offer alternative service for many Route 134 riders.
New Service from 69th Street Transportation Center to Chester
This external proposal would provide revenue service for trips that currently travel from
Victory District out of service to start runs at Chester Transportation Center. It was intended to provide service to Harrah’s Chester Casino similar to that provided by Route 150 between Plymouth Meeting and Parx Casino for buses that would otherwise operate out of service. Since all of the out of service trips occur in early morning and late evening hours, this proposal would not provide service at times when significant ridership could be expected that would offset the extra operating costs. Therefore, this proposal was rejected.
VI. POST-IMPLEMENTATION REVIEW OF PRIOR YEAR’S CHANGES
The Post Implementation Review section of the Annual Service Plan discusses items which were initiated through the Annual Service Plan process and have been operating for at least one year. Some of these changes have not been in operation long enough to provide a full evaluation. Additional commentary may be provided in the FY 2014 Annual Service Plan document.
CITY TRANSIT
Route C – Extension to AT&T Station
This extension was implemented in February 2012, concurrent with the separation of Route C into Routes 4 and 16, which follow the two distinct trip patterns of the former Route C. Consequently, it is Route 4 that has just now begun operating between Fern Rock Transportation Center and Broad Street and Pattison Avenue (AT&T Station).
Routes 43 and 52 – Parkside Rerouting In February 2011, Routes 43 and 52 were rerouted from the former Parkside Loop, located at 49th Street and Parkside Avenue to serve businesses located in the West Parkside Industrial Park. Bus stops were added at 49th and Jefferson Streets, as well as 50th and Jefferson Streets. Weekday ridership in this area is 17 passenger trips for Route 43, and 22 passenger trips for Route 52. These routes were again modified in December 2011 with the opening of the new Parkside Loop, located on 50th Street, south of Parkside Avenue, and directly behind the Park Town West Shopping Center. For this reason, SEPTA Staff continues to collect data and monitor the ridership prior to a final routing decision.
14

Route 44 – Cynwyd Spur
Route 44 had the two weekday evening spur trips to Cynwyd Station eliminated in February, 2012.
Route 79 – Extension to Pier 70
The extension of Route 79 from its current terminus on Columbus Boulevard to the Pier 70 Shopping Center was approved for implementation as part of the FY 2012 Annual Service Plan. However, the expansion of the Wal-Mart and associated landscaping removed the additional bus layover capacity within the shopping center. It is for this reason that this initiative has been placed on hold while an alternative solution is sought.
SUBURBAN TRANSIT
Route 97
Two routing changes were implemented as part of the FY 2011 Annual Service Plan.
The first was to alter the route in Plymouth Township to operate via Alan Wood Road and Seven Stars Lane to reach the Metroplex Shopping Center. This routing change provided a faster trip for customers destined to Metroplex and points east, along with reducing operating expenses by minimizing the number of buses entering and leaving the Frontier bus facility through operator reliefs.
Second, many Route 97 trips terminating in Barren Hill were extended to Chestnut Hill. These were the trips that were scheduled in coordination with Route 94 trips that start at the Chestnut Hill Loop located at Germantown Avenue and Bethlehem Pike. Prior to implementation, these buses were running out-of-service. These trips were placed into revenue service starting in February 2011. This change was supported by the Montgomery County Planning Commission.
Ridership growth has been steady as a result of these changes. About 650 passenger trips per weekday were made on Route 97 prior to the change. Ridership has grown to more than 820 passenger trips per day during 2011. There has been growth in the number of passenger trips traveling on the new routing to Chestnut Hill, rising from less than 70 in the first three months of implementation to about 170 in fall 2011. This ridership growth has not come at the expense of Route L, which has seen growth of about 150 passenger trips per day since February 2011. Passengers that used to transfer to reach Chestnut Hill now have a one-seat ride.
15

Greater Ardmore Area Service Evaluation
Routes 103, 105 and 106 were restructured as part of the FY 2011 Annual Service Plan that commenced in February 2011. The following changes occurred:
Route 103 was rerouted from West Chester Pike to serve Overbrook Park. Route 105 was rerouted from Overbrook Park to Overbrook Selected Route 106 trips were extended from Ardmore to Paoli
After implementation, several schedule adjustments were made to resolve overcrowded
conditions and improve connections with other transit routes. As a result of the above routing changes, ridership dramatically improved as the revised routings offered new opportunities towards 69th Street Transportation Center and the Main Line. On weekdays, 755 new passenger trips have been generated. The loss of ridership on Route 105 are mostly riders from Overbrook Park who shifted to Route 103. On weekends, Saturday ridership increased by 157 passenger trips and 168 on Sundays. The tables noted below highlight the ridership prior and after the routing change.
16

ROUTEFY 2012 ASP
REPORT
AVERAGE 2012
TRAFFIC COUNTS OR APC DATA DIFFERENCE
103 587 1,552 965105 2,037 1,650 -387106 559 736 177
TOTAL 3,183 3,938 755
ROUTEFY 2012 ASP
REPORT
AVERAGE 2012
TRAFFIC COUNTS OR APC DATA DIFFERENCE
103 329 623 294105 973 846 -127106 309 299 -10
TOTAL 1,611 1,768 157
ROUTEFY 2012 ASP
REPORT
AVERAGE 2012
TRAFFIC COUNTS OR APC DATA DIFFERENCE
103 0 253 253105 582 497 -85106 0 0 0
TOTAL 582 750 168
WEEKDAYS
SATURDAYS
SUNDAYS
Changes to Routes 93, 95, 98 and 139
Route and schedule revisions were implemented on October 31, 2011. A brief update of each route is noted below; however, a complete evaluation will be noted in the FY 2014 Annual Service Plan.
Routes 93 and 139
On October 31, 2011, Route 93 rush hour service was improved to every 30 minutes and Route 139 was revised to terminate at Ridge Pike and Township Line Road (Limerick) instead of
17

the Philadelphia Premium Outlets. Initial data on Route 139 show that 49 passenger trips transfer to/from Route 93. Overall ridership has increased by 90 passenger trips. Since its implementation, SEPTA has received several customer service requests to improve the Route 139/93 transfer connection at Limerick, in addition to resolving early morning service from Royersford to King of Prussia. Both actions were implemented on February 20, 2012.
Ridership on the 30-minute weekday rush hour service on Route 93 has not generated
the anticipated ridership increases. Prior to implementation, the route carried 1,470 passenger trips, which is 17% higher than what was posted in the FY 2011 Annual Service Plan document. However, at this juncture ridership remains at 1,470 passenger trips. Many passengers have adjusted their travel times to match the frequent service, unlike other Frontier routes where ridership gravitated to the new service combined with a significant increase in ridership. The service will continue to be monitored.
Routes 95 and 98
Route 95 was extended to Willow Grove replacing Route 98 service on October 31, 2011. Route 98 was truncated to operate between Norristown Transportation Center and Plymouth Meeting Mall. Total weekday ridership on Route 95 so far has exceeded projections (668) as the route now carries 700 passenger trips. Saturday ridership is meeting projections as 390 passenger trips are being carried versus 350 projected. Route 98 has exceeded projections as 1,286 weekday passenger trips are carried and 912 were projected. Saturday figures indicate 500 passenger trips with 400 projected.
Routes 112 and 126
Route 112 was split into two separate routes on August 29, 2011. Route 112 now provides direct service to Delaware County Community College (DCCC) from 69th Street Terminal via West Chester Pike. Route 126 now serves Manoa and Lawrence Park.
Ridership on Route 112 has far exceeded projections of 1,400 weekday passenger trips
as the route now averages nearly 1,700. Of these riders 62% of the trips originate or terminate at DCCC, and prior to the routing change this figure was 45% of the total ridership. Weekend ridership has also exceeded projections.
In fact, the route restructuring has been so successful that some trips are consistently
overcrowded. Effective February 20, 2012, additional trips are being scheduled in the early-afternoon hours to relieve crowded conditions. The route will continue to be monitored.
Route 126 service has also surpassed ridership expectations on weekdays and
Saturdays. A chart highlighting ridership is shown on Page 20.
18

Route 115
Service was discontinued between Brookline and Ardmore and revised to terminate at DCCC via Manoa Road, West Chester Pike and Media Line Road. The route now offers a one-seat ride to DCCC’s Main Campus from eastern Delaware County and reduces travel time. Weekday ridership prior to the routing change averaged 1,098 passenger trips, and since implementation nearly 1,200 trips are now carried. 210 passenger trips board or leave between Manoa Road & Naylors Run Drive and DCCC, with the majority of the riders boarding or alighting at DCCC. A ridership summary is shown on the following page.
Route 119
Several route and service changes were implemented to reduce operating expenses and
improve fiscal performance. Service was discontinued between Chester Transportation Center and Harrah’s Casino & Racetrack as alternative service is provided by bus Routes 37 and 113, along with a route simplification in Marcus Hook that has improved travel time for medium and long-distance customers. Schedules for mid-day and evening service were revised. Weekday ridership is exceeding projections, and weekend ridership is on target to meet projections.
19

ROUTEFY 2012 ASP
REPORT
AVERAGE 2012
TRAFFIC COUNTS OR APC DATA DIFFERENCE
112 1,475 1,660 185115 1,098 1,182 84119 715 746 31126 600 892 292
ROUTEFY 2012 ASP
REPORT
AVERAGE 2012
TRAFFIC COUNTS OR APC DATA DIFFERENCE
112 350 478 128119 356 350 -6126 200 318 118
ROUTEFY 2012 ASP
REPORT
AVERAGE 2012
TRAFFIC COUNTS OR APC DATA DIFFERENCE
112 200 383 183119 347 340 -7
WEEKDAYS
SATURDAYS
SUNDAYS
Bucks County Route Rationalization
Route and service changes were made to Routes 127, 130 and 133 (former Route 304) in order to improve economic performance, eliminating duplicative service and maintaining core ridership for these routes. These changes were implemented on October 31, 2011, and while each route is summarized below a complete evaluation will be noted in the FY 2014 Annual Service Plan.
Route 127
Duplicative service was discontinued between Neshaminy Mall and Oxford Valley Mall as
Route 14 offers service every 30 minutes along most of the corridor. Mid-day service was revised to operate every 90 minutes. Prior to implementation 440 weekday passenger trips were carried. Since the service change took effect on October 31, 2011, the route now carries
20
472, which actually exceeded projections as ridership was expected to decline by 55 passenger trips. Saturday ridership is consistent with weekdays. Implementing this change should improve the route’s poor economic performance and impact very few riders. The majority of riders who board and leave at Neshaminy Mall to Route 127 are mostly transfers from Route 14. These riders can access Route 127 at Oxford Valley Mall. Mid-day service was reduced to operate every 90 minutes, due to low ridership.
A minor routing change provided new service to the Court at Oxford Valley Shopping
Center. However, service was removed from the shopping center on February 20, 2012, due to bus stop issues within the shopping center.
Route 130
Non-revenue trips were converted to revenue service as service was extended from Franklin Mills Mall to the Frankford & Knights (Morrell Park) Loop on October 31, 2012. Many Route 130 trips are cross-scheduled with Route 129, which terminates at Morrell Park. Weekday ridership has increased as a result of the extension. Weekday service is carrying 742 passenger trips exceeding the projected figure of 719. Saturday ridership averages 330 passenger trips, which is on target to meet projections.
Route 133
Route 133 replaced Route 304 service between Frankford & Knights (Morrell Park) Loop and the Expressway I-95 Industrial Park in Bensalem Township. Four morning and four afternoon trips are scheduled in an attempt to retain at least 60% of former Route 304’s weekday ridership. Saturday service was discontinued due to low ridership. This change has reduced operating expenses. Ridership averages 70 passenger trips.
VII. ANNUAL ROUTE AND STATION PERFORMANCE REVIEW
As defined in the Service Standards and Process documents for each operating division,
the Annual Route Performance Review ranks all of SEPTA’s routes for compliance to the established Route Economic Performance Guideline Standards. City and Suburban Transit routes and Regional Rail routes are ranked on an operating ratio basis; Regional Rail stations are also evaluated for compliance to the Station Economic Performance Guideline Standards.
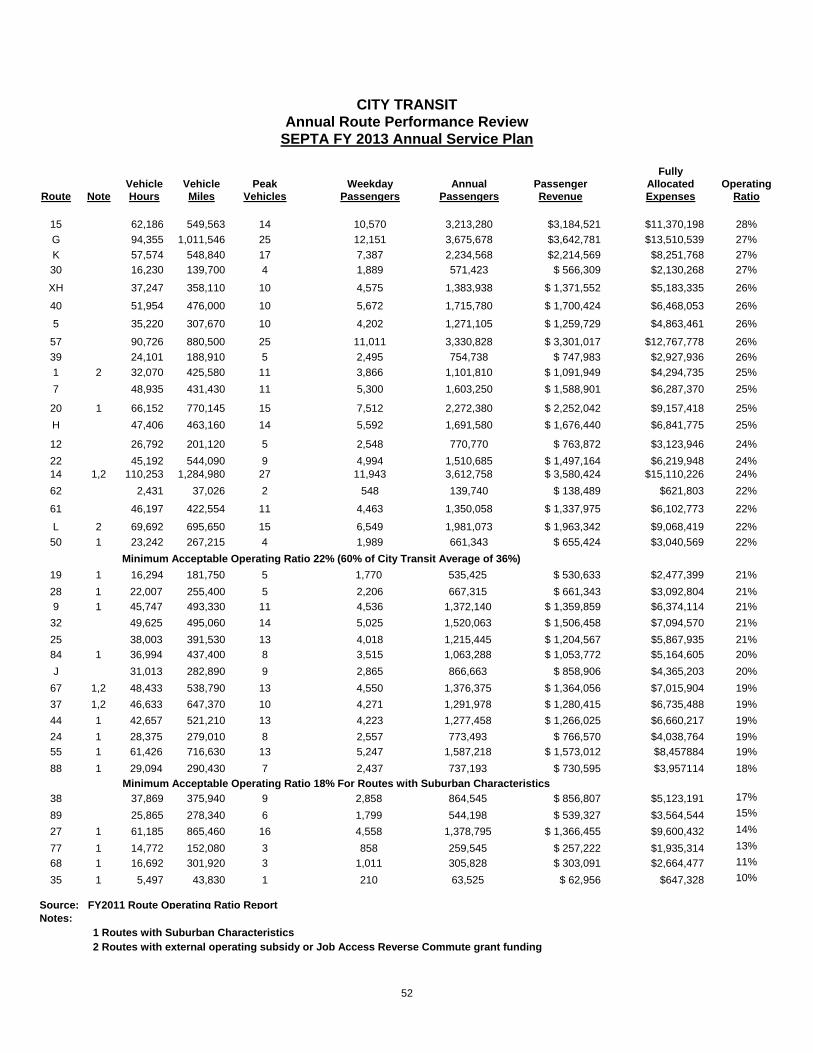
CITY TRANSIT
For the Fiscal Year 2013 Annual Service Plan, the minimum acceptable operating ratio
for City Transit Division (CTD) is 22% (60% of average City Transit operating ratio of 36%). The minimum acceptable operating ratio for City Transit routes with suburban characteristics is 18% (60% of Combined City and Suburban Transit average of 31%).
21

A complete list of City Transit routes ranked on an operating basis can be found in the Appendix. For the Fiscal Year 2013 Annual Service Plan, the following routes fall below the minimum operating ratio standard.
Routes That Rank Below the Minimum Acceptable Operating Ratio for City Transit (22% CTD / 18% CTD Routes with Suburban Characteristics)
Route Operating Ratio Route Operating Ratio
32 21% 27* 14% 25 21% 77* 13% J 20% 68* 11%
38 17% 35* 10% 89 15%
* -- Routes with suburban characteristics
SUBURBAN TRANSIT
For the Fiscal Year 2013 Annual Service Plan, the minimum acceptable operating ratio for Suburban Transit Division (STD) is 15% (60% of average STD operating ratio of 25%).
A complete list of Suburban Transit routes ranked on an operating ratio basis can be found in the Appendix. Routes below the line on the chart exceed the minimum acceptable operating ratio. For the Fiscal Year 2013 Annual Service Plan, the following routes fall below the acceptable operating ratio level:
Routes That Rank Below the Minimum Acceptable Operating Ratio for Suburban Transit
Route Operating Ratio
130 14% 128 14%
119 13%
139 12%
150 11%
92 10%
134 10%
RAILROAD DIVISION For the FY 2013 Annual Service Plan, the minimum acceptable operating ratio for RRD routes is
29% (60% of the average weighted operating ratio of 48%). No routes fall below the standard.
22

APPENDICES
23

PROJECT MAPS
24

25
26
27

28

29

30

31

32
33

34

PROJECT COST/REVENUE SUMMARY CHARTS
35
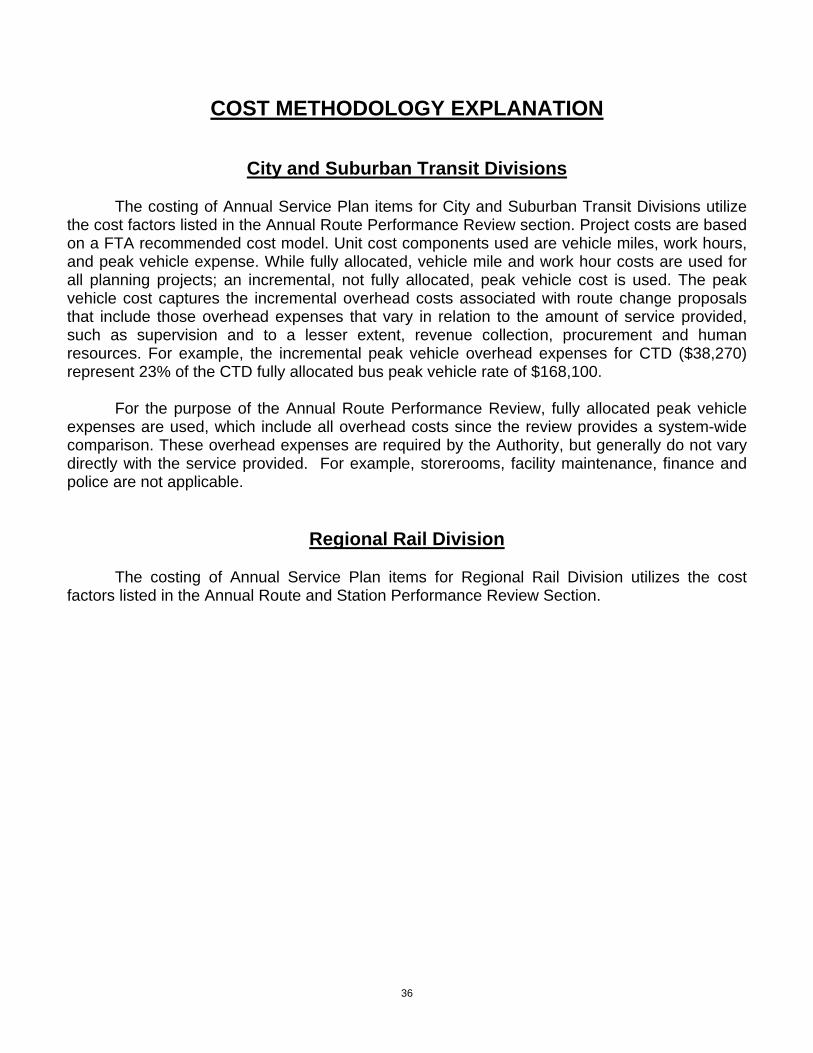
COST METHODOLOGY EXPLANATION
City and Suburban Transit Divisions The costing of Annual Service Plan items for City and Suburban Transit Divisions utilize the cost factors listed in the Annual Route Performance Review section. Project costs are based on a FTA recommended cost model. Unit cost components used are vehicle miles, work hours, and peak vehicle expense. While fully allocated, vehicle mile and work hour costs are used for all planning projects; an incremental, not fully allocated, peak vehicle cost is used. The peak vehicle cost captures the incremental overhead costs associated with route change proposals that include those overhead expenses that vary in relation to the amount of service provided, such as supervision and to a lesser extent, revenue collection, procurement and human resources. For example, the incremental peak vehicle overhead expenses for CTD ($38,270) represent 23% of the CTD fully allocated bus peak vehicle rate of $168,100. For the purpose of the Annual Route Performance Review, fully allocated peak vehicle expenses are used, which include all overhead costs since the review provides a system-wide comparison. These overhead expenses are required by the Authority, but generally do not vary directly with the service provided. For example, storerooms, facility maintenance, finance and police are not applicable.
Regional Rail Division
The costing of Annual Service Plan items for Regional Rail Division utilizes the cost factors listed in the Annual Route and Station Performance Review Section.
36

Proposed Route 56
Annual Existing Proposed Change
Miles 496,480 518,145 21,665
Hours 58,536 59,357 821
Peak Vehicles 17 17 0
Passengers 3,427,023 3,529,809 102,786
Revenue $3,396,351 $3,498,100 $101,749
Expenses - Fully Allocated $7,924,936 $8,059,731 $134,795
Net Cost - Fully Allocated $4,528,585 $4,561,631 $33,046
Operating Ratio - Fully Allocated 43% 43% 0%
Incremental Expenses $5,879,795 $6,014,590 $134,795
Proposed Route R
Annual Existing Proposed Change
Miles 534,920 534,920 0
Hours 56,563 56,563 0
Peak Vehicles 11 11 0
Passengers 2,453,880 2,479,452 25,572
Revenue $2,431,918 $2,457,125 $25,207
Expenses - Fully Allocated $7,130,546 $7,130,546 $0
Net Cost - Fully Allocated $4,698,628 $4,673,421 -$25,207
Operating Ratio - Fully Allocated 34% 34% 0%
Incremental Expenses $5,704,549 $5,704,549 $0
37

Proposed Route 88
Annual Existing Proposed Change
Miles 290,430 280,940 -9,490
Hours 29,094 28,106 -988
Peak Vehicles 7 7 0
Passengers 737,193 731,874 -5,319
Revenue $730,595 $725,331 -$5,264
Expenses - Fully Allocated $3,957,114 $3,864,212 -$92,902
Net Cost - Fully Allocated $3,226,519 $3,138,881 -$87,638
Operating Ratio - Fully Allocated 18% 19% 0%
Incremental Expenses $3,049,472 $2,956,570 -$92,902
Proposed Route 90
Annual Existing Proposed Change
Miles 102,318 129,002 26,684
Hours 10,569 10,569 0
Peak Vehicles 2 2 0
Passengers 170,170 182,075 11,905
Revenue $229,559 $245,801 $16,242
Expenses - Fully Allocated $859,574 $920,610 $61,036
Net Cost - Fully Allocated $630,015 $674,809 $44,794
Operating Ratio - Fully Allocated 27% 27% 0%
Incremental Expenses $696,174 $757,210 $61,036
38

Proposed Route 92
Annual Existing Proposed Change
Miles 307,154 262,223 -44,931
Hours 17,147 14,533 -2,614
Peak Vehicles 6 4 -2
Passengers 114,750 108,630 -6,120
Revenue $154,913 $146,651 -$8,262
Expenses - Fully Allocated $1,889,288 $1,516,220 -$373,068
Net Cost - Fully Allocated $1,734,376 $1,369,570 -$364,806
Operating Ratio - Fully Allocated 8% 10% 2%
Incremental Expenses $1,564,868 $1,299,940 -$264,928
Proposed Route 114
Annual Existing Proposed Change
Miles 371,903 342,708 -29,195
Hours 29,834 29,409 -425
Peak Vehicles 6 6 0
Passengers 516,600 512,775 -3,825
Revenue $652,300 $635,841 -$16,459
Expenses - Fully Allocated $3,026,905 $2,949,051 -$77,854
Net Cost - Fully Allocated $2,374,605 $2,313,210 -$61,395
Operating Ratio - Fully Allocated 22% 22% 0%
Incremental Expenses $2,426,305 $2,348,451 -$77,854
39

This page left intentionally blank
40

COMMUNITY BENEFIT ANALYSIS COMPUTATIONS
Note: All calculations are annualized using 255 weekdays, 52 Saturdays and 58 Sundays, unless otherwise noted.
41

Proposed Route 56
Benefit Existing Proposed
Service Points Psgrs. Points Psgrs. Points
Weekday Ridership 1.0 12,544 12,544 12,858 12,858
Owl Ridership 1.25 0 0 0 0
Eliminated Transfer 0.6 0 0 0 0
Additional Transfer -0.6 0 0 0 0
Improved Travel Time 0.4 0 0 0 0
Added Travel Time -0.4 0 0 0 0
Decreased Walking Distance 0.4 0 0 0 0
Increased Walking Distance -0.4 0 0 0 0
Total 12,544 12,858
Saturday
Ridership 1.0 5,412 5,412 5,686 5,686
Owl Ridership 1.25 0 0 0 0
Eliminated Transfer 0.6 0 0 0 0
Additional Transfer -0.6 0 0 0 0
Improved Travel Time 0.4 0 0 0 0
Added Travel Time -0.4 0 0 0 0
Decreased Walking Distance 0.4 0 0 0 0
Increased Walking Distance -0.4 0 0 0 0
Total 5,412 5,686
Sunday
Ridership 1.0 4,195 4,195 4,341 4,341
Owl Ridership 1.25 0 0 0 0
Eliminated Transfer 0.6 0 0 0 0
Additional Transfer -0.6 0 0 0 0
Improved Travel Time 0.4 0 0 0 0
Added Travel Time -0.4 0 0 0 0
Decreased Walking Distance 0.4 0 0 0 0
Increased Walking Distance -0.4 0 0 0 0
Total 4,195 4,341
Total Annualized Points 3,723,454 3,826,240
FBS Calculation
Annual Benefit Points 3,723,454 3,826,240
Annual Expenses $5,879,795 $6,014,590
FBS 0.63 0.64
42

Proposed Route R
Benefit Existing Proposed
Service Points Psgrs. Points Psgrs. Points
Weekday Ridership 1.0 8,821 8,821 8,899 8,899
Owl Ridership 1.25 0 0 0 0
Eliminated Transfer 0.6 0 0 0 0
Additional Transfer -0.6 0 0 0 0
Improved Travel Time 0.4 0 0 0 0
Added Travel Time -0.4 0 0 0 0
Decreased Walking Distance 0.4 0 0 0 0
Increased Walking Distance -0.4 0 0 0 0
Total 8,821 8,899
Saturday
Ridership 1.0 6,710 6,710 6,778 6,778
Owl Ridership 1.25 0 0 0 0
Eliminated Transfer 0.6 0 0 0 0
Additional Transfer -0.6 0 0 0 0
Improved Travel Time 0.4 0 0 0 0
Added Travel Time -0.4 0 0 0 0
Decreased Walking Distance 0.4 0 0 0 0
Increased Walking Distance -0.4 0 0 0 0
Total 6,710 6,778
Sunday
Ridership 1.0 5,523 5,523 5,560 5,560
Owl Ridership 1.25 0 0 0 0
Eliminated Transfer 0.6 0 0 0 0
Additional Transfer -0.6 0 0 0 0
Improved Travel Time 0.4 0 0 0 0
Added Travel Time -0.4 0 0 0 0
Decreased Walking Distance 0.4 0 0 0 0
Increased Walking Distance -0.4 0 0 0 0
Total 5,523 5,560
Total Annualized Points 2,918,609 2,944,181
FBS Calculation
Annual Benefit Points 2,918,609 2,944,181
Annual Expenses $5,704,549 $5,704,549
FBS 0.51 0.52
43

Proposed Route 90
Benefit Existing Proposed
Service Points Psgrs. Points Psgrs. Points
Weekday Ridership 1.0 595 595 634 634
Owl Ridership 1.25 0 0 0 0
Eliminated Transfer 0.6 0 0 0 0
Additional Transfer -0.6 0 0 0 0
Improved Travel Time 0.4 0 0 123 49
Added Travel Time -0.4 0 0 122 (49)
Decreased Walking Distance 0.4 0 0 0 0
Increased Walking Distance -0.4 0 0 0 0
Total 595 634
Saturday
Ridership 1.0 355 355 393 393
Owl Ridership 1.25 0 0 0 0
Eliminated Transfer 0.6 0 0 0 0
Additional Transfer -0.6 0 0 0 0
Improved Travel Time 0.4 0 0 129 52
Added Travel Time -0.4 0 0 128 (51)
Decreased Walking Distance 0.4 0 0 0 0
Increased Walking Distance -0.4 0 0 0 0
Total 355 393
Sunday
Ridership 1.0 0 0 0 0
Owl Ridership 1.25 0 0 0 0
Eliminated Transfer 0.6 0 0 0 0
Additional Transfer -0.6 0 0 0 0
Improved Travel Time 0.4 0 0 0 0
Added Travel Time -0.4 0 0 0 0
Decreased Walking Distance 0.4 0 0 0 0
Increased Walking Distance -0.4 0 0 0 0
Total 0 0
Total Annualized Points 170,200 182,229
FBS Calculation
Annual Benefit Points 170,200 182,229
Annual Expenses $859,574 $920,610
FBS 0.20 0.20
44

Proposed Route 92
Benefit Existing Proposed
Service Points Psgrs. Points Psgrs. Points
Weekday Ridership 1.0 398 398 374 374
Owl Ridership 1.25 0 0 0 0
Eliminated Transfer 0.6 0 0 0 0
Additional Transfer -0.6 0 0 0 0
Improved Travel Time 0.4 0 0 113 45
Added Travel Time -0.4 0 0 0 0
Decreased Walking Distance 0.4 0 0 0 0
Increased Walking Distance -0.4 0 0 0 0
Total 398 419
Saturday
Ridership 1.0 255 255 255 255
Owl Ridership 1.25 0 0 0 0
Eliminated Transfer 0.6 0 0 0 0
Additional Transfer -0.6 0 0 0 0
Improved Travel Time 0.4 0 0 77 31
Added Travel Time -0.4 0 0 0 0
Decreased Walking Distance 0.4 0 0 0 0
Increased Walking Distance -0.4 0 0 0 0
Total 255 286
Sunday
Ridership 1.0 0 0 0 0
Owl Ridership 1.25 0 0 0 0
Eliminated Transfer 0.6 0 0 0 0
Additional Transfer -0.6 0 0 0 0
Improved Travel Time 0.4 0 0 0 0
Added Travel Time -0.4 0 0 0 0
Decreased Walking Distance 0.4 0 0 0 0
Increased Walking Distance -0.4 0 0 0 0
Total 0 0
Total Annualized Points 114,750 121,758
FBS Calculation
Annual Benefit Points 114,750 121,758
Annual Expenses $ 1,889,288 $ 1,516,220
FBS 0.06 0.08
45

Proposed Route 114
Benefit Existing Proposed
Service Points Psgrs. Points Psgrs. Points
Weekday Ridership 1.0 1,800 1,800 1,815 1,815
Owl Ridership 1.25 0 0 0 0
Eliminated Transfer 0.6 0 0 0 0
Additional Transfer -0.6 0 0 15 (9)
Improved Travel Time 0.4 0 0 0 0
Added Travel Time -0.4 0 0 15 (6)
Decreased Walking Distance 0.4 0 0 0 0
Increased Walking Distance -0.4 0 0 0 0
Total 1,800 1,800
Saturday
Ridership 1.0 976 976 976 976
Owl Ridership 1.25 0 0 0 0
Eliminated Transfer 0.6 0 0 0 0
Additional Transfer -0.6 0 0 0 0
Improved Travel Time 0.4 0 0 0 0
Added Travel Time -0.4 0 0 0 0
Decreased Walking Distance 0.4 0 0 0 0
Increased Walking Distance -0.4 0 0 0 0
Total 976 976
Sunday
Ridership 1.0 849 849 849 849
Owl Ridership 1.25 0 0 0 0
Eliminated Transfer 0.6 0 0 0 0
Additional Transfer -0.6 0 0 0 0
Improved Travel Time 0.4 0 0 0 0
Added Travel Time -0.4 0 0 0 0
Decreased Walking Distance 0.4 0 0 0 0
Increased Walking Distance -0.4 0 0 0 0
Total 849 849
Total Annualized Points 559,009 558,994
FBS Calculation
Annual Benefit Points 559,009 558,994
Annual Expenses $3,026,905 $2,949,051
FBS 0.18 0.19
46

This page left intentionally blank
47

ANNUAL ROUTE AND STATION PERFORMANCE REVIEW
DEFINITIONS AND CHARTS
48

City and Suburban Transit Divisions and Regional Rail Division
Definitions Fully Allocated Cost = (vehicle hours x unit cost) + (vehicle miles x unit cost) + (peak vehicles x fully allocated unit cost) Incremental Cost = (vehicle hours x unit cost) + (vehicle miles x unit cost) + (peak vehicles x incremental unit cost) Revenue = passenger revenue + senior citizen subsidy Passengers = number of total boardings, i.e., "unlinked" passengers
FY 2013 Annual Service Plan Operating Costs and Average Fares
UNIT COSTS Peak Veh. Peak Veh. Average
DIVISION Hours Miles Incr. Cost Full Cost Fare
CITY TRANSIT Bus $53.88 $4.18 $38,270 $168,100 $0.99 Trolley $53.88 $7.07 $46,720 $295,300 $0.99 Trackless $53.88 $2.51 $33,860 $191,000 $0.99 High Speed $19.35 $2.56 $85,950 $562,400 $0.99
SUBURBAN TRANSIT – VICTORY Bus $56.27 $2.01 $26,300 $100,100 $1.24 Trolley $56.27 $3.10 $54,860 $263,800 $1.24 NHSL $56.27 $3.45 $48,770 $368,900 $1.24
SUBURBAN TRANSIT – FRONTIER Bus $47.38 $1.91 $27,630 $81,700 $1.35
REGIONAL RAIL* $110.95 $2.97 $60,410 $425,400 $3.82
* AMTRAK Access = $8.18 per train mile over AMTRAK-owned trackage
Based on the Route Operating Ratio Report Issued December, 2011
49

Contract Operations
Fiscal Year 2013 Annual Service Plan Operating Costs and Average Fares
Routes under contract with Trenton-Philadelphia Coach Company cost an average of $106.48 per vehicle hour to operate (310, LUCY). The other routes under contract cost an average of $59.95 per vehicle hour (204, 205, 306 and 314).
Route 310 and LUCY utilizes the average City Transit fare of $0.99, while Routes 204, 205, 306 and 314 utilize the average Suburban Transit (Frontier) fare of $1.35.
50

CITY TRANSIT Annual Route Performance Review
SEPTA FY 2013 Annual Service Plan
Vehicle Vehicle Peak Weekday Annual Passenger Fully
Allocated Operating Route Note Hours Miles Vehicles Passengers Passengers Revenue Expenses Ratio
78 1,392 17,560 0 140 29,260 $ 111,188 $148,346 75%
60 52,391 377,860 13 12,811 3,875,328 $ 3,840,644 $6,586,091 58%
54 42,191 290,880 10 9,605 2,905,513 $ 2,879,509 $5,168,964 56%
47M 10,167 66,050 4 2,581 780,753 $ 773,765 $1,496,028 52%
79 32,240 195,840 7 6,402 1,936,605 $ 1,919,272 $3,731,624 51%
11 54,862 493,544 16 18,617 5,659,568 $ 5,608,915 $11,170,109 50%
MFL 476,386 9,622,990 144 189,610 56,994,610 $ 56,484,672 $114,838,524 49%
10 44,216 391,000 17 16,501 5,016,304 $ 4,971,408 $10,166,850 49%
34 59,786 472,664 18 18,889 5,742,256 $ 5,690,863 $11,878,395 48%
33 78,228 541,800 18 15,107 4,569,868 $ 4,528,968 $9,503,277 48%
29 30,739 225,280 6 5,557 1,680,993 $ 1,665,948 $3,605,571 46%
3 54,852 442,790 13 10,523 3,183,208 $ 3,154,718 $6,989,794 45% 6 39,125 275,750 10 7,333 2,218,233 $ 2,198,380 $4,940,564 44%
BSL 373,894 6,917,042 105 127,470 37,680,470 $ 37,343,230 $83,994,476 44% 59 24,637 196,222 7 4,591 1,388,778 $ 1,376,348 $3,156,936 44%
46 31,826 204,520 8 5,676 1,716,990 $ 1,701,623 $3,913,652 43%
13 59,130 549,434 19 18,220 5,538,880 $ 5,489,307 $12,681,136 43%
56 58,536 496,480 17 11,329 3,427,023 $ 3,396,351 $7,924,936 43%
8 12,710 112,840 4 3,080 785,400 $ 778,371 $1,828,442 43%
52 94,035 760,710 23 16,930 5,121,325 $ 5,075,489 $12,109,617 42%
26 65,294 527,640 21 12,487 3,777,318 $ 3,743,511 $9,251,593 40%
36 62,489 627,819 21 18,543 5,637,072 $ 5,586,620 $14,006,860 40%
17 78,859 540,000 24 13,675 4,136,688 $ 4,099,665 $10,538,383 39%
75 22,259 174,214 7 3,795 1,147,988 $ 1,137,714 $2,973,594 38%
66 64,073 578,350 16 10,095 3,053,738 $ 3,026,407 $7,959,933 38%
23 140,906 1,222,110 33 22,946 6,941,165 $ 6,879,042 $18,242,826 38%
47 114,780 990,020 29 18,925 5,724,812 $ 5,673,575 $15,193,578 37%
18 2 114,362 1,138,150 30 18,593 5,624,383 $ 5,574,045 $15,607,731 36%
65 56,693 604,210 13 9,031 2,731,878 $ 2,707,428 $7,593,123 36%
42 83,666 610,265 18 11,911 3,603,078 $ 3,570,830 $10,082,191 35%
70 56,585 602,600 14 9,142 2,765,455 $ 2,740,704 $7,918,676 35% R 56,563 534,920 11 8,112 2,453,880 $ 2,431,918 $7,130,546 34%
48 62,290 421,520 15 8,628 2,609,970 $ 2,586,611 $7,637,939 34% 64 40,954 366,050 8 5,731 1,733,628 $ 1,718,112 $5,080,043 34%
C 109,403 969,810 26 15,935 4,820,338 $ 4,777,196 $14,315,161 33%
71 2 3,349 35,110 1 307 78,285 $ 77,584 $243,283 32%
2 49,173 375,600 12 6,261 1,893,953 $ 1,877,002 $6,235,171 30%
58 1 72,857 792,430 16 9,785 2,959,963 $ 2,933,471 $9,924,319 30%
43 30,973 257,650 7 3,838 1,160,995 $ 1,150,604 $3,921,477 29%
31 34,290 290,320 8 4,308 1,303,170 $ 1,291,507 $4,404,725 29%
73 24,779 192,200 4 2,711 820,078 $ 812,738 $2,810,103 29%
53 24,439 192,820 4 2,650 801,625 $ 794,450 $2,794,401 28%
51
CITY TRANSIT Annual Route Performance Review
SEPTA FY 2013 Annual Service Plan
Vehicle Vehicle Peak Weekday Annual Passenger Fully
Allocated Operating Route Note Hours Miles Vehicles Passengers Passengers Revenue Expenses Ratio
15 62,186 549,563 14 10,570 3,213,280 $3,184,521 $11,370,198 28%
G 94,355 1,011,546 25 12,151 3,675,678 $3,642,781 $13,510,539 27%
K 57,574 548,840 17 7,387 2,234,568 $2,214,569 $8,251,768 27%
30 16,230 139,700 4 1,889 571,423 $ 566,309 $2,130,268 27%
XH 37,247 358,110 10 4,575 1,383,938 $ 1,371,552 $5,183,335 26%
40 51,954 476,000 10 5,672 1,715,780 $ 1,700,424 $6,468,053 26%
5 35,220 307,670 10 4,202 1,271,105 $ 1,259,729 $4,863,461 26%
57 90,726 880,500 25 11,011 3,330,828 $ 3,301,017 $12,767,778 26%
39 24,101 188,910 5 2,495 754,738 $ 747,983 $2,927,936 26%
1 2 32,070 425,580 11 3,866 1,101,810 $ 1,091,949 $4,294,735 25%
7 48,935 431,430 11 5,300 1,603,250 $ 1,588,901 $6,287,370 25%
20 1 66,152 770,145 15 7,512 2,272,380 $ 2,252,042 $9,157,418 25%
H 47,406 463,160 14 5,592 1,691,580 $ 1,676,440 $6,841,775 25%
12 26,792 201,120 5 2,548 770,770 $ 763,872 $3,123,946 24%
22 45,192 544,090 9 4,994 1,510,685 $ 1,497,164 $6,219,948 24% 14 1,2 110,253 1,284,980 27 11,943 3,612,758 $ 3,580,424 $15,110,226 24%
62 2,431 37,026 2 548 139,740 $ 138,489 $621,803 22%
61 46,197 422,554 11 4,463 1,350,058 $ 1,337,975 $6,102,773 22%
L 2 69,692 695,650 15 6,549 1,981,073 $ 1,963,342 $9,068,419 22%
50 1 23,242 267,215 4 1,989 661,343 $ 655,424 $3,040,569 22%
Minimum Acceptable Operating Ratio 22% (60% of City Transit Average of 36%)
19 1 16,294 181,750 5 1,770 535,425 $ 530,633 $2,477,399 21%
28 1 22,007 255,400 5 2,206 667,315 $ 661,343 $3,092,804 21% 9 1 45,747 493,330 11 4,536 1,372,140 $ 1,359,859 $6,374,114 21%
32 49,625 495,060 14 5,025 1,520,063 $ 1,506,458 $7,094,570 21%
25 38,003 391,530 13 4,018 1,215,445 $ 1,204,567 $5,867,935 21% 84 1 36,994 437,400 8 3,515 1,063,288 $ 1,053,772 $5,164,605 20%
J 31,013 282,890 9 2,865 866,663 $ 858,906 $4,365,203 20% 67 1,2 48,433 538,790 13 4,550 1,376,375 $ 1,364,056 $7,015,904 19% 37 1,2 46,633 647,370 10 4,271 1,291,978 $ 1,280,415 $6,735,488 19%
44 1 42,657 521,210 13 4,223 1,277,458 $ 1,266,025 $6,660,217 19% 24 1 28,375 279,010 8 2,557 773,493 $ 766,570 $4,038,764 19% 55 1 61,426 716,630 13 5,247 1,587,218 $ 1,573,012 $8,457884 19% 88 1 29,094 290,430 7 2,437 737,193 $ 730,595 $3,957114 18%
Minimum Acceptable Operating Ratio 18% For Routes with Suburban Characteristics 38 37,869 375,940 9 2,858 864,545 $ 856,807 $5,123,191 17%
89 25,865 278,340 6 1,799 544,198 $ 539,327 $3,564,544 15%
27 1 61,185 865,460 16 4,558 1,378,795 $ 1,366,455 $9,600,432 14%
77 1 14,772 152,080 3 858 259,545 $ 257,222 $1,935,314 13%
68 1 16,692 301,920 3 1,011 305,828 $ 303,091 $2,664,477 11%
35 1 5,497 43,830 1 210 63,525 $ 62,956 $647,328 10%
Source: FY2011 Route Operating Ratio Report Notes: 1 Routes with Suburban Characteristics 2 Routes with external operating subsidy or Job Access Reverse Commute grant funding
52

SUBURBAN TRANSIT
Annual Route Performance Review SEPTA FY 2013 Annual Service Plan
Vehicle Vehicle Peak Weekday Annual Passenger Fully
Allocated Operating Route Note Hours Miles Vehicles Passengers Passengers Revenue Expenses Ratio
113 1 62,218 668,872 14 6,850 1,965,950 $2,433,846 $6,243,274 39%
108 1,3 55,964 604,295 11 5,920 1,686,940 $2,088,432 $5,793,741 36%
91 243 3,962 - - 4,680 $6,313 $19,080 33%
106 6,512 58,254 3 750 206,250 $255,338 $783,829 33%
98 18,720 255,906 5 1,350 406,350 $548,166 $1,784,255 31%
105 1 24,636 281,866 4 1,975 566,830 $701,736 $2,302,344 30%
96 1 27,593 372,514 5 1,630 490,630 $661,860 $2,221,484 30%
NHSL 43,389 886,566 17 9,275 2,704,600 $3,348,295 $11,767,019 28%
97 12,545 155,294 1 680 204,680 $276,113 $972,715 28%
102 20,388 180,712 8 2,900 870,000 $1,077,060 $3,817,659 28%
112 19,268 235,062 4 1,620 445,500 $551,529 $1,957,058 28%
116 3,024 31,298 1 285 72,680 $89,978 $333,146 27%
90 10,569 102,318 2 595 170,170 $229,559 $859,574 27%
201 3,406 38,497 1 244 62,220 $83,935 $316,606 27%
104 42,027 655,741 9 3,400 975,800 $1,208,040 $4,583,782 26%
131 8,087 78,851 3 507 145,000 $195,605 $778,878 25%
103 12,439 122,463 4 1,010 271,280 $335,845 $1,346,492 25%
110 1 25,866 314,912 7 1,950 556,650 $689,133 $2,781,681 25%
118 8,940 127,042 2 665 190,860 $236,285 $958,625 25%
101 23,934 289,102 12 3,500 1,050,000 $1,299,900 $5,408,293 24%
93 20,037 345,869 4 1,112 334,710 $451,524 $1,936,743 23%
111 1 23,965 356,632 6 1,650 473,550 $586,255 $2,633,679 22%
94 1 13,564 208,608 3 626 188,430 $254,192 $1,180,902 22%
120 8,510 141,641 1 520 149,240 $184,759 $863,637 21%
123 18,655 354,546 4 1,300 373,100 $461,898 $2,162,752 21%
124 1,2 34,478 679,683 6 1,560 449,240 $727,320 $3,406,658 21%
114 29,834 371,903 6 1,800 516,600 $639,551 $3,026,905 21%
129 1 20,380 396,452 4 850 243,100 $327,942 $1,610,516 20%
99 28,668 411,942 6 1,317 396,420 $534,771 $2,635,315 20%
115 1 22,593 291,351 4 1,034 284,350 $352,025 $1,766,512 20%
117 36,208 494,660 7 2,015 578,310 $715,948 $3,732,391 19%
125 1,2 39,339 732,675 8 1,750 502,250 $823,690 $4,471,745 18%
107 17,272 200,687 6 980 269,500 $333,641 $1,975,880 17%
132 1 13,083 201,035 2 430 129,430 $174,601 $1,082,402 16%
127 1 12,125 256,831 3 490 140,140 $189,049 $1,180,709 16%
206 1 5,342 82,258 2 227 57,890 $78,094 $496,841 16%
304 4,538 87,318 1 187 53,480 $72,145 $463,488 16%
95 1 11,687 131,136 3 360 102,960 $138,893 $956,919 15%
53

SUBURBAN TRANSIT Annual Route Performance Review
SEPTA FY 2013 Annual Service Plan
Vehicle Vehicle Peak Weekday Annual Passenger Fully
Allocated Operating Route Note Hours Miles Vehicles Passengers Passengers Revenue Expenses Ratio
Minimum Acceptable Operating Ratio 15% (60% of Suburban Transit Average of 25%)
130 1 16,296 286,533 3 495 149,000 $201,001 $1,435,625 14%
128 1 10,200 205,365 3 360 102,960 $138,893 $1,014,825 14%
119 19,266 322,323 3 720 206,640 $255,820 $2,032,240 13%
139 12,681 232,393 3 405 115,830 $156,255 $1,289,812 12%
150 ** 2 4,215 91,954 1 60 17,160 $51,480 $457,048 11%
92 12,473 246,224 4 370 105,820 $142,751 $1,388,061 10%
134 1 4,828 45,671 2 105 31,610 $42,642 $441,510 10% Source : FY2011 Route Operating Ratio Report Notes:
1 Routes that have external operating subsidies or Job Access Reverse Commute funding
2 Revenue is calculated with a higher average fare to reflect routes with three or more fare zone 3 Route 108 includes City Transit operating data (30% or entire route)
CONTRACT OPERATIONS Annual Route Performance Review
SEPTA FY 2012 Annual Service Plan
Revenue Revenue Fully
Vehicle Vehicle Peak Weekday Annual Passenger Allocated Operating Route Hours Miles Vehicles Passengers Passengers Revenue Expenses Ratio
310 6,056 111,330 3 544 152,240 $205,524 $915,700 22%
316 12,798 85,424 6 2,073 528,604 $185,011 $1,091,780 17%
314 3,433 64,700 2 66 16,705 $22,552 $187,890 12%
204 9,158 139,540 3 158 45,980 $62,073 $518,430 12%
205 3,341 41,565 3 60 14,963 $20,200 $224,650 9%
306 3,315 64,470 3 40 10,302 $13,908 $222,900 6%
Source : FY2011 Route Operating Ratio Report
Notes: Route 204, 205, 306 are fully funded through CMS/CMAQ grants as a function of FHWA US202 Reconstruction.
Route 316 (LUCY) has an external operating subsidy provided by the University City District
54

REGIONAL RAIL DIVISION Annual Route Performance Review
SEPTA FY 2012 Annual Service Plan
Vehicle Vehicle Peak Weekday Annual Passenger Fully
Allocated Operating Line Note Hours Miles Cars Passengers Passengers Revenue Expenses Ratio
Media / Elwyn 47,150 1,026,845 22 10,599 2,916,840
$11,375,676 $ 16,215,147 70%
Manayunk /Norristown 42,980
1,187,068 22 10,632 3,060,900
$10,804,977
$17,976,536 60%
Warminster 47,146
1,194,183 20 9,130 2,662,200
$10,595,556
$18,023,642 59%
Paoli / Thorndale 1 115,483
3,116,545 64 22,852 6,508,320
$27,074,611
$50,515,254 54%
West Trenton 77,239
2,273,216 36 12,826 3,565,750
$15,047,465
$29,805,231 50%
Marcus Hook / Wilmington 55,976
1,749,993 30 9,322 2,607,330
$10,481,467
$22,770,937 46%
Lansdale / Doylestown 110,461
2,939,580 40 14,980 4,269,160
$17,588,939
$38,655,381 46%
Airport
1 36,320
788,126 9 5,560 1,908,070
$4,716,749
$10,436,259 45%
Fox Chase 25,758
548,390 14 5,141 1,385,980
$4,278,520 $9,849,407 43%
Cynwyd 1,613 36,358 2 601 153,200
$494,836 $1,163,838 43%
Chestnut Hill East 31,754
688,370 11 5,188 1,480,220
$4,633,089
$11,109,067 42%
Trenton 79,865
2,755,116 34 11,782 3,383,710
$13,839,374
$35,894,495 39%
Chestnut Hill West 29,618
633,007 14 5,252 1,484,120
$4,418,225
$11,617,219 38%
Minimum Acceptable Operating Ratio 27% (60% of Regional Rail Average of 45%) Source : FY2011 Route Operating Ratio Report Notes:
1 Lines have Job Access Reverse Commute grant reimbursement
55
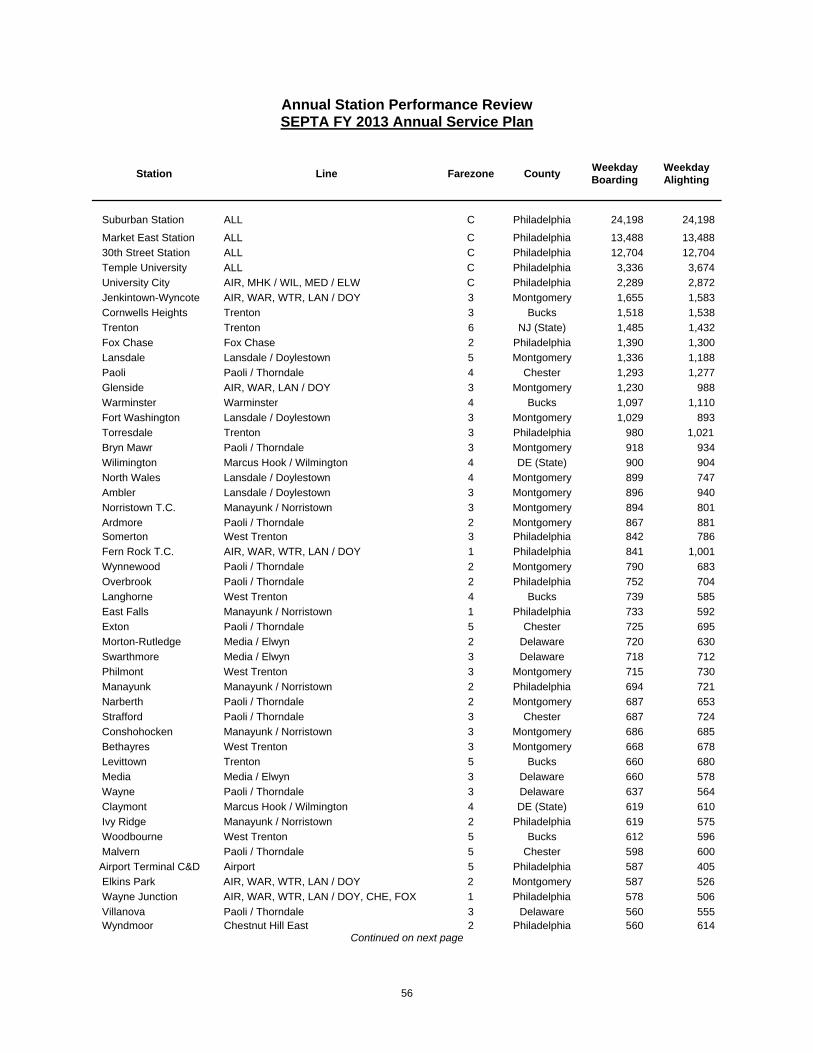
Annual Station Performance Review SEPTA FY 2013 Annual Service Plan
Station Line Farezone County Weekday Boarding
Weekday Alighting
Suburban Station ALL C Philadelphia 24,198 24,198
Market East Station ALL C Philadelphia 13,488 13,488
30th Street Station ALL C Philadelphia 12,704 12,704
Temple University ALL C Philadelphia 3,336 3,674
University City AIR, MHK / WIL, MED / ELW C Philadelphia 2,289 2,872
Jenkintown-Wyncote AIR, WAR, WTR, LAN / DOY 3 Montgomery 1,655 1,583
Cornwells Heights Trenton 3 Bucks 1,518 1,538
Trenton Trenton 6 NJ (State) 1,485 1,432
Fox Chase Fox Chase 2 Philadelphia 1,390 1,300
Lansdale Lansdale / Doylestown 5 Montgomery 1,336 1,188
Paoli Paoli / Thorndale 4 Chester 1,293 1,277
Glenside AIR, WAR, LAN / DOY 3 Montgomery 1,230 988
Warminster Warminster 4 Bucks 1,097 1,110
Fort Washington Lansdale / Doylestown 3 Montgomery 1,029 893
Torresdale Trenton 3 Philadelphia 980 1,021
Bryn Mawr Paoli / Thorndale 3 Montgomery 918 934
Wilimington Marcus Hook / Wilmington 4 DE (State) 900 904
North Wales Lansdale / Doylestown 4 Montgomery 899 747
Ambler Lansdale / Doylestown 3 Montgomery 896 940
Norristown T.C. Manayunk / Norristown 3 Montgomery 894 801
Ardmore Paoli / Thorndale 2 Montgomery 867 881 Somerton West Trenton 3 Philadelphia 842 786
Fern Rock T.C. AIR, WAR, WTR, LAN / DOY 1 Philadelphia 841 1,001
Wynnewood Paoli / Thorndale 2 Montgomery 790 683
Overbrook Paoli / Thorndale 2 Philadelphia 752 704
Langhorne West Trenton 4 Bucks 739 585
East Falls Manayunk / Norristown 1 Philadelphia 733 592
Exton Paoli / Thorndale 5 Chester 725 695
Morton-Rutledge Media / Elwyn 2 Delaware 720 630
Swarthmore Media / Elwyn 3 Delaware 718 712
Philmont West Trenton 3 Montgomery 715 730
Manayunk Manayunk / Norristown 2 Philadelphia 694 721
Narberth Paoli / Thorndale 2 Montgomery 687 653
Strafford Paoli / Thorndale 3 Chester 687 724
Conshohocken Manayunk / Norristown 3 Montgomery 686 685
Bethayres West Trenton 3 Montgomery 668 678
Levittown Trenton 5 Bucks 660 680
Media Media / Elwyn 3 Delaware 660 578
Wayne Paoli / Thorndale 3 Delaware 637 564
Claymont Marcus Hook / Wilmington 4 DE (State) 619 610
Ivy Ridge Manayunk / Norristown 2 Philadelphia 619 575
Woodbourne West Trenton 5 Bucks 612 596
Malvern Paoli / Thorndale 5 Chester 598 600
Airport Terminal C&D Airport 5 Philadelphia 587 405
Elkins Park AIR, WAR, WTR, LAN / DOY 2 Montgomery 587 526
Wayne Junction AIR, WAR, WTR, LAN / DOY, CHE, FOX 1 Philadelphia 578 506
Villanova Paoli / Thorndale 3 Delaware 560 555 Wyndmoor Chestnut Hill East 2 Philadelphia 560 614
Continued on next page
56

Annual Station Performance Review SEPTA FY 2013 Annual Service Plan
Station Line Farezone County Weekday Boarding
Weekday Alighting
Holmesburg Junction Trenton 2 Philadelphia 547 476
Radnor Paoli / Thorndale 3 Delaware 541 500
Melrose Park AIR, WAR, WTR, LAN / DOY 2 Montgomery 505 388
Pennbrook Lansdale / Doylestown 5 Montgomery 503 544
Airport Terminal B Airport 5 Philadelphia 495 544
Stenton Chestnut Hill East 2 Philadelphia 492 443
Thorndale Paoli / Thorndale 5 Chester 485 482
Airport Terminal E & F Airport 5 Philadelphia 482 346
Secane Media / Elwyn 2 Delaware 481 431
Wissahickon T.C. Manayunk / Norristown 2 Philadelphia 476 512
Marcus Hook Marcus Hook / Wilmington 4 Delaware 472 538
Downingtown Paoli / Thorndale 5 Chester 470 386
Hatboro Warminster 4 Montgomery 465 422
Haverford Paoli / Thorndale 2 Montgomery 453 413
Airport Terminal A Airport 5 Philadelphia 449 550
Miquon Manayunk / Norristown 2 Montgomery 449 415
Lansdowne Media / Elwyn 2 Delaware 434 446
Queen Lane Chestnut Hill West 1 Philadelphia 433 408
Willow Grove Warminster 3 Montgomery 429 435
Chestnut Hill West Chestnut Hill West 2 Philadelphia 421 425
Trevose West Trenton 4 Bucks 412 321
Forest Hills West Trenton 3 Philadelphia 401 364
Doylestown Lansdale / Doylestown 5 Bucks 388 377
Primos Media / Elwyn 2 Delaware 386 307
Elm St., Norristown Manayunk / Norristown 3 Montgomery 383 348
Spring Mill Manayunk / Norristown 3 Montgomery 379 393
Carpenter Chestnut Hill West 2 Philadelphia 371 394
Cheltenham Fox Chase 2 Philadelphia 368 348
Yardley West Trenton 5 Bucks 353 355
Upsal Chestnut Hill West 2 Philadelphia 350 375
Bristol Trenton 4 Bucks 347 368
Chelten Avenue Chestnut Hill West 1 Philadelphia 342 379
Eastwick Airport 2 Philadelphia 341 341
Berwyn Paoli / Thorndale 4 Chester 338 311
Rosemont Paoli / Thorndale 3 Montgomery 338 336
Newark Marcus Hook / Wilmington 5 DE (State) 337 324
Mount Airy Chestnut Hill East 2 Philadelphia 336 284
Croydon Trenton 4 Bucks 331 338
Clifton-Aldan Media / Elwyn 2 Delaware 330 336
Ryers Fox Chase 2 Philadelphia 328 348
Whitford Paoli / Thorndale 5 Chester 323 287
Chester Marcus Hook / Wilmington 3 Delaware 315 311
Allen Lane Chestnut Hill West 2 Philadelphia 307 314
Colmar Lansdale / Doylestown 5 Montgomery 302 290
Churchmans Crossing Marcus Hook / Wilmington 5 DE (State) 291 316
Merion Paoli / Thorndale 2 Montgomery 291 215 Continued on next page
57

Annual Station Performance Review SEPTA FY 2013 Annual Service Plan
Station Line Farezone County Weekday Boarding
Weekday Alighting
Neshaminy Falls West Trenton 4 Bucks 286
256
Wallingford Media / Elwyn 3 Delaware 282 283
St. Davids Paoli / Thorndale 3 Delaware 270 268
Chestnut Hill East Chestnut Hill East 2 Philadelphia 261 288
Oreland Lansdale / Doylestown 3 Montgomery 260 244
Norwood Marcus Hook / Wilmington 2 Delaware 254 297
West Trenton West Trenton 6 NJ (State) 250 242
Sedgwick Chestnut Hill East 2 Philadelphia 245 302
Main St. Norristown Manayunk / Norristown 3 Montgomery 243 225
Ridley Park Marcus Hook / Wilmington 3 Delaware 243 228
Gladstone Media / Elwyn 2 Delaware 228 210
Gwynedd Valley Lansdale / Doylestown 4 Montgomery 227 216
Prospect Park-Moore Marcus Hook / Wilmington 2 Delaware 226 218
North Hills Lansdale / Doylestown 3 Montgomery 223 201
Roslyn Warminster 3 Montgomery 222 298
St. Martins Chestnut Hill West 2 Philadelphia 221 184
Lawndale Fox Chase 2 Philadelphia 218 218
North Philadelphia CHE, TTC C Philadelphia 211 217
Daylesford Paoli / Thorndale 4 Chester 207 196
Tacony Trenton 2 Philadelphia 206 221
Penllyn Lansdale / Doylestown 4 Montgomery 199 168
Washington Lane Chestnut Hill East 2 Philadelphia 194 202
Glenolden Marcus Hook / Wilmington 2 Delaware 191 201
Olney Fox Chase 1 Philadelphia 184 230
Noble West Trenton 3 Montgomery 182 202
Folcroft Marcus Hook / Wilmington 2 Delaware 173 159
Bridesburg Trenton 2 Philadelphia 172 188
Tulpehocken Chestnut Hill West 2 Philadelphia 158 155
Ardsley Warminster 3 Montgomery 151 150
Moylan-Rose Valley Media / Elwyn 3 Delaware 147 257
Chalfont Lansdale / Doylestown 5 Bucks 139 134
Cynwyd Cynwyd 2 Montgomery 136 128
North Broad WAR, LAN / DOY, NOR C Philadelphia 135 123
Meadowbrook West Trenton 3 Montgomery 132 124
Sharon Hill Marcus Hook / Wilmington 2 Delaware 126 136
Gravers Chestnut Hill East 2 Philadelphia 123 138
Curtis Park Marcus Hook / Wilmington 2 Delaware 119 98
Fernwood-Yeadon Media / Elwyn 2 Delaware 110 109
Fortuna Lansdale / Doylestown 5 Montgomery 104 113
Rydal West Trenton 3 Montgomery 104 96
Darby Marcus Hook / Wilmington 2 Delaware 101 104
Bala Cynwyd 2 Montgomery 89 90
Germantown Chestnut Hill East 1 Philadelphia 87 128
Highland Avenue Marcus Hook / Wilmington 4 Delaware 87 98
Wynnefield Avenue Cynwyd 1 Philadelphia 83 81
Allegheny Manayunk / Norristown 1 Philadelphia 74 106
Crestmont Warminster 1 Montgomery 67 84 Continued on next page
58

Annual Station Performance Review SEPTA FY 2013 Annual Service Plan
Station Line Farezone County Weekday Boarding
Weekday Alighting
At or Below Minimum Acceptable Standard of 75 Weekday Boardings and Alightings
Highland Chestnut Hill West 3 Philadelphia 67 62
Crum Lynne Marcus Hook / Wilmington 5 Delaware 66 75
Del Val College Lansdale / Doylestown 5 Bucks 64 59
Wister Chestnut Hill East 3 Philadelphia 61 75
49th Street Media / Elwyn 2 Philadelphia 60 53
Eddystone Marcus Hook / Wilmington 1 Delaware 60 59
New Britain Lansdale / Doylestown 5 Bucks 52 56
Link Belt Lansdale / Doylestown 4 Montgomery 52 36
Eddington Trenton 2 Bucks 43 54
Angora Media / Elwyn 1 Philadelphia 34 33
Source: SEPTA 2011 Regional Rail Ridership Census Regional Rail Line Codes: AIR Airport CHE Chestnut Hill East CHW Chestnut Hill West CYN Cynwyd FOX Fox Chase LAN / DOY Lansdale / Doylestown MED / ELW Media / Elwyn MHK / WIL Marcus Hook / Wilmington NOR Manayunk / Norristown PAO / THO Paoli / Thorndale TTC Trenton WAR Warminster WTR West Trenton
59

REGIONAL RAIL DIVISION Annual Station Performance Review SEPTA FY 2013 Annual Service Plan
Low Station Performance Overview
Highland Station
This station is located on the Chestnut Hill West Line 0.5 miles from Chestnut
Hill West and 0.5 miles from St. Martins Station. A 61-space parking lot provides off street parking. The station area is not directly served by surface transit directly, but bus Route
23 operates nearby on Germantown Pike and connects with the Broad Street Line at Erie Avenue Station.
Current ridership totals 43 boardings and 50 alightings. No recent investment has been made at Highland. The station’s close proximity to Chestnut Hill West and St. Martins, both of which
offer heated waiting rooms, ticket offices and parking, contributes to its lesser utilization. The station continues to serve as an overflow facility when parking demand increases at Chestnut Hill West.
Highland Station falls below the economic threshold of 75 weekday boardings or 75 alightings. However, the available parking capacity makes this station a convenient alternative to Chestnut Hill West or Chestnut Hill East Stations when parking demand increases.
Crum Lynne Station
This station is located on the Marcus Hook-Wilmington Line 1.1 miles from
Eddystone and 0.8 miles from Ridley Park. A small 25-space parking lot has a 56% utilization rate The station is also served by Surface Route 114, which operates to both Darby
and 69th Street Transportation Centers where frequent connections to Center City exist
Current ridership totals 65 boardings and 75 alightings Total activity on Saturdays is 44 trips and 32 on Sundays
Due to the low weekend utilization, service adjustments to tailor service levels to utilization are under review.
60
Low Station Performance Overview
Delaware Valley College Station
This station is located on the Lansdale / Doylestown Line 1.5 miles from
Doylestown and 1.3 miles from New Britain. Del Val College Station has no off-street parking, but is located on the campus of
Delaware Valley College. The station area is not directly served by surface transit with Route 55 being the
closest route on Easton Road. Route 55 connects with the Broad Street Line at Olney Transportation Center.
Current ridership totals 64 boardings and 45 alightings. Investment has been made at Del Val College with the installation of a high level
platform and passenger shelter. These new improvements have contributed towards enhanced security for
passengers using the station and helps in attracting more riders in the future.
Delaware Valley College falls below the economic threshold of 75 weekday boardings or 75 alightings. However, it is hoped that recent infrastructure
improvements and reduced travel times to Center City will attract more ridership.
Wister Station
This station is located on the Chestnut Hill East Line 0.9 miles from Wayne
Junction and 0.7 miles from Germantown. No off-street parking is available at Wister. The station area is also served by bus Route J, which connects with the Broad
Street Line at Logan Station. Current weekday ridership totals 67 boardings and 77 alightings. Investment has been made at Wister recently, including cleaning, new signage
and railings, repairs to staircases, painting and platform paving. These new improvements will improve the facility and security for passengers
currently using the station and help to attract more riders in the future.
61
Low Station Performance Overview
49th Street Station
This station is located on the Media / Elwyn Line 1.5 miles from University City
and 1.2 miles from Angora. 49th Street has no off-street parking. The station area is served by surface transit Route 13 offering direct service to
Center City. Current weekday ridership totals 59 boardings and 53 alightings. Investment has been made at 49th Street with the installation of accessible mini-
high level platforms. More recently, new staircases have been installed. These improvements will hopefully contribute towards enhanced security for
passengers using the station and will help to attract future riders.
49th Street falls below the economic threshold of 75 weekday boardings or 75 alightings. As a result, an adjustment to six peak trains was enacted in January, 2012 to bypass 49th Street. Hourly service was maintained. Excellent alternate service is available on Trolley Route 13.
On Saturdays there are 79 total trips and 67 total trips on Sundays. Eddystone Station
This station is located on the Marcus Hook / Wilmington Line 1.2 miles from
Crum Lynne and 1.1 miles from Chester Transportation Center. A small 12-space parking lot provides off street parking. The station area is also served by bus Route 37, which connects with the Broad
Street Line at Snyder Station. Current ridership totals 67 boardings and 61 alightings. Investment has been made recently at Eddystone with the installation of new
passenger shelters. These new improvements will improve the facility and security for passengers
currently using the station, and will help to attract more riders.
Eddystone falls below the economic threshold of 75 weekday boardings or 75 alightings. On weekends, there are 25 total trips on Saturdays and 19 total trips on Sundays. Due to the low weekend utilization, the close proximity of adjacent stations and the availability of alternate surface transit service, weekend service adjustments are under review.
62
Low Station Performance Overview
New Britain Station
This station is located on the Lansdale-Doylestown Line 1.8 miles from Chalfont and 1.3 miles from Del Val College.
New Britain has a small 39-space parking lot. The station area is not directly served by surface transit with Route 55 being the
closest route on Easton Road. Route 55 connects with the Broad Street Line at Olney Transportation Center.
Current ridership totals 52 boardings and 67 alightings. Investment has been made at New Britain with the installation of an accessible
high level platform and new passenger shelter. These new improvements have contributed towards enhanced security for
passengers using the station and will help to attract future riders. New Britain falls below the economic threshold of 75 weekday boardings or 75 alightings. Weekend ridership was also extremely
low and taking into account the close proximity of Del Val College Station, weekend service was recently suspended in December, 2011.
Link Belt Station
This station is located on the Lansdale / Doylestown Line 2.3 miles from Chalfont and 0.6 miles from Colmar.
Link Belt has no off-street parking. Ridership is primarily reverse peak comprised of workers destined to a nearby auto parts packaging plant.
Current ridership totals 37 boardings and 37 alightings. Investment has been made at Link Belt with the installation of an accessible high
level platform. These new improvements have contributed towards enhanced security for
passengers using the station and will help to attract future riders.
Link Belt falls below the economic threshold of 75 weekday boardings or 75 alightings. Link Belt ridership on weekends was extremely low and taking into account the close proximity of Colmar Station, weekend service was recently suspended in December, 2011.
63

Low Station Performance Overview
Eddington Station
This station is located on the Trenton Line 2.2 miles from Cornwells Heights and 1.6 miles from Croydon.
Eddington has no off-street parking. Ridership is primarily reverse peak comprised of workers destined to a nearby industrial park.
The station area is served by surface transit Route 133 which passes Cornwells Heights Station and connects with Route 66 in Morrell Park.
Current ridership totals 35 boardings and 54 alightings. No Investment has been made at Eddington. A PennDOT plan to rebuild the
Street Road interchange with Interstate Route I-95 will impact the station site. In addition, making the station ADA compliant will require track and signal adjustments on the Amtrak’s Northeast Corridor. These major cost considerations have impacted the planning for this station.
Eddington falls below the economic threshold of 75 weekday boardings or 75 alightings.
Weekend ridership is extremely low, 23 total trips on Saturday and 30 total trips on Sunday. Schedule adjustments are planned to reflect weekend utilization.
Angora Station
This station is located on the Media-Elwyn Line 1.0 mile from Fernwood-Yeadon and 1.2 miles from 49th Street.
Angora has no off-street parking. The station area is served by surface transit Route 34 offering direct service to
Center City. Current weekday ridership totals 25 boardings and 33 alightings. Investment has been made at Angora recently with staircases installed. These new staircases will hopefully contribute towards enhanced security for
passengers using the station and will help to attract future riders. Angora falls below the economic threshold of 75 weekday
boardings or 75 alightings. As a result, an adjustment to six peak trains was enacted in January, 2012 to bypass Angora. Hourly service was maintained. Excellent alternate service is available on Trolley Route 34. On Saturdays there are 47 total trips and 31 total trips on Sundays. A
service adjustment is being considered to match service to current utilization.
64

65
This page left intentionally blank