first-principles study of paraelectric and ferroelectric
TRANSCRIPT

PHYSICAL REVIEW B 95, 024112 (2017)
First-principles study of paraelectric and ferroelectric CsH2PO4 including dispersion forces:Stability and related vibrational, dielectric, and elastic properties
Benoit Van Troeye,1,* Michiel Jan van Setten,1 Matteo Giantomassi,1 Marc Torrent,2
Gian-Marco Rignanese,1 and Xavier Gonze1
1Institute for Condensed Matter and Nanosciences, European Theoretical Spectroscopy Facility, Universite catholique de Louvain,Chemin des etoiles 8, B-1348 Louvain-la-Neuve, Belgium
2CEA, DAM, DIF, F-91297 Arpajon, France(Received 25 October 2016; published 25 January 2017)
Using density functional theory (DFT) and density functional perturbation theory (DFPT), we investigate thestability and response functions of CsH2PO4, a ferroelectric material at low temperature. This material cannotbe described properly by the usual (semi)local approximations within DFT. The long-range e−-e− correlationneeds to be properly taken into account, using, for instance, Grimme’s DFT-D methods, as investigated in thiswork. We find that DFT-D3(BJ) performs the best for the members of the dihydrogenated alkali phosphatefamily (KH2PO4, RbH2PO4, CsH2PO4), leading to experimental lattice parameters reproduced with an averagedeviation of 0.5%. With these DFT-D methods, the structural, dielectric, vibrational, and mechanical propertiesof CsH2PO4 are globally in excellent agreement with the available experiments (<2% MAPE for Raman-activephonons). Our study suggests the possible existence of a new low-temperature phase of CsH2PO4, not yet reportedexperimentally. Finally, we report the implementation of DFT-D contributions to elastic constants within DFPT.
DOI: 10.1103/PhysRevB.95.024112
I. INTRODUCTION
In recent years, CsH2PO4 (CDP), a ferroelectric material,has received a renewed interest because of its possible useas solid electrolyte in fuel cells [1–3]. Indeed, its high-temperature cubic form has been shown to behave as asuperprotonic phase [4].
The CDP crystal, and its deuterated counterpart CsD2PO4
(DCDP), crystallize at low temperature into a P 21 ferroelectricphase. CDP and DCDP undergo a phase transition, accom-panied by an increase of symmetry, from the ferroelectricphase to a P 21/m paraelectric one at around 154.5 K and264 K respectively [5–8]. Because of these phase transitionsand associated ferroelectric and superprotonic properties, thestructural, electric, and dynamical properties of this materialare quite complex. Complementing the available experimentaldata with theoretical results is of particular interest for provinga better understanding of these materials.
Several theoretical studies have been performed previouslyon these compounds, most of them based on pairwise inter-atomic potentials [9,10]. From a density functional theory(DFT) point of view, the studies are quite recent [11,12].Some [11] pointed out that the local-density approximation(LDA) [13] is not able to properly describe CDP, predictingthe P 21/m phase to be more stable than the P 21 one at0 K, in contradiction with experiments. Similar problems areencountered when the exchange-correlation is approximatedby the Perdew-Burke-Ernzerhof (PBE) formulation [14] ofthe generalized-gradient approximation (GGA) [13]. GGA-PBE, indeed, correctly predicts the ferroelectric phase to beenergetically favorable to the paraelectric one, but it largelyoverestimates the lattice parameters (about 8%, as shownlater).
Interestingly, the breakdown of these commonly used(semi)local DFT exchange-correlation functionals has notbeen encountered for other hydrogen-based ferroelectrics suchas KH2PO4 [15] or NH4H2PO4 [16], for which experimentallattice parameters are reproduced within a few percent usingPBE. As discussed in the body of this paper, we suspect that,while the LDA failure can be attributed mainly to the incorrectdescription of hydrogen bonds, the one of PBE derives fromthe incorrect description of the long-range e−-e− correlation,which plays an important role in Cs-based compounds dueto the large polarizability of the Cs ion. This assumptionis supported by the inability of PBE to predict the correctstable phase of CsCl, CsBr, and CsI as shown by Zhanget al. [17]. The importance of the dispersion corrections wasalso highlighted in the case of CsH2SO4 [18] and for Cs-Csand Na-Cs alkali-metal dimers by Ferri et al. [19].
In consequence, special care needs to be taken when choos-ing the exchange-correlation and the role of the dispersioncorrections has to be examined carefully. Several techniqueshave been proposed in the recent years for the descriptionof long-range correlation, including vdW-DF [20,21], TS-vdW [22], MBD [23], or Grimme’s DFT-D methods [24–26].The performances of some of these techniques have alreadybeen investigated in the case of hydrogen bonds [27] revealingthat TS-vdW performs usually better in molecules (test setS22), while vdW-DF2 and DFT-D3 give similar precisionfor this test set. On the contrary, their performances forhydrogen-based crystals have not been yet systematicallyinvestigated to the best of our knowledge.
In this work, we chose to compare the performance ofthe DFT-D3 [25] and DFT-D3(BJ) [26] methods, motivatedin part by the implementation within density functionalperturbation theory (DFPT) of the DFT-D contributions tothe vibrational properties [28–32]. This formalism allowsfor the efficient computation of response function properties,including dielectric constants, Born effective charges, andphonon band structures, that would otherwise require the
2469-9950/2017/95(2)/024112(9) 024112-1 ©2017 American Physical Society

BENOIT VAN TROEYE et al. PHYSICAL REVIEW B 95, 024112 (2017)
use of supercells for describing the collective atomic motioncharacterized by wave vectors in the whole Brillouin zone,or a homogeneous electric field not compatible with periodicboundary conditions. We also extend this formalism to includethe DFT-D contributions to strain-related properties, e.g.,elastic constants, which were unavailable to our knowledgein DFPT up to now.
Thanks to these DFT-D corrections, we are able to properlyreproduce both the correct ground state of CDP and DCDPtogether with their vibrational properties. We also predict theelastic and piezoelectric constants of this material, as well asits spontaneous polarization using the Berry phase technique.
This paper is organized as follows: In Sec. II, the CDPcrystal structure and the computational methods are detailed.In Sec. III, the structural, dielectric, vibrational, and elasticproperties of both CDP and DCDP are presented as wellas their phase stability. We detail the theoretical derivationsof the dispersion contributions to the elastic constants in theAppendix and validate the correctness of the implementationwith respect to finite differences.
II. CRYSTAL STRUCTURE AND COMPUTATIONALMETHOD
All computations are performed with the ABINIT soft-ware [33–35]. The exchange-correlation energy is approxi-mated using the GGA-PBE functional. Dispersion correctionsobtained by DFT-D3 or DFT-D3(BJ) are also considered. Forthe sake of brevity, uncorrected GGA-PBE are denoted asPBE and the results with dispersion corrections by DFT-D3and DFT-D3(BJ) as PBE-D3 and PBE-D3(BJ), respectively.The cutoff radius for the coordination number, requiredfor the vdW corrections, is set to 105 A and only pairscontributing for more than 10−12 Ha are taken into account. Weuse ONCVPSP norm-conserving pseudopotentials [36] whichinclude multiple projectors to treat semicore and unboundstates. The corresponding average � gauge [37] is about0.3 meV. These pseudopotentials are presented in more detailsin the Supplemental Material [38].
The geometries of the CDP phases are relaxed until theforces are all smaller than 10−8 Ha/bohr. All other properties(i.e., interatomic force constants, elastic tensor, etc.) arecomputed at the relaxed lattice parameters. A plane-wavecutoff energy of 60 Ha and a 4 × 4 × 4 Monkhorst-Pack gridof k points [39] are found sufficient to obtain a precisionbetter than 0.5 mHa/atom on the total energy, 0.2% on thelattice parameters, and 1 cm−1 on the phonon frequencies atthe Brillouin-zone center. In all the computations, we use anenergy cutoff smearing of 0.5 Ha [40,41].
First-order response functions are computed within DFPT,including the contributions of DFT-D methods as discussedin Ref. [32] and in the Appendix of the present paper. For allthe previously mentioned properties, we neglect the effect ofzero-point motion.
CDP and DCDP crystallize at low temperature into a mon-oclinic structure (P 21 symmetry, Z = 2). The correspondingprimitive cell of CDP is depicted in Fig. 1. The b axisis chosen as the unique axis. The hydrogenated phosphategroups of a given CDP unit cell form hydrogen bonds withthose situated in the neighboring cells as shown in Fig. 1.
FIG. 1. Primitive cell of CDP (DCDP) crystal in (a) the ferro-electric phase (b) the paraelectric phase. The Cs, P, O, and H (D)atoms are represented in green, purple, red, and white, respectively.The two inequivalent hydrogen bonds (O-H–O)long and (O-H–O)short
are represented with dashed lines. These figures were generated withthe VESTA software [42].
However, these hydrogen bonds are inequivalent: the one madealong the c axis, denoted (O-H–O)long, is shorter than the onealong the b axis, denoted (O-H–O)short. At higher temperature,this ferroelectric crystal undergoes a phase transition to aP 21/m paraelectric phase (Z = 2), involving the motion ofthe hydrogen atom involved in (O-H–O)short into a medianposition between the O atoms. Apart from this displace-ment, the two phases are otherwise similar, as illustrated inFig. 1.
III. GROUND STATE
In this section, we report the computed geometry for boththe ferroelectric and the paraelectric phases of CDP. Thecomputed relaxed lattice parameters (a,b,c) for both phases aresummarized in Table I, alongside the corresponding availableexperimental data [8]. As we neglect the zero-point motion,the structure of DCDP is equivalent to the one of CDP. Asthe experimentally reported thermal expansion of CDP isextremely small [43], leading to changes of approximately−4 mA when the (experimental) lattice parameter b wasextrapolated to 0 K for the ferroelectric phase, we will neglectthermal expansion in the rest of the paper.
Previous ab initio calculations using LDA [11] did not findthe ferroelectric phase to be the most stable at low temper-ature in disagreement with experiments. This failure is not
024112-2

FIRST-PRINCIPLE STUDY OF PARAELECTRIC AND . . . PHYSICAL REVIEW B 95, 024112 (2017)
TABLE I. Lattice parameters of ferroelectric and paraelectricCDP computed with the different functionals, as well as theexperimental results from Frazer et al. [8].
a (A) b (A) c (A) β (◦)
Ferroelectric phasePBE 8.50 6.48 4.97 112.0PBE-D3 7.92 6.16 4.91 109.8PBE-D3(BJ) 7.98 6.36 4.91 109.0Exp.a 7.899 6.294 4.898 108.50
Paraelectric phase
PBE 8.18 6.61 4.97 110.0PBE-D3 7.84 6.15 4.90 109.3PBE-D3(BJ) 7.92 6.34 4.92 108.7Exp.b 7.899 6.325 4.890 108.29
a100 K, Ref. [8].b200 K, Ref. [8].
surprising, as on average LDA underperforms in the descrip-tion of hydrogen bonds [27]. In contrast, PBE correctly pre-dicts the ferroelectric phase to be more stable than the paraelec-tric one. However, the theoretical value of 8.50 A for the latticeparameter a overestimates the experimental value by more than8%. This is quite unexpected, given that no particular problemswere reported for other hydrogen-based ferroelectrics [15,16].Interestingly, in the case of CsHSO4 [18], which crystallizesat low temperature into a P 21/c structure (Z = 4), PBE alsoshows some failures. On the one hand, it strongly overesti-mates the experimental unit cell volume, and on the otherhand, it leads to lattice instabilities [44]. This problem wasovercome when vdW corrections were added to PBE or rPBE.Similarly, DFT-D2 vdW corrections were required to properlydescribe the ground state of Cs halogens starting from PBE[17].
When vdW corrections are included, we are able to reacha good agreement with the experiments in the case of CDP[3% maximum relative error for PBE-D3, even better withPBE-D3(BJ)]. In order to investigate further the correctnessof these DFT-D corrections in the case of hydrogen-basedferroelectrics, we compute the relaxed structures of KH2PO4
and RbH2PO4 for both the ferroelectric and the paraelectricphases and compare the predictions with experiments. Wefind that the average relative errors of PBE, PBE-D3, andPBE-D3(BJ) are 2.8%, 1.4%, and 0.5%, respectively. Thisindicates that PBE-D3 and PBE-D3(BJ) are able to describethese materials at least in terms of structures. One shouldmention, though, that the most marked effects were observedfor CDP, which contains highly polarizable Cs atoms. Moredetails can be found in the Supplemental Material. Sincethe PBE functional fails to predict the geometry of thesehydrogen-based ferroelectric materials, it was discarded forthe subsequent computations.
Concerning the (O-H–O) bonds, PBE-D3 and PBE-D3(BJ)give similar values for both the short and the long bond lengths(see Fig. 1), i.e., 2.49 A and 2.52 A for PBE-D3 and2.49 A and 2.535 A for PBE-D3(BJ). These values should becompared to the experimental bonds, i.e., 2.48 A and 2.54 A
[8]. In view of these results, PBE-D3(BJ) performs slightlybetter for these bond lengths.
A. Stability
In order to investigate the stability of the ferroelectric phaseof CDP (DCDP) compared to the paraelectric one, we have firstcomputed the energy difference per atom between these twophases �E = EP 21 − EP 21/m. For PBE-D3 and PBE-D3(BJ),the results are −3.1 and −2.9 meV/atom, respectively. Inagreement with the experiments, the ferroelectric phase isfound to be more stable than the paraelectric one.
However, this does not guarantee that the ferroelectric phaseis the global energy minimum. In order to consider also thedynamical stability, the phonon band structures have beencomputed for the ferroelectric phase of CDP with PBE-D3 andPBE-D3(BJ). In these calculations, we have used a 4 × 4 × 4and 2 × 2 × 2 phonon wave vector supporting mesh for theinterpolation technique described in Ref. [28]. The results arepresented in Fig. 2. The trends are similar for DCDP (notpresented).
Γ Y C Z D B A0 E0|Γ Z C E|Γ B A0
50
100
150
200
250
300Frequency [cm−1]
(a)
Γ Y C Z D B A0 E0|Γ Z C E|Γ B A-50
0
50
100
150
200
250
300Frequency [cm−1]
(b)
FIG. 2. Low-frequency phonon band structure of P 21 CDPcomputed with (a) PBE-D3 and (b) PBE-D3(BJ) as well as thecorresponding phonon density of states.
024112-3
BENOIT VAN TROEYE et al. PHYSICAL REVIEW B 95, 024112 (2017)
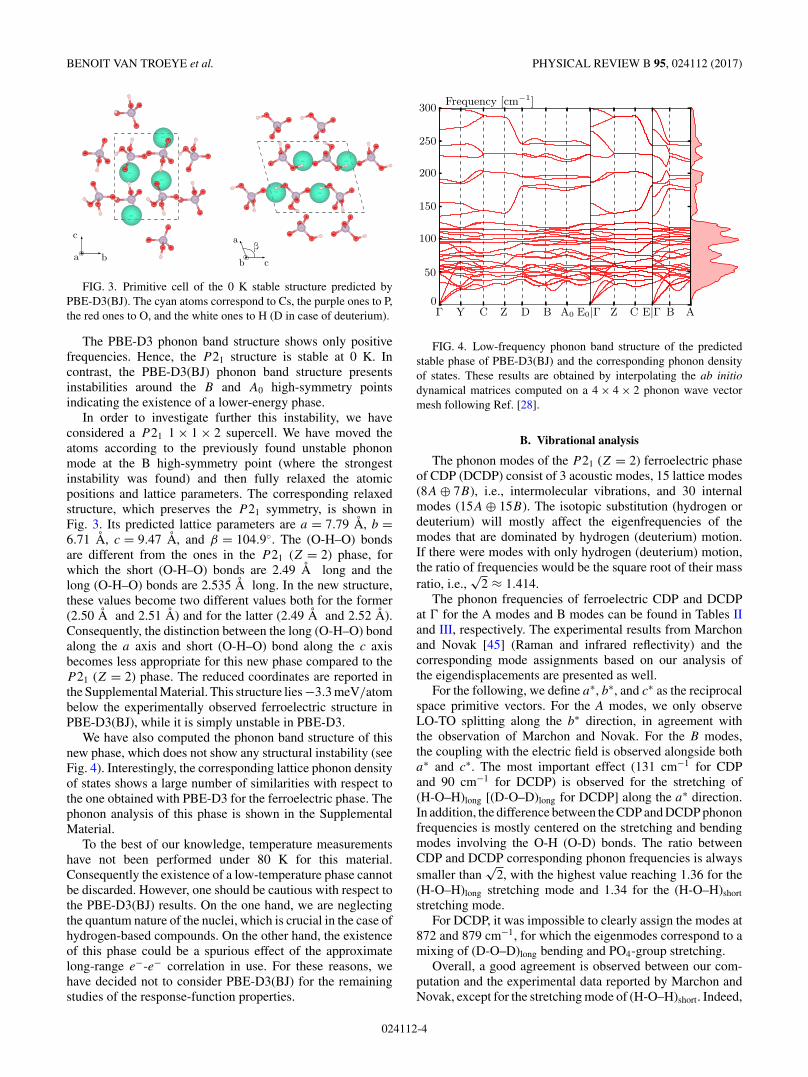
FIG. 3. Primitive cell of the 0 K stable structure predicted byPBE-D3(BJ). The cyan atoms correspond to Cs, the purple ones to P,the red ones to O, and the white ones to H (D in case of deuterium).
The PBE-D3 phonon band structure shows only positivefrequencies. Hence, the P 21 structure is stable at 0 K. Incontrast, the PBE-D3(BJ) phonon band structure presentsinstabilities around the B and A0 high-symmetry pointsindicating the existence of a lower-energy phase.
In order to investigate further this instability, we haveconsidered a P 21 1 × 1 × 2 supercell. We have moved theatoms according to the previously found unstable phononmode at the B high-symmetry point (where the strongestinstability was found) and then fully relaxed the atomicpositions and lattice parameters. The corresponding relaxedstructure, which preserves the P 21 symmetry, is shown inFig. 3. Its predicted lattice parameters are a = 7.79 A, b =6.71 A, c = 9.47 A, and β = 104.9◦. The (O-H–O) bondsare different from the ones in the P 21 (Z = 2) phase, forwhich the short (O-H–O) bonds are 2.49 A long and thelong (O-H–O) bonds are 2.535 A long. In the new structure,these values become two different values both for the former(2.50 A and 2.51 A) and for the latter (2.49 A and 2.52 A).Consequently, the distinction between the long (O-H–O) bondalong the a axis and short (O-H–O) bond along the c axisbecomes less appropriate for this new phase compared to theP 21 (Z = 2) phase. The reduced coordinates are reported inthe Supplemental Material. This structure lies −3.3 meV/atombelow the experimentally observed ferroelectric structure inPBE-D3(BJ), while it is simply unstable in PBE-D3.
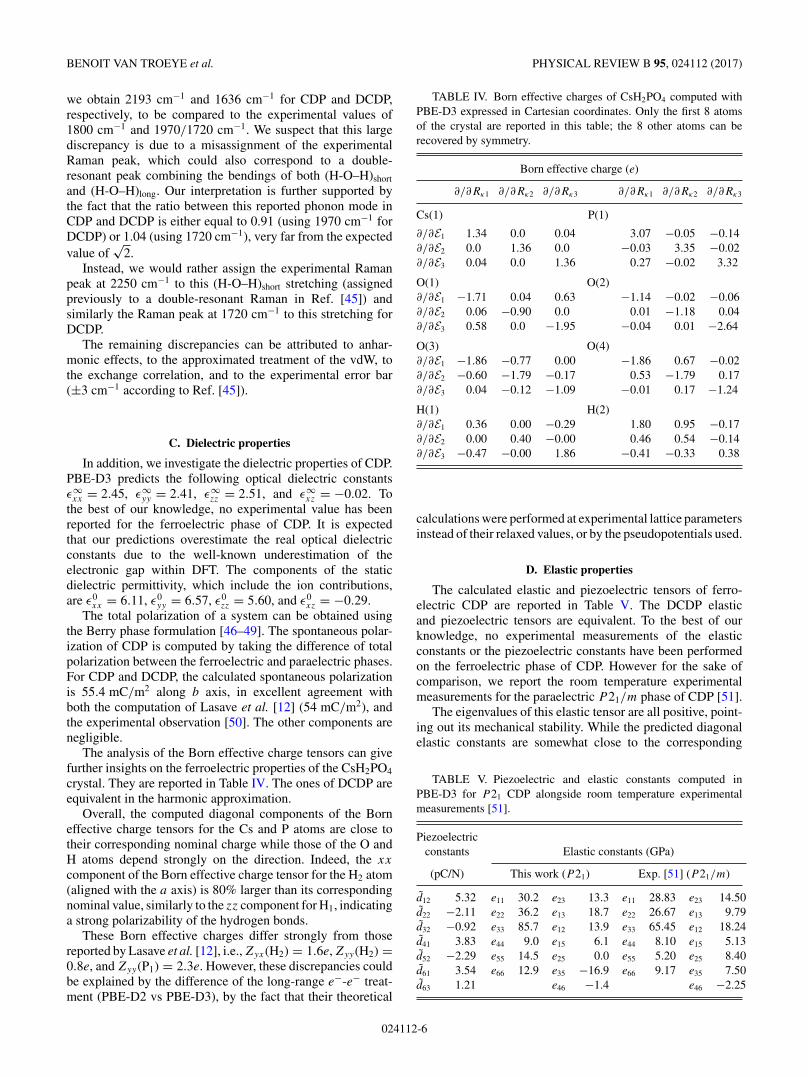
We have also computed the phonon band structure of thisnew phase, which does not show any structural instability (seeFig. 4). Interestingly, the corresponding lattice phonon densityof states shows a large number of similarities with respect tothe one obtained with PBE-D3 for the ferroelectric phase. Thephonon analysis of this phase is shown in the SupplementalMaterial.
To the best of our knowledge, temperature measurementshave not been performed under 80 K for this material.Consequently the existence of a low-temperature phase cannotbe discarded. However, one should be cautious with respect tothe PBE-D3(BJ) results. On the one hand, we are neglectingthe quantum nature of the nuclei, which is crucial in the case ofhydrogen-based compounds. On the other hand, the existenceof this phase could be a spurious effect of the approximatelong-range e−-e− correlation in use. For these reasons, wehave decided not to consider PBE-D3(BJ) for the remainingstudies of the response-function properties.
Γ Y C Z D B A0 E0|Γ Z C E|Γ B A0
50
100
150
200
250
300Frequency [cm−1]
FIG. 4. Low-frequency phonon band structure of the predictedstable phase of PBE-D3(BJ) and the corresponding phonon densityof states. These results are obtained by interpolating the ab initiodynamical matrices computed on a 4 × 4 × 2 phonon wave vectormesh following Ref. [28].
B. Vibrational analysis
The phonon modes of the P 21 (Z = 2) ferroelectric phaseof CDP (DCDP) consist of 3 acoustic modes, 15 lattice modes(8A ⊕ 7B), i.e., intermolecular vibrations, and 30 internalmodes (15A ⊕ 15B). The isotopic substitution (hydrogen ordeuterium) will mostly affect the eigenfrequencies of themodes that are dominated by hydrogen (deuterium) motion.If there were modes with only hydrogen (deuterium) motion,the ratio of frequencies would be the square root of their massratio, i.e.,
√2 ≈ 1.414.
The phonon frequencies of ferroelectric CDP and DCDPat � for the A modes and B modes can be found in Tables IIand III, respectively. The experimental results from Marchonand Novak [45] (Raman and infrared reflectivity) and thecorresponding mode assignments based on our analysis ofthe eigendisplacements are presented as well.
For the following, we define a∗, b∗, and c∗ as the reciprocalspace primitive vectors. For the A modes, we only observeLO-TO splitting along the b∗ direction, in agreement withthe observation of Marchon and Novak. For the B modes,the coupling with the electric field is observed alongside botha∗ and c∗. The most important effect (131 cm−1 for CDPand 90 cm−1 for DCDP) is observed for the stretching of(H-O–H)long [(D-O–D)long for DCDP] along the a∗ direction.In addition, the difference between the CDP and DCDP phononfrequencies is mostly centered on the stretching and bendingmodes involving the O-H (O-D) bonds. The ratio betweenCDP and DCDP corresponding phonon frequencies is alwayssmaller than
√2, with the highest value reaching 1.36 for the
(H-O–H)long stretching mode and 1.34 for the (H-O–H)short
stretching mode.For DCDP, it was impossible to clearly assign the modes at
872 and 879 cm−1, for which the eigenmodes correspond to amixing of (D-O–D)long bending and PO4-group stretching.
Overall, a good agreement is observed between our com-putation and the experimental data reported by Marchon andNovak, except for the stretching mode of (H-O–H)short. Indeed,
024112-4

FIRST-PRINCIPLE STUDY OF PARAELECTRIC AND . . . PHYSICAL REVIEW B 95, 024112 (2017)
TABLE II. Zone-center phonon modes of A symmetry computed with PBE-D3 for ferroelectric CDP and DCDP. The LO-TO splittingof A modes in only observed in the b∗ direction. Experimental Raman measurements are also reported [45]. Question marks refer tounavailable/undetected phonon modes. Two experimental values separated by a slash sign indicate an uncertainty on the experimentalassignment.
CDP DCDP
A modes (TO-LO) (cm−1) Assignment A modes (TO-LO) (cm−1) Assignment
This work Exp.a This work Exp.a
47 46 Latt. 47 45 Latt.58 54 Latt. 58 54 Latt.
64-66 74 Latt. 64-66 74 Latt.78 79 Latt. 77 79 Latt.
82-85 ? Latt. 81-85 ? Latt.105-113 ? Latt. 104-112 ? Latt.127-131 122-130 Latt. 126-131 122-122 Latt.232-257 205-249 Latt. 226-251 215-238 Latt.
348 365-? Rot. PO4 342 360-362 Rot. PO4
376-379 388-392 Stretch. PO4 372-375 385-388 Stretch. PO4
458-488 470-505 Stretch. PO4 453-481 480-505 Stretch. PO4
525 543 Stretch. PO4 518 533 Stretch. PO4
547-548 563 Stretch. PO4 532-533 542 Stretch. PO4
885-888 910b Stretch. PO4 637-639 628b Bend. (H-O–H)long
891-900 869-880 Bend. (H-O–H)long 727-737 702b Bend. (H-O–H)short
923-951 921 Stretch. PO4 872 ?/881 Mixed979-1010 993-1051 Stretch. PO4 879 881/? Mixed1017-1038 ?-981 Bend. (H-O–H)short 910-948 955-970 Bend. (H-O–H)short
1112-1121 1134-1142 Stretch. PO4 938-982 918-933 Stretch. PO4
1209-1210 1219-1221 Bend. (H-O–H)long 977-1024 1011-1061 Stretch. PO4
1278-1284 1256-1264 Bend. (H-O–H)short 1118-1126 1155-1165 Stretch. PO4
2193-2227 1800 Stretch. (H-O–H)short 1636-1652 1970/1720 Stretch. (H-O–H)short
2731 2680 Stretch. (H-O–H)long 2009 2090 Stretch. (H-O–H)long
aExperimental Raman 80 K data from Ref. [45].bExperimental infrared reflectivity 80 K data from Ref. [45].
TABLE III. Zone-center phonon modes of B symmetry computed with PBE-D3 for ferroelectric CDP and DCDP.
CDP DCDP
B modes (cm−1) Assignment B modes (cm−1) Assignment
TO LO(a∗) LO(c∗) TO LO(a∗) LO(c∗)50 51 51 Latt. 50 50 50 Latt.75 75 75 Latt. 75 75 75 Latt.81 84 82 Latt. 81 84 82 Latt.91 105 105 Latt. 91 104 104 Latt.113 116 116 Latt. 113 115 116 Latt.143 143 148 Latt. 141 142 146 Latt.224 230 230 Latt. 221 228 228 Latt.376 377 377 Stretch. PO4 368 369 369 Stretch. PO4
424 432 431 Stretch. PO4 419 425 425 Stretch. PO4
478 487 483 Stretch. PO4 466 477 472 Stretch. PO4
504 532 527 Stretch. PO4 494 519 518 Stretch. PO4
543 544 543 Stretch. PO4 533 537 535 Stretch. PO4
864 865 865 Stretch. PO4 639 639 639 Bend. (H-O–H)long
891 891 891 Bend. (H-O–H)long 754 756 758 Bend. (H-O–H)short
920 955 942 Stretch. PO4 846 848 847 Stretch. PO4
1040 1044 1040 Stretch. PO4 873 879 876 Bend. (H-O–H)long
1050 1051 1052 Bend. (H-O–H)short 911 942 932 Stretch. PO4
1101 1112 1137 Stretch. PO4 982 984 982 Bend. (H-O–H)short
1201 1215 1216 Bend. (H-O–H)long 1041 1047 1042 Stretch. PO4
1325 1326 1327 Bend. (H-O–H)short 1099 1123 1146 Stretch. PO4
2345 2476 2448 Stretch. (H-O–H)short 1729 1819 1797 Stretch. (H-O–H)short
2725 2735 2726 Stretch. (H-O–H)long 1997 2004 1998 Stretch. (H-O–H)long
024112-5
BENOIT VAN TROEYE et al. PHYSICAL REVIEW B 95, 024112 (2017)
we obtain 2193 cm−1 and 1636 cm−1 for CDP and DCDP,respectively, to be compared to the experimental values of1800 cm−1 and 1970/1720 cm−1. We suspect that this largediscrepancy is due to a misassignment of the experimentalRaman peak, which could also correspond to a double-resonant peak combining the bendings of both (H-O–H)short
and (H-O–H)long. Our interpretation is further supported bythe fact that the ratio between this reported phonon mode inCDP and DCDP is either equal to 0.91 (using 1970 cm−1 forDCDP) or 1.04 (using 1720 cm−1), very far from the expectedvalue of
√2.
Instead, we would rather assign the experimental Ramanpeak at 2250 cm−1 to this (H-O–H)short stretching (assignedpreviously to a double-resonant Raman in Ref. [45]) andsimilarly the Raman peak at 1720 cm−1 to this stretching forDCDP.
The remaining discrepancies can be attributed to anhar-monic effects, to the approximated treatment of the vdW, tothe exchange correlation, and to the experimental error bar(±3 cm−1 according to Ref. [45]).
C. Dielectric properties
In addition, we investigate the dielectric properties of CDP.PBE-D3 predicts the following optical dielectric constantsε∞xx = 2.45, ε∞
yy = 2.41, ε∞zz = 2.51, and ε∞
xz = −0.02. Tothe best of our knowledge, no experimental value has beenreported for the ferroelectric phase of CDP. It is expectedthat our predictions overestimate the real optical dielectricconstants due to the well-known underestimation of theelectronic gap within DFT. The components of the staticdielectric permittivity, which include the ion contributions,are ε0
xx = 6.11, ε0yy = 6.57, ε0
zz = 5.60, and ε0xz = −0.29.
The total polarization of a system can be obtained usingthe Berry phase formulation [46–49]. The spontaneous polar-ization of CDP is computed by taking the difference of totalpolarization between the ferroelectric and paraelectric phases.For CDP and DCDP, the calculated spontaneous polarizationis 55.4 mC/m2 along b axis, in excellent agreement withboth the computation of Lasave et al. [12] (54 mC/m2), andthe experimental observation [50]. The other components arenegligible.
The analysis of the Born effective charge tensors can givefurther insights on the ferroelectric properties of the CsH2PO4
crystal. They are reported in Table IV. The ones of DCDP areequivalent in the harmonic approximation.
Overall, the computed diagonal components of the Borneffective charge tensors for the Cs and P atoms are close totheir corresponding nominal charge while those of the O andH atoms depend strongly on the direction. Indeed, the xx
component of the Born effective charge tensor for the H2 atom(aligned with the a axis) is 80% larger than its correspondingnominal value, similarly to the zz component for H1, indicatinga strong polarizability of the hydrogen bonds.
These Born effective charges differ strongly from thosereported by Lasave et al. [12], i.e., Zyx(H2) = 1.6e, Zyy(H2) =0.8e, and Zyy(P1) = 2.3e. However, these discrepancies couldbe explained by the difference of the long-range e−-e− treat-ment (PBE-D2 vs PBE-D3), by the fact that their theoretical
TABLE IV. Born effective charges of CsH2PO4 computed withPBE-D3 expressed in Cartesian coordinates. Only the first 8 atomsof the crystal are reported in this table; the 8 other atoms can berecovered by symmetry.
Born effective charge (e)
∂/∂Rκ1 ∂/∂Rκ2 ∂/∂Rκ3 ∂/∂Rκ1 ∂/∂Rκ2 ∂/∂Rκ3
Cs(1) P(1)
∂/∂E1 1.34 0.0 0.04 3.07 −0.05 −0.14∂/∂E2 0.0 1.36 0.0 −0.03 3.35 −0.02∂/∂E3 0.04 0.0 1.36 0.27 −0.02 3.32
O(1) O(2)∂/∂E1 −1.71 0.04 0.63 −1.14 −0.02 −0.06∂/∂E2 0.06 −0.90 0.0 0.01 −1.18 0.04∂/∂E3 0.58 0.0 −1.95 −0.04 0.01 −2.64
O(3) O(4)∂/∂E1 −1.86 −0.77 0.00 −1.86 0.67 −0.02∂/∂E2 −0.60 −1.79 −0.17 0.53 −1.79 0.17∂/∂E3 0.04 −0.12 −1.09 −0.01 0.17 −1.24
H(1) H(2)∂/∂E1 0.36 0.00 −0.29 1.80 0.95 −0.17∂/∂E2 0.00 0.40 −0.00 0.46 0.54 −0.14∂/∂E3 −0.47 −0.00 1.86 −0.41 −0.33 0.38
calculations were performed at experimental lattice parametersinstead of their relaxed values, or by the pseudopotentials used.
D. Elastic properties
The calculated elastic and piezoelectric tensors of ferro-electric CDP are reported in Table V. The DCDP elasticand piezoelectric tensors are equivalent. To the best of ourknowledge, no experimental measurements of the elasticconstants or the piezoelectric constants have been performedon the ferroelectric phase of CDP. However for the sake ofcomparison, we report the room temperature experimentalmeasurements for the paraelectric P 21/m phase of CDP [51].
The eigenvalues of this elastic tensor are all positive, point-ing out its mechanical stability. While the predicted diagonalelastic constants are somewhat close to the corresponding
TABLE V. Piezoelectric and elastic constants computed inPBE-D3 for P 21 CDP alongside room temperature experimentalmeasurements [51].
Piezoelectricconstants Elastic constants (GPa)
(pC/N) This work (P 21) Exp. [51] (P 21/m)
d12 5.32 e11 30.2 e23 13.3 e11 28.83 e23 14.50d22 −2.11 e22 36.2 e13 18.7 e22 26.67 e13 9.79d32 −0.92 e33 85.7 e12 13.9 e33 65.45 e12 18.24d41 3.83 e44 9.0 e15 6.1 e44 8.10 e15 5.13d52 −2.29 e55 14.5 e25 0.0 e55 5.20 e25 8.40d61 3.54 e66 12.9 e35 −16.9 e66 9.17 e35 7.50d63 1.21 e46 −1.4 e46 −2.25
024112-6
FIRST-PRINCIPLE STUDY OF PARAELECTRIC AND . . . PHYSICAL REVIEW B 95, 024112 (2017)
room temperature values, the off-diagonal elastic constantsdiverge more from these experimental measurements, espe-cially e25 and e35. Most of the discrepancies may be explainedby temperature effects close to room temperature, which seemparticularly important for this material [52], as well as bythe phase transition that occurs at 154.5 K. Concerning thepredicted piezoelectric coefficients, they are comparable inmagnitude to the ones of ZnO [31], and are approximativelyone to two orders of magnitude smaller than the ones predictedfor rhombohedral BaTiO3 [31].
IV. CONCLUSION
In this work, we have investigated in depth the structural,vibrational, mechanical, and dielectric properties of CDP inboth its ferroelectric and paraelectric phases. We find thatthe use of vdW corrections, included in this work throughGrimme’s DFT-D methods, is important to describe properlythe geometry of hydrogen-based ferroelectrics, i.e., KH2PO4,RbH2PO4, and CsH2PO4. Our stability studies point out thepossible existence of a P 21 (Z = 4) phase at low tempera-ture, yet unreported experimentally or theoretically. Phononfrequencies for the CDP ferroelectric phase are compared totheir respective experimental ones. On average, an excellentagreement is obtained for both the lattice and high-frequencymodes which are dominated by hydrogen motions. We predictthe B phonon frequencies for this phase as well as the dielectric,piezoelectric, and elastic constants for this ferroelectric phase.This work sheds light on the stability of CDP. We also report theimplementation of the DFT-D contributions to elastic constantsinside the ABINIT software.
ACKNOWLEDGMENTS
The authors acknowledge technical help from J.-M.Beuken and scientific discussions with Ya. Shchur. Thiswork was supported by the FRS-FNRS through a FRIAgrant (B.V.T.) and the Communaute francaise de Belgiquethrough the BATTAB project (ARC 14/19-057). Computa-tional resources have been provided by the supercomputing
facilities of the Universite catholique de Louvain(CISM/UCLouvain) and the Consortium des Equipementsde Calcul Intensif en Federation Wallonie Bruxelles (CECI)funded by the Fonds de la Recherche Scientifique de Belgique(FRS-FNRS) under convention 2.5020.11. The present re-search benefited from computational resources made availableon the Tier-1 supercomputer of the Federation Wallonie-Bruxelles (Belgium), infrastructure funded by the WalloonRegion under Grant Agreement No. 1117545.
APPENDIX: DFT-D CONTRIBUTION TO ELASTICCONSTANTS
The DFT-D methods introduce a pairwise correction E(2)disp,
independent of the density, that is added to the DFT energyto mimic the vdW interactions. In contrast with the derivationof the interatomic force constants, presented in a previouspaper [32], no dependency with respect to the cell index isinvolved in the derivation of elastic constants. In consequence,the κ index refers to the collection of all atoms which arereplicas from atom i in the reference cell in contrast to thenotations of Ref. [32].
For strain response properties, it is easier to work with theenergy per undeformed unit cell volume �0, Evol defined as
Evol(Rκμ,εαβ) = Ecell
�0(A1)
with Rκμ an atomic displacement and εαβ a strain. Whenan electric field is applied, the quantity which has to beminimized is no more this volumetric energy, but the electricalenthalpy [31]. However, as the DFT-D methods do not adddirect contributions to electric response properties (the changeis only indirect, through the change of lattice parameters orinteratomic force constants), we will limit ourselves to thevolumetric energy. The minimization of Eq. (A1) gives thenthe ground-state geometry.
The denomination “elastic tensor” eαβ,γ δ computed inDFPT is usually used to refer to the full second derivativeof the volumetric energy with respect to strains:
eαβ,γ δ = d2Evol
dεαβdεγ δ
=
clamped-ion elastic tensor eαβγ δ︷ ︸︸ ︷∂2Evol
∂εαβ∂εγ δ
+2∑κμ
∂2Evol
∂Rκμ∂εαβ
∂Rκμ
∂εγ δ
+∑
κμ,κ ′ν
∂2Evol
∂Rκμ∂Rκ ′ν
∂Rκμ
∂εαβ
∂Rκ ′ν
∂εγ δ︸ ︷︷ ︸internal relaxation contribution eαβγ δ
. (A2)
The internal-relaxation contributions to the elastic tensorcan be expressed as [31]
eαβ,γ δ = − 1
�0
∑κμ,κ ′ν
κμ,αβ(C−1)κμ,κ ′ν κ ′ν,γ δ, (A3)
where (C−1)κμ,κ ′ν is the pseudoinverse of Cκμ,κ ′ν—the inter-atomic force constants in reciprocal space at zone center—and
κμ,αβ the internal strain coupling parameter, defined as
κμ,αβ = −�0∂2Evol
∂Rκμ∂εαβ
. (A4)
The usual DFT derivation of the previously introducedquantities (clamped-ion elastic tensor, internal strain couplingparameters, etc.) can be found elsewhere [30,31,53]. For theDFT-D contributions, one can show that a strain derivative of
024112-7
BENOIT VAN TROEYE et al. PHYSICAL REVIEW B 95, 024112 (2017)
any pairwise function g(RAB) can be expressed as
∂
∂εαβ
[g(RAB)] =∑
κ
Rκβ
∂
∂Rκα
[g(RAB)]. (A5)
As a consequence, the DFT-D contribution to the clamped-ionelastic tensor is given by
edispαβ,γ δ = 1
�0
[∑κ
∑κ ′
∂2E(2)disp
∂Rκα∂Rκ ′γRκβRκ ′δ
+∑
κ
∂E(2)disp
∂Rκα
Rκδδβγ
](A6)
and its contribution to the internal strain coupling parametersby
dispκμ,αβ = −
∑κ ′
∂2E(2)disp
∂Rκμ∂Rκ ′αRκ ′β. (A7)
Note however that this DFPT elastic tensor can differ from the“real” elastic tensor [53], defined as
erealαβ,γ δ = ∂σαβ
∂εγ δ
= 1
�
∂2Ecell
∂εαβ∂εγ δ
− δγ δσαβ, (A8)
in the case in which the elastic tensor is computed away fromthe relaxed lattice parameters. In this last expression, � refersto the current volume of the primitive cell and σαβ to the stresstensor.
In DFT-D3, it is also possible to include a 3-body term (seefor example Ref. [25]). However, its contribution will be ne-glected in this work for the same reason as exposed in Ref. [32].
The implementation of the elastic constants and internalstrain coupling parameters inside the ABINIT software [33–35]completes the implementation of the DFT-D methods for first-order response functions. This implementation has been vali-dated with respect to finite differences on distorted graphite:
TABLE VI. Validation of our implementation by comparisonof the dispersion contribution to clamped-ion elastic tensor andinternal strain coupling parameters (Cartesian coordinates) in DFT-D3 computed by finite differences and by DFPT for distorted graphite.
Fin. diff. DFT-D DFPT DFT-De
dispαβγ δ (μHa/bohr3) e
dispαβγ δ (μHa/bohr3)
edisp33,33 − 10.59219749 − 10.59219750
edisp12,33 39.257112699 39.257111270
edisp12,12 278.50914204 278.50914508
Fin. diff. DFT-D DFPT DFT-D
dispκμ,αβ (μHa/bohr)
dispκμ,αβ (μHa/bohr)
disp13,33 10.058846720 10.058842459
disp13,12 − 0.488955908 − 0.488955065
AB stacking, one atom moved by 10−5 in reduced coordinates,relaxed DFT-D3 in-plane and out-of-plane lattice parameters,i.e., 2.46 A and 6.96 A, the unique axis distorted by 5◦.The PBE functional was used for this validation. For thefinite-difference calculations, we used a first-order techniqueon the forces/stresses to get the clamped-ion and relaxed-iontensors. Relative atomic displacements of 10−7 for the relatedderivatives and a lattice change of 5 × 10⁻⁵% for the strainderivatives were used.
Table VI shows the comparison between finite differencesand DFPT for the DFT-D3 contributions to the clamped-ionelastic tensor and internal strain coupling parameters [54].The agreement between finite difference and DFPT reachesup to 5 digits, thus validating the DFPT equations presentedin this work. The implementation of the internal relaxationcontribution to the elastic constants and of the dispersioncontribution to the interatomic force constants have alreadybeen discussed elsewhere [31,32].
[1] S. M. Haile, C. R. I. Chisholm, K. Sasaki, D. A. Boysen, and T.Uda, Faraday Discuss. 134, 17 (2007).
[2] G. Qing, R. Kikuchi, A. Takagaki, T. Sugawara, and S. T. Oyama,Electrochim. Acta 169, 219 (2015).
[3] G. Qing, R. Kikuchi, A. Takagaki, T. Sugawara, and S. T. Oyama,J. Electrochem. Soc. 161, F451 (2014).
[4] G. Kim, J. M. Griffin, F. Blanc, S. M. Haile, and C. P. Grey, J.Am. Chem. Soc. 137, 3867 (2015).
[5] A. Levstik, R. Blinc, P. Kadaba, S. Cizikov, I. Levstik, and C.Filipic, Solid State Commun. 16, 1339 (1975).
[6] H. Matsunaga, K. Itoh, and E. Nakamura, J. Phys. Soc. Jpn. 48,2011 (1980).
[7] K. Itoh, T. Hagiwara, and E. Nakamura, J. Phys. Soc. Jpn. 52,2626 (1983).
[8] B. C. Frazer, D. Semmingsen, W. D. Ellenson, and G. Shirane,Phys. Rev. B 20, 2745 (1979).
[9] Y. I. Shchur, R. Levitskii, O. Vlokh, A. Kityk, Y.Vysochansky, and A. Grabar, Condens. Matter Phys. 2, 93(1999).
[10] Y. Shchur, Phys. Rev. B 74, 054301 (2006).[11] Y. Shchur, T. Bryk, I. Klevets, and A. Kityk, Comput. Mater.
Sci. 111, 301 (2016).[12] J. Lasave, P. Abufager, and S. Koval, Phys. Rev. B 93, 134112
(2016).[13] R. Martin, Electronic Structure: Basic Theory and Practical
Methods (Cambridge University Press, Cambridge, 2004).[14] M. Fuchs and M. Scheffler, Comput. Phys. Commun. 119, 67
(1999).[15] Q. Zhang, F. Chen, N. Kioussis, S. G. Demos, and H. B.
Radousky, Phys. Rev. B 65, 024108 (2001).[16] J. Lasave, S. Koval, N. S. Dalal, and R. L. Migoni, Phys. Rev.
Lett. 98, 267601 (2007).[17] F. Zhang, J. D. Gale, B. P. Uberuaga, C. R. Stanek, and N. A.
Marks, Phys. Rev. B 88, 054112 (2013).[18] M. Krzystyniak, K. Druzbicki, and F. Fernandez-Alonso, Phys.
Chem. Chem. Phys. 17, 31287 (2015).[19] N. Ferri, R. A. DiStasio, A. Ambrosetti, R. Car, and A.
Tkatchenko, Phys. Rev. Lett. 114, 176802 (2015).
024112-8

FIRST-PRINCIPLE STUDY OF PARAELECTRIC AND . . . PHYSICAL REVIEW B 95, 024112 (2017)
[20] M. Dion, H. Rydberg, E. Schroder, D. C. Langreth, and B. I.Lundqvist, Phys. Rev. Lett. 92, 246401 (2004).
[21] K. Lee, E. D. Murray, L. Kong, B. I. Lundqvist, and D. C.Langreth, Phys. Rev. B 82, 081101 (2010).
[22] A. Tkatchenko and M. Scheffler, Phys. Rev. Lett. 102, 073005(2009).
[23] A. M. Reilly and A. Tkatchenko, J. Chem. Phys. 139, 024705(2013).
[24] S. Grimme, J. Comput. Chem. 27, 1787 (2006).[25] S. Grimme, J. Anthony, S. Ehrlich, and H. Krieg, J. Chem. Phys.
132, 154104 (2010).[26] S. Grimme, S. Ehrlich, and L. Goerigk, J. Comput. Chem. 32,
1456 (2010).[27] N. Marom, A. Tkatchenko, M. Rossi, V. V. Gobre, O. Hod, M.
Scheffler, and L. Kronik, J. Chem. Theory Comput. 7, 3944(2011).
[28] X. Gonze, Phys. Rev. B 55, 10337 (1997).[29] X. Gonze and C. Lee, Phys. Rev. B 55, 10355 (1997).[30] D. R. Hamann, K. M. Rabe, and D. Vanderbilt, Phys. Rev. B 72,
033102 (2005).[31] X. Wu, D. Vanderbilt, and D. R. Hamann, Phys. Rev. B 72,
035105 (2005).[32] B. Van Troeye, M. Torrent, and X. Gonze, Phys. Rev. B 93,
144304 (2016).[33] X. Gonze, G.-M. Rignanese, M. Verstraete, J.-M. Beuken, Y.
Pouillon, R. Caracas, F. Jollet, M. Torrent, G. Zerah, M. Mikami,P. Ghosez, M. Veithen, J.-Y. Raty, V. Olevano, F. Bruneval, L.Reining, R. Godby, G. Onida, D. R. Hamann, and D. C. Allan,Z. Kristallogr. 220, 558 (2005).
[34] X. Gonze, B. Amadon, P.-M. Anglade, J.-M. Beuken, F. Bottind,P. Boulanger, F. Bruneval, D. Caliste, R. Caracas, M. Cote,T. Deutsch, L. Genovese, P. Ghosez, M. Giantomassi, S.Goedecker, D. Hamann, P. Hermet, F. Jollet, G. Jomard, S.Leroux, M. Mancini, S. Mazevet, M. Oliveira, G. Onida, Y.Pouillon, T. Rangela, G.-M. Rignanese, D. Sangalli, R. Shaltaf,M. Torrent, M. Verstraete, G. Zerah, and J. Zwanziger, Comput.Phys. Commun. 180, 2582 (2009).
[35] X. Gonze, F. Jollet, F. A. Araujo, D. Adams, B. Amadon,T. Applencourt, C. Audouze, J.-M. Beuken, J. Bieder, A.Bokhanchuk, E. Bousquet, F. Bruneval, D. Caliste, M. Cote, F.Dahm, F. D. Pieve, M. Delaveau, M. D. Gennaro, B. Dorado, C.Espejo, G. Geneste, L. Genovese, A. Gerossier, M. Giantomassi,Y. Gillet, D. Hamann, L. He, G. Jomard, J. L. Janssen, S. L.Roux, A. Levitt, A. Lherbier, F. Liu, I. Lukacevic, A. Martin,C. Martins, M. Oliveira, S. Ponce, Y. Pouillon, T. Rangel,G.-M. Rignanese, A. Romero, B. Rousseau, O. Rubel, A.Shukri, M. Stankovski, M. Torrent, M. V. Setten, B. V.Troeye, M. Verstraete, D. Waroquiers, J. Wiktor, B. Xu, A.Zhou, and J. Zwanziger, Comput. Phys. Commun. 205, 106(2016).
[36] D. R. Hamann, Phys. Rev. B 88, 085117 (2013).[37] K. Lejaeghere, G. Bihlmayer, T. Bjorkman, P. Blaha, S. Blugel,
V. Blum, D. Caliste, I. E. Castelli, S. J. Clark, A. Dal Corso,S. de Gironcoli, T. Deutsch, J. K. Dewhurst, I. Di Marco, C.Draxl, M. Dułak, O. Eriksson, J. A. Flores-Livas, K. F. Garrity,L. Genovese, P. Giannozzi, M. Giantomassi, S. Goedecker, X.Gonze, O. Granas, E. K. U. Gross, A. Gulans, F. Gygi, D.R. Hamann, P. J. Hasnip, N. A. W. Holzwarth, D. Iusan, D.B. Jochym, F. Jollet, D. Jones, G. Kresse, K. Koepernik, E.Kucukbenli, Y. O. Kvashnin, I. L. M. Locht, S. Lubeck, M.Marsman, N. Marzari, U. Nitzsche, L. Nordstrom, T. Ozaki,L. Paulatto, C. J. Pickard, W. Poelmans, M. I. J. Probert, K.Refson, M. Richter, G.-M. Rignanese, S. Saha, M. Scheffler,M. Schlipf, K. Schwarz, S. Sharma, F. Tavazza, P. Thunstrom,A. Tkatchenko, M. Torrent, D. Vanderbilt, M. J. van Setten, V.Van Speybroeck, J. M. Wills, J. R. Yates, G.-X. Zhang, and S.Cottenier, Science 351, 1415 (2016).
[38] See Supplemental Material at http://link.aps.org/supplemental/10.1103/PhysRevB.95.024112 for additional information aboutthe pseudopotentials, lattice parameters of the studied hydrogen-based ferroelectrics, reduced coordinates of the P 21 (Z = 2) andP 21 (Z = 4) phases, as well as the phonon frequencies of theP 21 (Z = 4) phase.
[39] H. J. Monkhorst and J. D. Pack, Phys. Rev. B 13, 5188 (1976).[40] M. Bernasconi, G. Chiarotti, P. Focher, S. S. E. Tosatti, and M.
Parrinello, J. Phys. Chem. Solids 56, 501 (1995).[41] J. Laflamme Janssen, Y. Gillet, S. Ponce, A. Martin, M. Torrent,
and X. Gonze, Phys. Rev. B 93, 205147 (2016).[42] K. Momma and F. Izumi, J. Appl. Crystallogr. 44, 1272 (2011).[43] E. Nakamura, K. Abe, and K. Deguchi, J. Phys. Soc. Jpn. 53,
1614 (1984).[44] See Supplementary Material of Ref. [18].[45] B. Marchon and A. Novak, J. Chem. Phys. 78, 2105 (1983).[46] R. D. King-Smith and D. Vanderbilt, Phys. Rev. B 47, 1651
(1993).[47] D. Vanderbilt and R. D. King-Smith, Phys. Rev. B 48, 4442
(1993).[48] I. Souza, J. Iniguez, and D. Vanderbilt, Phys. Rev. Lett. 89,
117602 (2002).[49] R. W. Nunes and X. Gonze, Phys. Rev. B 63, 155107 (2001).[50] K. Deguchi, E. Okaue, and E. Nakamura, J. Phys. Soc. Jpn. 51,
3569 (1982).[51] S. Prawer, T. Smith, and T. Finlayson, Aust. J. Phys. 38, 63
(1985).[52] Y. Luspin, Y. Vaills, and G. Hauret, J. Phys. I (France) 7, 785
(1997).[53] D. R. Hamann, X. Wu, K. M. Rabe, and D. Vanderbilt, Phys.
Rev. B 71, 035117 (2005).[54] The comparison is made using the DFPT expressions for the
elastic tensors as defined previously in this work.
024112-9